
Effect of Polystyrene Synthesis Method on Water Sorption and Glass Transition
 , ,
, ,
Abstract
:1. Introduction
2. Materials and Methods
2.1. Materials
2.2. Water Sorption Measurements
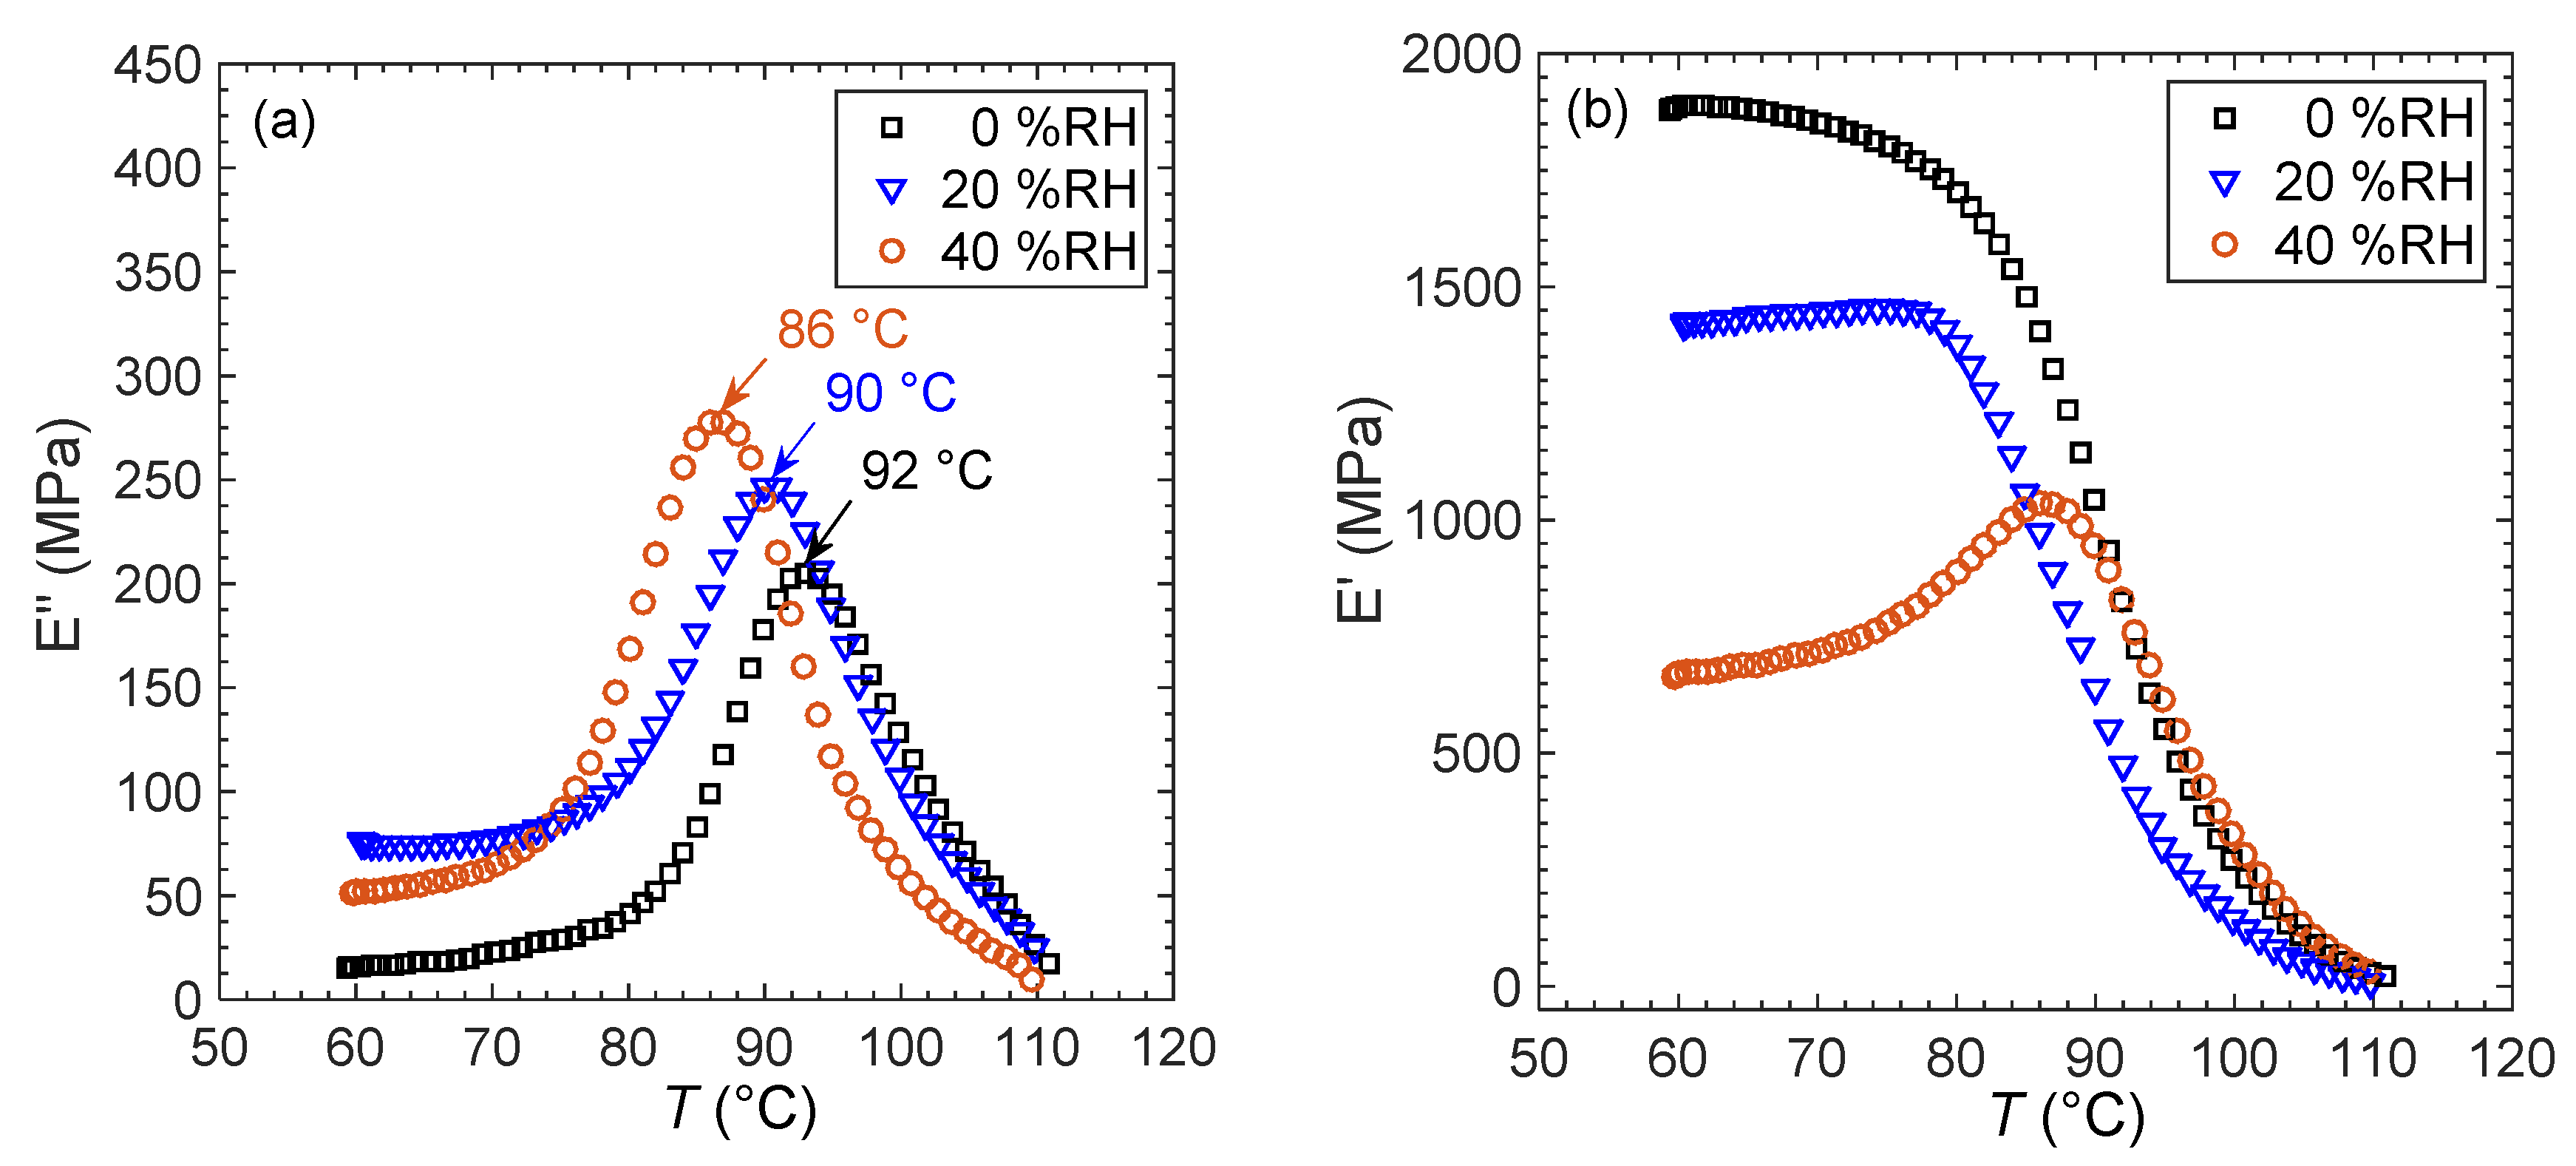
2.3. Dynamic Mechanical Analysis
2.4. Thermal Analysis
2.5. Surface Energy Analysis
3. Results

4. Conclusions
Supplementary Materials
Author Contributions
Funding
Acknowledgments
Conflicts of Interest
References
- World Plastics Production 1950–2015. In PlasticsEurope Market Research Group/Consultic Marketing & Industrieberatung GmbH; International Organization for Standardization: Online, 2016.
- Teach, W.C.; Kiessling, G.C. Polystyrene; Reinhold Pub. Corp.: New York, NY, USA, 1960; p. 176. [Google Scholar]
- Rowe, B.W.; Freeman, B.D.; Paul, D.R. Physical aging of ultrathin glassy polymer films tracked by gas permeability. Polymer 2009, 50, 5565–5575. [Google Scholar] [CrossRef]
- Matteucci, S.; Yampolskii, Y.; Freeman, B.D.; Pinnau, I. Transport of Gases and Vapors in Glassy and Rubbery Polymers. In Materials Science of Membranes for Gas and Vapor Separation; John Wiley & Sons, Ltd.: Hoboken, NJ, USA, 2006; pp. 1–47. [Google Scholar]
- Jangu, C.; Savage, A.M.; Zhang, Z.Y.; Schultz, A.R.; Madsen, L.A.; Beyer, F.L.; Long, T.E. Sulfonimide-Containing Triblock Copolymers for Improved Conductivity and Mechanical Performance. Macromolecules 2015, 48, 4520–4528. [Google Scholar] [CrossRef]
- Hallinan, D.T.; Mullin, S.A.; Stone, G.M.; Balsara, N.P. Lithium Metal Stability in Batteries with Block Copolymer Electrolytes. J. Electrochem. Soc. 2013, 160, A464–A470. [Google Scholar] [CrossRef]
- Hallinan, D.T.; Balsara, N.P. Polymer Electrolytes. Annu. Rev. Mater. Res. 2013, 43, 503–525. [Google Scholar] [CrossRef]
- Devaux, D.; Harry, K.J.; Parkinson, D.Y.; Yuan, R.; Hallinan, D.T.; MacDowell, A.A.; Balsara, N.P. Failure Mode of Lithium Metal Batteries with a Block Copolymer Electrolyte Analyzed by X-ray Microtomography. J. Electrochem. Soc. 2015, 162, A1301–A1309. [Google Scholar] [CrossRef] [Green Version]
- Misichronis, K.; Chen, J.H.; Imel, A.; Kumar, R.; Thostenson, J.; Hong, K.; Dadmun, M.; Sumpter, B.G.; Kennemur, J.G.; Hadjichristidis, N.; et al. Investigations on the Phase Diagram and Interaction Parameter of Poly(styrene-b-1,3-cyclohexadiene) Copolymers. Macromolecules 2017, 50, 2354–2363. [Google Scholar] [CrossRef]
- Segalman, R.A. Patterning with block copolymer thin films. Mater. Sci. Eng. R Rep. 2005, 48, 191–226. [Google Scholar] [CrossRef] [Green Version]
- Harrison, C.; Adamson, D.H.; Cheng, Z.; Sebastian, J.M.; Sethuraman, S.; Huse, D.A.; Register, R.A.; Chaikin, P.M. Mechanisms of Ordering in Striped Patterns. Science 2000, 290, 1558–1560. [Google Scholar] [CrossRef]
- Yang, G.-W.; Wu, G.-P.; Chen, X.; Xiong, S.; Arges, C.G.; Ji, S.; Nealey, P.F.; Lu, X.-B.; Darensbourg, D.J.; Xu, Z.-K. Directed Self-Assembly of Polystyrene-b-poly(propylene carbonate) on Chemical Patterns via Thermal Annealing for Next Generation Lithography. Nano Lett. 2017, 17, 1233–1239. [Google Scholar] [CrossRef]
- Crevecoeur, J.J.; Nelissen, L.; Lemstra, P.J. Water expandable polystyrene (WEPS): Part 1. Strategy and procedures. Polymer 1999, 40, 3685–3689. [Google Scholar] [CrossRef]
- Crevecoeur, J.J.; Coolegem, J.F.; Nelissen, L.; Lemstra, P.J. Water expandable polystyrene (WEPS): Part 3. Expansion behaviour. Polymer 1999, 40, 3697–3702. [Google Scholar] [CrossRef] [Green Version]
- Lilac, W.D.; Lee, S. Kinetics and mechanisms of styrene monomer recovery from waste polystyrene by supercritical water partial oxidation. Adv. Environ. Res. 2001, 6, 9–16. [Google Scholar] [CrossRef]
- Kwak, H.; Shin, H.Y.; Bae, S.Y.; Kumazawa, H. Characteristics and kinetics of degradation of polystyrene in supercritical water. J. Appl. Polym. Sci. 2006, 101, 695–700. [Google Scholar] [CrossRef]
- Sighicelli, M.; Pietrelli, L.; Lecce, F.; Iannilli, V.; Falconieri, M.; Coscia, L.; Di Vito, S.; Nuglio, S.; Zampetti, G. Microplastic pollution in the surface waters of Italian Subalpine Lakes. Environ. Pollut. 2018, 236, 645–651. [Google Scholar] [CrossRef]
- Schontag, J.M.; Pizzolatti, B.S.; Jangada, V.H.; de Souza, F.H.; Sens, M.L. Water quality produced by polystyrene granules as a media filter on rapid filters. J. Water Process Eng. 2015, 5, 118–126. [Google Scholar] [CrossRef]
- Ahmed, I.; Pa, N.F.C.; Nawawi, M.G.M.; Rahman, W. Modified Polydimethylsiloxane/Polystyrene Blended IPN Pervaporation Membrane for Ethanol/Water Separation. J. Appl. Polym. Sci. 2011, 122, 2666–2679. [Google Scholar] [CrossRef]
- Wang, J.C.; Lou, H.H.; Cui, Z.H.; Hou, Y.X.; Li, Y.; Zhang, Y.P.; Jiang, K.; Shi, W.N.; Qu, L.B. Fabrication of porous polyacrylamide/polystyrene fibrous membranes for efficient oil-water separation. Sep. Purif. Technol. 2019, 222, 278–283. [Google Scholar] [CrossRef]
- Shen, Y.; Wu, H.Y.; Li, Y.; Pan, Z.Y. Coliquefaction of coal and polystyrene in supercritical water. Int. J. Green Energy 2016, 13, 305–308. [Google Scholar] [CrossRef]
- Li, X.F.; Yan, H.; Peng, S.X. Colloidal Polystyrene-Carbon Nanotubes as Water-Based Lubricant Additive. In Proceedings of the International Academic Conference on Machinery, Materials Science and Engineering Applications, Wuhan, China, 15–16 July 2011; pp. 253–258. [Google Scholar]
- Wei, Y.; Deng, X.R.; Xie, Z.X.; Cai, X.C.; Liang, S.S.; Ma, P.; Hou, Z.Y.; Cheng, Z.Y.; Lin, J. Enhancing the Stability of Perovskite Quantum Dots by Encapsulation in Crosslinked Polystyrene Beads via a Swelling-Shrinking Strategy toward Superior Water Resistance. Adv. Funct. Mater. 2017, 27, 1703535. [Google Scholar] [CrossRef]
- Lakatos, A. Moisture induced changes in the building physics parameters of insulation materials. Sci. Technol. Built Environ. 2016, 22, 252–260. [Google Scholar] [CrossRef]
- Garcia-Fierro, J.; Aleman, J. Interactions between water and polystyrene. Eur. Polym. J. 1985, 21, 753–756. [Google Scholar] [CrossRef]
- Day, A. Water sorption in dielectrics. Evaluation of some thermodynamic properties. Trans. Faraday Soc. 1963, 59, 1218–1224. [Google Scholar] [CrossRef]
- Davis, E.M.; Elabd, Y.A. Water Clustering in Glassy Polymers. J. Phys. Chem. B 2013, 117, 10629–10640. [Google Scholar] [CrossRef] [PubMed]
- Yoshimizu, H.; Murakami, T.; Suzuki, T.; Tsujita, Y. Characterization of the microvoids of a tetramethyl polycarbonate/polystyrene blend system using Xe sorption measurements and 129Xe NMR spectroscopy. Polym. J. 2012, 44, 827–831. [Google Scholar] [CrossRef] [Green Version]
- Sivakumar, M.; Suzuki, T.; Yamamoto, Y.; Mahesh, K.P.O.; Yoshimizu, H.; Tsujita, Y. Structure and properties of the mesophase of syndiotactic polystyrene membrane: VII. Isothermal sorption behavior of xenon. J. Membr. Sci. 2004, 238, 75–81. [Google Scholar] [CrossRef]
- Oparaji, O.; Minelli, M.; Zhu, C.; Schaible, E.; Hexemer, A.; Hallinan, D.T., Jr. Effect of block copolymer morphology on crystallization and water transport. Polymer 2017, 120, 209–216. [Google Scholar] [CrossRef]
- Samus, M.A.; Rossi, G. Methanol absorption in ethylene-vinyl alcohol copolymers: Relation between solvent diffusion and changes in glass transition temperature in glassy polymeric materials. Macromolecules 1996, 29, 2275–2288. [Google Scholar] [CrossRef]
- Bercea, M.; Wolf, B.A. Vitrification of polymer solutions as a function of solvent quality, analyzed via vapor pressures. J. Chem. Phys. 2006, 124, 174902. [Google Scholar] [CrossRef]
- Gundert, F.; Wolf, B.A. Polymer-Solvent Interaction Parameters. In Polymer Handbook, 3rd ed.; Brandrup, J., Immergut, E.H., Eds.; Wiley: Hoboken, NJ, USA, 1989; pp. VII/173–VII/203. [Google Scholar]
- Fox, T.G.; Flory, P.J. Intrinsic Viscosity Relationships for Polystyrene. J. Am. Chem. Soc. 1951, 73, 1915–1920. [Google Scholar] [CrossRef]
- Pierleoni, D.; Minelli, M.; Scherillo, G.; Mensitieri, G.; Loianno, V.; Bonavolontà, F.; Doghieri, F. Analysis of a Polystyrene–Toluene System through “Dynamic” Sorption Tests: Glass Transitions and Retrograde Vitrification. J. Phys. Chem. B 2017, 121, 9969–9981. [Google Scholar] [CrossRef]
- Hocker, H.; Shih, H.; Flory, P.J. Thermodynamics of Polystyrene Solutions 3. Polystyrene and Cyclohexane. Trans. Faraday Soc. 1971, 67, 2275. [Google Scholar] [CrossRef]
- Krigbaum, W.R.; Geymer, D.O. Thermodynamics of polymer solutions-the polystyrene cyclohexane system near the flory theta-temperature. J. Am. Chem. Soc. 1959, 81, 1859–1868. [Google Scholar] [CrossRef]
- Flory, P.J.; Hocker, H. Thermodynamics of polystyrene solutions. 1. polystyrene and methyl ethyl ketone. Trans. Faraday Soc. 1971, 67, 2258–2269. [Google Scholar] [CrossRef]
- Barton, A.F.M. Polystyrene. In Handbook of Poylmer-Liquid Interaction Parameters and Solubility Parameters, 1st ed.; CRC Press: Boca Raton, FL, USA, 1990; pp. 297–342. [Google Scholar]
- Gündüz, S.; Dinçer, S. Solubility behaviour of polystyrene: Thermodynamic studies using gas chromatography. Polymer 1980, 21, 1041–1046. [Google Scholar] [CrossRef]
- Immergut, E.H.; Mark, H.F. Principles of Plasticization. In Plasticization and Plasticizer Processes; Advances in Chemistry; American Chemical Society: Washington, DC, USA, 1965; Volume 48, pp. 1–26. [Google Scholar]
- Fried, J.R. Polymer Science and Technology; PTR Prentice Hall: Hoboken, NJ, USA, 1995. [Google Scholar]
- Flory, P.J. Principles of Polymer Chemistry; Cornell University Press: Ithaca, NY, USA, 1953; p. 672. [Google Scholar]
- Ueberreiter, K.; Kanig, G. Self-plasticization of polymers. J. Colloid Sci. 1952, 7, 569–583. [Google Scholar] [CrossRef]
- Fox, T.G.; Flory, P.J. The glass temperature and related properties of polystyrene. Influence of molecular weight. J. Polym. Sci. 1954, 14, 315–319. [Google Scholar] [CrossRef]
- Shen, M.C.; Tobolsky, A.V. Glass Transition Temperature of Polymers. In Plasticization and Plasticizer Processes; Advances in Chemistry; American Chemical Society: Washington, DC, USA, 1965; Volume 48, pp. 27–34. [Google Scholar]
- Minelli, M.; Baschetti, M.G.; Hallinan, D.T., Jr.; Balsara, N.P. Study of gas permeabilities through polystyrene-block-poly(ethylene oxide) copolymers. J. Membr. Sci. 2013, 432, 83–89. [Google Scholar] [CrossRef]
- Oparaji, O.; Zuo, X.; Hallinan, D.T., Jr. Crystallite dissolution in PEO-based polymers induced by water sorption. Polymer 2016, 100, 206–218. [Google Scholar] [CrossRef] [Green Version]
- Jackson, E.A.; Hillmyer, M.A. Nanoporous membranes derived from block copolymers: From drug delivery to water filtration. ACS Nano 2010, 4, 3548–3553. [Google Scholar] [CrossRef]
- Phillip, W.A.; O’Neill, B.; Rodwogin, M.; Hillmyer, M.A.; Cussler, E. Self-assembled block copolymer thin films as water filtration membranes. ACS Appl. Mater. Interfaces 2010, 2, 847–853. [Google Scholar] [CrossRef]
- Bondar, V.; Freeman, B.; Pinnau, I. Gas transport properties of poly (ether-b-amide) segmented block copolymers. J. Polym. Sci. Part B Polym. Phys. 2000, 38, 2051–2062. [Google Scholar] [CrossRef]
- Hadjichristidis, N.; Iatrou, H.; Pispas, S.; Pitsikalis, M. Anionic polymerization: High vacuum techniques. J. Polym. Sci. Part A-Polym. Chem. 2000, 38, 3211–3234. [Google Scholar] [CrossRef]
- Minelli, M.; De Angelis, M.G.; Doghieri, F.; Rocchetti, M.; Montenero, A. Barrier properties of organic–inorganic hybrid coatings based on polyvinyl alcohol with improved water resistance. Polym. Eng. Sci. 2010, 50, 144–153. [Google Scholar] [CrossRef]
- Minelli, M.; Baschetti, M.G.; Doghieri, F.; Ankerfors, M.; Lindström, T.; Siró, I.; Plackett, D. Investigation of mass transport properties of microfibrillated cellulose (MFC) films. J. Membr. Sci. 2010, 358, 67–75. [Google Scholar] [CrossRef]
- Coletti, M. Implementation of Relative Humidity Control in DMA Measurements. AIP Conf. Proc. 2010, 1255, 82–84. [Google Scholar] [CrossRef]
- Smith, J.M.; Van Ness, H.C.; Abbott, M.M. Introduction to Chemical Engineering Thermodynamics, 5th ed.; McGraw-Hill: New York, NY, USA, 1996; p. 763. [Google Scholar]
- Thielmann, F.; Burnett, D.J.; Heng, J.Y.Y. Determination of the Surface Energy Distributions of Different Processed Lactose. Drug Dev. Ind. Pharm. 2007, 33, 1240–1253. [Google Scholar] [CrossRef]
- Ho, R.; Dilworth, S.E.; Williams, D.R.; Heng, J.Y.Y. Role of Surface Chemistry and Energetics in High Shear Wet Granulation. Ind. Eng. Chem. Res. 2011, 50, 9642–9649. [Google Scholar] [CrossRef]
- Dorris, G.M.; Gray, D.G. Adsorption of n-alkanes at zero surface coverage on cellulose paper and wood fibers. J. Colloid Interface Sci. 1980, 77, 353–362. [Google Scholar] [CrossRef]
- Donnet, J.B.; Park, S.J.; Balard, H. Evaluation of specific interactions of solid surfaces by inverse gas chromatography. Chromatographia 1991, 31, 434–440. [Google Scholar] [CrossRef]
- Good, R.J. Contact Angle, Wettability and Adhesion; Mittal, K.L., Ed.; VSP: Rancho Cordova, CA, USA, 2003; Volume 3. [Google Scholar]
- van Oss, C.J. Interfacial Forces in Aqueous Media; Marcel Dekker: New York, NY, USA, 1994. [Google Scholar]
- Moad, G.; Solomon, D.H.; Johns, S.R.; Willing, R.I. Structure of benzoyl peroxide initiated polystyrene: Determination of the initiator-derived functionality by carbon-13 NMR. Macromolecules 1982, 15, 1188–1191. [Google Scholar] [CrossRef]
- Odian, G. Principles of Polymerization, 3rd ed.; John Wiley & Sons, Inc.: Hoboken, NJ, USA, 1991; p. 768. [Google Scholar]
- Kulagina, G.S.; Chalykh, A.E.; Gerasimov, V.K.; Chalykh, K.A.; Puryaeva, T.P. Sorption of water by poly(vinyl alcohol). Polym. Sci. Ser. A 2007, 49, 425–432. [Google Scholar] [CrossRef]
- Crank, J. The Mathematics of Diffusion, 2nd ed.; Oxford University Press: Oxford, UK, 1975; p. 414. [Google Scholar]
- Badrinarayanan, P.; Zheng, W.; Li, Q.; Simon, S.L. The glass transition temperature versus the fictive temperature. J. Non-Cryst. Solids 2007, 353, 2603–2612. [Google Scholar] [CrossRef]
- An, L.; He, D.; Jing, J.; Wang, Z.; Yu, D.; Jiang, B.; Jiang, Z.; Ma, R. Effects of molecular weight and interaction parameter on the glass transition temperature of polystyrene mixtures and its blends with polystyrene/poly (2,6-dimethyl-p-phenylene oxide). Eur. Polym. J. 1997, 33, 1523–1528. [Google Scholar] [CrossRef]
- Claudy, P.; Létoffé, J.M.; Camberlain, Y.; Pascault, J.P. Glass transition of polystyrene versus molecular weight. Polym. Bull. 1983, 9, 208–215. [Google Scholar] [CrossRef]
- Fox, T.G., Jr.; Flory, P.J. Second-order transition temperatures and related properties of polystyrene. I. Influence of molecular weight. J. Appl. Phys. 1950, 21, 581–591. [Google Scholar] [CrossRef]
- Scherillo, G.; Loianno, V.; Pierleoni, D.; Esposito, R.; Brasiello, A.; Minelli, M.; Doghieri, F.; Mensitieri, G. Modeling Retrograde Vitrification in the Polystyrene–Toluene System. J. Phys. Chem. B 2018, 122, 3015–3022. [Google Scholar] [CrossRef]
- Cimmino, S.; Dipace, E.; Martuscelli, E.; Silvestre, C. Syndiotactic Polystyrene-Based Blends-Crystallization and Phase-Structure. Polymer 1993, 34, 2799–2803. [Google Scholar] [CrossRef]
- Vieth, W.R.; Tam, P.M.; Michaels, A.S. Dual sorption mechanisms in glassy polystyrene. J. Colloid Interface Sci. 1966, 22, 360–370. [Google Scholar] [CrossRef]
- Roth, C.B.; Torkelson, J.M. Selectively Probing the Glass Transition Temperature in Multilayer Polymer Films: Equivalence of Block Copolymers and Multilayer Films of Different Homopolymers. Macromolecules 2007, 40, 3328–3336. [Google Scholar] [CrossRef]
- Rieger, J. The glass transition temperature T g of polymers—Comparison of the values from differential thermal analysis (DTA, DSC) and dynamic mechanical measurements (torsion pendulum). Polym. Test. 2001, 20, 199–204. [Google Scholar] [CrossRef]
- Nielsen, L.E.; Landel, R.F. Mechanical Properties of Polymers and Composites, 2nd ed.; Marcel Dekker, Inc.: New York, NY, USA, 1994. [Google Scholar]
- Sperling, L.H. Introduction to Physical Polymer Science; Wiley Interscience: Hoboken, NJ, USA, 2006. [Google Scholar]
- Barentsen, W.M.; Heikens, D. Mechanical properties of polystyrene/low density polyethylene blends. Polymer 1973, 14, 579–583. [Google Scholar] [CrossRef]
- Whitney, W.; Andrews, R.D. Yielding of glassy polymers: Volume effects. J. Polym. Sci. Part C Polym. Symp. 1967, 16, 2981–2990. [Google Scholar] [CrossRef]
- Maeda, Y.; Paul, D.R. Effect of Antiplasticization on Gas Sorption and Transport. I. Polysulfone. J. Polym. Sci. Part B -Polym. Phys. 1987, 25, 957–980. [Google Scholar] [CrossRef]
- Maeda, Y.; Paul, D.R. Effect of Antiplasticization on Gas Sorption and Transport. III. Free Volume Interpretation. J. Polym. Sci. Part B-Polym. Phys. 1987, 25, 1005–1016. [Google Scholar] [CrossRef]
- Vrentas, J.S.; Duda, J.L. Free-volume interpretation of influence of glass-transition on diffusion in amorphous polymers. J. Appl. Polym. Sci. 1978, 22, 2325–2339. [Google Scholar] [CrossRef]
- McCall, D.W.; Douglass, D.C.; Blyler, L.L.; Johnson, G.E.; Jelinski, L.W.; Bair, H.E. Solubility and Diffusion of Water in Low-Density Polyethylene. Macromolecules 1984, 17, 1644–1649. [Google Scholar] [CrossRef]
- Tassaing, T.; Danten, Y.; Besnard, M.; Zoidis, E.; Yarwood, J.; Guissani, Y.; Guillot, B. A far-infrared study of water diluted in hydrophobic solvents. Mol. Phys. 1995, 84, 769–785. [Google Scholar] [CrossRef]
- ten Brinke, G.; Karasz, F.E.; Ellis, T.S. Depression of Glass-Transition Temperatures of Polymer Networks by Diluents. Macromolecules 1983, 16, 244–249. [Google Scholar] [CrossRef] [Green Version]
- Kwei, T.K. The effect of hydrogen bonding on the glass transition temperatures of polymer mixtures. J. Polym. Sci. Polym. Lett. Ed. 1984, 22, 307–313. [Google Scholar] [CrossRef]
- Braun, G.; Kovacs, A.J. Variations de la Température de Transition Vitreuse dans les Systèmes Binaires à Répartition Statistique. In Proceedings of the Physics of non-crystalline solids: Proceedings of the international conference, Delft, The Netherlands, 1964; pp. 303–319. [Google Scholar]
- Guan, L.; Sheng, J.; Huang, D. Investigation on Anomalous Calorimetric Behaviors of Polystyrene and Triphenylmethyl Chloride Blends. J. Macromol. Sci. Phys. Part B 2011, 50, 652–664. [Google Scholar] [CrossRef]
- Kovacs, A.J. Transition vitreuse dans les polymères amorphes. Etude phénoménologique; Springer: Berlin, Germany, 1964; pp. 394–507. [Google Scholar]
- Moy, P.; Karasz, F.E. The Interactions of Water with Epoxy Resins. In Water in Polymers; ACS Symposium Series; American Chemical Society: Washington, DC, USA, 1980; Volume 127, pp. 505–513. [Google Scholar]
- Ellis, T.S.; Karasz, F.E.; Brinke, G.T. The influence of thermal properties on the glass transition temperature in styrene/divinylbenzene network–diluent systems. J. Appl. Polym. Sci. 1983, 28, 23–32. [Google Scholar] [CrossRef]


| Supplier/Morphology | Mn kg/mol | PS PDI | PS Volume Fraction (φ) | |
|---|---|---|---|---|
| PS77k | Polymer Source | 77 | 1.05 | 1 |
| PS109k | Versalis | 109 | 2.64 | 1 |
| PS160k | Polymer Source | 160 | 1.05 | 1 |
| PS387k | In-house | 387 | 1.02 a | 1 |
| SEO92k | In-house/Cylindrical (PEO cylinders) | 92 | 1.01 | 0.7 |
| SEO122k | In-house/Lamellar (PEO majority) | 122 | 1.02 | 0.46 |
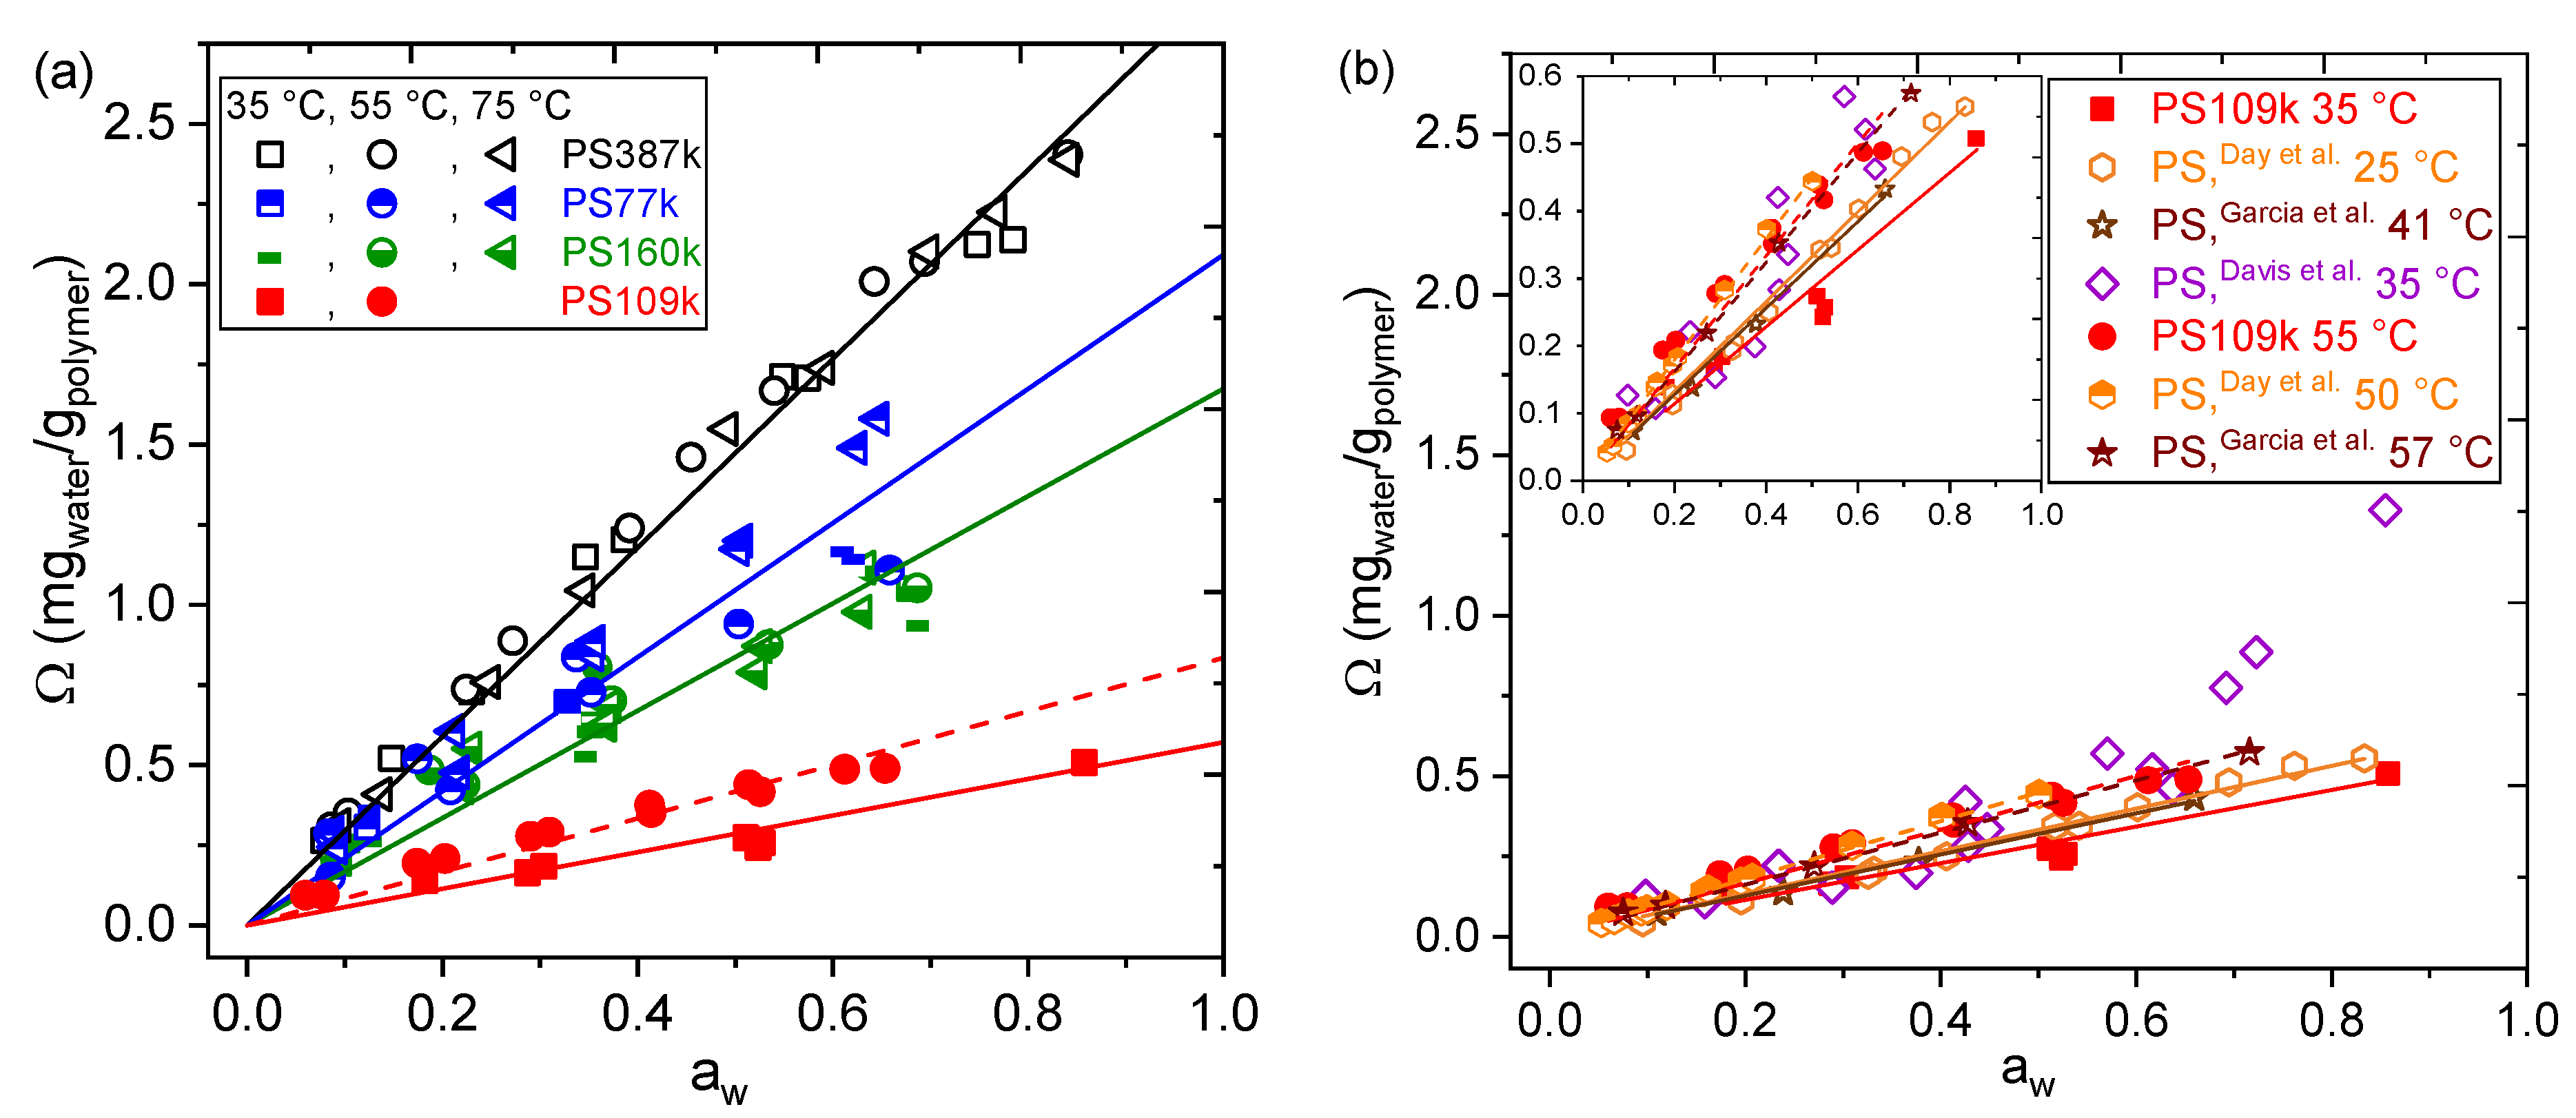
| Sample | k (mgwater/gpolymer) | k* (molwater/molchain end) | Chain End Functionality |
|---|---|---|---|
| PS387k | 2.9 ± 0.1 | 31 | Hydroxyl |
| PS77k | 2.1 ± 0.2 | 4 | Alkyl |
| PS160k | 1.7 ± 0.2 | 8 | Alkyl |
| PS109k (35 °C) | 0.55 ± 0.03 | 2 | Benzoate carbonyl |
| PS109k (55 °C) | 0.83 ± 0.03 | 3 | Benzoate carbonyl |
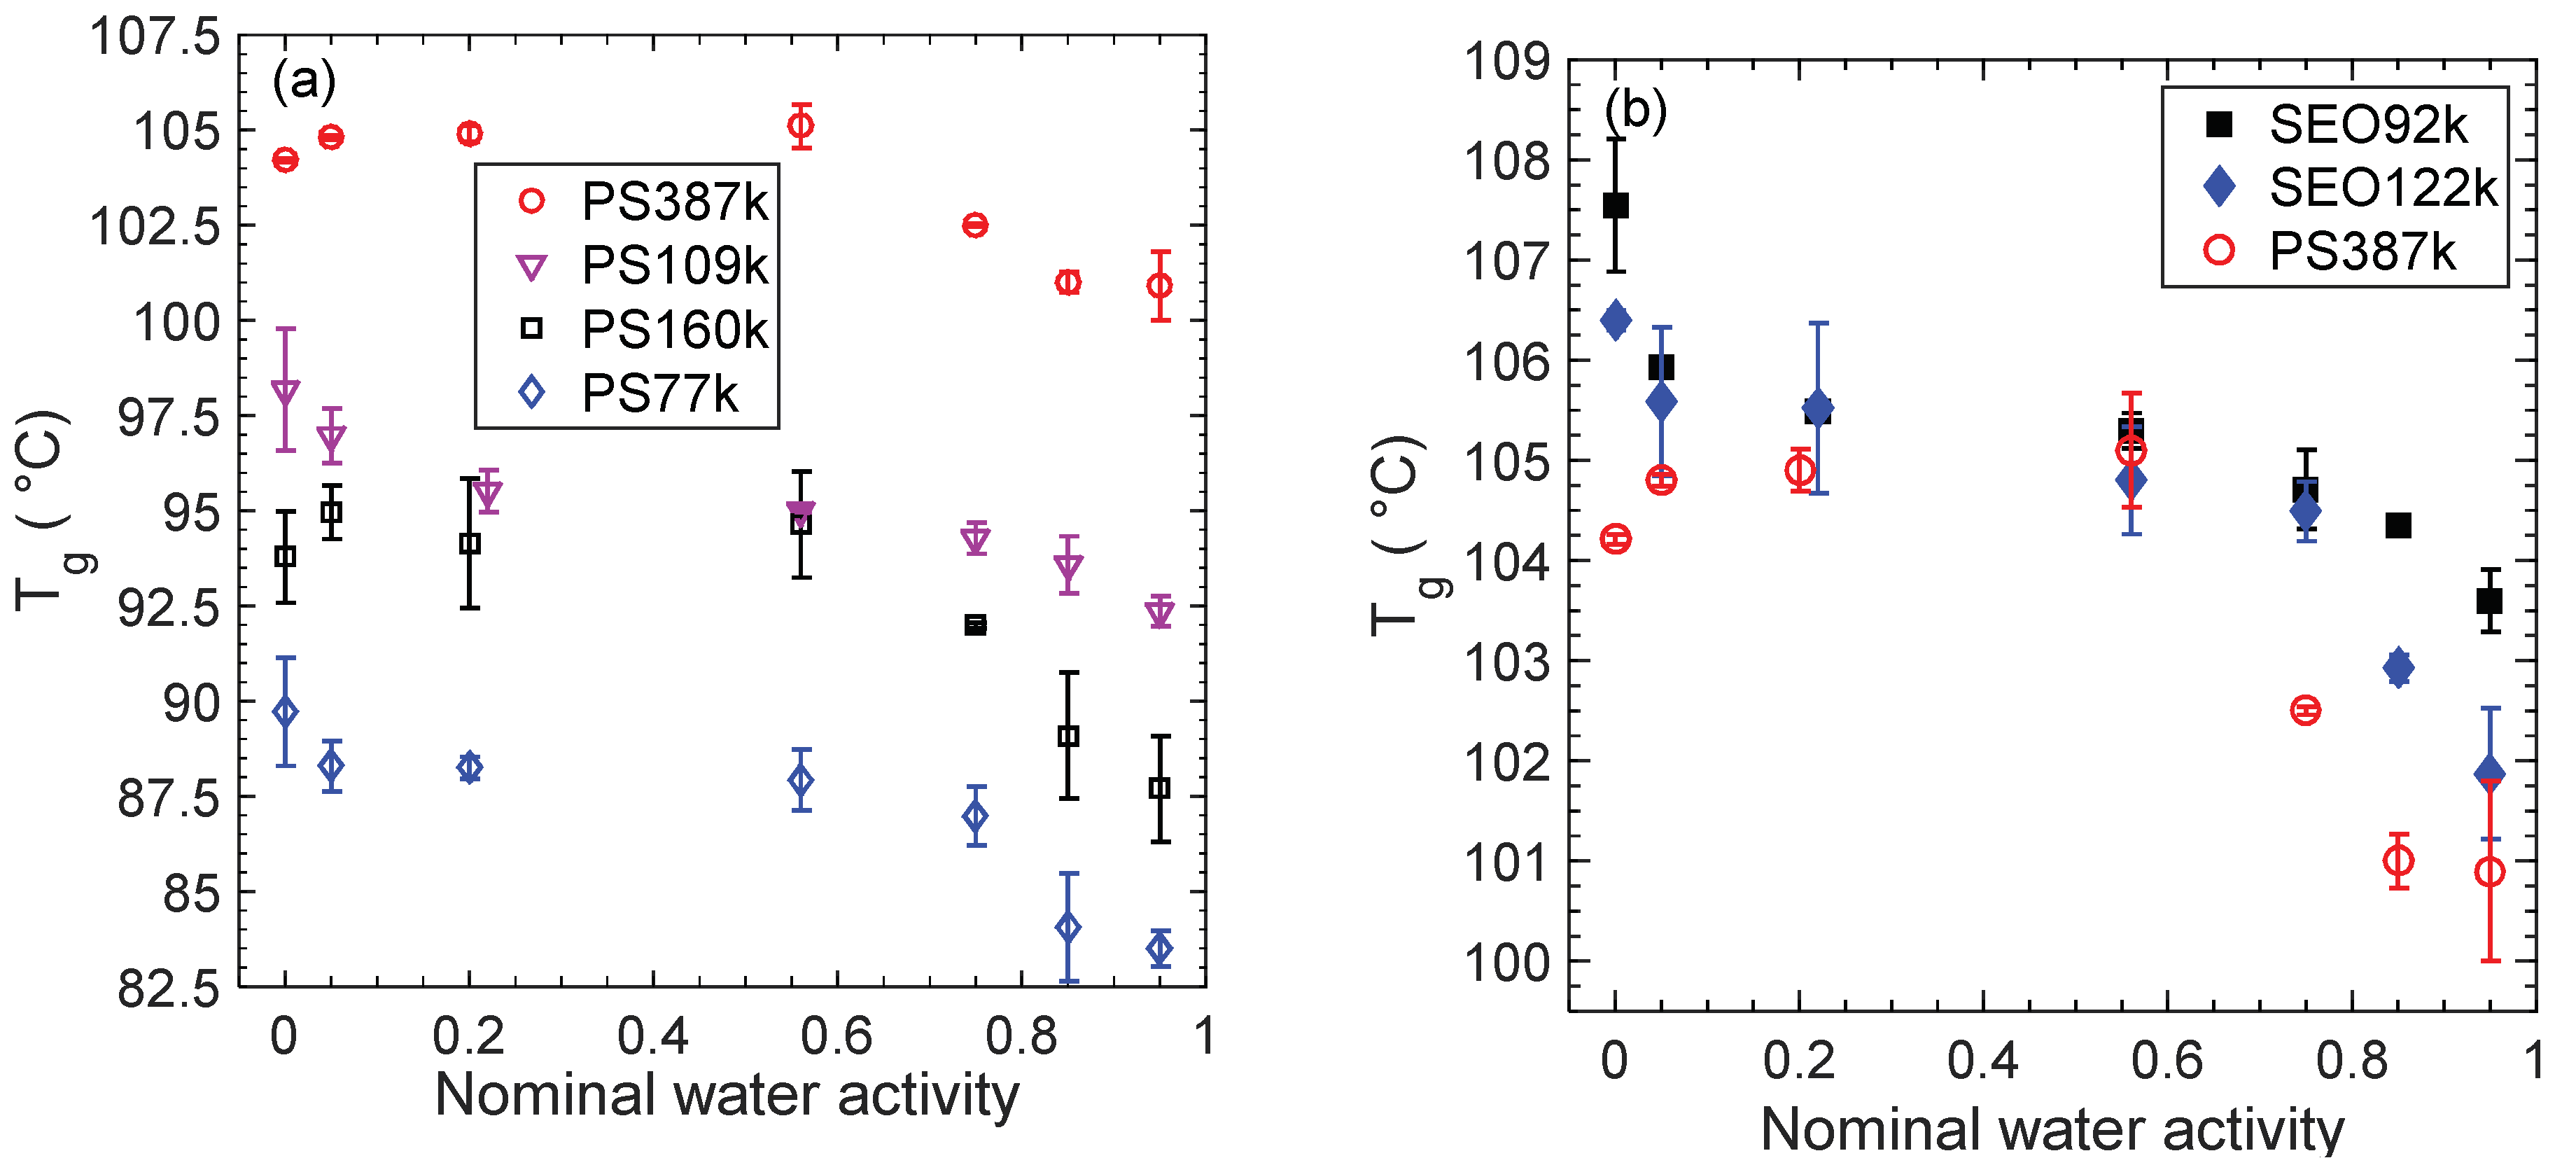
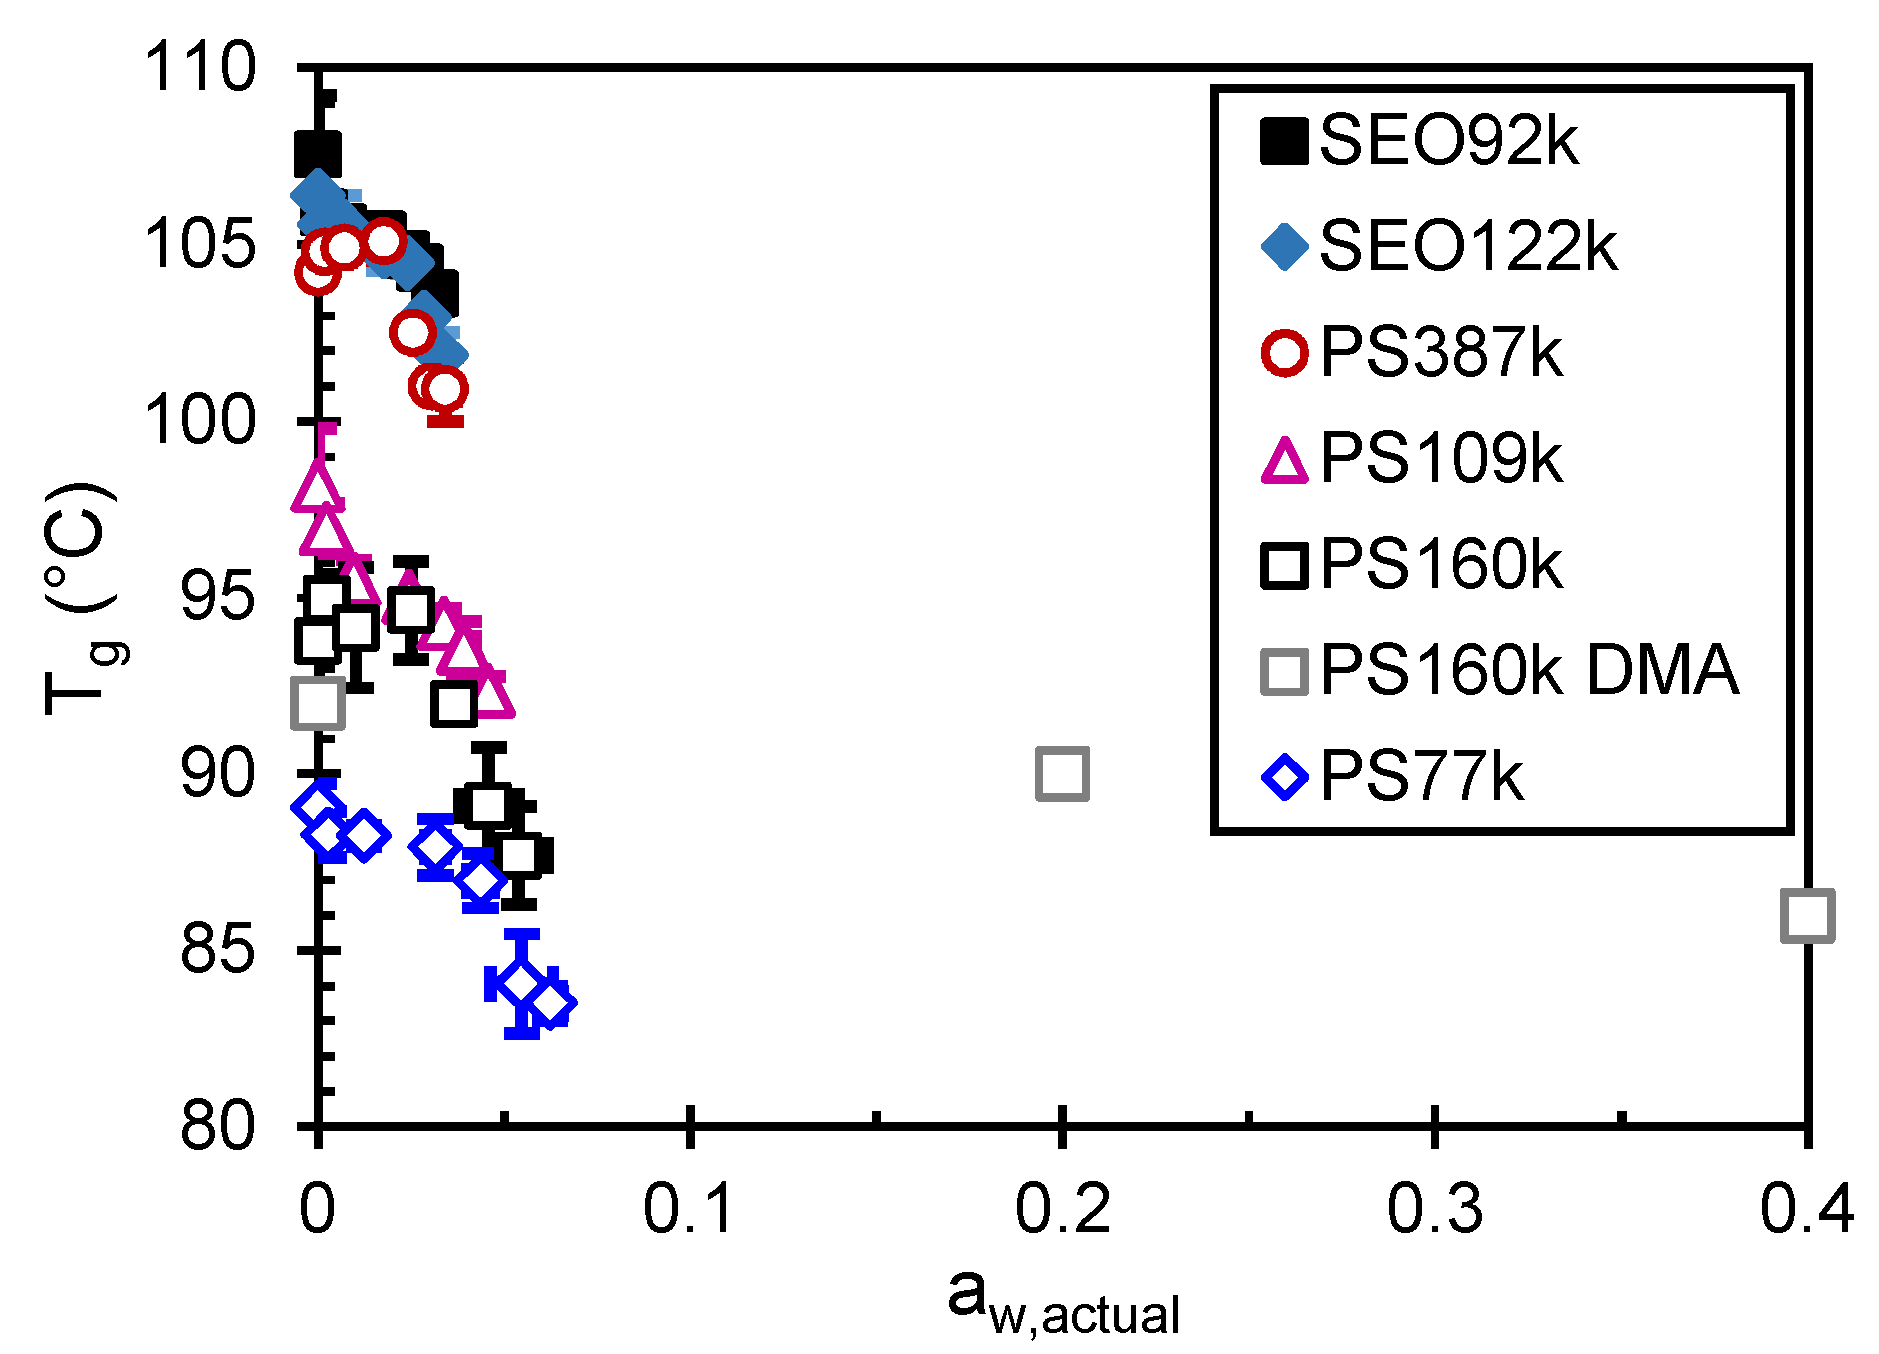
| Sample | Tg (5% RH) (°C) | ΔTg,max b (°C) |
|---|---|---|
| PS77k | 88.3 ± 0.7 | 4.8 ± 0.8 |
| PS109k | 97.0 ± 0.7 | 4.6 ± 0.8 |
| PS160k_DSC | 95.0 ± 0.7 | 7.3 ± 1.5 |
| PS160k_DMA | 92 a | 6.0 |
| PS387k | 104.8 ± 0.1 | 3.9 ± 0.9 |
| SEO92k | 105.9 ± 0.1 | 2.3 ± 0.3 |
| SEO122k | 105.6 ± 0.7 | 3.7 ± 1.0 |
| All PS | 5.1 ± 0.5 | |
| All Samples | 4.4 ± 0.4 |
Publisher’s Note: MDPI stays neutral with regard to jurisdictional claims in published maps and institutional affiliations. |
© 2022 by the authors. Licensee MDPI, Basel, Switzerland. This article is an open access article distributed under the terms and conditions of the Creative Commons Attribution (CC BY) license (https://creativecommons.org/licenses/by/4.0/).
Share and Cite
Hallinan, D.T., Jr.; Minelli, M.; Oparaji, O.; Sardano, A.; Iyiola, O.; Garcia, A.R.; Burnett, D.J. Effect of Polystyrene Synthesis Method on Water Sorption and Glass Transition. Membranes 2022, 12, 1059. https://doi.org/10.3390/membranes12111059
Hallinan DT Jr., Minelli M, Oparaji O, Sardano A, Iyiola O, Garcia AR, Burnett DJ. Effect of Polystyrene Synthesis Method on Water Sorption and Glass Transition. Membranes. 2022; 12(11):1059. https://doi.org/10.3390/membranes12111059
Chicago/Turabian StyleHallinan, Daniel T., Jr., Matteo Minelli, Onyekachi Oparaji, Andrea Sardano, Oluwagbenga Iyiola, Armando R. Garcia, and Daniel J. Burnett. 2022. "Effect of Polystyrene Synthesis Method on Water Sorption and Glass Transition" Membranes 12, no. 11: 1059. https://doi.org/10.3390/membranes12111059