
Voltammetric Ion Sensing with Ionophore-Based Ion-Selective Electrodes Containing Internal Aqueous Solution, Improving Lifetime of Sensors

Abstract
:
1. Introduction
2. Theoretical Considerations
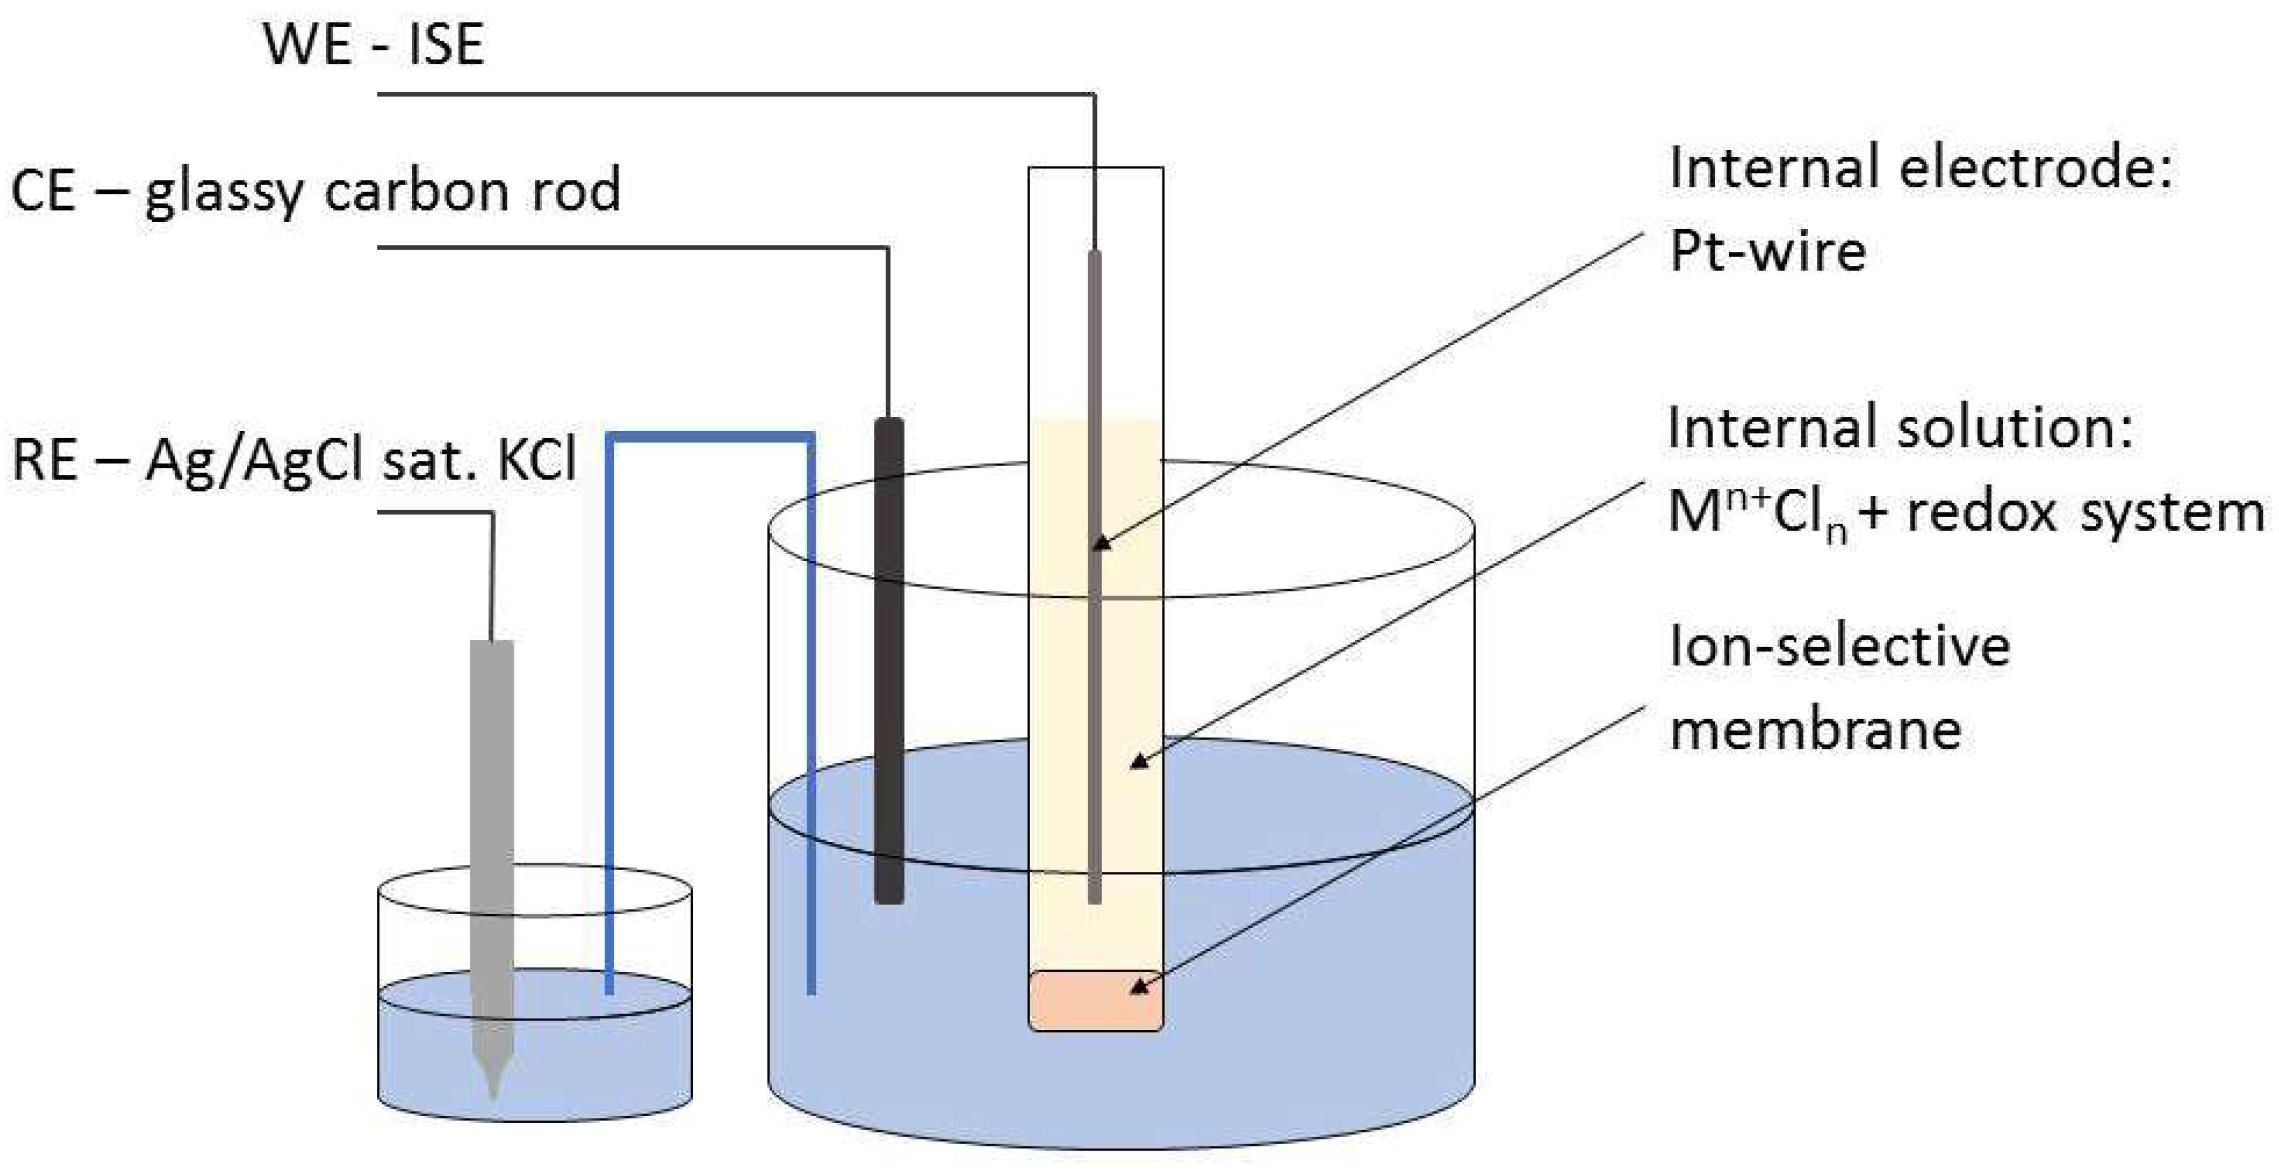
3. Materials and Methods
4. Results and Discussion
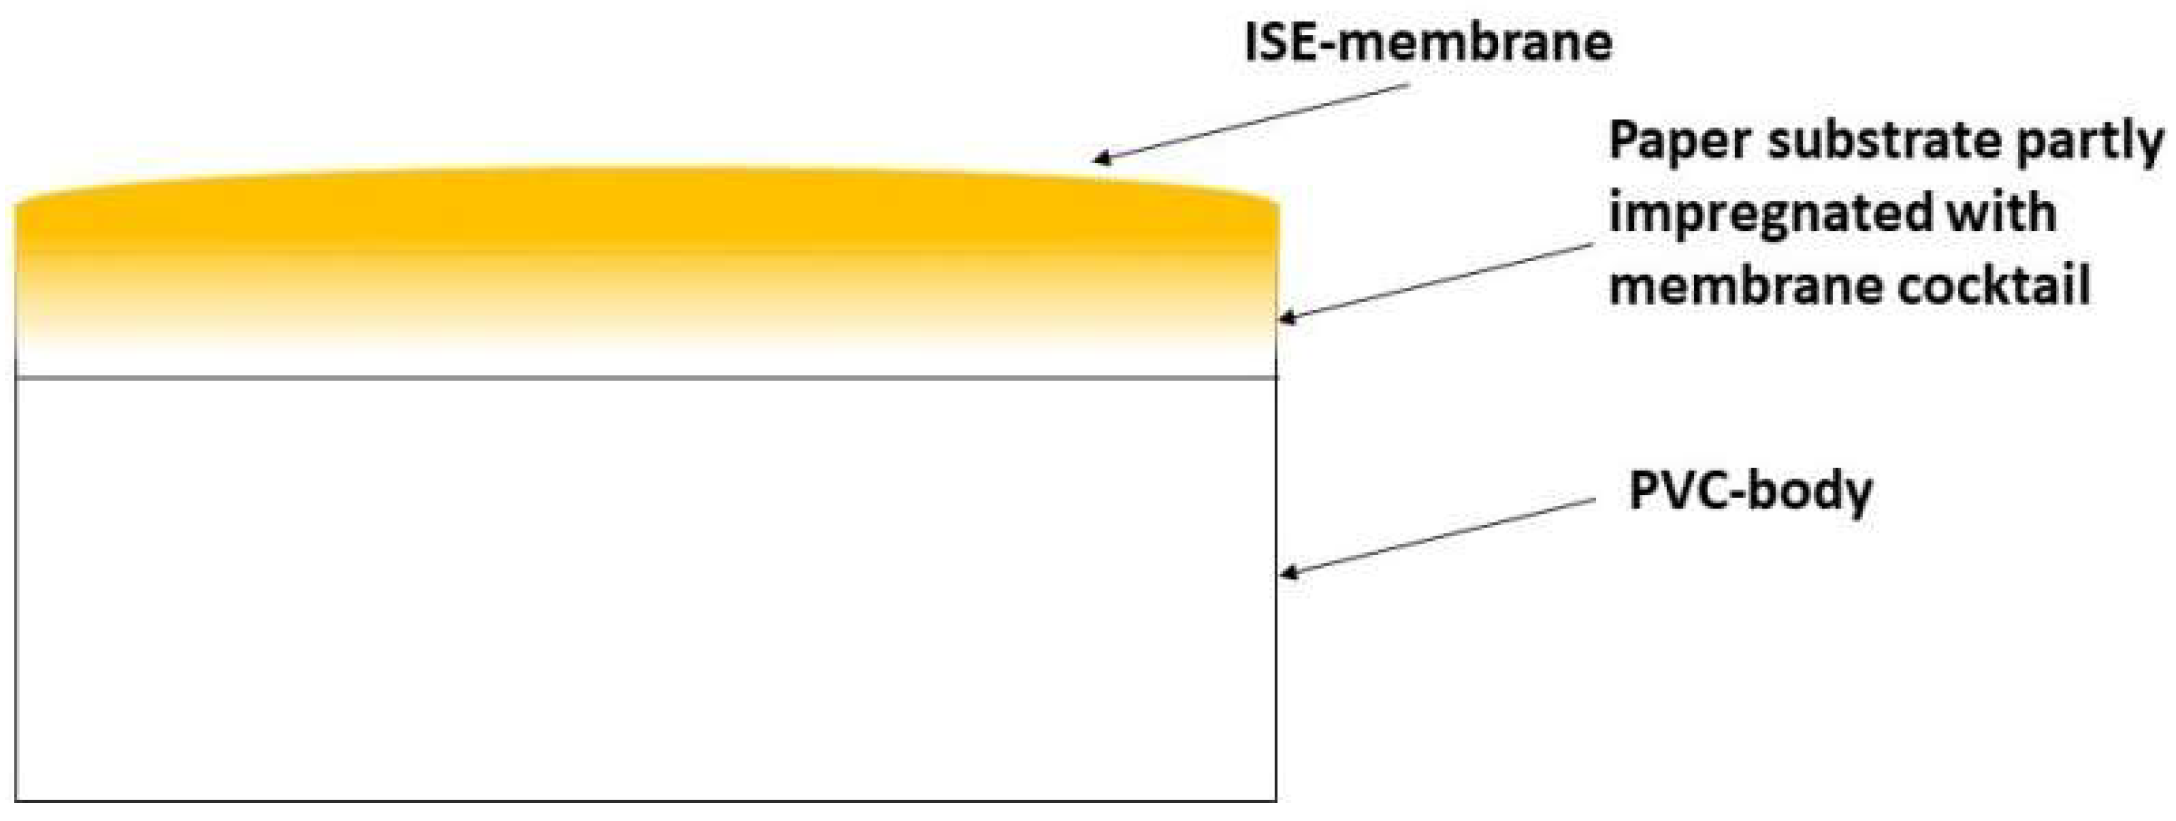
4.1. Obtaining Thin Membranes for Classical ISEs
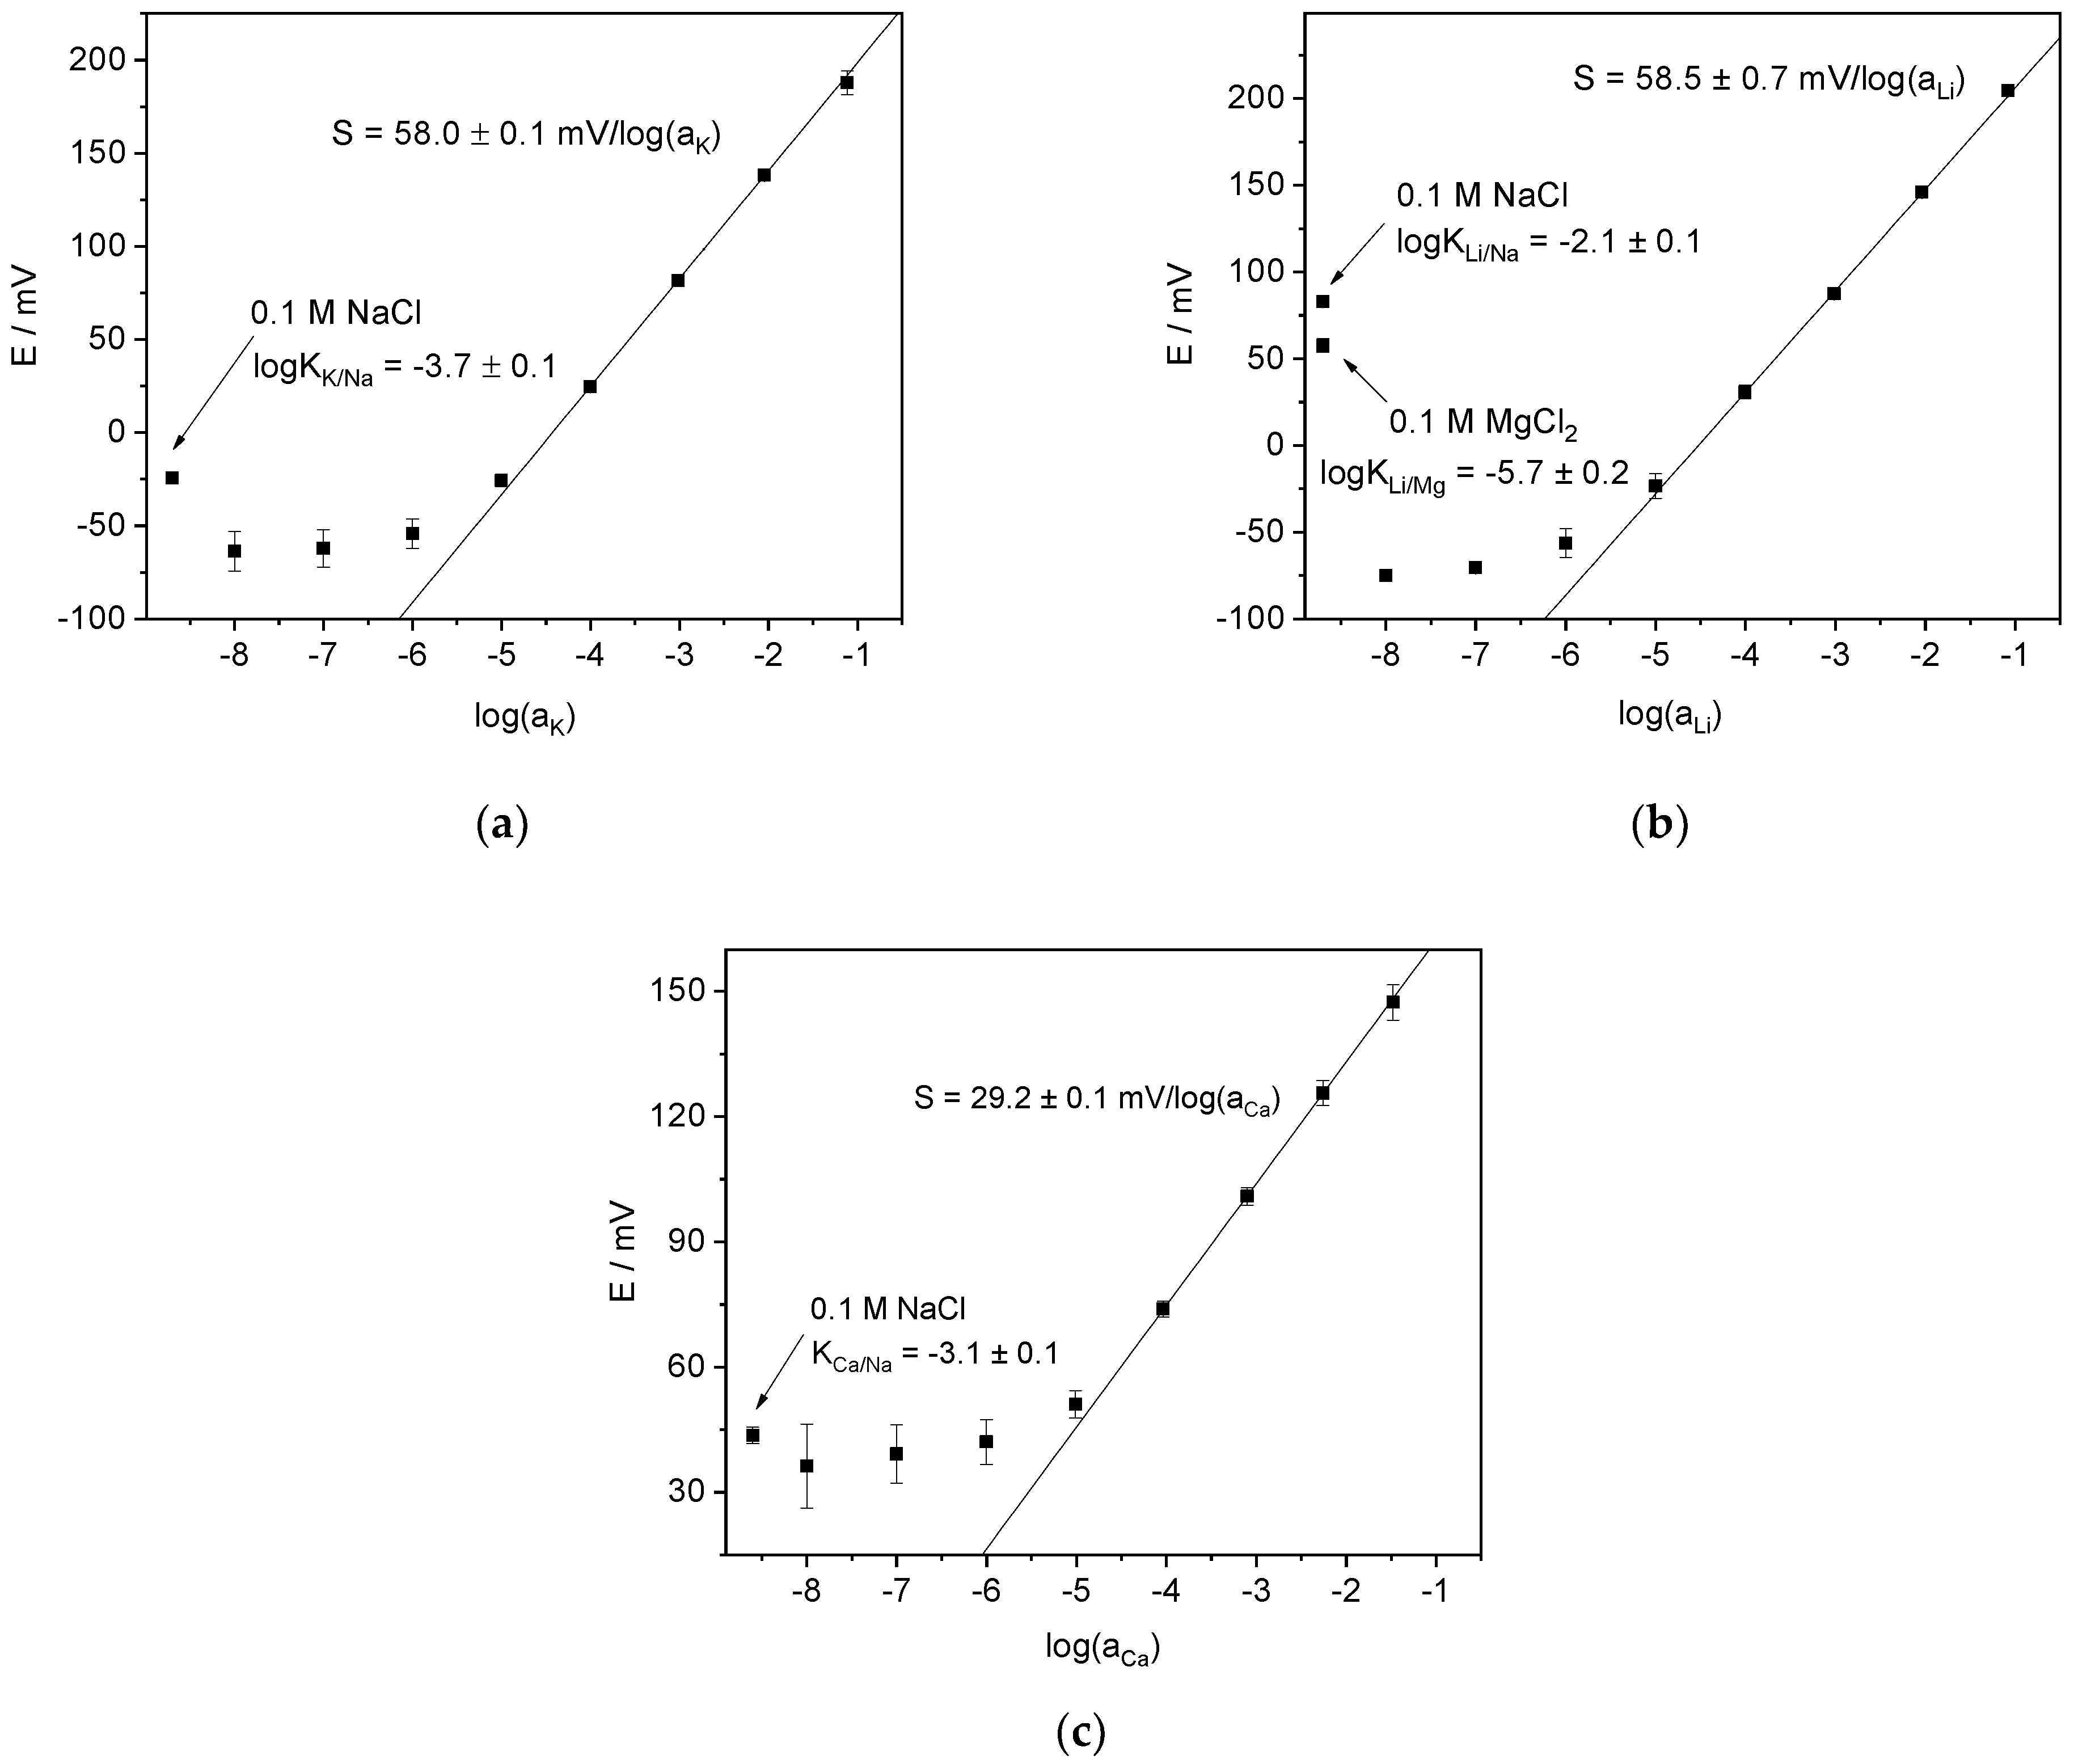
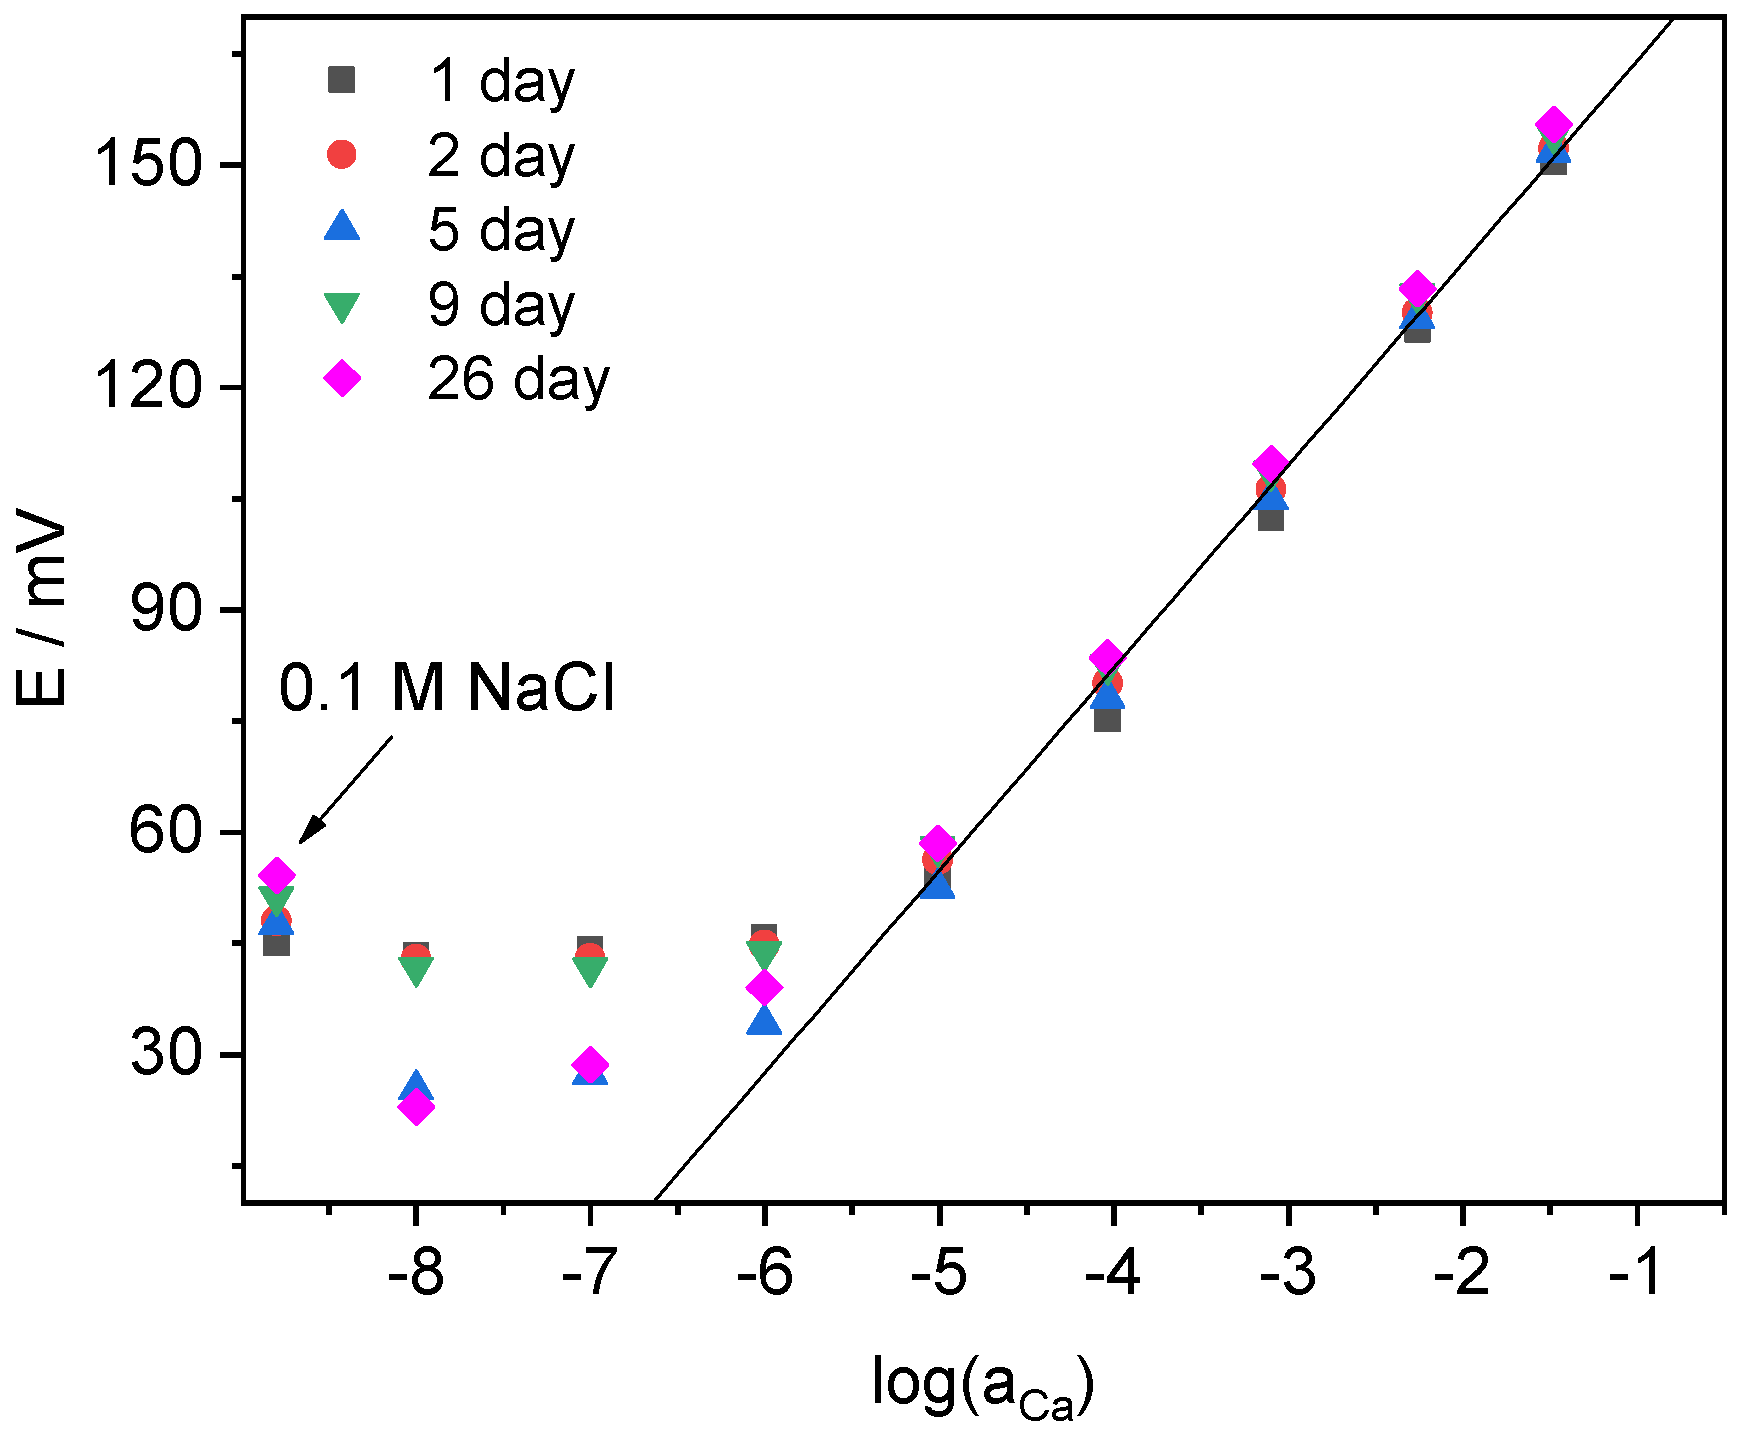
4.2. Potentiometric Study of Electrodes Performance
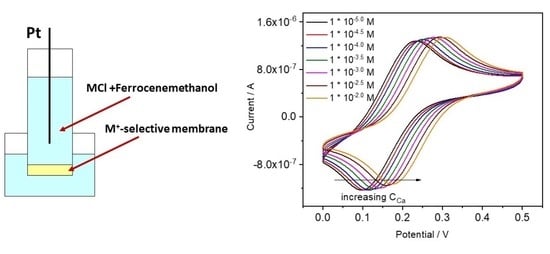
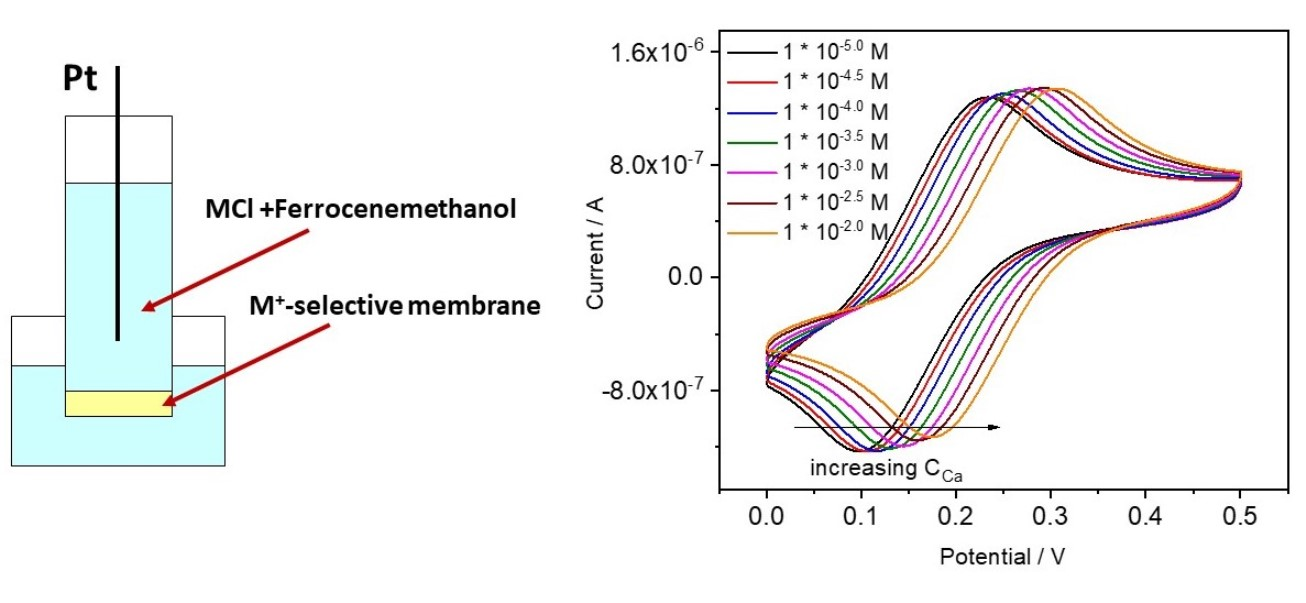
4.3. Voltammetric Measurements with ISEs Containing Internal Solution
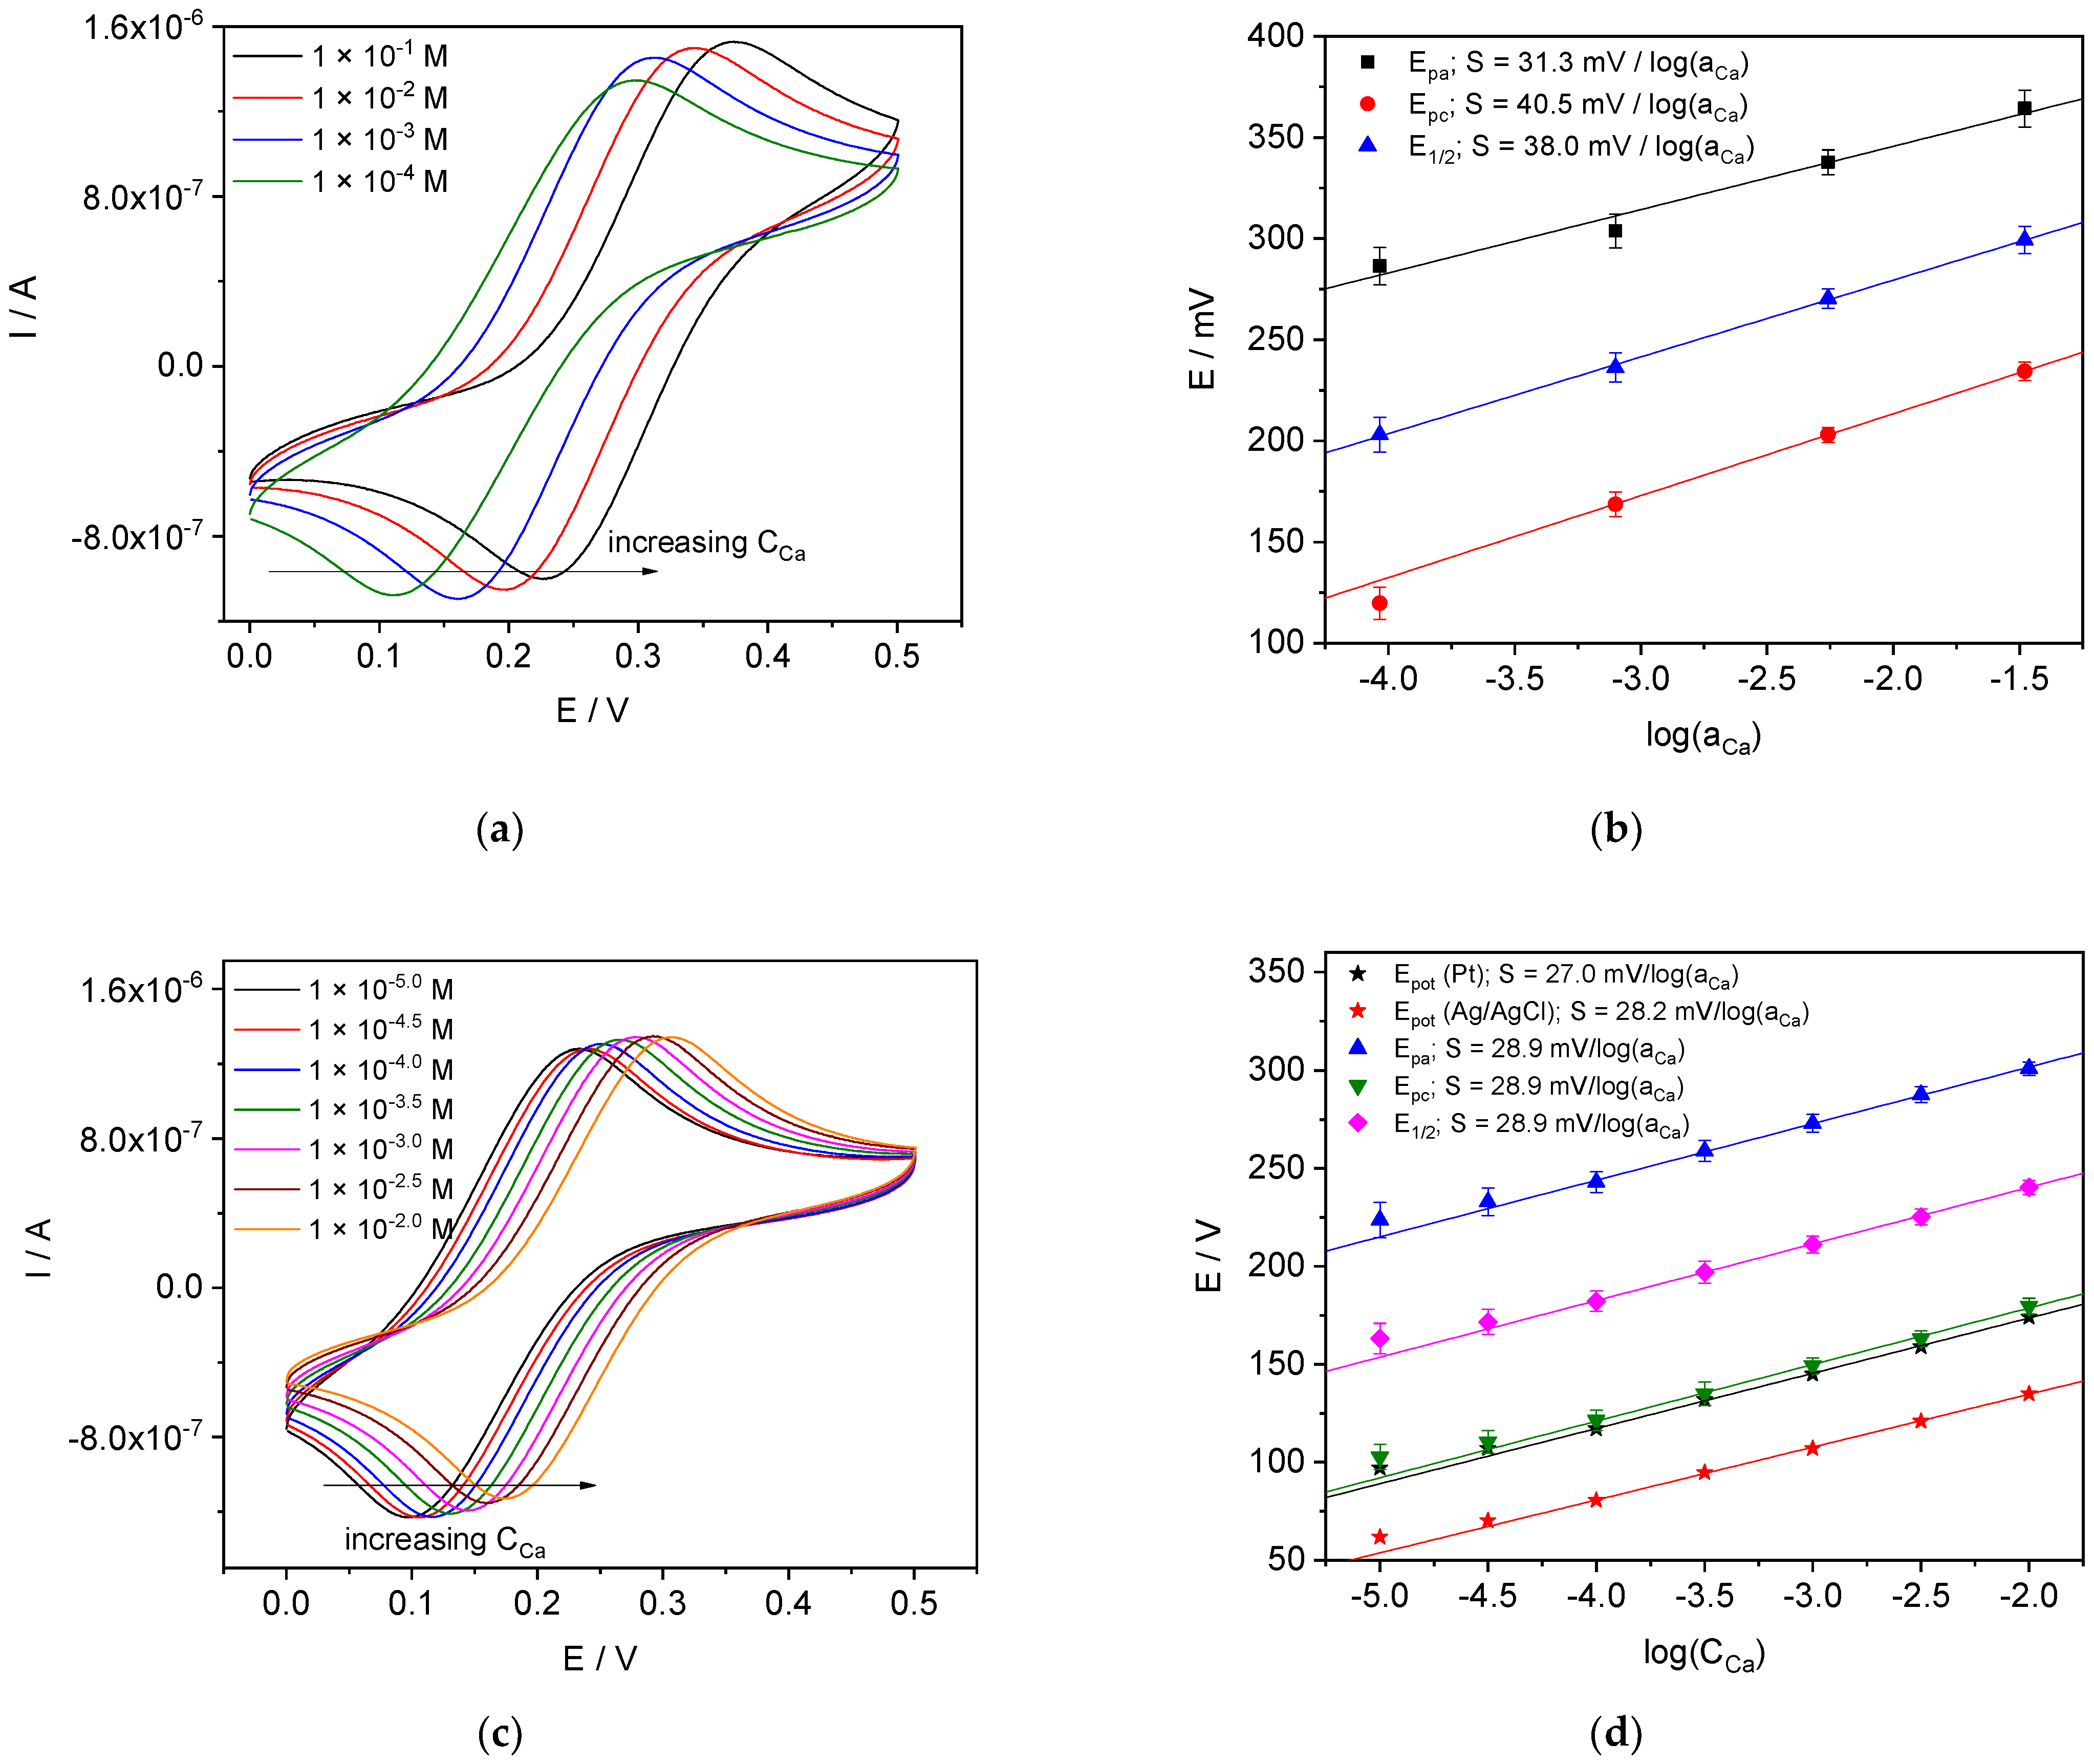
4.3.1. Ca-ISE
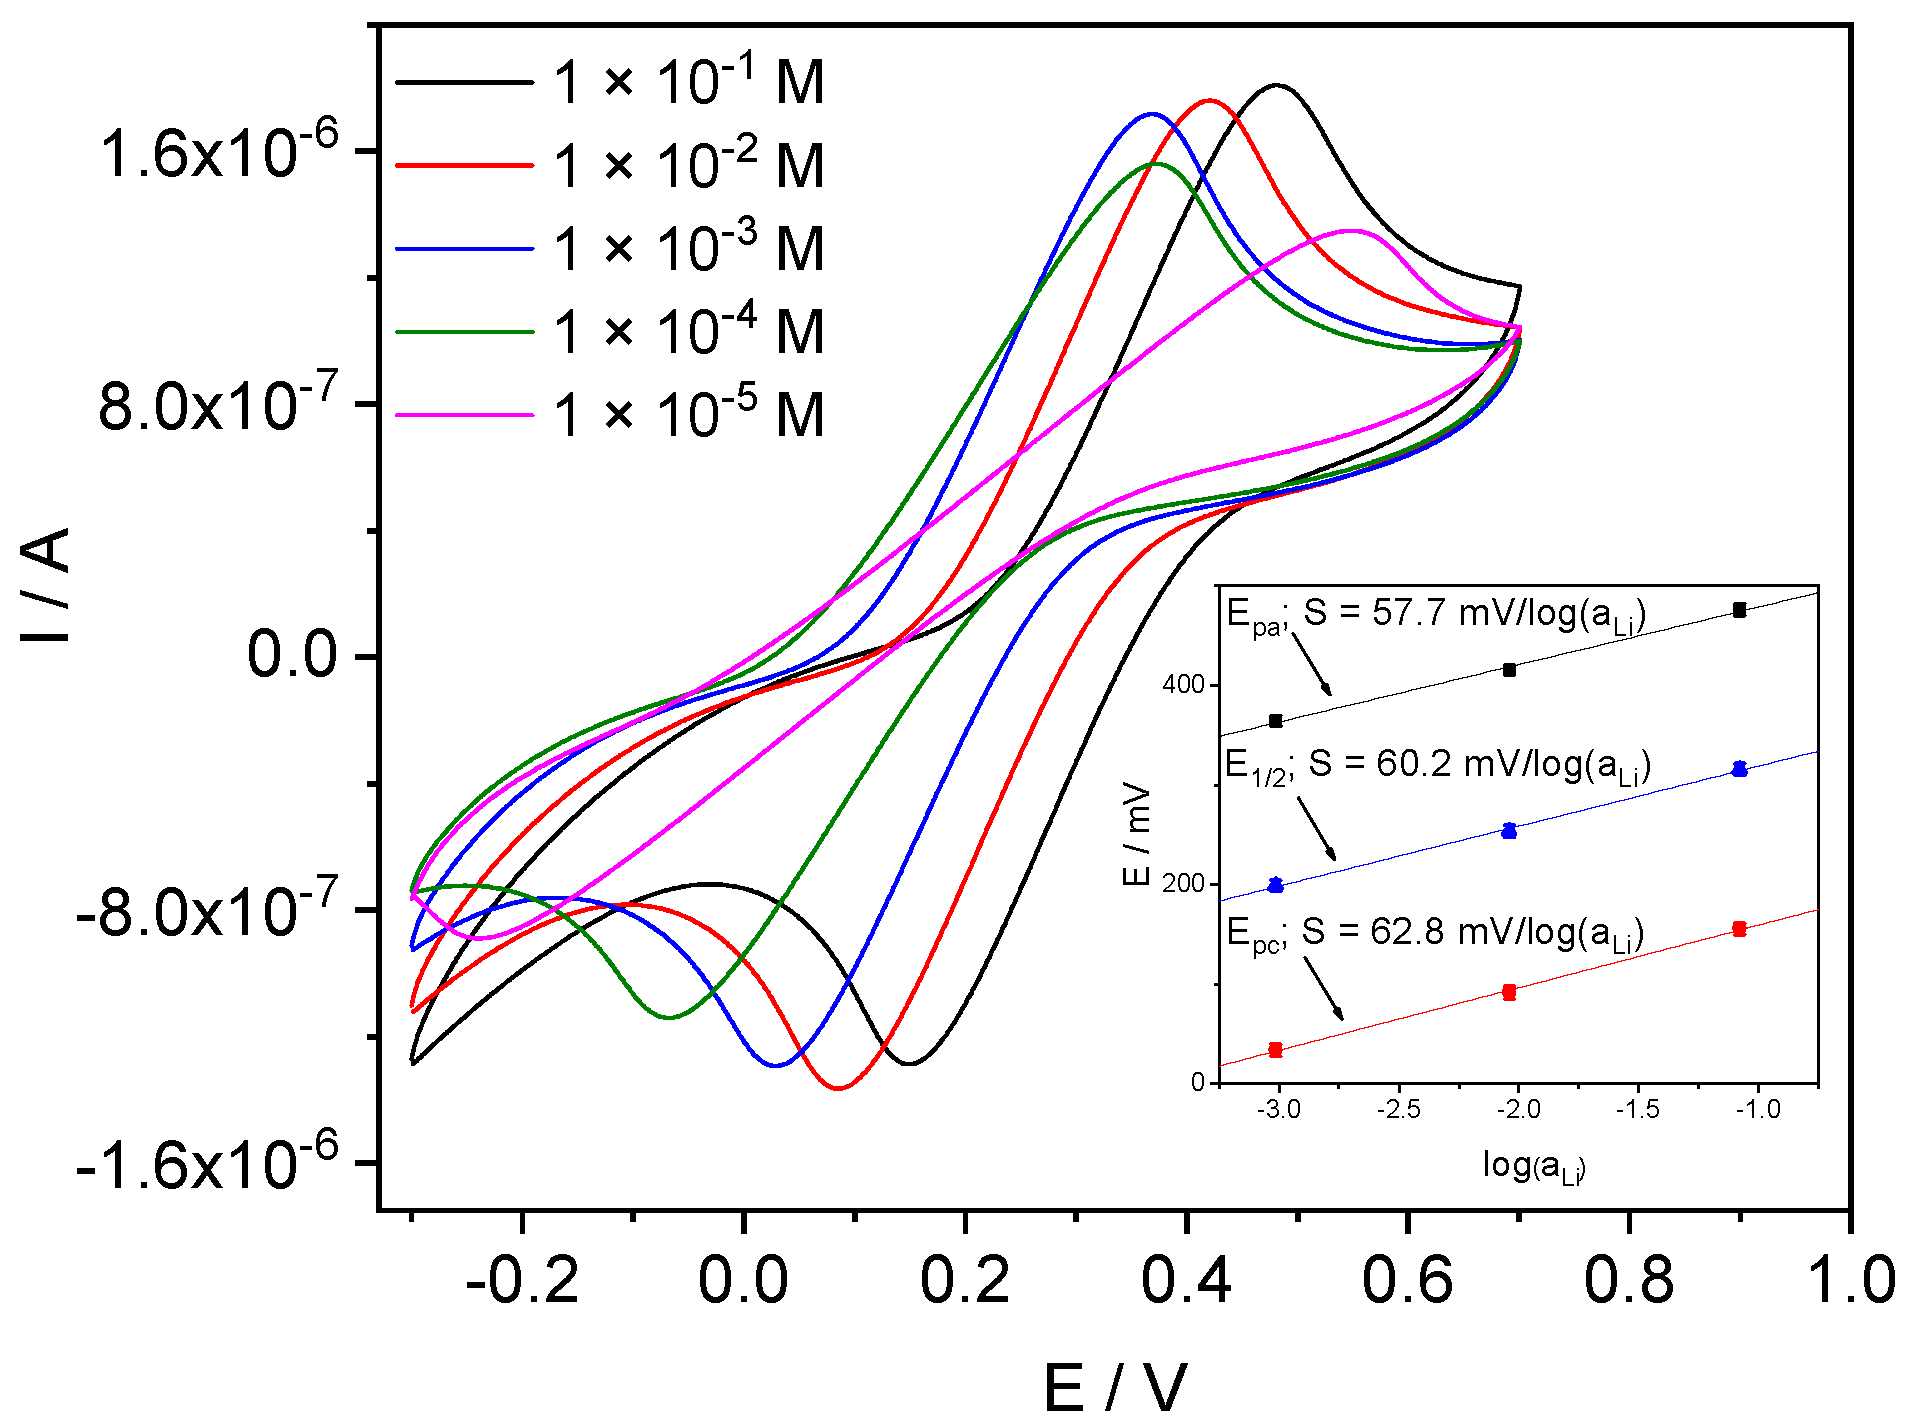
4.3.2. Li-ISE
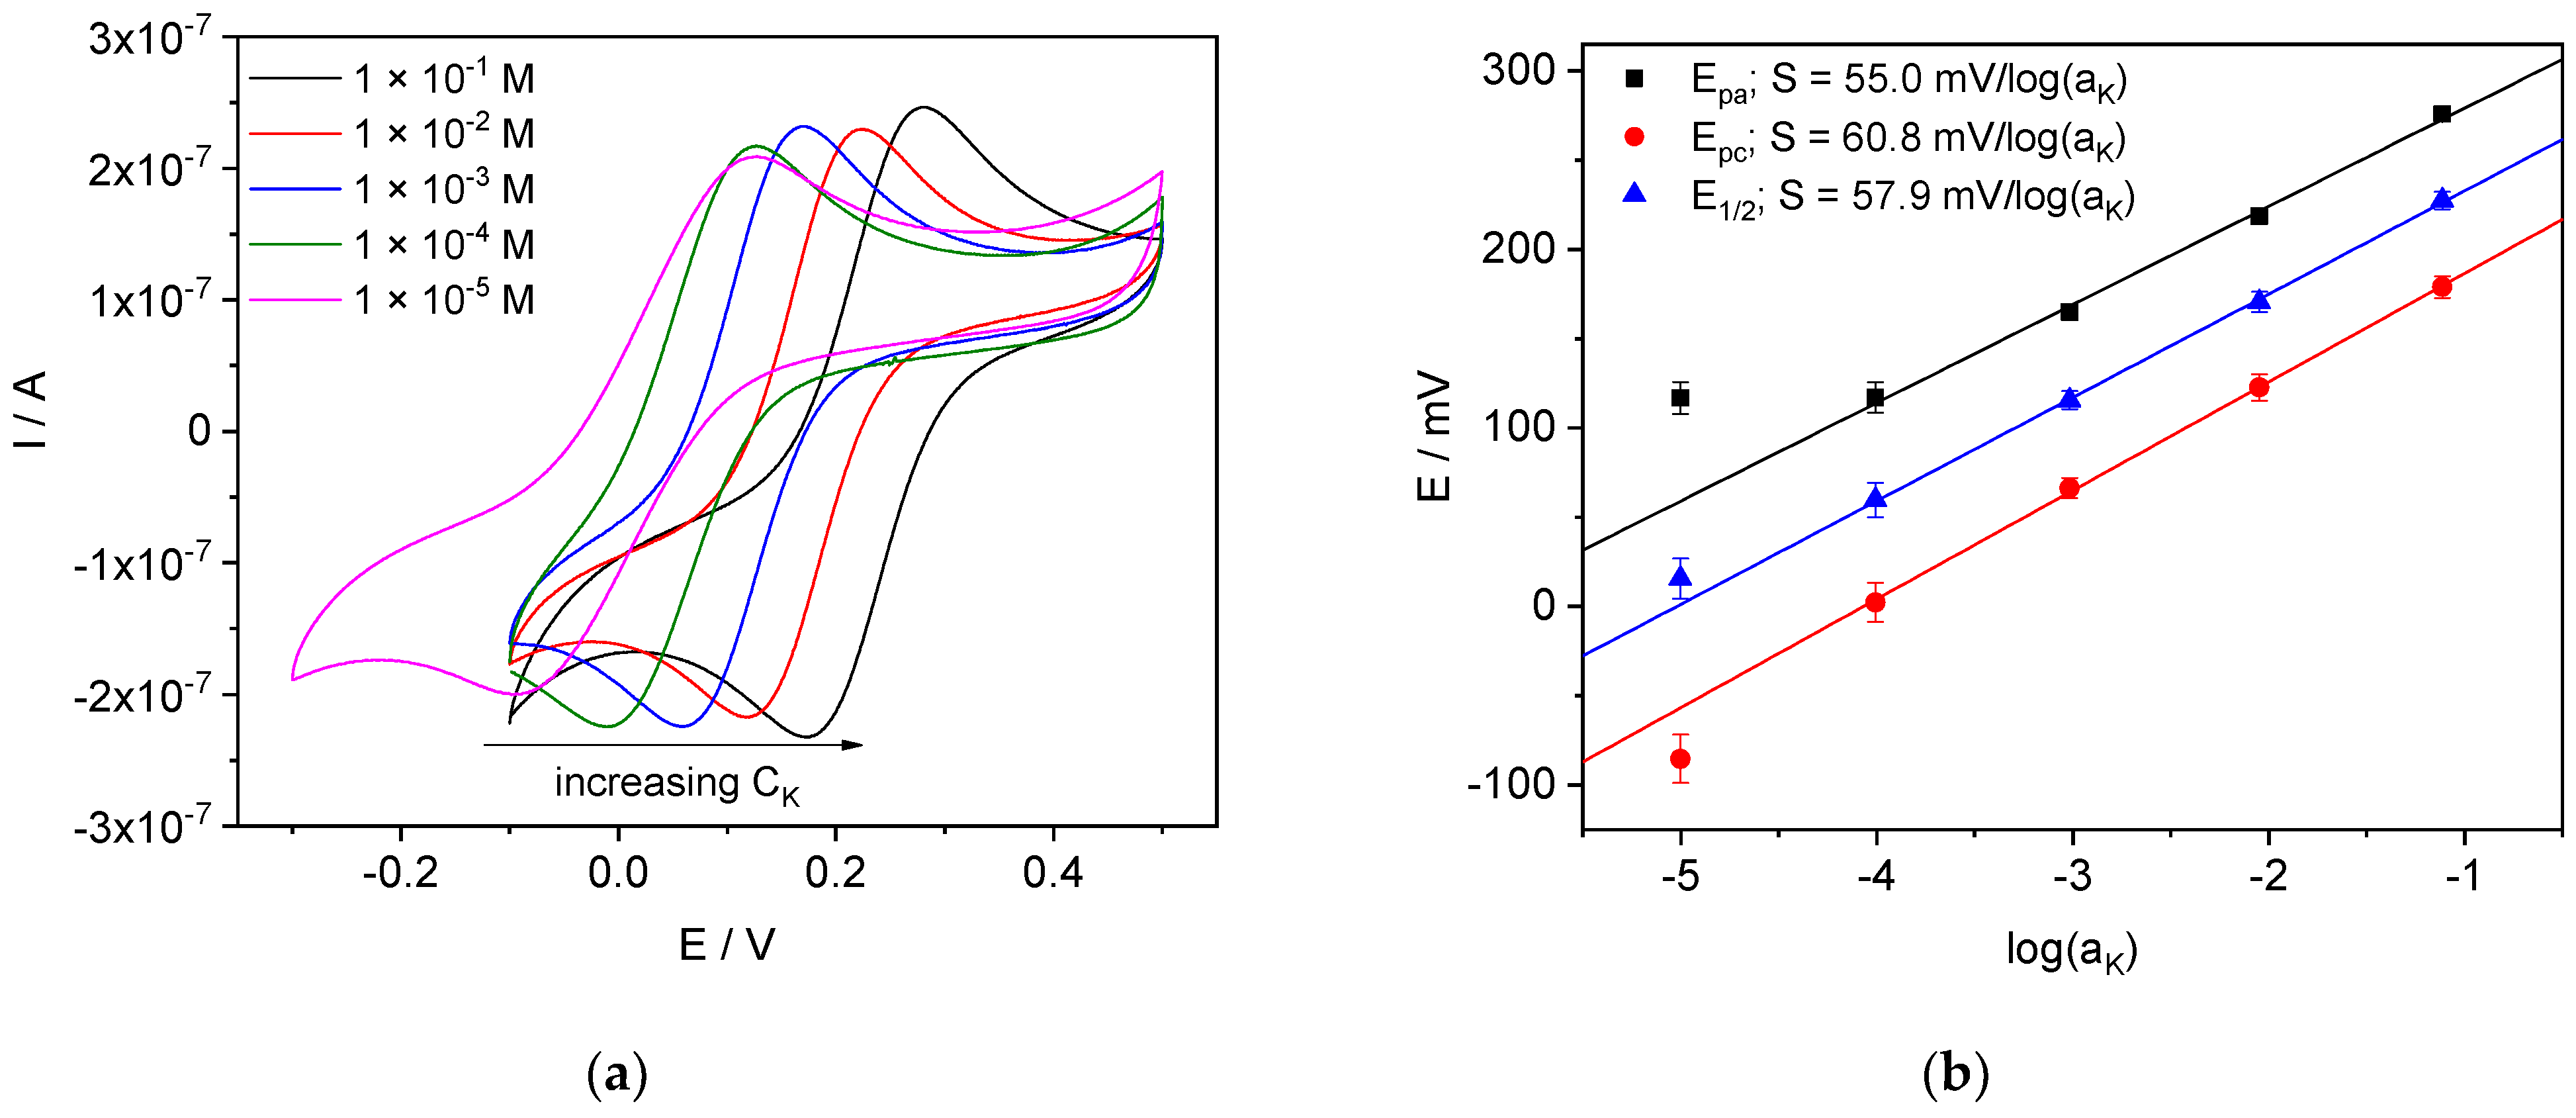
4.3.3. K-ISE
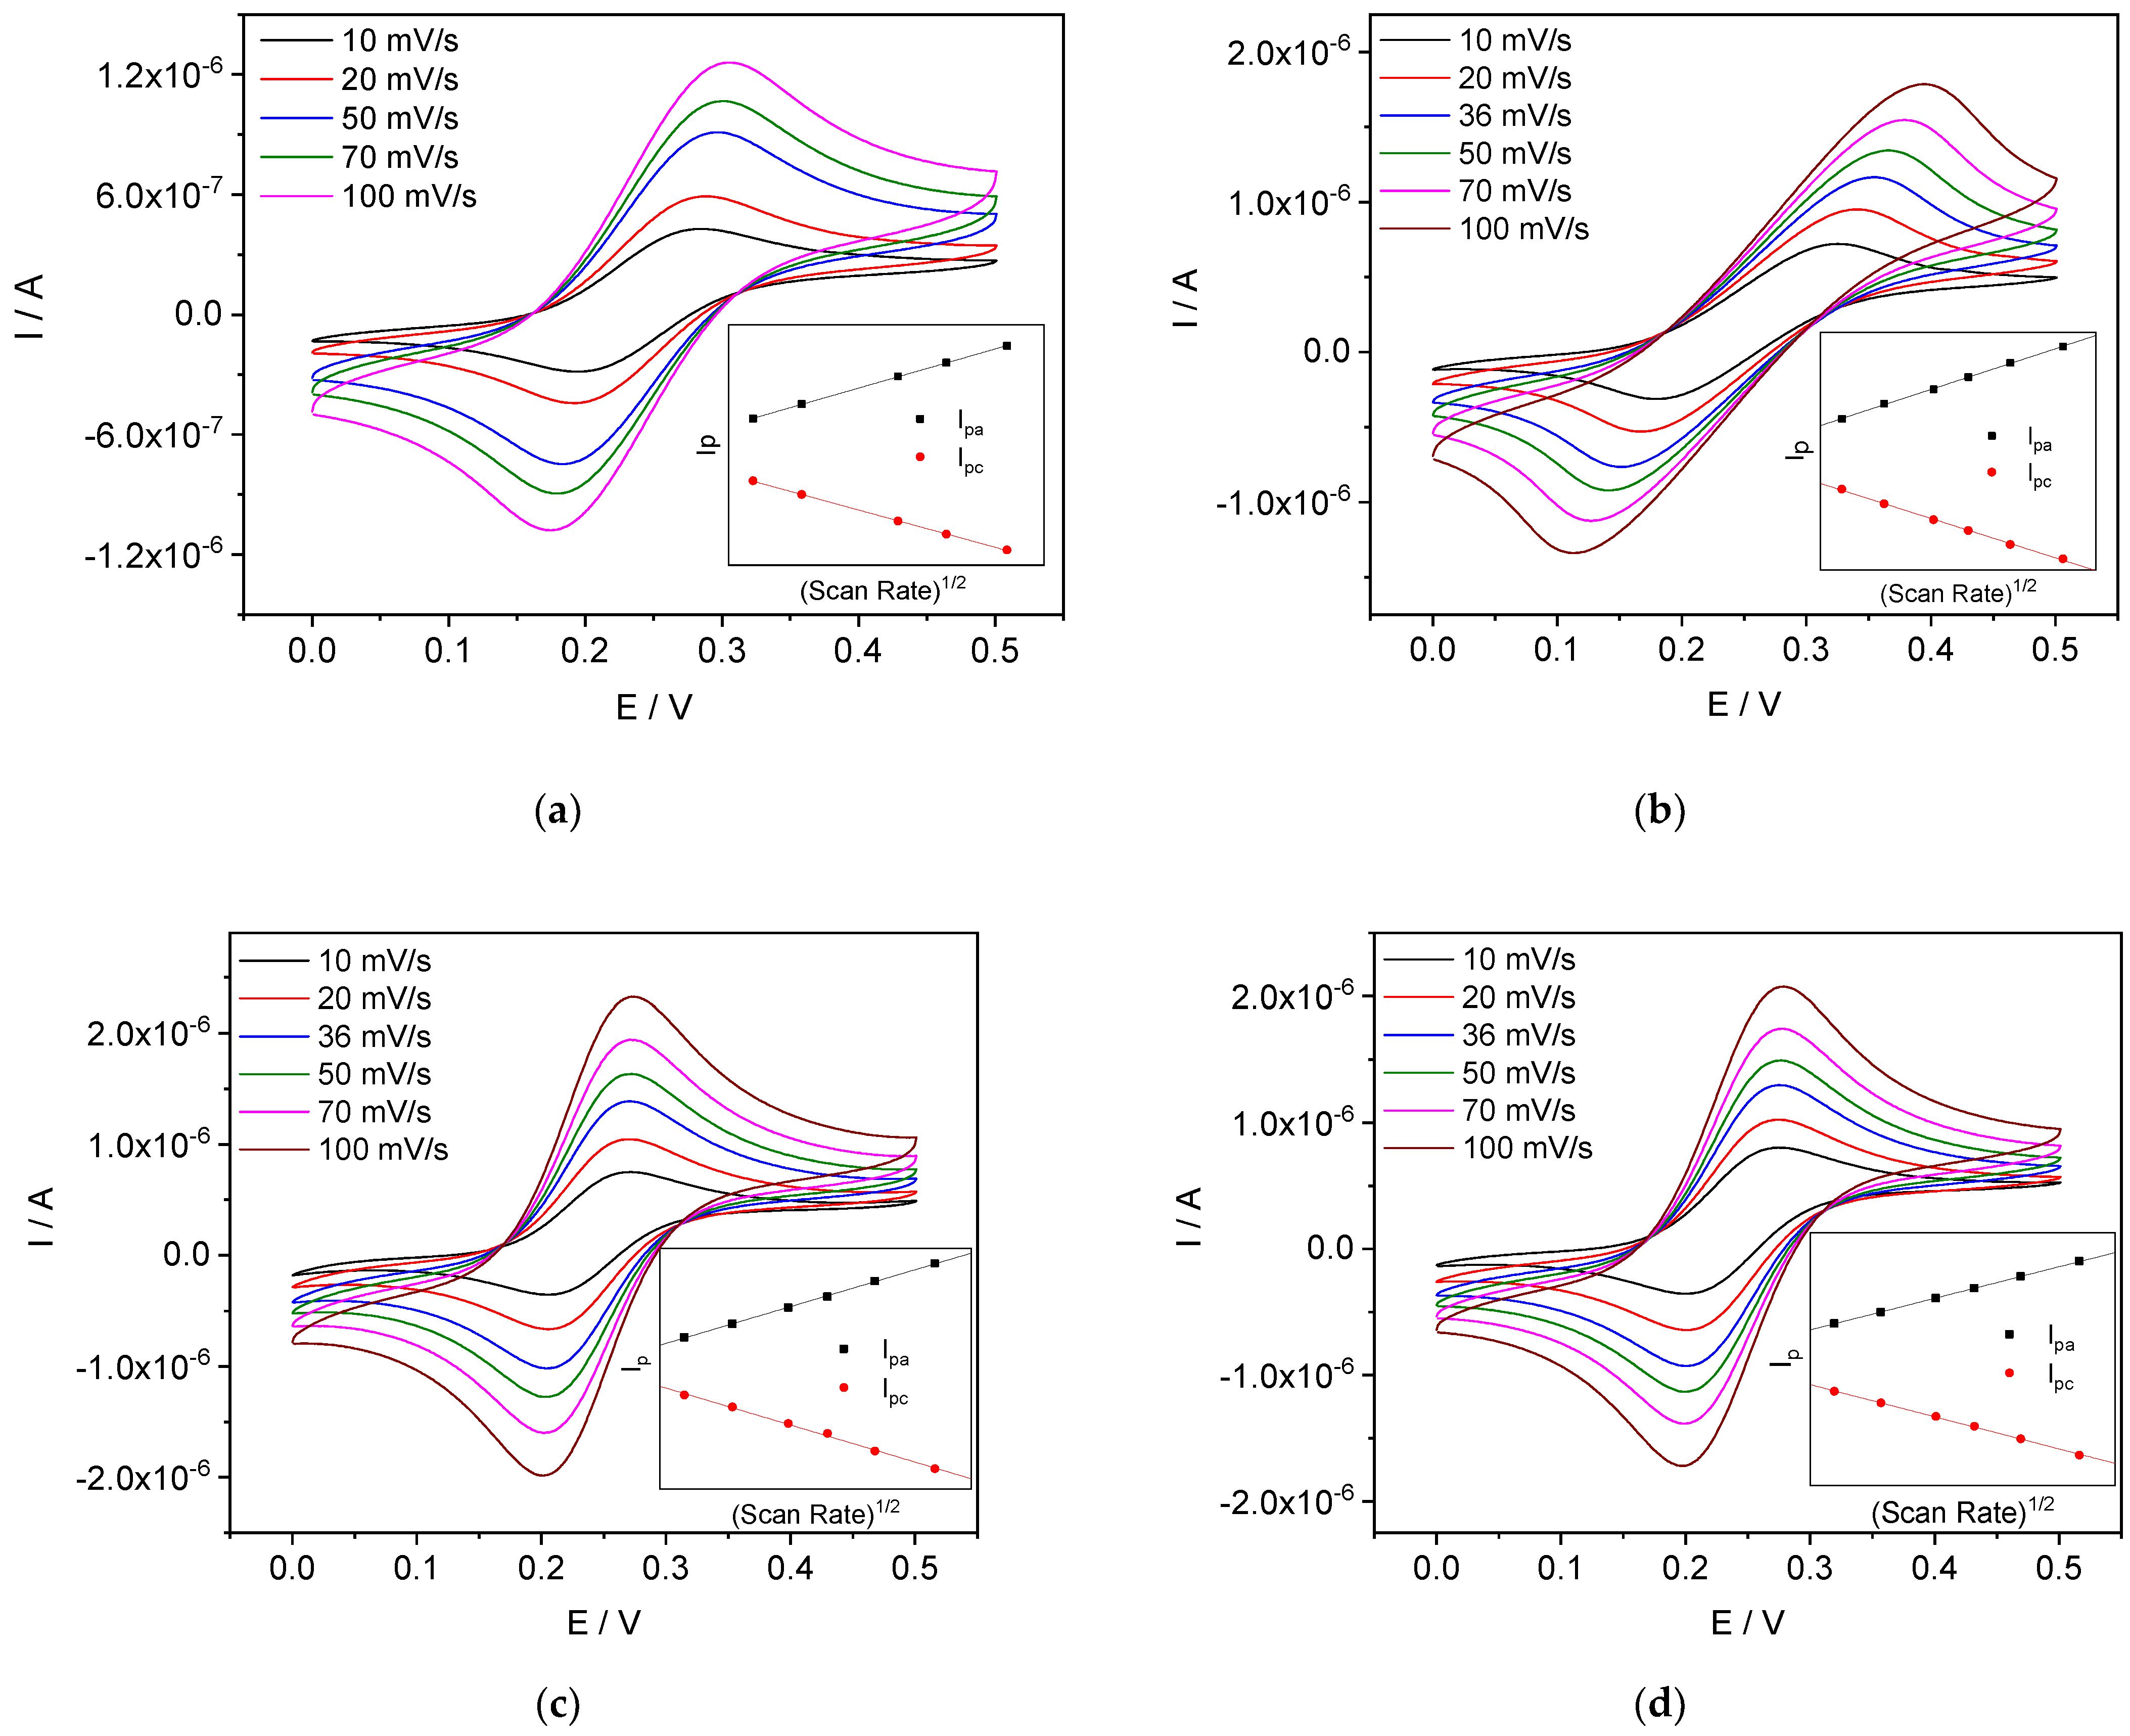
4.3.4. Scan Rate Dependence
5. Conclusions
Author Contributions
Funding
Institutional Review Board Statement
Informed Consent Statement
Data Availability Statement
Conflicts of Interest
References
- Zdrachek, E.; Bakker, E. Potentiometric Sensing. Anal. Chem. 2021, 93, 72–102. [Google Scholar] [CrossRef]
- Lewenstam, A. Routines and Challenges in Clinical Application of Electrochemical Ion-Sensors. Electroanalysis 2014, 26, 1171–1181. [Google Scholar] [CrossRef]
- Cuartero, M.; Parrilla, M.; Crespo, G.A. Wearable Potentiometric Sensors for Medical Applications. Sensors 2019, 19, 363. [Google Scholar] [CrossRef] [PubMed] [Green Version]
- Belugina, R.; Karpushchenko, E.; Sleptsov, A.; Protoshchak, V.; Legin, A.; Kirsanov, D. Developing non-invasive bladder cancer screening methodology through potentiometric multisensor urine analysis. Talanta 2021, 234, 122696. [Google Scholar] [CrossRef] [PubMed]
- Radu, A.; Radu, T.; Mcgraw, C.; Dillingham, P.; Anastasova-Ivanova, S.; Diamond, D. Ion selective electrodes in environmental analysis. J. Serb. Chem. Soc. 2013, 78, 1729–1761. [Google Scholar] [CrossRef] [Green Version]
- Ding, R.; Cheong, Y.H.; Ahamed, A.; Lisak, G. Heavy Metals Detection with Paper-Based Electrochemical Sensors. Anal. Chem. 2021, 93, 1880–1888. [Google Scholar] [CrossRef]
- Legin, A.; Smirnova, A.; Rudnitskaya, A.; Lvova, L.; Suglobova, E.; Vlasov, Y. Chemical sensor array for multicomponent analysis of biological liquids. Anal. Chim. Acta 1999, 385, 131–135. [Google Scholar] [CrossRef]
- Lvova, L.; Jahatspanian, I.; Mattoso, L.H.C.; Correa, D.S.; Oleneva, E.; Legin, A.; Di Natale, C.; Paolesse, R. Potentiometric E-Tongue System for Geosmin/Isoborneol Presence Monitoring in Drinkable Water. Sensors 2020, 20, 821. [Google Scholar] [CrossRef] [Green Version]
- Wang, X.; Lin, W.; Chen, C.; Kong, L.; Huang, Z.; Kirsanov, D.; Legin, A.; Wan, H.; Wang, P. Neural networks based fluorescence and electrochemistry dual-modal sensor for sensitive and precise detection of cadmium and lead simultaneously. Sens. Actuators B Chem. 2022, 366, 131922. [Google Scholar] [CrossRef]
- Khalil, S.; El-Beltagy, A.E.; El-Sharnouby, M.E. Potent Acrylamide Determination in Food Products Using Ion-Selective Electrode Technique. Membranes 2021, 11, 645. [Google Scholar] [CrossRef]
- Belugina, R.; Senchikhina, A.; Volkov, S.; Fedorov, A.; Legin, A.; Kirsanov, D. Quantification of phosphatides in sunflower oils using a potentiometric e-tongue. Anal. Methods 2022, 14, 3064–3070. [Google Scholar] [CrossRef]
- Rius-Ruiz, F.X.; Andrade, F.J.; Riu, J.; Rius, F.X. Computer-operated analytical platform for the determination of nutrients in hydroponic systems. Food Chem. 2014, 147, 92–97. [Google Scholar] [CrossRef] [PubMed]
- Kim, H.-J.; Kim, D.-W.; Kim, W.K.; Cho, W.-J.; Kang, C.I.K. PVC membrane-based portable ion analyzer for hydroponic and water monitoring. Comput. Electron. Agric. 2017, 140, 374–385. [Google Scholar] [CrossRef]
- Nadporozhskaya, M.; Kovsh, N.; Paolesse, R.; Lvova, L. Recent Advances in Chemical Sensors for Soil Analysis: A Review. Chemosensors 2022, 10, 35. [Google Scholar] [CrossRef]
- Vlasov, Y.G.; Legin, A.V.; Rudnitskaya, A.M. Electronic tongue: Chemical sensor systems for analysis of aquatic media. Russ. J. Gen. Chem. 2008, 78, 2532–2544. [Google Scholar] [CrossRef]
- Bondar, A.V.; Keresten, V.M.; Mikhelson, K.N. Ionophore-Based Ion-Selective Electrodes in Non-Zero Current Modes: Mechanistic Studies and the Possibilities of the Analytical Application. J. Anal. Chem. 2022, 77, 145–154. [Google Scholar] [CrossRef]
- Lindner, E.; Gyurcsanyi, R.E.; Buck, R.P. Tailored Transport through Ion-Selective Membranes for Improved Detection Limits and Selectivity Coefficients. Electroanalysis 1999, 11, 695–702. [Google Scholar] [CrossRef]
- Bedlechowicz, I.; Sokalski, T.; Lewenstam, A.; Maj-Zurawska, M. Calcium ion-selective electrodes under galvanostatic current control. Sens. Actuators B Chem. 2005, 108, 836–839. [Google Scholar] [CrossRef]
- Hofler, L.; Bedlechowicz, I.; Vigassy, T.; Gyurcsanyi, R.E.; Bakker, E.; Pretsch, E. Limitations of Current Polarization for Lowering the Detection Limit of Potentiometric Polymeric Membrane Sensors. Anal. Chem. 2009, 81, 3592–3599. [Google Scholar] [CrossRef] [Green Version]
- Peshkova, M.A.; Sokalski, T.; Mikhelson, K.N.; Lewenstam, A. Obtaining Nernstian Response of Ca2+-Selective Electrode in a Broad Concentration Range by Tuned Galvanostatic Polarization. Anal. Chem. 2008, 80, 9181–9187. [Google Scholar] [CrossRef]
- Lisak, G.; Sokalski, T.; Bobacka, J.; Harju, L.; Mikhelson, K.; Lewenstam, A. Tuned galvanostatic polarization of solid-state lead-selective electrodes for lowering of the detection limit. Anal. Chim. Acta 2011, 707, 1–6. [Google Scholar] [CrossRef]
- Peshkova, M.A.; Mikhelson, K.N. Solvent polymeric membrane ion-selective electrodes under galvanostatic control: Powerful tool for analysis of extremely diluted samples. Electrochim. Acta 2013, 110, 829–835. [Google Scholar] [CrossRef]
- Peshkova, M.A.; Koltashova, E.S.; Khripoun, G.A.; Mikhelson, K.N. Improvement of the upper limit of the ISE Nernstian response by tuned galvanostatic polarization. Electrochim. Acta 2015, 167, 187–193. [Google Scholar] [CrossRef]
- Hupa, E.; Vanamo, U.; Bobacka, J. Novel Ion-to-Electron Transduction Principle for Solid-Contact ISEs. Electroanalysis 2015, 27, 591–594. [Google Scholar] [CrossRef]
- Vanamo, U.; Hupa, E.; Yrjänä, V.; Bobacka, J. New Signal Readout Principle for Solid-Contact Ion-Selective Electrodes. Anal. Chem. 2016, 88, 4369–4374. [Google Scholar] [CrossRef]
- Han, T.; Vanamo, U.; Bobacka, J. Influence of Electrode Geometry on the Response of Solid-Contact Ion-Selective Electrodes when Utilizing a New Coulometric Signal Readout Method. ChemElectroChem 2016, 8, 2071–2077. [Google Scholar] [CrossRef]
- Han, T.; Mattinen, U.; Bobacka, J. Improving the sensitivity of solid-contact ion-selective electrodes by using coulometric signal transduction. ACS Sens. 2019, 4, 900–906. [Google Scholar] [CrossRef] [Green Version]
- Bondar, A.V.; Keresten, V.M.; Mikhelson, K.N. Registration of small (below 1%) changes of calcium ion concentration in aqueous solutions and in serum by the constant potential coulometric method. Sens. Actuators B Chem. 2022, 354, 131231. [Google Scholar] [CrossRef]
- Kraikaew, P.; Sailapu, S.K.; Bakker, E. Electronic control of constant potential capacitive readout of ion-selective electrodes for high precision sensing. Sens. Actuators B Chem. 2021, 344, 130282. [Google Scholar] [CrossRef]
- Bondar, A.; Mikhelson, K. Constant Potential Coulometric Measurements with Ca2+-Selective Electrode: Analysis Using Calibration Plot vs. Analysis Using the Charge Curve Fitting. Sensors 2022, 22, 1145. [Google Scholar] [CrossRef]
- Kim, Y.; Amemiya, S. Stripping Analysis of Nanomolar Perchlorate in Drinking Water with a Voltammetric Ion-Selective Electrode Based on Thin-Layer Liquid Membrane. Anal. Chem. 2008, 80, 6056–6065. [Google Scholar] [CrossRef] [PubMed]
- Zhang, J.; Harris, A.R.; Cattrall, R.W.; Bond, A.M. Voltammetric ion-selective electrodes for the selective determination of cations and anions. Anal. Chem. 2010, 82, 1624–1633. [Google Scholar] [CrossRef]
- Kim, Y.; Rodgers, P.J.; Ishimatsu, R.; Amemiya, S. Subnanomolar Ion Detection by Stripping Voltammetry with Solid-Supported Thin Polymeric Membrane. Anal. Chem. 2009, 81, 7262–7270. [Google Scholar] [CrossRef] [PubMed]
- Izadyar, A. Stripping voltammetry at the interface between two immiscible electrolyte solutions: A review paper. Electroanalysis 2018, 30, 2210–2221. [Google Scholar] [CrossRef]
- Jarolımova, Z.; Bosson, J.; Labrador, G.M.; Lacour, J.; Bakker, E. Ion Transfer Voltammetry at Thin Films Based on Functionalized Cationic Helicenes. Electroanalysis 2018, 30, 650–657. [Google Scholar] [CrossRef]
- Jarolımova, Z.; Bosson, J.; Labrador, G.M.; Lacour, J.; Bakker, E. Ion Transfer Voltammetry in Polyurethane Thin Films Based on Functionalised Cationic [6] Helicenes for Carbonate Detection. Electroanalysis 2018, 30, 1378–1385. [Google Scholar] [CrossRef] [Green Version]
- Crespo, G.A.; Cuartero, M.; Bakker, E. Thin Layer Ionophore-Based Membrane for Multianalyte Ion Activity Detection. Anal. Chem. 2015, 87, 7729–7737. [Google Scholar] [CrossRef]
- Greenawalt, P.J.; Amemiya, S. Voltammetric Mechanism of Multiion Detection with Thin Ionophore-Based Polymeric Membrane. Anal. Chem. 2016, 88, 5827–5834. [Google Scholar] [CrossRef] [Green Version]
- Cuartero, M.; Crespo, G.A.; Bakker, E. Ionophore-Based Voltammetric Ion Activity Sensing with Thin Layer Membranes. Anal. Chem. 2016, 88, 1654–1660. [Google Scholar] [CrossRef]
- Yuan, D.; Cuartero, M.; Crespo, G.A.; Bakker, E. Voltammetric Thin-Layer Ionophore-Based Films: Part 1. Experimental Evidence and Numerical Simulations. Anal. Chem. 2017, 89, 586–594. [Google Scholar] [CrossRef]
- Yuan, D.; Cuartero, M.; Crespo, G.A.; Bakker, E. Voltammetric Thin-Layer Ionophore-Based Films: Part 2. Semi-Empirical Treatment. Anal. Chem. 2017, 89, 595–602. [Google Scholar] [CrossRef]
- Cuartero, M.; Crespo, G.A.; Bakker, E. Polyurethane Ionophore-Based Thin Layer Membranes for Voltammetric Ion Activity Sensing. Anal. Chem. 2016, 88, 5649–5654. [Google Scholar] [CrossRef] [PubMed]
- Zdrachek, E.; Bakker, E. Electrochemically Switchable Polymeric Membrane Ion-Selective Electrodes. Anal. Chem. 2018, 90, 7591–7599. [Google Scholar] [CrossRef] [PubMed]
- Mao, C.; Yuan, D.; Wang, L.; Bakker, E. Separating boundary potential changes at thin solid contact ion transfer voltammetric membrane electrodes. J. Electroanal. Chem. 2021, 880, 114800. [Google Scholar] [CrossRef]
- Horvath, V.; Horvai, G. Cyclic voltammetric experiments with plasticized PVC membranes. Anal. Chim. Acta 1993, 273, 145–152. [Google Scholar] [CrossRef]
- Ortuno, J.A.; Serna, C.; Molina, A.; Torralba, E. Ion transfer square wave voltammetry of ionic liquid cations with a solvent polymeric membrane ion sensor. Electroanalysis 2009, 21, 2297–2302. [Google Scholar] [CrossRef]
- Ishimatsu, R.; Izadyar, A.; Kabagambe, B.; Kim, Y.; Kim, J.; Amemiya, S. Electrochemical Mechanism of Ion-Ionophore Recognition at Plasticized Polymer Membrane/Water Interfaces. J. Am. Chem. Soc. 2011, 133, 16300–16308. [Google Scholar] [CrossRef] [PubMed]
- Morf, W.E. The Principles of Ion-Selective Electrodes and of Membrane Transport; Akademiai Kiado: Budapest, Hungary, 1981; pp. 291–293. [Google Scholar]
- Bakker, E.; Meruva, R.K.; Pretsch, E.; Meyerhoff, M. Selectivity of Polymer Membrane-Based Ion-Selective Electrodes: Self-Consistent Model Describing the Potentiometric Response in Mixed Ion Solutions of Different Charge. Anal. Chem. 1994, 66, 3021–3030. [Google Scholar] [CrossRef] [PubMed]
- Umezawa, Y.; Umezawa, K.; Sato, H. Selectivity coefficients for ion-selective electrodes: Recommended methods for reporting KA,Bpot values (Technical Report). Pure Appl. Chem. 1995, 67, 507–518. [Google Scholar] [CrossRef]
- Bülmann, P.; Pretsch, E.; Bakker, E. Carrier-Based Ion-Selective Electrodes and Bulk Optodes. 2. Ionophores for Potentiometric and Optical Sensors. Chem. Rev. 1998, 98, 1593–1687. [Google Scholar] [CrossRef]
- Kondratyeva, Y.O.; Solovyeva, E.V.; Khripoun, G.A.; Mikhelson, K.N. Non-constancy of the bulk resistance of ionophore-based ion-selective electrode: A result of electrolyte co-extraction or of something else? Electrochim. Acta 2018, 259, 458–465. [Google Scholar] [CrossRef]
- Ivanova, A.; Mikhelson, K. Electrochemical Properties of Nitrate-Selective Electrodes: The Dependence of Resistance on the Solution Concentration. Sensors 2018, 18, 2062. [Google Scholar] [CrossRef] [PubMed] [Green Version]
- Kondratyeva, Y.O.; Solovyeva, E.V.; Khripoun, G.A.; Mikhelson, K.N. Paradox of the variation of the bulk resistance of potassium ion-selective electrode membranes within nernstian potentiometric response range. Russ. J. Electrochem. 2019, 55, 1118–1126. [Google Scholar] [CrossRef]
- Kalinichev, A.V.; Solovyeva, E.V.; Ivanova, A.R.; Khripoun, G.A.; Mikhelson, K.N. Non-constancy of the bulk resistance of ionophore-based Cd2+-selective electrode: A correlation with the water uptake by the electrode membrane. Electrochim. Acta 2020, 334, 135541. [Google Scholar] [CrossRef]
- Solovyeva, E.V.; Lu, H.; Khripoun, G.A.; Mikhelson, K.N.; Kazarian, S.G. In situ ATR-FTIR spectroscopic imaging of PVC, plasticizer and water in solvent-polymeric ion-selective membrane containing Cd2+-selective neutral ionophore. J. Membr. Sci. 2020, 619, 118798. [Google Scholar] [CrossRef]
- Keresten, V.; Solovyeva, E.; Mikhelson, K. The Origin of the Non-Constancy of the Bulk Resistance of Ion-Selective Electrode Membranes within the Nernstian Response Range. Membranes 2021, 11, 344. [Google Scholar] [CrossRef]
- Li, X.; Petrovic’, S.; Harrison, D.J. A novel spectroscopic method to image H2O distribution in ion-selective membranes. Sens. Actuators B Chem. 1990, 1, 275–280. [Google Scholar] [CrossRef]
- Li, X.; Harrison, D.J. Measurement of Concentration Profiles inside a Nitrite Ion Selective Electrode Membrane. Anal. Chem. 1991, 63, 2168–2174. [Google Scholar] [CrossRef]
- Chan, A.D.C.; Li, X.; Harrison, D.J. Evidence for a Water-Rich Surface Region in Poly(viny1 chloride)-Based Ion-Selective Electrode Membranes. Anal. Chem. 1992, 64, 2512–2517. [Google Scholar] [CrossRef]
- Chan, A.D.C.; Harrison, D.J. NMR Study of the State of Water in Ion-Selective Electrode Membranes. Anal. Chem. 1993, 65, 32–36. [Google Scholar] [CrossRef]
- Li, Z.; Li, X.; Petrović, S.; Harrison, D.J. Dual-Sorption Model of Water Uptake in Poly(vinyl chloride)-Based Ion-Selective Membranes: Experimental Water Concentration and Transport Parameters. Anal. Chem. 1996, 68, 1717–1725. [Google Scholar] [CrossRef]
- Li, Z.; Li, X.; Rothmaier, M.; Harrison, D.J. Comparison of numerical modeling of water uptake in poly(vinylchloride)-based ion-selective membranes with experiment. Anal. Chem. 1996, 68, 1726–1734. [Google Scholar] [CrossRef]
- Zwickl, T.; Schneider, B.; Lindner, E.; Sokalski, T.; Schaller, U.; Pretsch, E. Chromoionophore-mediated imaging of water transport in ion-selective membranes. Anal. Sci. 1998, 14, 57–61. [Google Scholar] [CrossRef] [Green Version]
- Trouillon, R.; Gijs, M.A.M. Delayed voltammetric with respect to amperometric electrochemical detection of concentration changes in microchannels. Lab Chip 2014, 14, 2929–2940. [Google Scholar] [CrossRef]
- Mishyn, V.; Aspermair, P.; Leroux, Y.; Happy, H.; Knoll, W.; Boukherroub, R.; Szunerits, S. “Click” Chemistry on Gold Electrodes Modified with Reduced Graphene Oxide by Electrophoretic Deposition. Surfaces 2019, 2, 193–204. [Google Scholar] [CrossRef] [Green Version]
- Glasscott, M.W.; Verber, M.D.; Hall, J.R.; Pendergast, A.D.; McKinney, C.J.; Dick, J.E. Sweep Stat: A Build-It-Yourself, Two-Electrode Potentiostat for Macroelectrode and Ultramicroelectrode Studies. J. Chem. Educ. 2020, 97, 265–270. [Google Scholar] [CrossRef]


| Ion | Neutral Ionophore | Ion Exchanger | Plasticizer | PVC | Background Electrolyte |
|---|---|---|---|---|---|
| K+ | Valinomycin 5.4%, 0.08 m | KClTPB 1.2%, 0.04 m | oNPOE 60.4% | 30.2% | ETH 500 2.8%, 0.04 m |
| Li+ | Li-ionophore VIII 2.6%, 0.05 m | NaTFPB 1.4%, 0.025 m | DOS 64.0% | 32.0% | - |
| Ca2+ | ETH 1001 0.9%, 0.02 m | NaTFPB 0.6%, 0.01 m | oNPOE 64.7% | 32.3% | ETH 500 1.5%, 0.02 m |
| Ion | Thickness, µm | Resistance, Ω |
|---|---|---|
| K+ | 300 ± 30 | (1.28 ± 0.10) × 104 |
| Li+ | 90 ± 10 | (3.21 ± 0.86) × 104 |
| Ca2+ | 110 ± 10 | (1.26 ± 0.17) × 104 |
Publisher’s Note: MDPI stays neutral with regard to jurisdictional claims in published maps and institutional affiliations. |
© 2022 by the authors. Licensee MDPI, Basel, Switzerland. This article is an open access article distributed under the terms and conditions of the Creative Commons Attribution (CC BY) license (https://creativecommons.org/licenses/by/4.0/).
Share and Cite
Keresten, V.; Mikhelson, K. Voltammetric Ion Sensing with Ionophore-Based Ion-Selective Electrodes Containing Internal Aqueous Solution, Improving Lifetime of Sensors. Membranes 2022, 12, 1048. https://doi.org/10.3390/membranes12111048
Keresten V, Mikhelson K. Voltammetric Ion Sensing with Ionophore-Based Ion-Selective Electrodes Containing Internal Aqueous Solution, Improving Lifetime of Sensors. Membranes. 2022; 12(11):1048. https://doi.org/10.3390/membranes12111048
Chicago/Turabian StyleKeresten, Valentina, and Konstantin Mikhelson. 2022. "Voltammetric Ion Sensing with Ionophore-Based Ion-Selective Electrodes Containing Internal Aqueous Solution, Improving Lifetime of Sensors" Membranes 12, no. 11: 1048. https://doi.org/10.3390/membranes12111048