Article

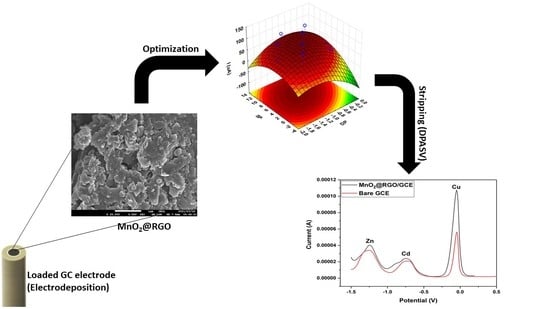
MnO2@Reduced Graphene Oxide Nanocomposite-Based Electrochemical Sensor for the Simultaneous Determination of Trace Cd(II), Zn(II) and Cu(II) in Water Samples

by
Siyamthanda Hope Mnyipika
1,
Tshimangadzo Saddam Munonde
1,2,* and
Philiswa Nosizo Nomngongo
1,2,3,*
1
Department of Chemical Sciences, University of Johannesburg, Doornfontein Campus, Doornfontein 2028, South Africa
2
Department of Science and Innovation (DSI)/National Research Foundation (NRF) South African Research Chair (SARChI), Nanotechnology for Water, University of Johannesburg, Doornfontein 2028, South Africa
3
Department of Science and Innovation (DSI)/Mintek Nanotechnology Innovation Centre, University of Johannesburg, Doornfontein 2028, South Africa
*
Authors to whom correspondence should be addressed.
Membranes 2021, 11(7), 517; https://doi.org/10.3390/membranes11070517
Submission received: 21 June 2021 / Revised: 2 July 2021 / Accepted: 4 July 2021 / Published: 9 July 2021
(This article belongs to the Special Issue Electrochemical Sensors Based on Nanomaterial Layers)

Abstract

:
The rapid detection of trace metals is one of the most important aspect in achieving environmental monitoring and protection. Electrochemical sensors remain a key solution for rapid detection of heavy metals in environmental water matrices. This paper reports the fabrication of an electrochemical sensor obtained by the simultaneous electrodeposition of MnO2 nanoparticles and RGO nanosheets on the surface of a glassy carbon electrode. The successful electrodeposition was confirmed by the enhanced current response on the cyclic voltammograms. The XRD, HR-SEM/EDX, TEM, FTIR, and BET characterization confirmed the successful synthesis of MnO2 nanoparticles, RGO nanosheets, and MnO2@RGO nanocomposite. The electrochemical studies results revealed that MnO2@RGO@GCE nanocomposite considerably improved the current response on the detection of Zn(II), Cd(II) and Cu(II) ions in surface water. These remarkable improvements were due to the interaction between MnO2 nanomaterials and RGO nanosheets. Moreover, the modified sensor electrode portrayed high sensitivity, reproducibility, and stability on the simultaneous determination of Zn(II), Cd(II), and Cu(II) ions. The detection limits of (S/N = 3) ranged from 0.002–0.015 μg L−1 for the simultaneous detection of Zn(II), Cd(II), and Cu(II) ions. The results show that MnO2@RGO nanocomposite can be successfully used for the early detection of heavy metals with higher sensitivity in water sample analysis.

Graphical Abstract

1. Introduction

The key challenge in environmental pollution remediation is the early detection of the contaminants. Superior remediation outcomes are directly acclimated to the early detection of contaminants. Thus, enabling the application of effective treatment processes that reduces cost amongst other resources [1,2]. Consequently, electrochemical sensors can detect various electroactive compounds by providing specific responses to various analytes by generating Faraday currents at different potentials [3]. Heavy metals such as copper (Cu), cadmium (Cd), and zinc (Zn), amongst others, are electroactive materials that are suitable for electrochemical detection. Evidently, trace amounts below the maximum recommended levels by the world Health Organization (WHO), copper and zinc, amongst others, play an important role in living organisms as they are essential for the metabolism related maintenance [1,4]. However, the excessive levels of these heavy metals beyond the WHO permitted levels can cause serious environmental and human health effects [5]. For instance, water containing Cu beyond the prescribed limit of 1.3 mg L−1 may cause lung cancer and liver damage in human beings [6]. Cadmium, on the other hand, is utilized in many processes such as batteries and pigments, thus leaching into the water systems occurs after the disposal of the waste or the final products. However, consuming water that has significant amounts of Cd, may result in the accumulation in the human body, thus causing negative effects such as blood pressure complications and kidney [7,8]. Zinc is an important element with significant health benefits at trace levels, but accumulates when exceeding recommended levels, as it is non-biodegradable. Nausea, diarrhea, depression, lethargy, seizures, and a short-term metal-fume fever are some of the effects from ingesting water contaminated with excess Zn [9]. Therefore, due to the serious hazardous effects of heavy metal ions on human health and the toxicity to the ecosystem, it is important to develop a simple and highly sensitive electrochemical method for the early detection of the studied heavy metals, to improve the quality of the environment and human life.
Significant progress has been made with various analytical techniques such as flame atomic absorption spectrometry (FAAS) [10], electrothermal atomic absorption spectrometry (ETAAS) [11], inductively coupled plasma optical emission spectrometry (ICP-OES) [12], and inductively coupled plasma optical mass spectrometry (ICP-MS) [13], on the determination of various heavy metals in different matrices. However, most of the above-mentioned methods have major disadvantages, such as complexity, expensive, time consuming, bulky, require complicate pretreatment, and inconvenient for onsite and in situ analysis [14]. Compared with the abovementioned methods, electrochemical techniques have attracted great interest on the detection of heavy metal ions due to their remarkable sensitivity, portability, and low cost [1,15,16]. For this reason, there is an ongoing research on the development of rapid and friendly-user techniques for trace heavy metals detection suitable for in situ monitoring assays [17]. Among the different electrochemical techniques, stripping voltametric methods are the most reported for heavy metals detection due to their excellent detection limits, sensitivity, ability to determine multielement, and relatively low-cost instrumentation [18,19].
The performance of an electrochemical technique is strongly influenced by the working electrode material. For several decades, electrochemical stripping methods were associated with the use of working mercury electrodes due to their wide cathodic potential range [20]. However, due to the toxicity of mercury, alternative electrodes such as glassy carbon electrode (GCE), amongst others, have been used for electrochemical determination of heavy metals [21]. The main advantages of GCE electrodes are that they are environmentally friendly, cheap, negligible toxicity, analytical properties are comparable to those of mercury electrodes and can be easily modified [22]. Subsequently, some interfering species and impurities from aqueous samples tend to accumulate on the surface of the bare electrode due to their hydrophobic nature or other affinities toward electrode [23]. Therefore, to minimize the limitations that are encountered on the use of GC electrodes for the detection of different analytes, different nanomaterials or nanocomposites have been used to modify the GC electrodes [24,25,26,27,28,29]. Tuning the composition, structure and morphology of the nanomaterials/nanocomposites improves surface properties of the electrodes, thus increasing their sensing element [30,31].
Thus, the aim of the present study was to utilize a GC electrode modified with MnO2@RGO nanocomposite for the sensitive simultaneous determination of Cd, Cu, and Zn in surface water using differential pulse anodic stripping voltammetry (DPASV). The MnO2 nanomaterials were selected due to their low toxicity, inexpensive, and high electrochemical activity [32], whereas RGO nanosheets were selected due to their high electrical conductivity, surface area, and mechanical properties [33]. The factors affecting the electrochemical determination of the selected analytes were optimized using a central composite design. Additionally, the effect interfering ions, precisions (repeatability and reproducibility), and the accuracy of the developed electrochemical sensor were also investigated.

2. Materials and Methods

2.1. Reagents and Materials

All reagents and chemicals were of analytical reagent grade and doubly distilled water was used in all the experiments. Graphite flakes, potassium permanganate (KMnO4), sulphuric acid (H2SO4), phosphoric acid (H3PO4), hydrochloric acid (HCl), hydrogen peroxide (H2O2), polyvinyl alcohol (PVA), potassium chloride (KCl), hexanol, and absolute ethanol were purchased from Sigma-Aldrich (St. Louis, MO, USA). Spectrascan standard stock solutions of Cd, Cu, and Zn (1000 mg L−1, Teknolab, Norway) were used to prepare the working standard solutions for the quantification of analyte concentrations in model solutions. Acetate buffer (1.0 mol L−1, pH 5) was used as a supporting electrolyte.

2.2. Instrumentation

Electrochemical measurement such as cyclic voltammetry (CV), differential pulse anodic stripping voltammetry (DPASV), and electrochemical impedance spectroscopy (EIS) were performed using a μ-Autolab TYPE III conventional three-electrode system driven by the NOVA software (Version 1.8). A modified glassy carbon electrode was employed as a working electrode and a platinum wire as the counter electrode and Ag/AgCl/KCl (3 mol L−1) reference electrode. Electrochemical measurements were performed at room temperature. All pH measurements were done using H1 9811-5, (HANNA Instruments, Smithfield, RI, USA) pH meter supplied with a combined electrode. The morphology, nano structure and particle size of the material were examined using the transmission electron microscopy (TEM, JEM-2100, JEOL, Tokyo, Japan) and scanning electron microscopy (SEM, TESCAN VEGA 3 XMU, LMH instrument (Czech Republic) coupled with energy dispersive X-ray spectroscopy (EDS) for elemental composition analysis at an accelerating voltage of 20 kV. Infrared spectra were recorded (4000–400 cm−1), using a Perkin Elmer spectrum 100 Fourier transform infrared spectrometer (Waltham, MA, USA). The XRD measurements were done on a Rigaku Ultima IV X-ray diffractometer using a Cu-Kα radiation (λ = 0.15406 nm). BET measurements were performed on a Tristar II (Micromeritics, Norcross, GA, USA) after the samples were degassed at 77 °C for 16.5 h. All the BET surface area, pore size, and volume were measured using nitrogen at 77 K.

2.3. Preparation of Reduced Graphene Oxide (RGO)

Graphene oxide (GO) was initially prepared using the modified Hummers’ method [34,35]. Briefly, H2SO4 and H3PO4 were mixed in a 9:1 volume ratio (360:40 mL) and stirred in an ice bath for 30 min. Graphite flakes (3.06 g) and KMnO4 (18.21 g) were slowly added to the mixing solution under stirring. The mixture was transferred to an oil bath and heated to 85 °C for 30 min. Then, 50 mL of deionized water was added to the mixture, which was maintained under stirring at the same conditions for 60 min. The mixture was placed in an ice bath, and 150 mL of deionized water and 20 mL of H2O2 were slowly added to terminate the reaction. An exothermic reaction occurred, and the solution was then allowed to cool down. The resulting solution was diluted with 1 mol L−1 HCl solution and centrifuged at 6000 rpm for 20 min. The supernatant was removed, and the residuals were washed several times with deionized water until a neutral pH was obtained (pH 7.05). Finally, the prepared samples were dried in an oven at 80 °C for 12 h. The obtained GO was thermally exfoliated by annealing in a muffle furnace at 500 °C at a heating rate of 2 °C min−1 for 2 h and the furnace was allowed to cool to 35 °C. Thus, GO was successfully converted to RGO [35].

2.4. Preparation of Manganese Oxide Nanoparticles (MnO2)

The synthesis of MnO2 nanoparticles (NP) followed a previously modified method [36]. Typically, 6 mL of 0.5 mol L−1 KMnO4 solution was added into 100 mL of the initially prepared ethanol: deionized water (50 mL:50 mL; 1:1) mixture solvent at room temperature. The mixture was stirred for 30 min before a 10% H2O2 (10 mL) and polyvinyl alcohol (PVA) (10 mL) were added, forming a brown precipitate. The supernatant was discarded, and the collected brown precipitate was sonicated with a mixture of ethanol (20 mL) and hexanol (20 mL) to remove the PVA. The precipitate was then washed several times with deionized water and a brown powder obtained was dried at 80 °C in an oven.

2.5. Preparation of the MnO2@RGO/GCE Modified Electrode

The MnO2@RGO/GCE modified electrode was fabricated using an electrodeposition method. Initially, the bare GCE was polished successively to a mirror surface using 1.0, 0.3, and 0.05 µm alumina slurries, and then ultrasonically cleaned in deionized water, anhydrous ethanol, and deionized water for 5 min each to remove any organic and inorganic remnants on the electrode surface, prior being air dried at room temperature (24 °C). The electrochemical deposition was achieved by firstly, dispersing 150 mg RGO and 150 mg MnO2 in 2 mL 0.1 mol L−1 KCl using ultrasonic bath. Then, the pre-cleaned GCE working electrode, Ag/AgCl reference electrode, and a Pt wire counter electrode were immersed in the mixture, and magnetically stirred at a speed of 100 rpm. The MnO2@RGO nanocomposite was then electrodeposited onto the GCE surface using cyclic voltammetry (CV) by scanning in the potential range of −0.2 V to +1.2 V with 6 cycles at a scan rate of 25 mV s−1. The obtained MnO2@RGO/GCE electrode was washed with deionized water before being air dried at room temperature.

3. Results

3.1. X-ray Diffraction (XRD)

XRD patterns demonstrating the crystal structure of RGO nanosheets, MnO2 nanoparticles, and MnO2@RGO nanocomposite are displayed in Figure 1. The XRD pattern of MnO2 nanoparticles demonstrated the existence of MnO2 as a combination of two phases (α and β phases) at 2-theta angles 18.9°, 31.3°, 36.9°, 44.8°, 55.7°, 59.4°, and 65.3°, corresponding to the (200), (110), (211), (301), (600), (220), and (541) planes of typical α (JCPDS No 044-0141) and β (024-0735) phases [37,38,39]. Evidently, the RGO pattern shows an intense sharp peak corresponding to the (002) plane of carbon at 2-theta angle of 26.3° [35]. Expectedly, the RGO nanosheets and MnO2 nanoparticles characteristic peaks were observed on the XRD pattern of the MnO2@RGO nanocomposite. Interestingly, the MnO2@RGO nanocomposite showed major shifts in lower angles of all the peak positions as shown in Figure 1. This suggests the increase in the lattice parameters confirming the change in the crystal structure due to the formation of a nanocomposite [40,41].

3.2. High Resolution-Scanning Electron Microscopy (HR-SEM)

The HR-SEM images in Figure 2 illustrates the change in morphology during the fabrication of the MnO2@RGO sensing electrode. The RGO surface (Figure 2a) shows the thermally exfoliated nanolayers with a thickness ranging between 15 and 25 nm and a lateral size ranging between 55 and 450 nm. The spherical MnO2 nanoparticles (Figure 2b) appear to be slightly agglomerated, but with a uniform shape. The simultaneous deposition of the MnO2 and RGO on the surface of the GCE yielded to the MnO2@RGO nanocomposite displayed in Figure 2c. Compared to the RGO, the MnO2@RGO nanocomposite shows nanolayers with some nanoparticles on their surface, signifying that the RGO nanosheets act as a matrix for connecting the MnO2 nanoparticles. Furthermore, the nanosheets in the MnO2@RGO nanocomposite appear to be thicker (21–36 nm) and larger in size (62–480 nm), due to the MnO2 nanoparticles amalgamated on the surface of the RGO.
The EDX elemental mapping and composition of RGO nanosheets (Figure S1) show the presence of C (84.04%) and O (15.96%) across the entire surface (Figure S1a–c), with no impurities on the EDX spectrum (Figure S1d). MnO2 nanoparticles (Figure S2) display the presence of Mn (27.61%) and O (24.76%) distributed evenly across the entire surface (Figure S2a–c, with C (47.38%) observed in the EDX spectrum from coating of the material, alongside traces of Al (0.14%) and Cl (0.11%) (from the sample stubs and remains from the initial salts after washing with deionized water, respectively) (Figure S2d). The MnO2@RGO nanocomposite (Figure S3) displays the presence of Mn (35.97%), O (16.88%), and C (46.60%) distributed across the surface (Figure S3a–d), with traces of Al (0.55%) from the sample stabs. In addition to showing the distribution of atoms on the surface of the materials, these results further confirm the successful synthesis of RGO nanosheets, MnO2 nanoparticles, and MnO2@RGO nanocomposite.

3.3. Transmission Electron Microscopy (TEM)

To gain further insights on the morphology of the RGO nanosheets, MnO2 nanoparticles and MnO2@RGO nanocomposite, TEM was explored (Figure 3). The RGO nanosheets (Figure 3a) display the typical wrinkled pattern. The uniformly spherically shaped MnO2 nanoparticles are displayed in Figure 3b. Interestingly, the uniformly shaped MnO2 nanoparticles adhere to the surface of the RGO nanosheets after their simultaneous deposition (Figure 3c). This then suggests that there were strong interactions between RGO sheets and MnO2 particles, which might then prevent the leaching of MnO2 nanoparticles in solution [3]. This observation corroborates with the HR-SEM results. Expectedly, three amorphous diffraction rings corresponding to the unique (002), (110), (211) facets on the XRD of the RGO were observed in the selected area electron diffraction (SAED) pattern (Figure 3d). Furthermore, multiple polyatomic rings with bright spots were observed on the SAED pattern of the MnO2 nanoparticles, with rings corresponding to the (110), (211), (301), and (521) facets on the XRD of the MnO2 nanoparticles. The bright spots are indicative of the intense crystallinity of MnO2 nanoparticles. Remarkably, the MnO2@RGO nanocomposite display the amorphous polyatomic rings with bright spots signifying the presence of both RGO nanosheets and MnO2 nanoparticles. Moreover, the diffraction rings observed correspond to the (002), (110), (301), and (521) facets on the XRD of MnO2@RGO nanocomposite, showing the character of both MnO2 nanoparticles and RGO nanosheets. This further confirms the successful integration of MnO2 nanoparticles on the surface of RGO nanosheets [42].

3.4. Fourier Transform Infrared Spectroscopy (FTIR)

The functional groups present in the synthesized RGO nanosheets, MnO2 nanoparticles, and MnO2@RGO nanocomposite were determined using the FTIR (Figure 4). The FTIR spectra of the MnO2 nanoparticles display a broad band around 3404 cm−1 corresponding to the -OH vibration mode of absorbed water [43]. The vibration bands at 1629 and 1398 cm−1 can be ascribed to the -OH stretching of the adsorbed water and the metallic hydroxide (Mn-OH) formed during the electrodeposition process, respectively [42,43,44]. The broad band around 647 cm−1 was attributed to the stretching Mn-O bond in MnO2 nanoparticles [39,43,44]. The RGO nanosheets display the broad -OH band around 3140 cm−1 with a negligible shift in position when compared to the -OH of the MnO2@RGO nanocomposite [42]. The bands at 2923 and 2862 cm−1 correspond to the -CH and CH2 groups in the RGO structure, respectively. Similarly, these groups showed a negligible change in position on the MnO2@RGO nanocomposite [38,39,43]. Likewise, the bands around 1634 and 1393 cm−1 correspond to the C=C and C-O on the backbone of RGO, with a similar position and negligible change also observed on the MnO2@RGO nanocomposite [33,34,42]. The presence of the Mn-O stretching vibration around 633 cm−1 on the nanocomposite suggests the successful integration of the MnO2 with the RGO nanosheets [42,43,44]. Although the deposition of the RGO nanosheets and MnO2 nanoparticles were done simultaneously to form the MnO2@RGO nanocomposite, the FTIR results obtained suggest that the MnO2@RGO nanocomposite chemical structure resembles that of the RGO nanosheets, with MnO2 embedded on the structure of the RGO nanosheets. These results agree with the HR-SEM results showing the morphology of RGO as more dominant on the MnO2@RGO nanocomposite, suggesting a more conductive material formed [3,42].

3.5. Nitrogen Absorption-Desorption Studies

The BET properties of RGO nanosheets, MnO2 nanoparticles, and MnO2@RGO nanocomposite were determined from the N2 adsorption-desorption isotherms measured at 77K (Table 1). MnO2@RGO nanocomposite displayed a specific surface area of 148.7 m2/g which was by far higher than the 77.5 and 54.1 m2/g specific surface area of MnO2 nanoparticles and RGO nanosheets, respectively. The high increase of the surface area can be attributed to the integration of MnO2 nanoparticles with RGO nanosheets. Expectedly, MnO2@RGO nanocomposite displayed higher average pore size and the total pore volume than both RGO nanosheets and MnO2 nanoparticles as summarized in Table 1.

3.6. Electrochemical Performance of the Sensing Materials

The electrochemical performance of the functional MnO2@RGO nanocomposite was evaluated on a typical three-electrode setup. The GCE can be defined as the current collector, whereas the RGO nanosheets, MnO2 nanoparticles, and MnO2@RGO nanocomposite are the sensing materials. Prior to trace metal determinations, the bare GCE was immersed in the suspension of each sensing material and cyclic voltammetry (CV) was employed for the electrodeposition of the sensing materials on the polished GCE surface in a potential range of −0.2 to 1.2 V, at a scan rate of 25 mV s−1 in 0.1 M KCl. The corresponding cyclic voltammograms obtained from the electrodeposition of RGO nanosheets, MnO2 nanoparticles, and MnO2@RGO nanocomposite modified electrodes are displayed in Figure 5a. As seen, the MnO2@RGO nanocomposite modified GCE showed persistent enhancement currents when compared to the RGO nanosheets modified GCE and MnO2 nanoparticles modified GCE. This indicates that the incorporation of MnO2 nanoparticles on the RGO nanosheets improves the sensing element of the GCE. Evidently, the charge-transfer resistance of the prepared materials was studied, and the EIS measurements for the various electrodes are represented by the Nyquist plots in Figure 5b. Although all the materials display semicircles of different diameters within the high and low frequency regions, the Nyquist plot of the MnO2@RGO nanocomposite modified GCE exhibits a very small semicircle, indicating the lowest charge transfer resistance (Rct) (34.71 Ω) than the RGO nanosheets (99.54 Ω) and MnO2 nanoparticles (124.61 Ω). The low Rct of MnO2@RGO nanocomposite modified GCE might be ascribed to the high electrocatalytic activity of the incorporated MnO2 layer [3] and the increased porous structure of the composite.
Furthermore, the solution resistance (Rs) was determined as 29.39 Ω, 38.23 Ω, and 29.41 Ω for the RGO nanosheets, MnO2 nanoparticles, and MnO2@RGO nanocomposite, respectively. These results indicate a strong interaction between the electrode–electrolyte interface region of the MnO2@RGO nanocomposite GCE resulting from the highly porous surface of the MnO2@RGO nanocomposite, as confirmed by the BET results (Table 1). In addition to the semicircle observed, the MnO2@RGO nanocomposite modified GCE display the sharply reduced Warburg impedance (W) initially observed from the low frequencies of the Nyquist plot of the RGO nanosheets. Although MnO2 nanoparticles display the lowest conductivity, their integration with the conductive RGO nanosheets greatly improves the electron transport capacity and therefore increases the sensitivity, as shown by the increased current response observed from the cyclic voltammograms (Figure 5a). Following these results, the MnO2@RGO nanocomposite modified GCE was therefore employed to evaluate the response signals of the trace Cd(II), Zn(II), and Cu(II) in aqueous solutions.
Prior to the determination of Cu(II), Cd(II), Zn(II) using DPASV, cyclic voltammograms were recorded at different scan rates (5–50 mV s−1) in an electrolyte of 0.1 M KCl, 5 mM [Fe(CN)6]4−, and 5 mM [Fe(CN)6]3− to evaluate the effective electroactive surface area (Aeff) on the bare GCE (Figure 6a) and MnO2@RGO nanocomposite modified GCE (Figure 6b) [3]. The Aeff values were determined using the Randles–Sevcik equation (Equation (1)):
I p = 2.69 × 10 5 n 3 / 2 A e f f D 0 1 / 2 C v 1 / 2
where: n = number of electrons, Aeff = effective electroactive surface area (cm2), D0 = diffusion coefficient ((cm2/s) of [Fe(CN)6]4−/3−, C = concentration of the solution (mol/cm3), and v = scan rate (V/s). Using n = 2, C = 5 mM, D0 = 7.6 × 10⁻⁶ cm2 s−1, and the slope (Ip/v1/2), the Aeff values of bare GCE and MnO2@RGO nanocomposite modified GCE were calculated as 1.24 and 3.89 cm2, respectively. Notably, the Aeff values of the nanocomposite modified GCE is considerably larger than the bare GCE.
The differential pulse voltammograms showing the responses of the bare GCE and the MnO2@RGO nanocomposite modified GCE on the detection of Cu(II), Cd(II), and Zn(II) were presented in Figure 6c. It can be comprehended that the MnO2@RGO nanocomposite modified GCE produces a large stripping signals compared with the bare GCE. Furthermore, the influence of the oxygen interference was negligible with favorable signal-background characteristics. The superior electrocatalytic activity of the MnO2@RGO nanocomposite modified GCE achieved can be attributed to the synergistic coupling effect emancipating from the uniformly distributed small MnO2 nanoparticles on the RGO nanosheets surface [45]. Although DPASV resulted in satisfactory current responses on the detection of Cu(II), Cd(II), and Zn(II) in synthetic samples, the method was optimized to ensure the accurate determination of the trace metals in real water samples.

3.7. Optimization of the DPASV Experimental Parameters

The influential parameters (deposition time (DT), deposition potential (DP), pulse amplitude (PA), and step potential (SP)) affecting the determination of Cu(II), Cd(II), Zn(II) using MnO2@RGO nanocomposite modified GCE were optimized using the small-central composite design (SCCD). The design of the experiments (DOE) is shown in Table S1, alongside the current response of each element when subjected to the influential parameters (Table S2). Using the results obtained in Table S2, the significance of each factor was examined using analysis of variance (ANOVA). The ANOVA results were represented in the form of pareto charts (Figure 7, Figures S4 and S5). Considering the fact that ANOVA is a linear model, only linear factors (factors with the index L) were considered, while quadratic factors (factors with the index Q) were not considered on the pareto chart analysis [46]. Evidently, it can be clearly seen in Figure 7 that the three interactions (1. DT and DP; 2. DP and PA; 3. DT and PA), alongside the independent PA factor were significant at 95% confidence level for Zn. However, Cd (Figure S4) only shows one interaction between DP and DT as significant at 95% confidence level, alongside PA, which is the only independent factor that was significant. The pareto chart for Cu (Figure S5) shows that none of the factors were significant at 95% confidence level. However, PA and SP were found to be important and influential on analytical response. It can therefore be clearly seen that the PA has the overall most significant effect on the analytical response (peak current).
The response surface methodology (RSM) was used to investigate the interaction and the quadratic effects of the main parameters DP, DT, and SP and PA, using the data generated from the experimental SCCD, resulting in 3D surface plots for the Zn(II) optimization (Figure 8). Clearly, from Figure 8a, increasing DT to any value greater than 250 results in higher current response, even at low DT values. Similarly, the DP at higher values (0 to −0.7) lead to higher current response at low DT values, signifying the significance of the interaction of DP and DT. Furthermore, the interaction of SP with DP in Figure 8b clearly shows that any given SP value (from −4 to 1.4/higher) interacting with low DP values (from −1.6 to −2.0/lower) result to higher current responses. Figure 8c shows that increasing the PA to higher values (>90) leads to a higher current response at lower or higher DP values, indicating the significance of PA, alongside the insignificance of DP. Figure 8d shows that a higher current response can be achieved at any SP value (−4 to 14/higher) interaction with higher DT (>350) or lower DT (<0), indicating the significance of the interaction of SP and DT at given values. Furthermore, low PA and low DT (both below 0) give high response as shown in Figure 8e. Finally, the interaction of PA and SP shows that higher PA (>110) correspond to higher response at any given SP, indicating the significance of PA and the insignificance of SP at given values (Figure 8f). The results obtained in these RSM plots, noticing the significant interactions, correspond to the pareto chart analysis.
The RSM plots for Cd(II) are shown in Figure S6. In Figure S6a, it can be seen that at higher DT values and higher DP values, there is a higher current response. Figure S6b shows that a DP between −1.6 to −0.4 and any SP between the given DP range leads to a higher current response. Furthermore, higher DP (>−1.8) and a higher PA (>120) interaction leads to a higher current response as shown in Figure S6c. DT between 0 and 350 interacting with any SP between the DP values given result to a higher current response (Figure S6d). Any DT value interacting with PA (<0) gives a maximum response (Figure S6e). Lastly, any SP value interacting with PA (<0) gives a maximum response (Figure S6f). These results are in agreement with the pareto chart analysis, as SP and DT were clearly insignificant. The RSM plots of Cu(II) shown in Figure S7 show a similar pattern with the RSM plots of Cd(II). Subsequently, DP, DT and SP were clearly insignificant on the current response, thus agreeing with the pareto chart analysis.
The simultaneous estimations of the optimum conditions leading to the maximum current response were evaluated using the desirability function (DF) for all the parameters and metals (Figure 9, Figures S8 and S9). The desirability function takes values in the range 0–1, with 0 indicating a 1.8 µA current response; 0.5 indicating a 38.15 µA current response; and 1 showing a 74.50 µA current response for the Zn optimization (Figure 9). Similarly, on the Cd optimization, 0 indicates a 0.30 µA current response; 0.5 indicates a 17.85 µA current response; and 1 shows a 35.40 µA current response. Likewise, on the Cu optimization, 0 indicates a 3.00 µA current response; 0.5 indicates a 68.70 µA current response; and 1 shows a 134.40 µA current response. Evidently, from the desirability profiles, SCCD and RSM results, it can be concluded that the optimum conditions yielding the greatest current response for simultaneous determination of Cd(II), Cu(II), and Zn(II) were −1.5 V, 330 s, 25 mV, and 10 mV for DP, DT, PA, and SP, respectively.

3.8. Analytical Figures of Merit

Under optimum conditions, calibration curves from the differential pulse voltammograms using MnO2@RGO/GCE were studied for different concentrations of each metal ion (Cu, Zn and Cd). The limits of detection (LOD = 3Sb/m) and the limits of quantification (LOQ = 10Sd/m) are presented in Table 2, where Sd and m are standard deviation of the blank signal (n = 20) and the slope of the calibration curve, respectively. The intraday (repeatability) precision of the MnO2@RGO/GCE was investigated by performing 15 measurements of the standard solution of Cd, Cu and Zn ions at a concentration of 25 μg L−1. Additionally, the interday (reproducibility) precision was evaluated by preparing five MnO2@RGO/GCE from the same batch in five consecutive working days. The MnO2@RGO/GCE were used for the determination of 25 μg L−1 of metal ions. The precisions were expressed in terms of relative standard deviation (RSD) and the results are summarized in Table 2. Consequently, the intraday and interday precisions for MnO2@RGO/GCE were acceptable, as they were less than 5%. Moreover, the MnO2@RGO/GCE was found to be reusable for four weeks and after the response of the MnO2@RGO/GCE decreased.
Subsequently, the comparison of MnO2@RGO/GCE with other reported modified electrodes in the determination of Cd, Cu and Zn ions is presented in Table 3. It can be seen from the table that the LOD and sensitivity towards determination of Zn improved. Additionally, it can be perceived that the present method exhibited a wider dynamic range and better or similar precision compared those reported in the literature.

3.9. Surface Water (SW) Sample Analysis

The applicability and validity of the proposed MnO2@RGO/GCE was investigated by the application on the determination of Zn2+, Cu2+, and Cd2+ ions in surface water samples. Initially, the accuracy of the developed method was assessed by analyzing three water samples spiked with 2.00, 5.00, and 10.0 μg L−1 concentrations of Cu(II), Zn(II), and Cd(II). The concentration of the target elements was achieved by comparing the values obtained by using the calibration curve method. The results and percentage recovery values are shown in Table 4. According to the results obtained, a good agreement between the added and an obtained analyte concentration was achieved. The percentage recoveries ranged from 97–99.9%. These results reveal that that the developed electrochemical sensor method has a relatively good accuracy in real water sample matrix.
The applicability of the developed electrochemical sensor for the simultaneous determination of Cd, Cu, and Zn in real water samples was investigated. The analytical results obtained are presented in Table 4 and Table 5. It can be seen in Table 5 that the results obtained by the developed electrochemical method show a good agreement with those obtained by the ICP-OES analysis. Therefore, these findings confirmed the applicability of the proposed method for precise and accurate simultaneous determination of Cd, Cu and Zn in real environmental water samples. In addition, these results revealed that the current electrochemical sensor has capabilities to determine the trace metal ions the real water samples without significant interferences.

3.10. Stability of the Electrochemical Sensor

The stability of the modified GCE was investigated by repetitively measuring 25 μg L−1 of Cd, Cu, and Zn using the same modified electrode. These experiments were conducted under optimal experimental conditions. After every use, the MnO2@RGO nanocomposite modified GCE was immersed in 2 M nitric acid to dissolve any adsorbed metal ions and stored in the refrigerator at 4 °C. The experimental results for the long-term stability of the MnO2@RGO nanocomposite modified GCE are displayed in Figure 10. Evidently, the developed sensor was found to be stable as it retained about 95% of the initial current response in the determination of Cu(II), Cd(II), and Zn(II). This implies that the sensor could be used continuously for at least 7 days without any significant loss in performance.

4. Conclusions

This work reported on the determination of Cu(II), Cd(II), and Zn(II) using the fabricated MnO2@RGO/GCE modified electrode using DPASV. The electrodeposited MnO2@RGO/GCE exhibited high electrocatalytic activity owing to its increased surface area, low charge-transfer resistance at the electrolyte-electrode interface, and high selectivity to Cu(II), Cd(II), and Zn(II). Experimental parameters such as deposition potential, deposition time, pulse amplitude, and step potential were optimized using the small central composite design and the response surface methodology for Cu(II), Cd(II), and Zn(II). The experimental electrochemical results using the optimum conditions suggest that the MnO2@RGO nanocomposite enhances the current response on the detection of Cu(II), Cd(II), and Zn(II) in surface water. Additionally, the MnO2@RGO modified GCE exhibited several advantages, such as the simple preparation, reproducibility, and good stability. Furthermore, the fabricated electrochemical sensor proved to be a better alternative method that can be used for the determination of heavy metals in environmental matrices without the sample preparation step and can be used in routine analysis.

Supplementary Materials

The following are available online at https://www.mdpi.com/article/10.3390/membranes11070517/s1, Figure S1: EDX mapping (a–c) with corresponding EDX elemental composition (d) of RGO nanosheets, Figure S2: EDX mapping (a–c) with corresponding EDX elemental composition (d) of MnO2 nanoparticles, Figure S3: EDX mapping (a–d) with corresponding EDX elemental composition (e) of MnO2@RGO nanocomposites, Figure S4: Pareto charts showing the significance of independent factors and their interactions for the determination of Cd(II), Figure S5: Pareto charts showing the significance of independent factors and their interactions for the determination of Cu(II), Figure S6: RSM plots for the optimization of Cd(II), Figure S7: RSM plots for the optimization of Cu(II), Figure S8: Profiles for predicted values and desirability of Cd(II), Figure S9: Profiles for predicted values and desirability of Cu(II) Table S1 Design of experiments for the small-central composite design (SCCD), Table S2 Central composite design current responses for Zn (II), Cd (II) and Cu (II).

Author Contributions

Conceptualization and investigation, T.S.M., S.H.M. and P.N.N.; methodology, S.H.M.; software, P.N.N.; validation, T.S.M., S.H.M.; formal analysis, T.S.M., S.H.M.; resources, P.N.N.; data curation.; writing—original draft preparation, T.S.M., S.H.M.; writing—review and editing, T.S.M., S.H.M. and P.N.N.; visualization, T.S.M. and P.N.N.; supervision, P.N.N.; project administration, T.S.M. and P.N.N.; funding acquisition, P.N.N. All authors have read and agreed to the published version of the manuscript.

Funding

This research was funded by National Research Foundation of South Africa (grant no. 99720).

Institutional Review Board Statement

Not applicable.

Data Availability Statement

Not applicable.

Acknowledgments

The authors would like to thank the University of Johannesburg, South Africa (Chemical sciences) for providing us with the laboratory space and equipment.

Conflicts of Interest

The authors declare no conflict of interest.

References

  1. Munonde, T.S.; Nomngongo, P.N. Nanocomposites for Electrochemical Sensors and Their Applications on the Detection of Trace Metals in Environmental Water Samples. Sensors 2021, 21, 131. [Google Scholar] [CrossRef]
  2. Swierczewska, M.; Liu, G.; Lee, S.; Chen, X. High-sensitivity nanosensors for biomarker detection. Chem. Soc. Rev. 2012, 41, 2641–2655. [Google Scholar] [CrossRef] [PubMed]
  3. Gao, J.; Li, H.; Li, M.; Wang, G.; Long, Y.; Li, P.; Li, C.; Yang, B. Polydopamine/graphene/MnO2 composite-based electrochemical sensor for in situ determination of free tryptophan in plants. Anal. Chim. Acta 2021, 1145, 103–113. [Google Scholar] [CrossRef] [PubMed]
  4. Osredkar, J.; Sustar, N. Copper and zinc, biological role and significance of copper/zinc imbalance. J. Clin. Toxicol. 2011, 3, 495. [Google Scholar] [CrossRef] [Green Version]
  5. Obaroh, I.O.; Abubakar, U.; Haruna, M.A.; Elinge, M.C. Evaluation of some heavy metals concentration in River Argungu. J. Fish. Aquat. Sci. 2015, 10, 581. [Google Scholar] [CrossRef] [Green Version]
  6. Liu, S.; Wang, H.; Chai, L.; Li, M. Effects of single-and multi-organic acid ligands on adsorption of copper by Fe3O4/graphene oxide-supported DCTA. J. Colloid Interface Sci. 2016, 478, 288–295. [Google Scholar] [CrossRef] [PubMed]
  7. Rahimzadeh, M.R.; Rahimzadeh, M.R.; Kazemi, S.; Moghadamnia, A. Cadmium toxicity and treatment: An update. Casp. J. Intern. Med. 2017, 8, 135. [Google Scholar]
  8. Rehman, K.; Fatima, F.; Waheed, I.; Akash, M.S.H. Prevalence of exposure of heavy metals and their impact on health consequences. J. Cell. Biochem. 2018, 119, 157–184. [Google Scholar] [CrossRef]
  9. Thanh, N.M.; Van Hop, N.; Luyen, N.D.; Phong, N.H.; Tam Toan, T.T. Simultaneous determination of Zn (II), Cd (II), Pb (II), and Cu (II) using differential pulse anodic stripping voltammetry at a bismuth film-modified electrode. Adv. Mater. Sci. Eng. 2019, 2019, 1826148. [Google Scholar] [CrossRef] [Green Version]
  10. Alam, R.; Ahmed, Z.; Howladar, M.F. Evaluation of heavy metal contamination in water, soil and plant around the open landfill site Mogla Bazar in Sylhet, Bangladesh. Groundw. Sustain. Dev. 2020, 10, 100311. [Google Scholar] [CrossRef]
  11. Rofouei, M.K.; Jamshidi, S.; Seidi, S.; Saleh, A. A bucky gel consisting of Fe3O4 nanoparticles, graphene oxide and ionic liquid as an efficient sorbent for extraction of heavy metal ions from water prior to their determination by ICP-OES. Microchim. Acta 2017, 184, 3425–3432. [Google Scholar] [CrossRef]
  12. Gugushe, A.S.; Mpupa, A.; Munonde, T.S.; Nyaba, L.; Nomngongo, P.N. Adsorptive Removal of Cd, Cu, Ni and Mn from Environmental Samples Using Fe3O4-Zro2@ APS Nanocomposite: Kinetic and Equilibrium Isotherm Studies. Molecules 2021, 26, 3209. [Google Scholar] [CrossRef]
  13. Alexander, D.; Ellerby, R.; Hernandez, A.; Wu, F.; Amarasiriwardena, D. Investigation of simultaneous adsorption properties of Cd, Cu, Pb and Zn by pristine rice husks using ICP-AES and LA-ICP-MS analysis. Microchem. J. 2017, 135, 129–139. [Google Scholar] [CrossRef]
  14. Nomngongo, P.N.; Ngila, J.C. Multivariate optimization of dual-bed solid phase extraction for preconcentration of Ag, Al, As and Cr in gasoline prior to inductively coupled plasma optical emission spectrometric determination. Fuel 2015, 139, 285–291. [Google Scholar] [CrossRef]
  15. Akanji, S.P.; Ama, O.M.; Ray, S.S.; Osifo, P.O. Metal Oxide Nanomaterials for Electrochemical Detection of Heavy Metals in Water. In Nanostructured Metal-Oxide Electrode Materials for Water Purification; Springer: Berlin/Heidelberg, Germany, 2020; pp. 113–126. [Google Scholar]
  16. Ramachandran, R.; Chen, T.-W.; Chen, S.-M.; Baskar, T.; Kannan, R.; Elumalai, P.; Raja, P.; Jeyapragasam, T.; Dinakaran, K. A review of the advanced developments of electrochemical sensors for the detection of toxic and bioactive molecules. Inorg. Chem. Front. 2019, 6, 3418–3439. [Google Scholar] [CrossRef]
  17. Pujol, L.; Evrard, D.; Groenen-Serrano, K.; Freyssinier, M.; Ruffien-Cizsak, A.; Gros, P. Electrochemical sensors and devices for heavy metals assay in water: The French groups’ contribution. Front. Chem. 2014, 2, 19. [Google Scholar] [CrossRef] [Green Version]
  18. Sawan, S.; Maalouf, R.; Errachid, A.; Jaffrezic-Renault, N. Metal and metal oxide nanoparticles in the voltammetric detection of heavy metals: A review. TrAC Trends Anal. Chem. 2020, 131, 116014. [Google Scholar] [CrossRef]
  19. Tan, Z.; Wu, W.; Feng, C.; Wu, H.; Zhang, Z. Simultaneous determination of heavy metals by an electrochemical method based on a nanocomposite consisting of fluorinated graphene and gold nanocage. Microchim. Acta 2020, 187, 414. [Google Scholar] [CrossRef]
  20. Pérez-Ràfols, C.; Serrano, N.; Díaz-Cruz, J.M.; Ariño, C.; Esteban, M. Penicillamine-modified sensor for the voltammetric determination of Cd (II) and Pb (II) ions in natural samples. Talanta 2015, 144, 569–573. [Google Scholar] [CrossRef] [Green Version]
  21. Gong, J.; Zhou, T.; Song, D.; Zhang, L.; Hu, X. Stripping voltammetric detection of mercury (II) based on a bimetallic Au-Pt inorganic-organic hybrid nanocomposite modified glassy carbon electrode. Anal. Chem. 2010, 82, 567–573. [Google Scholar] [CrossRef]
  22. Yang, D.; Wang, L.; Chen, Z.; Megharaj, M.; Naidu, R. Anodic stripping voltammetric determination of traces of Pb (II) and Cd (II) using a glassy carbon electrode modified with bismuth nanoparticles. Microchim. Acta 2014, 181, 1199–1206. [Google Scholar] [CrossRef]
  23. Ambrosi, A.; Chua, C.K.; Bonanni, A.; Pumera, M. Electrochemistry of graphene and related materials. Chem. Rev. 2014, 114, 7150–7188. [Google Scholar] [CrossRef]
  24. Priya, T.; Dhanalakshmi, N.; Thennarasu, S.; Karthikeyan, V.; Thinakaran, N. Ultra sensitive electrochemical detection of Cd2+ and Pb2+ using penetrable nature of graphene/gold nanoparticles/modified L-cysteine nanocomposite. Chem. Phys. Lett. 2019, 731, 136621. [Google Scholar] [CrossRef]
  25. Guo, Z.; Luo, X.; Li, Y.; Zhao, Q.-N.; Li, M.; Zhao, Y.; Sun, T.; Ma, C. Simultaneous determination of trace Cd (II), Pb (II) and Cu (II) by differential pulse anodic stripping voltammetry using a reduced graphene oxide-chitosan/poly-l-lysine nanocomposite modified glassy carbon electrode. J. Colloid Interface Sci. 2017, 490, 11–22. [Google Scholar] [CrossRef]
  26. Baghayeri, M.; Ghanei-Motlagh, M.; Tayebee, R.; Fayazi, M.; Narenji, F. Application of graphene/zinc-based metal-organic framework nanocomposite for electrochemical sensing of As (III) in water resources. Anal. Chim. Acta 2020, 1099, 60–67. [Google Scholar] [CrossRef]
  27. Lin, H.; Li, M.; Mihailovič, D. Simultaneous determination of copper, lead, and cadmium ions at a Mo6S9-xIx nanowires modified glassy carbon electrode using differential pulse anodic stripping voltammetry. Electrochim. Acta 2015, 154, 184–189. [Google Scholar] [CrossRef]
  28. Bagheri, H.; Hajian, A.; Rezaei, M.; Shirzadmehr, A. Composite of Cu metal nanoparticles-multiwall carbon nanotubes-reduced graphene oxide as a novel and high performance platform of the electrochemical sensor for simultaneous determination of nitrite and nitrate. J. Hazard. Mater. 2017, 324, 762–772. [Google Scholar] [CrossRef] [PubMed]
  29. Waheed, A.; Mansha, M.; Ullah, N. Nanomaterials-based electrochemical detection of heavy metals in water: Current status, challenges and future direction. TrAC Trends Anal. Chem. 2018, 105, 37–51. [Google Scholar] [CrossRef]
  30. Fu, S.; Sun, Z.; Huang, P.; Li, Y.; Hu, N. Some basic aspects of polymer nanocomposites: A critical review. Nano Mater. Sci. 2019, 1, 2–30. [Google Scholar] [CrossRef]
  31. Brown, B.; Cordova, I.A.; Parker, C.B.; Stoner, B.R.; Glass, J.T. Optimization of active manganese oxide electrodeposits using graphenated carbon nanotube electrodes for supercapacitors. Chem. Mater. 2015, 27, 2430–2438. [Google Scholar] [CrossRef]
  32. Wang, M.-F.; Li, W.; Hu, P.-J.; He, S.-S.; Yang, H.-M.; Li, X.-Z. A Facile Hydrazine Amperometric Sensor Based on a Glassy Carbon Electrode Modified with Au Nanoparticles-MnO2 Composites. Int. J. Electrochem. Sci. 2016, 11, 1928–1937. [Google Scholar]
  33. Smith, A.T.; LaChance, A.M.; Zeng, S.; Liu, B.; Sun, L. Synthesis, properties, and applications of graphene oxide/reduced graphene oxide and their nanocomposites. Nano Mater. Sci. 2019, 1, 31–47. [Google Scholar] [CrossRef]
  34. Alkhouzaam, A.; Qiblawey, H.; Khraisheh, M.; Atieh, M.; Al-Ghouti, M. Synthesis of graphene oxides particle of high oxidation degree using a modified Hummers method. Ceram. Int. 2020, 46, 23997–24007. [Google Scholar] [CrossRef]
  35. Saleem, H.; Haneef, M.; Abbasi, H.Y. Synthesis route of reduced graphene oxide via thermal reduction of chemically exfoliated graphene oxide. Mater. Chem. Phys. 2018, 204, 1–7. [Google Scholar] [CrossRef]
  36. Le, T.-H.; Ngo, T.H.A.; Doan, V.T.; Nguyen, L.M.T.; Le, M.C. Preparation of manganese dioxide nanoparticles on laterite for methylene blue degradation. J. Chem. 2019, 2019, 1602752. [Google Scholar] [CrossRef] [Green Version]
  37. Shinde, P.A.; Lokhande, V.C.; Patil, A.M.; Yadav, A.A.; Lokhande, C.D. Hydrothermal synthesis of manganese oxide thin films using different oxidizing agents for supercapacitor application. Int. J. Eng. Res. Technol. 2017, 10, 532–537. [Google Scholar]
  38. Wan, X.; Yang, S.; Cai, Z.; He, Q.; Ye, Y.; Xia, Y.; Li, G.; Liu, J. Facile synthesis of MnO2 nanoflowers/N-doped reduced graphene oxide composite and its application for simultaneous determination of dopamine and uric acid. Nanomaterials 2019, 9, 847. [Google Scholar] [CrossRef] [Green Version]
  39. Sannasi, V.; Subbian, K. Influence of Moringa oleifera gum on two polymorphs synthesis of MnO 2 and evaluation of the pseudo-capacitance activity. J. Mater. Sci. Mater. Electron. 2020, 31, 17120–17132. [Google Scholar] [CrossRef]
  40. Furlan, A.; Lu, J.; Hultman, L.; Jansson, U.; Magnuson, M. Crystallization characteristics and chemical bonding properties of nickel carbide thin film nanocomposites. J. Phys. Condens. Matter 2014, 26, 415501. [Google Scholar] [CrossRef] [PubMed] [Green Version]
  41. Liu, X.; Le Flem, M.; Béchade, J.-L.; Onimus, F.; Cozzika, T.; Monnet, I. XRD investigation of ion irradiated Ti3Si0. 90Al0. 10C2. Nucl. Instrum. Methods Phys. Res. Sect. B Beam Interact. Mater. At. 2010, 268, 506–512. [Google Scholar] [CrossRef]
  42. Huang, B.; Zhang, X.; Cai, J.; Liu, W.; Lin, S. A novel MnO 2/rGO composite prepared by electrodeposition as a non-noble metal electrocatalyst for ORR. J. Appl. Electrochem. 2019, 49, 767–777. [Google Scholar] [CrossRef]
  43. Hu, Z.; Zhao, Y.; Liu, J.; Wang, J.; Zhang, B.; Xiang, X. Ultrafine MnO2 nanoparticles decorated on graphene oxide as a highly efficient and recyclable catalyst for aerobic oxidation of benzyl alcohol. J. Colloid Interface Sci. 2016, 483, 26–33. [Google Scholar] [CrossRef]
  44. Mylarappa, M.; Lakshmi, V.V.; Mahesh, K.R.V.; Nagaswarupa, H.P.; Raghavendra, N. A facile hydrothermal recovery of nano sealed MnO2 particle from waste batteries: An advanced material for electrochemical and environmental applications. In Proceedings of the IOP Conference Series: Materials Science and Engineering; IOP Publishing: Bristol, UK, 2016; Volume 149, p. 12178. [Google Scholar]
  45. Hossain, M.N.; Wen, J.; Chen, A. Unique copper and reduced graphene oxide nanocomposite toward the efficient electrochemical reduction of carbon dioxide. Sci. Rep. 2017, 7, 3184. [Google Scholar] [CrossRef] [PubMed] [Green Version]
  46. Mpupa, A.; Nqombolo, A.; Mizaikoff, B.; Nomngongo, P.N. Enhanced Adsorptive Removal of β-Estradiol from Aqueous and Wastewater Samples by Magnetic Nano-Akaganeite: Adsorption Isotherms, Kinetics, and Mechanism. Processes 2020, 8, 1197. [Google Scholar] [CrossRef]
  47. Xiao, L.; Xu, H.; Zhou, S.; Song, T.; Wang, H.; Li, S.; Gan, W.; Yuan, Q. Simultaneous detection of Cd (II) and Pb (II) by differential pulse anodic stripping voltammetry at a nitrogen-doped microporous carbon/Nafion/bismuth-film electrode. Electrochim. Acta 2014, 143, 143–151. [Google Scholar] [CrossRef]
  48. Rajabi, M.; Mohammadi, B.; Asghari, A.; Barfi, B.; Behzad, M. Nano-alumina coated with SDS and modified with salicylaldehyde-5-sulfonate for extraction of heavy metals and their determination by anodic stripping voltammetry. J. Ind. Eng. Chem. 2014, 20, 3737–3743. [Google Scholar] [CrossRef]
  49. Wu, S.; Li, K.; Dai, X.; Zhang, Z.; Ding, F.; Li, S. An ultrasensitive electrochemical platform based on imprinted chitosan/gold nanoparticles/graphene nanocomposite for sensing cadmium (II) ions. Microchem. J. 2020, 155, 104710. [Google Scholar] [CrossRef]
  50. Xie, R.; Zhou, L.; Lan, C.; Fan, F.; Xie, R.; Tan, H.; Xie, T.; Zhao, L. Nanostructured carbon black for simultaneous electrochemical determination of trace lead and cadmium by differential pulse stripping voltammetry. R. Soc. Open Sci. 2018, 5, 180282. [Google Scholar] [CrossRef] [Green Version]
Figure 1. XRD spectra of RGO nanosheets, MnO2 nanoparticles and MnO2@RGO nanocomposite.
Membranes 11 00517 g001
Figure 2. HR-SEM images of RGO nanosheets (a), MnO2 nanoparticles (b) and the MnO2@RGO nanocomposite (c).
Membranes 11 00517 g002
Figure 3. TEM images of RGO nanosheets (a), MnO2 nanoparticles (b) and the MnO2@RGO nanocomposite (c), with corresponding SAED patterns (df).
Membranes 11 00517 g003
Figure 4. FTIR spectra of RGO nanosheets, MnO2 nanoparticles and MnO2@RGO nanocomposite.
Membranes 11 00517 g004
Figure 5. (a) CV voltammograms recorded at potential range of −0.2 to 1.2 V, at a scan rate of 25 mV s−1 in 0.1 M KCl (b) Nyquist EIS plots (b) obtained after the electrodeposition of RGO nanosheets, MnO2 nanoparticles and MnO2@RGO nanocomposite on the GCE surface.
Membranes 11 00517 g005
Figure 6. Cyclic voltammograms at different scan rates for (a) Bare GC electrode, (b) MnO2@RGO nanocomposite modified GCE; Differential pulse voltammograms for the detection of Cu(II), Cd(II), Zn(II) using bare GCE and MnO2@RGO nanocomposite modified GCE (c).
Membranes 11 00517 g006
Figure 7. Pareto charts showing the significance of independent factors and their interactions for the determination of Zn(II).
Membranes 11 00517 g007
Figure 8. RSM plots for the optimization of Zn(II).
Membranes 11 00517 g008
Figure 9. Profiles for predicted values and desirability of Zn(II).
Membranes 11 00517 g009
Figure 10. Long term stability of MnO2@RGO/GCE.
Membranes 11 00517 g010
Table 1. BET properties of RGO nanosheets, MnO2 nanoparticles, and MnO2@RGO nanocomposite.
Surface PropertiesRGO NanosheetsMnO2 NanoparticlesMnO2@RGO Nanocomposite
BET surface area (m2/g)54.177.5148.7
Average pore size (nm)14.118.826.6
Total pore volume (cm3/g)0.190.330.77
Table 2. Analytical parameter of the MnO2@RGO/GCE for the determination of Cd, Cu, and Zn ions.
Analytical ParametersCdCuZn
DLR (μg L−1)LOQ-700LOQ-600LOQ-600
R20.99670.99900.9987
RLE I ( μ A ) = 0.2089 C C d ( μ g   L 1 ) 2.929 I ( μ A ) = 0.5639 C C u ( μ g   L 1 ) + 25.35 I ( μ A ) = 0.2465 C Z n ( μ g   L 1 ) 1.755
LOD (ng L−1)15.19.313.7
LOQ (ng L−1)50.331.044.3
Intraday (%RSD)2.11.52.5
Interday (%RSD)3.94.04.5
Table 3. Comparison of analytical parameters of the different modified electrodes reported for the determination of Cd, Cu, and Zn ions.
Electrode/MethodAnalytesLOD (μg L−1)LOQ(μg L−1)DLR (μg L−1)RSD %Ref
Mo6SxI9-xNWs/GCE/DPASVCu and Cd0.015 0.50–2403.3–5.1[27]
BiFE/GCECu0.028 5–110-[9]
Nafion/Bi/NMC/GCE/DPASVCu, Cd, Zn0.93–1.07 2–1007.5[47]
RGO-CS/PLL/GCECd and Cu0.01–0.02 0.05–10.4.4[25]
Nano-Al2O/GCE/DPVZn0.026 0.08–1503.39[48]
CS/AuNPs/GR/GCE Cd0.002 0.1–0.92.4[49]
CB–Nafion–GCE Cd0.9 0.6–1123.13[50]
MnO2@RGO/GCE/DPVCd, Zn and Cu0.002–0.0150.021–0.0500.05–7001.5–4.5This study
Table 4. Results for Cd, Cu and Zn ions determination in spiked surface water samples obtained under the optimum conditions (N = 5).
SamplesAddedCdCuZn
Found%RFound%RFound%R
SW101.32 ± 0.05-56.7 ± 0.9-126.5 ± 1.8-
2.03.27 ± 0.0297.558.7 ± 1.099.0128.5 ± 1.398.5
5.06.18 ± 0.1297.261.6 ± 0.899.0131.4 ± 1.698.8
10.011.2 ± 0.1798.566.6 ± 0.999.0±1.599.8
SW202.45 ± 0.02-102.4 ± 1.5-337.1 ± 3.1-
2.04.43 ± 0.0799.0104.4 ± 1.499.0339.0 ± 2.397.0
5.07.37 ± 0.0698.2107.3 ± 1.699.2342.1 ± 3.199.2
10.012.7 ± 0.8099.1112.4 ± 1.299.6347.0 ± 2.599.3
SW301.66 ± 0.06-125.9 ± 1.3-231.0 ± 2.4-
2.03.63 ± 0.0598.5127.9 ± 1.198.5232.0 ± 2.599.0
5.06.61 ± 0.1699.0130.9 ± 1.399.6235.0 ± 2.699.4
10.011.6 ± 0.2399.4135.8 ± 1.599.0240.9 ± 2.799.4
Table 5. Simultaneous determination Cd, Cu, and Zn ions in real surface water samples using MnO2@RGO/GCE/DPASV method (N = 5).
SamplesConcentration (µg L−1)ICP-OES (Concentration (µg L−1)
CdCuZnCdCuZn
SW4<LOD130.4 ± 1.2231.6 ± 3.0<LOD129.5 ± 2.3231.6 ± 3.0
SW50.98 ± 0.0175.4 ± 0.9144.3 ± 1.81.00 ± 0.0174.6 ± 2.2143.5 ± 2.3
SW61.23 ± 0.0629.6 ± 0.589.6 ± 0.81.21 ± 0.0730.1 ± 1.390.3 ± 1.2
SW71.03 ± 0.02238.1 ± 2.692.3 ± 1.01.00 ± 0.12238.5 ± 1.691.8 ± 1.8
SW82.31 ± 0.0577.5 ± 1.2136.7 ± 2.12.34 ± 0.0978.1 ± 1.8137.0 ± 3.2
Publisher’s Note: MDPI stays neutral with regard to jurisdictional claims in published maps and institutional affiliations.

