1. Introduction
Considerable effort has been devoted to nanofiltration (NF) modelling and several approaches can be found in the literature [
1,
2,
3,
4,
5,
6,
7]. Nonetheless, the intricacy of the transport mechanisms of NF complicates the development of predictive models, in particular for multielectrolyte solutions containing both mono and divalent ions.
In general, there are two kinds of transport models of NF: mechanistic models and irreversible thermodynamics descriptions [
1]. The former usually use the concept of nanoporous materials in which ion exclusion (steric, electric and dielectric) and hindered diffusion and convection occur [
2,
6]. These models are based on macroscopic approaches probably applicable for the description of ultrafiltration but questionable if applied to subnanopores. Besides, they rely on chemical and physical characterization of the membranes that is challenging.
On the other hand, irreversible thermodynamics uses only phenomenological coefficients to describe ion fluxes in terms of gradients of ion electrochemical potentials and transmembrane volume flow. This treatment combined with some assumptions leads to simplified models such as Spiegler–Kedem [
4,
7], extended Spiegler–Kedem [
8], solution-diffusion [
9] or solution–diffusion–electromigration [
10].
Due to the complexity of mechanistic modelling, advanced engineering models based on irreversible thermodynamics seem to remain the approach of choice for practical NF modelling [
1]. Even though they do not assume any (microscopic) physical ion exclusion mechanism, they should take into account principal macroscopic physicochemical phenomena using a limited number of fitting parameters obtainable from a well-defined set of experiments. Thus for instance, solution–diffusion–electromigration model (SDEM) of NF accounts for the ion transport due to transmembrane electric fields that spontaneously arise owing to different membrane permeances to cations and anions [
10]. This approach has been extensively tested [
11,
12,
13,
14,
15] and demonstrated to reproduce several observed experimental trends using a limited number of adjustable parameters.
Including convection to the SDEM ion transport mechanisms would extend the applicability scope of this engineering model. However, this would also double the number of adjustable parameters since the transmission coefficients would be added to the ionic permeances for each ion. The unambiguous determination of this increased number of model parameters relies on the accuracy of the experimental data. An important factor to control is concentration polarization (CP) in membrane test cells.
In a major part of testing devices for pressure membrane processes the extent of CP is inhomogeneous. Disregarding this fact can lead to considerable underestimation or overestimation of the impact of CP depending on the sign of the solute rejection [
16]. Therefore, CP inhomogeneity can have a considerable impact on the interpretation of experimental measurements, particularly in multi-ion solutions experiencing very different simultaneous rejections in multi-ion solutions. Meanwhile, in the previous studies using SDEM the thickness of unstirred layer was used as a single adjustable parameter for the description of the rejection of all the solutes (dominant salts as well as trace ions).
To address this issue, a new design of a rotating disklike membrane (RDM) test cell with equally accessible surface was developed [
17]. Numerical simulations and experimental validation demonstrated that CP was homogeneously distributed over the entire membrane surface. Once this condition is satisfied, it is easy to decouple the external mass transfer problem from that of transmembrane transport, which is highly desirable considering the complexity of the transport phenomena in NF. In this way, the membrane properties obtained in the RDM cell can further be used as the boundary conditions in computational fluid dynamics (CFD) models describing mass transfer in the spacer-filled channels of the spiral-wound membrane elements or in the feed channels of the tubular or hollow-fiber membranes.
The set-up was used previously for the CP-correction of the observable ion rejections obtained in NF with a commercial NF270 membrane. However, the intrinsic ion rejections were previously not interpreted by using a model. The aim of this work is to perform such an interpretation by using the SDEM model to investigate the effect of the kind of dominant salt on the ion permeance to the electrolyte mixtures consisting of a dominant salt and trace ions. The results obtained with the RDM cell will be compared with those reported in other studies with the same NF membrane and feed solutions by using a commercial GE SEPA™ CF II test cell.
4. Results and Discussion
This section discusses the membrane permeances of ions estimated from a set of experiments using several single dominant salts (NaCl, MgCl
2, Na
2SO
4 or MgSO
4) and trace salts (NaNO
3 and/or NH
4Cl). The intrinsic rejections calculated via the CP correction from the results obtained in a previous work [
17] are fitted to the SDEM model to determine membrane permeances to dominant salts and ion permeances in each case. The results are compared with the literature and their consistency and relation with NF separation mechanisms are discussed.
Table 1 presents the membrane permeances to dominant salt and the permeance obtained for each ion from the fitting of experimental data to the SDEM model. It can be seen that there is a notable difference between the experiments where SO
42− was the dominant anion with respect to the cases where Cl
− was the dominant anion. SO
42− is a highly rejected ion, so for Na
2SO
4 and MgSO
4 the membrane permeance to dominant salt is an order of magnitude lower than for the experiments with dominant NaCl and MgCl
2, which are moderately rejected salts.
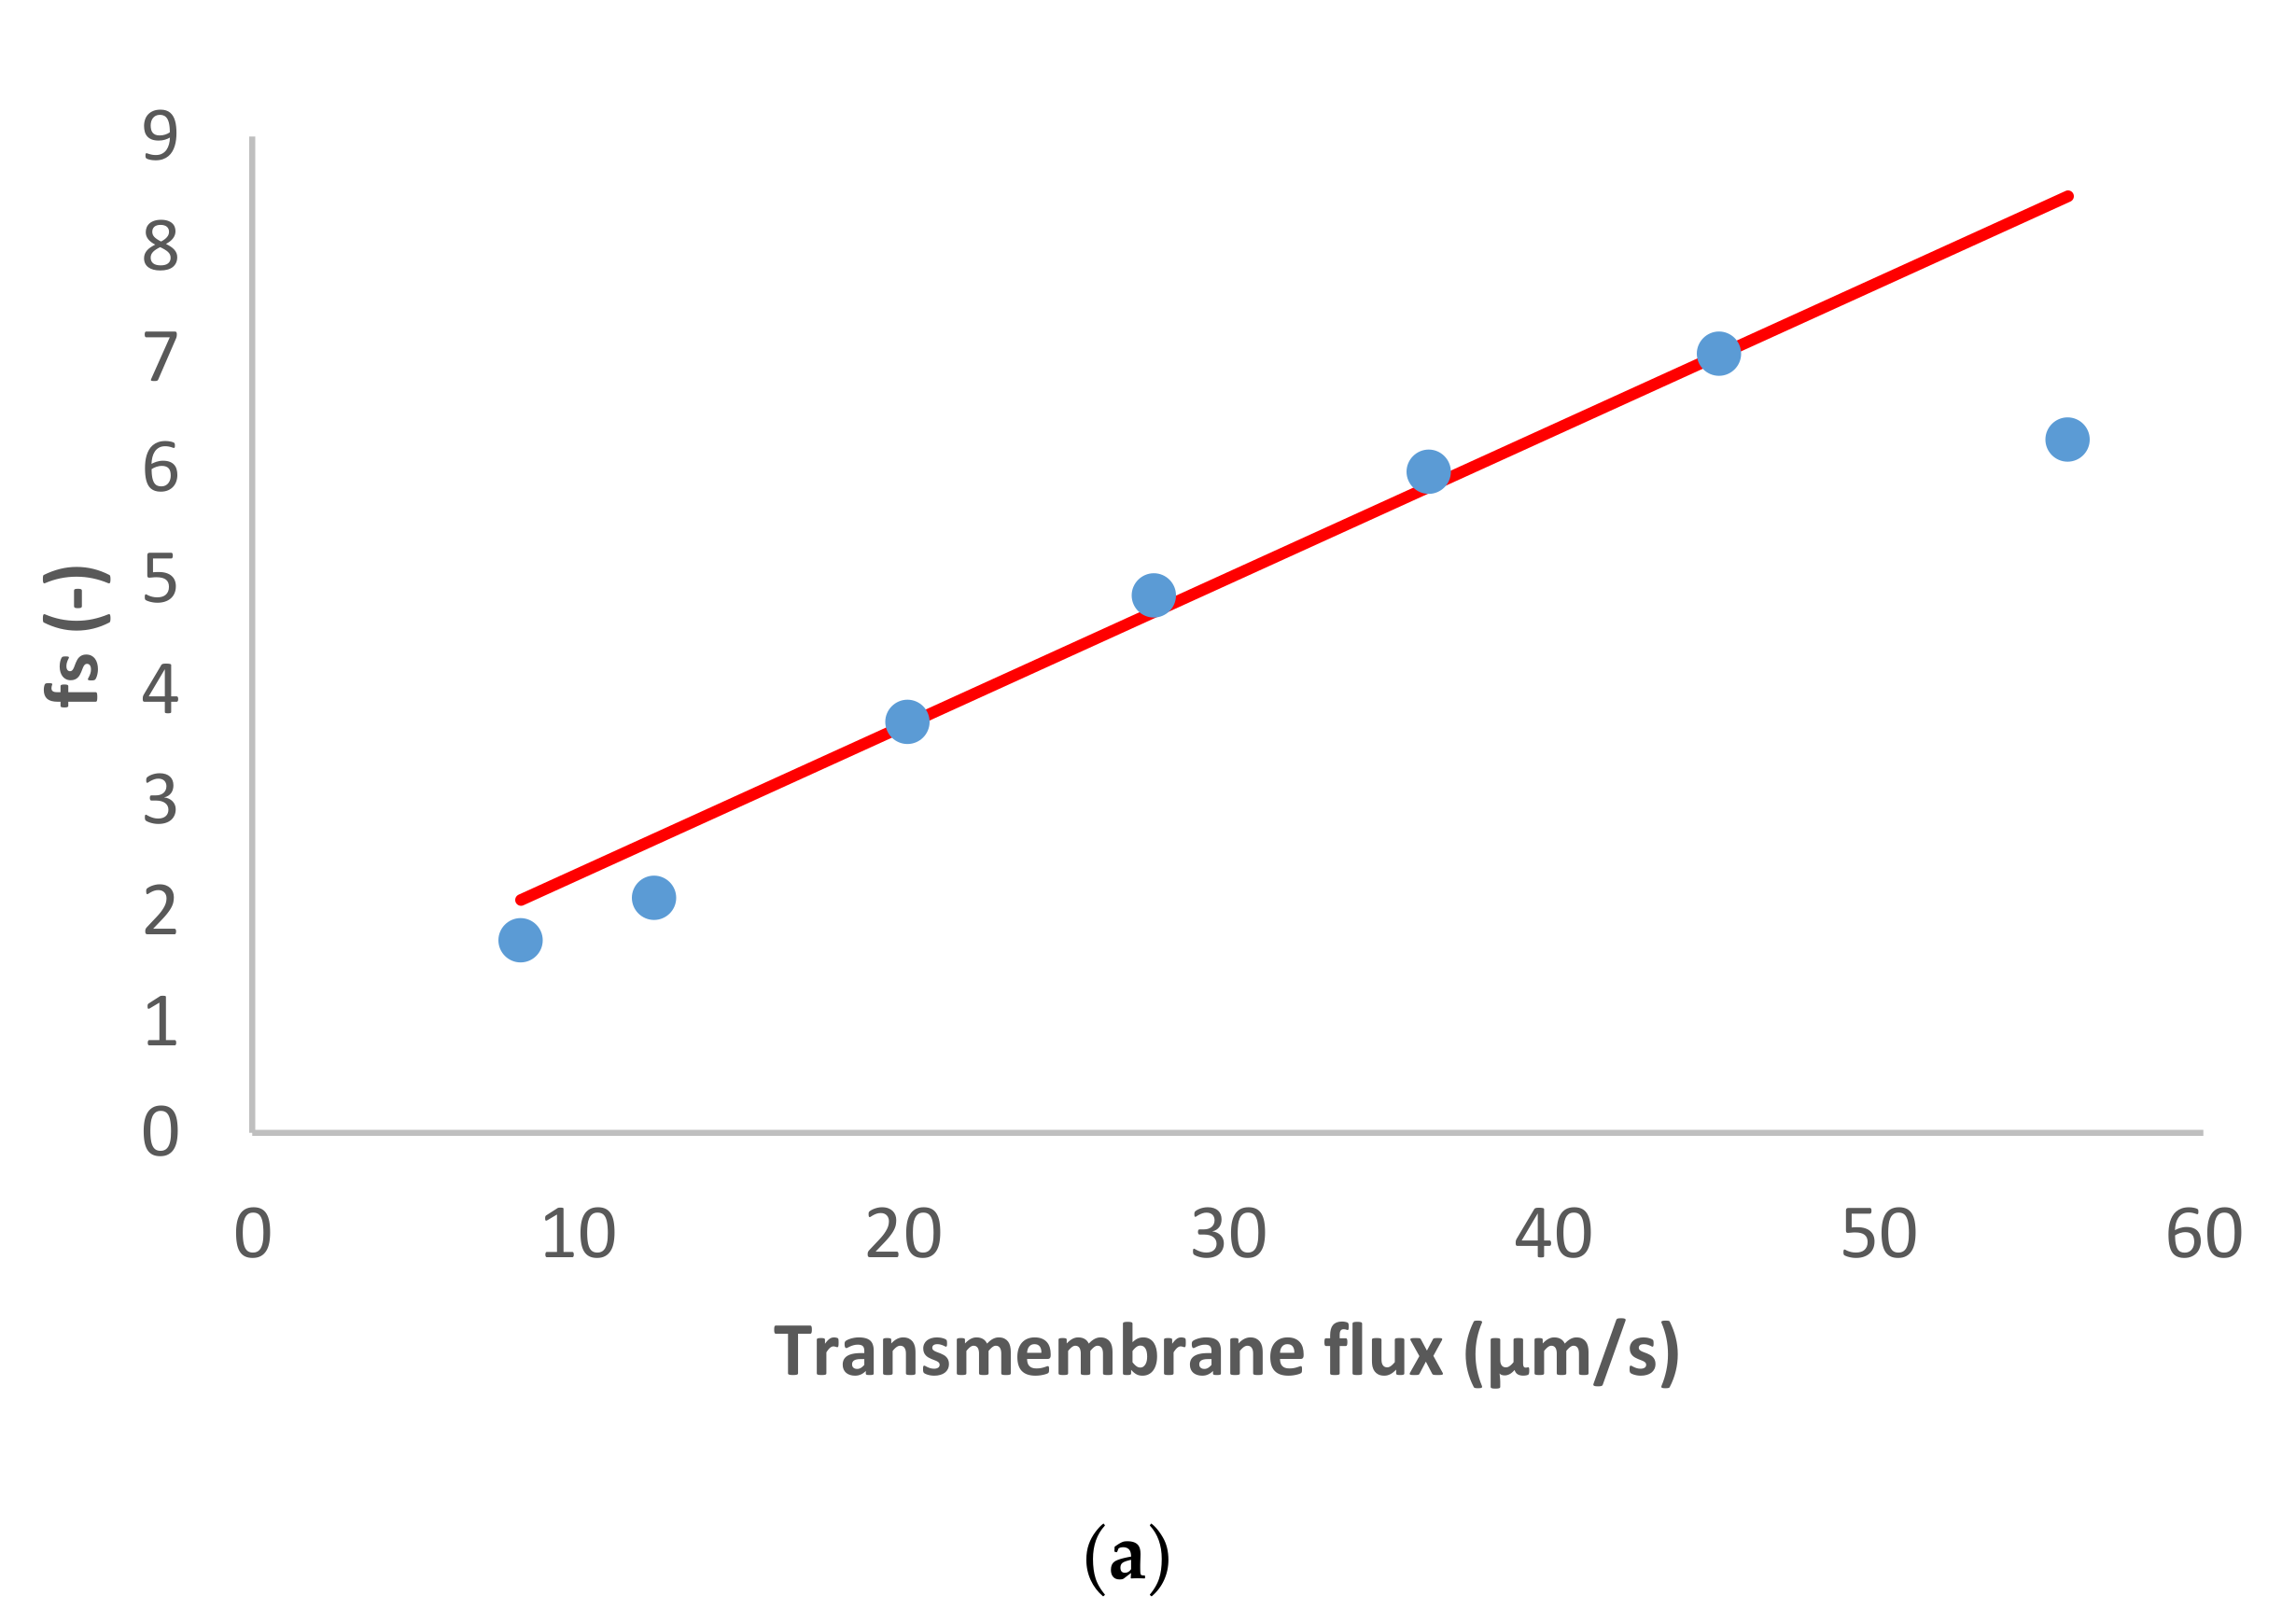
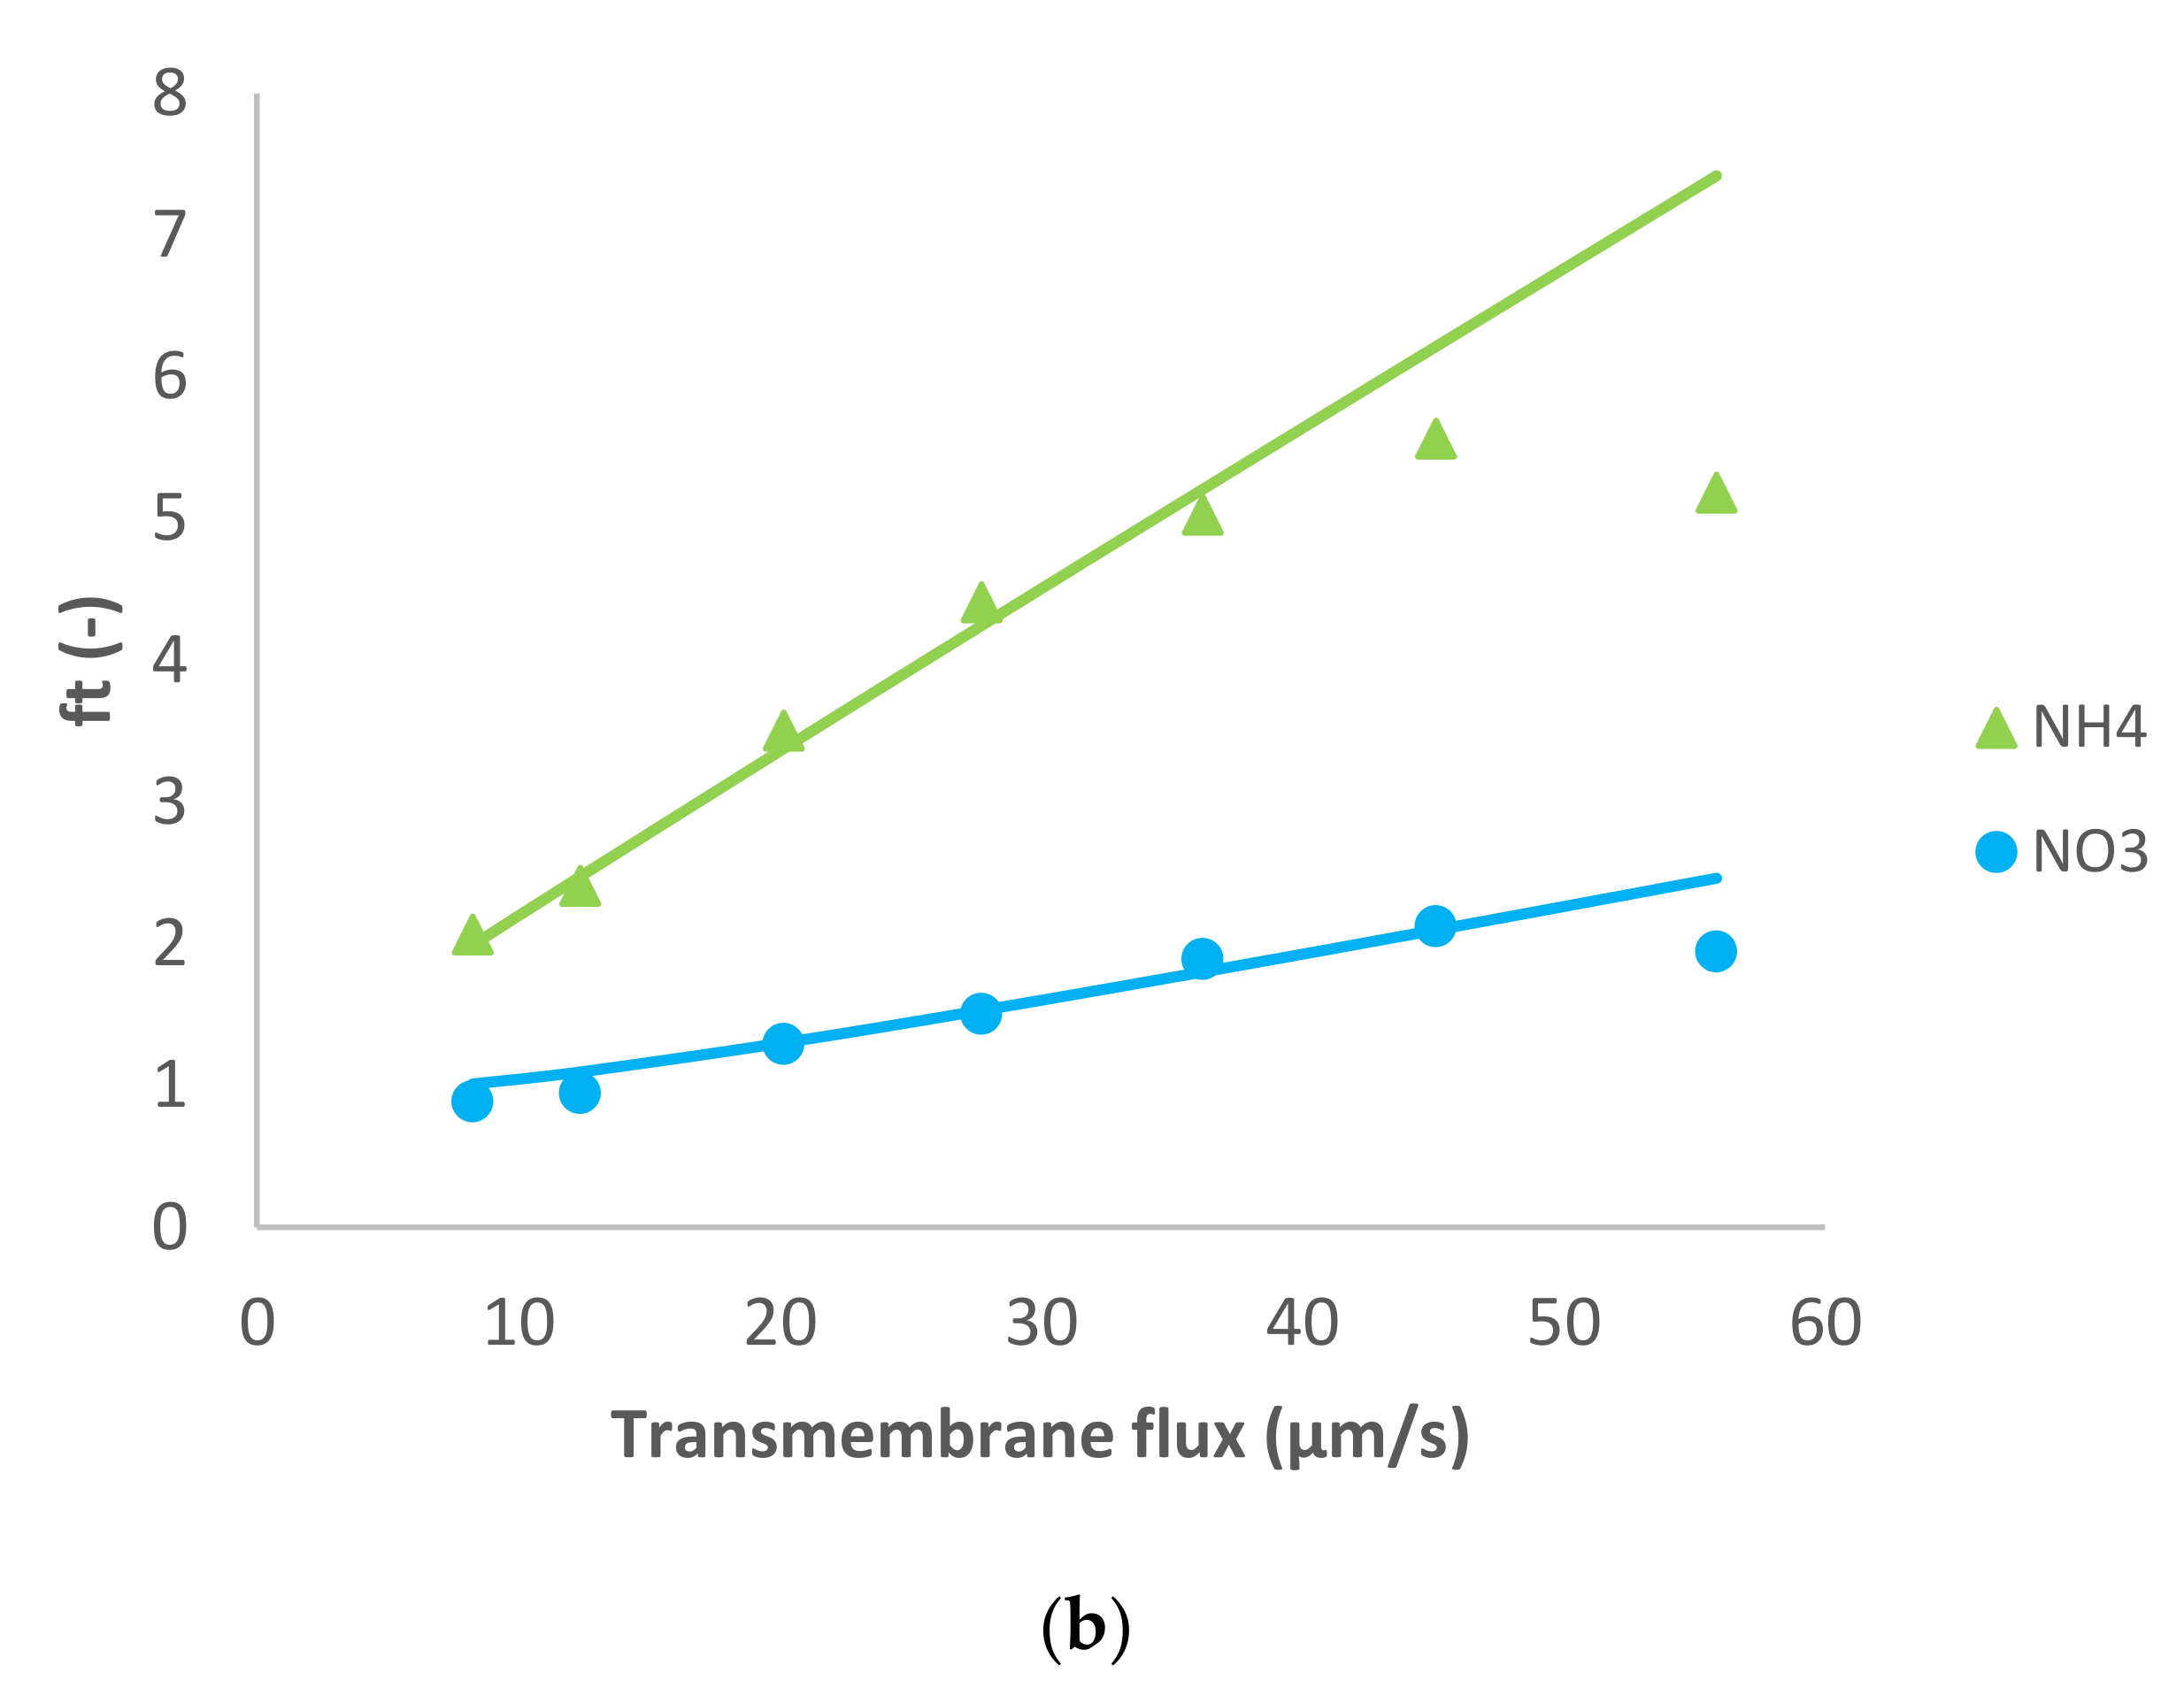
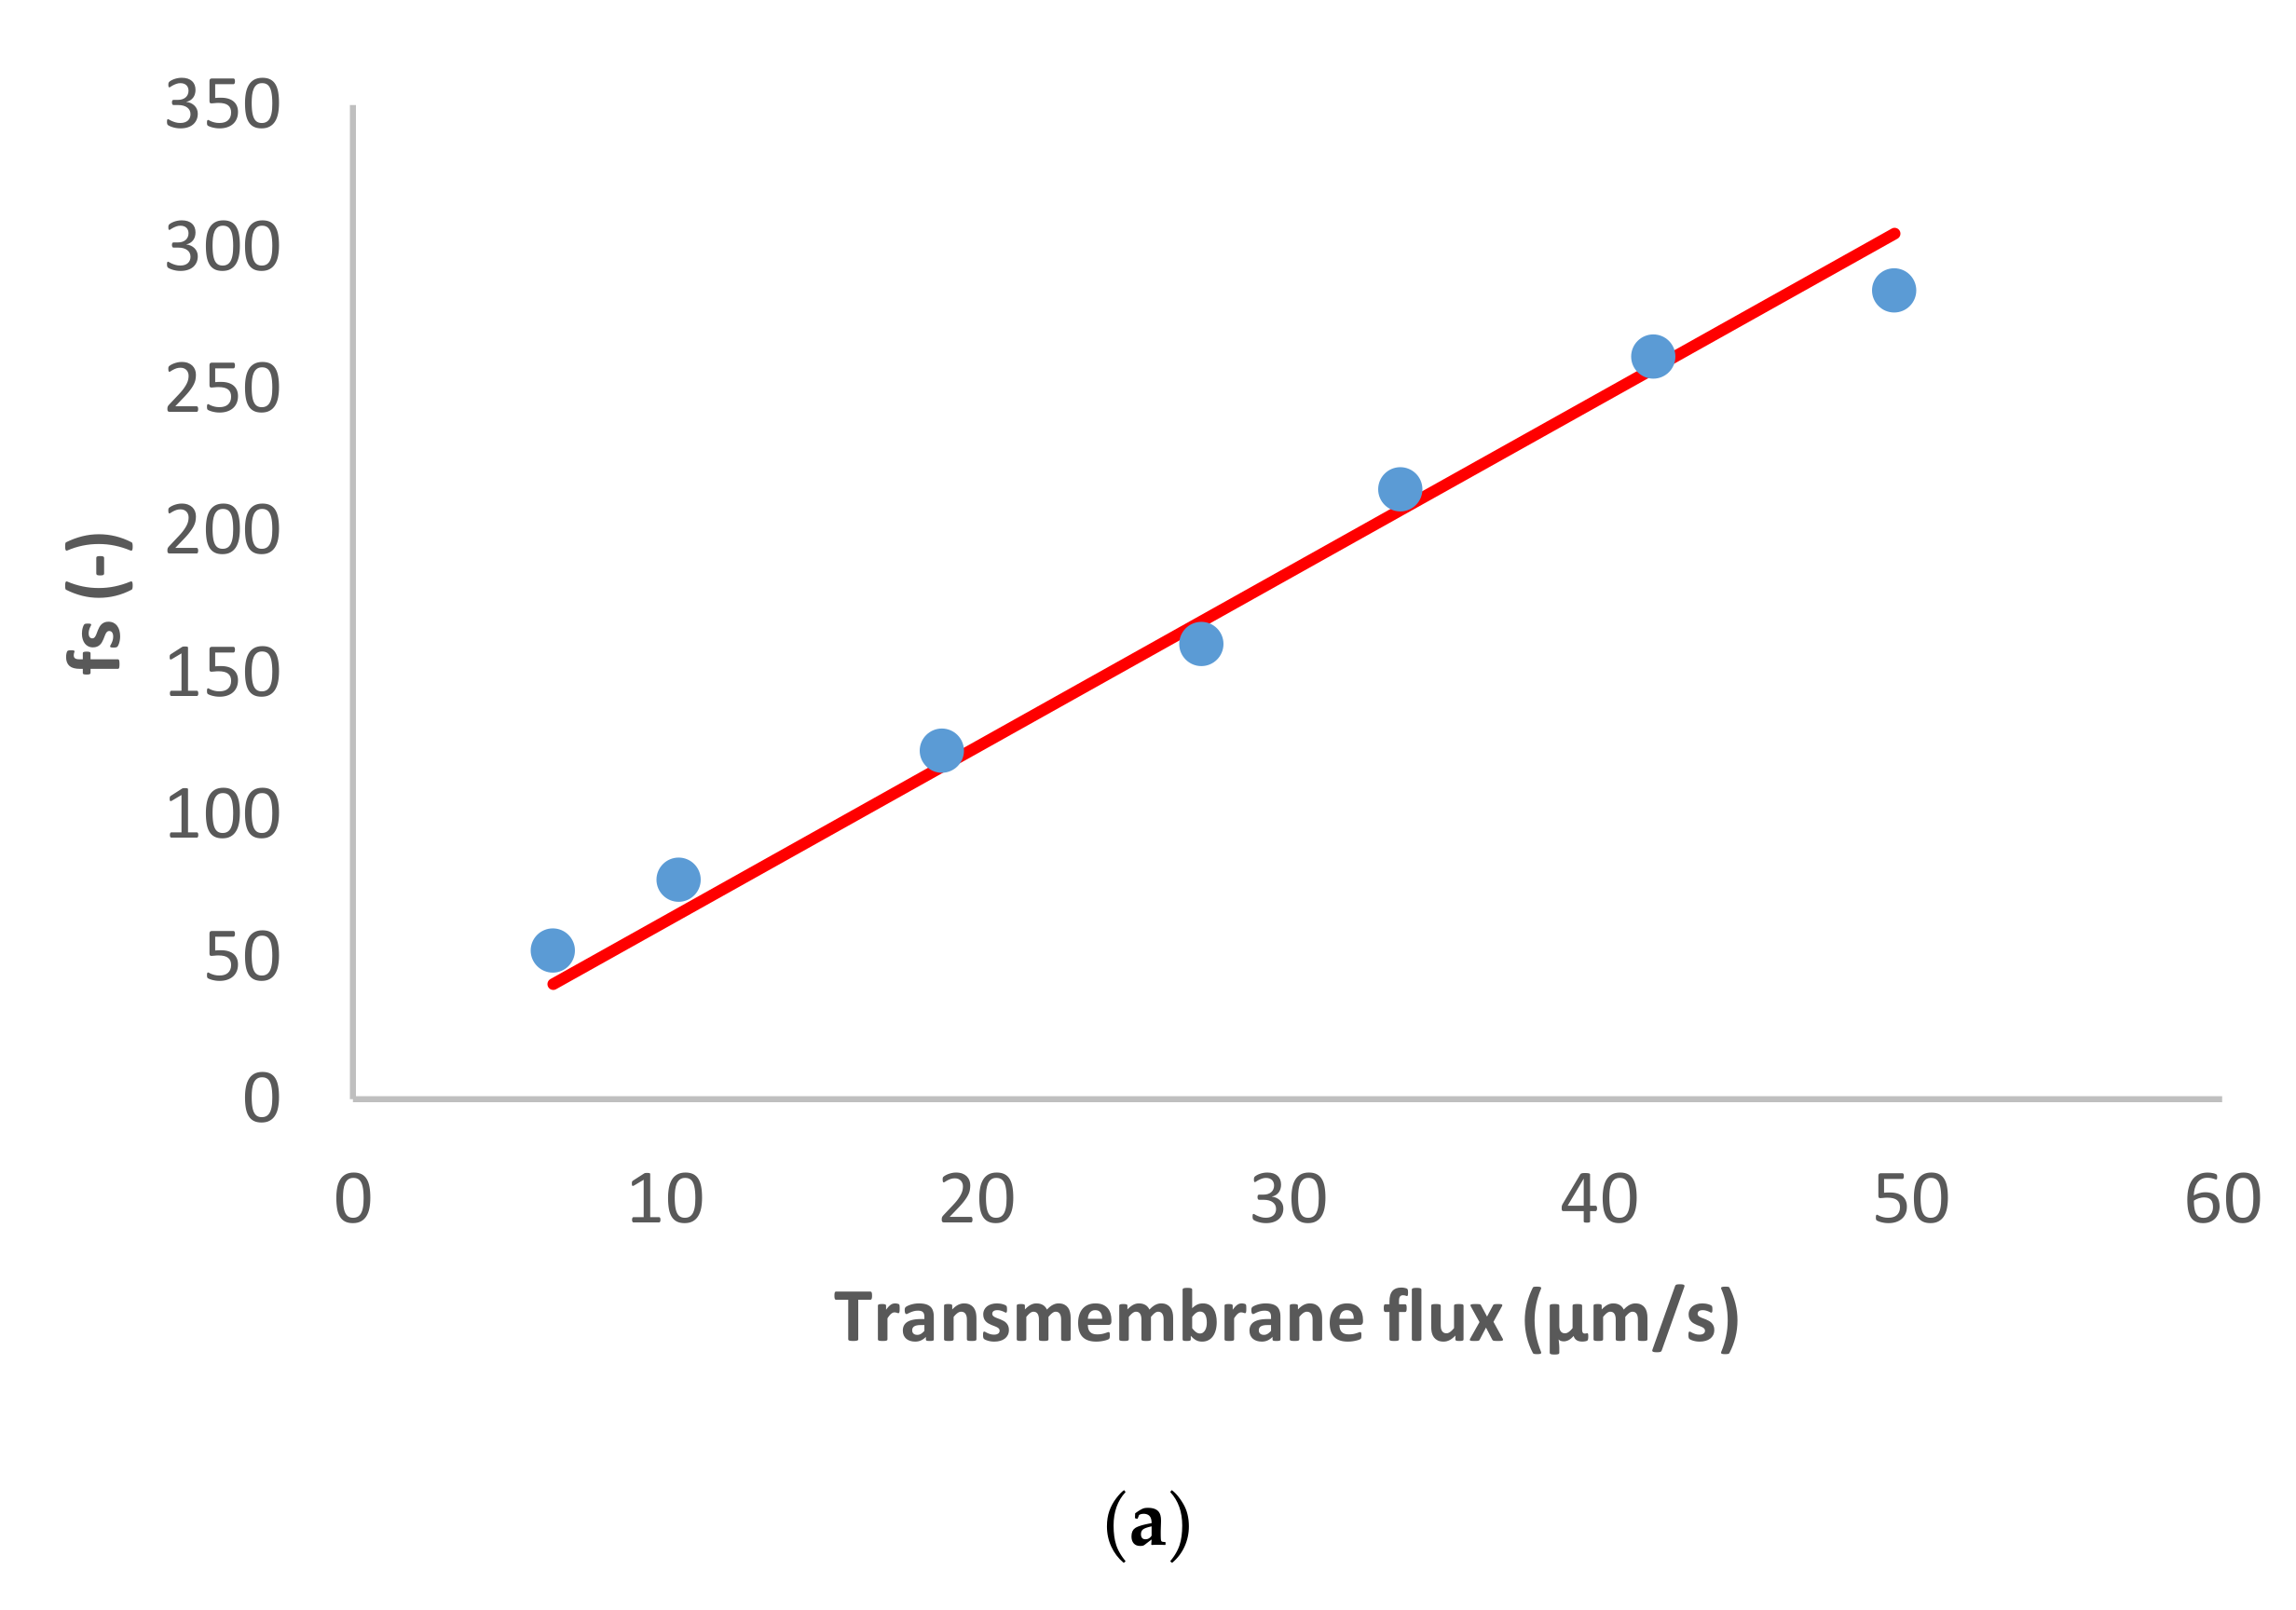
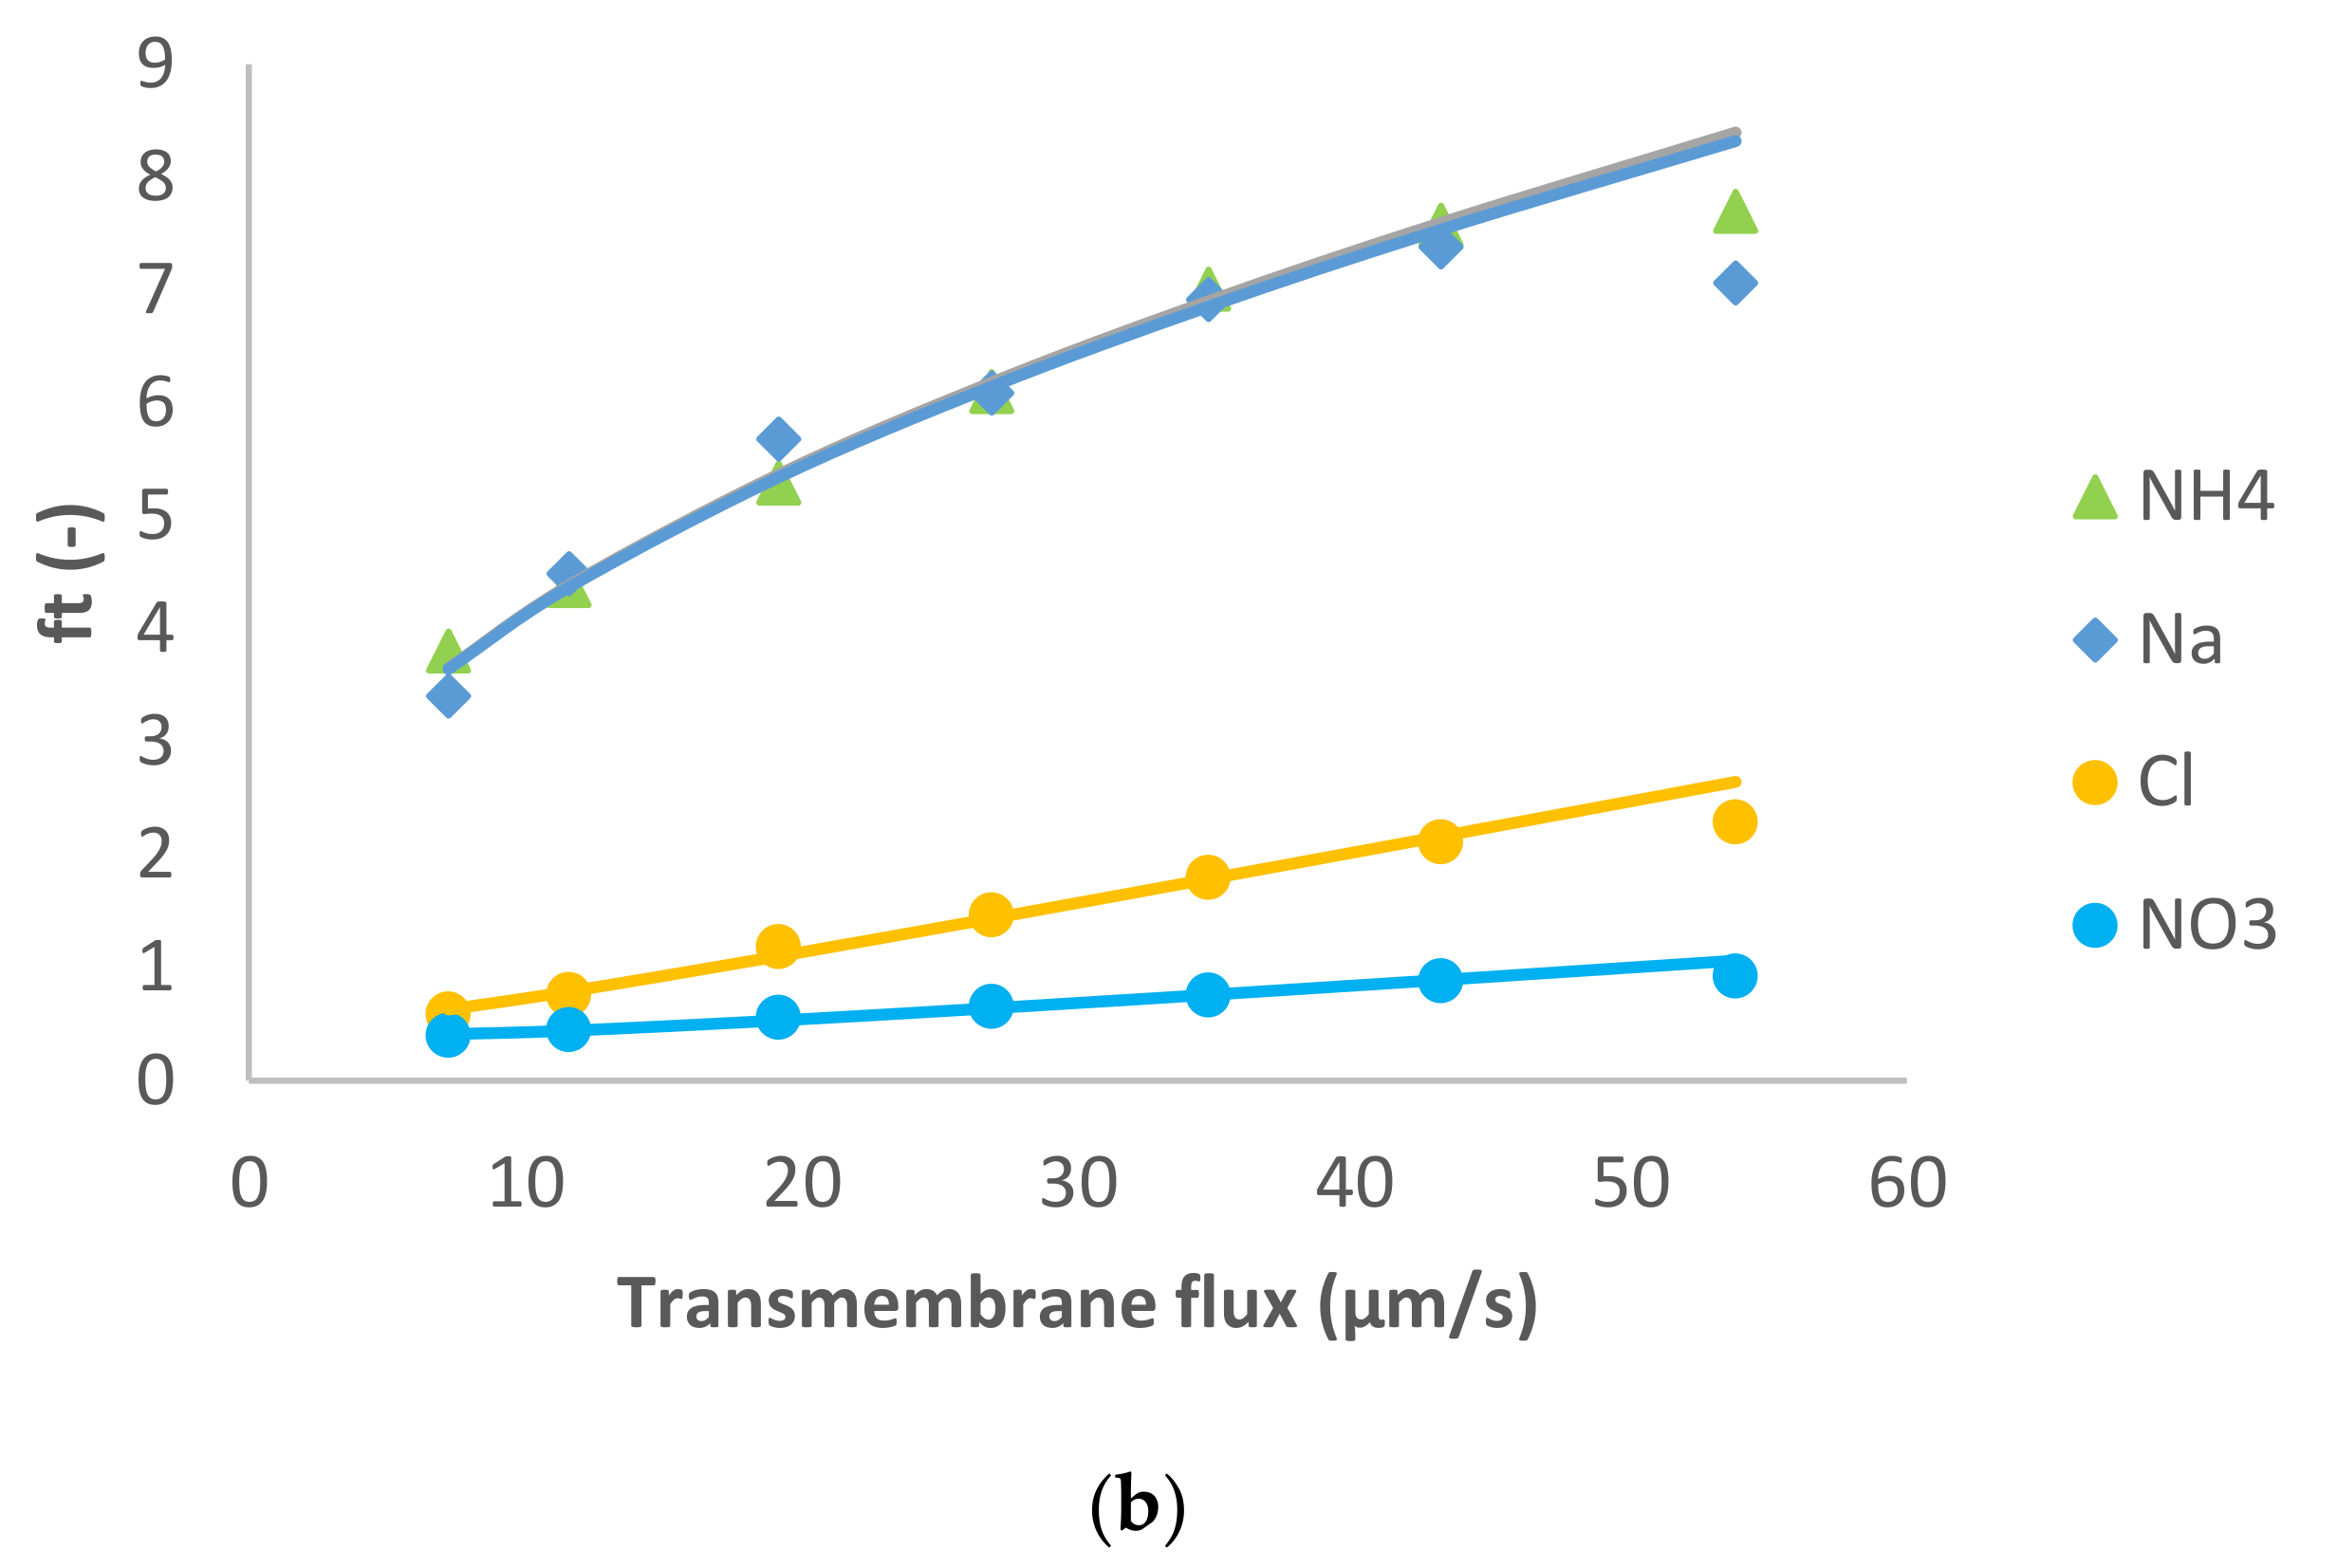
Figure 1 presents the ion rejection of the dominant salt NaCl and trace ions (NH
4+ and NO
3−) in terms of reciprocal intrinsic transmissions. The symbols represent experimental data whereas the lines correspond to the SDEM fits. The experimental data for the dominant salt are in a relatively good agreement with the model (predicting linear dependence) with exception of the highest transmembrane flux (55 µm/s). A similar situation is observed for the traces, although in the case of NH
4+ the deviations start at a lower transmembrane flux (35 µm/s) and are more pronounced than in the case of the dominant salt. Actually, modelling for NH
4+ became insensitive to the value of ionic permeance as this increased, so it was not possible to estimate an exact value in this case.
Both the dominant salt and the NH
4+ trace were well-rejected as can be seen in
Figure 1, their rejections being between 40–80%. On the other hand, NO
3− trace rejections were below 50% and it even experienced lightly negative values at small transmembrane fluxes. Negative rejections are due to spontaneously arising transmembrane electric fields induced owing to different membrane permeances for the dominant cations and anions [
10]. In the case of dominant NaCl solution, the membrane is less permeable to Cl
− than to Na
+ (see
Table 1), which is expected given that NF270 is negatively charged. Accordingly, the transport of NO
3− is enhanced, leading to negative rejections at small transmembrane fluxes due to the fact that the permeance to NO
3− is noticeably higher than that to Cl
−. Finally, NO
3− rejections turn positive when the electromigration NO
3− flux tends to saturation while the permeate gets ever more diluted due to the linear increase in the transmembrane volume.
Reig et al. [
15] studied the effect of dominant NaCl feed concentration on the removal of NH
4+ and NO
3− traces. The authors observed that increasing dominant salt concentration decreased the rejection of dominant salt and trace ions. In agreement with this, the membrane permeance to dominant salt determined in the present study (at a lower concentration) is lower than the value reported by Reig et al.
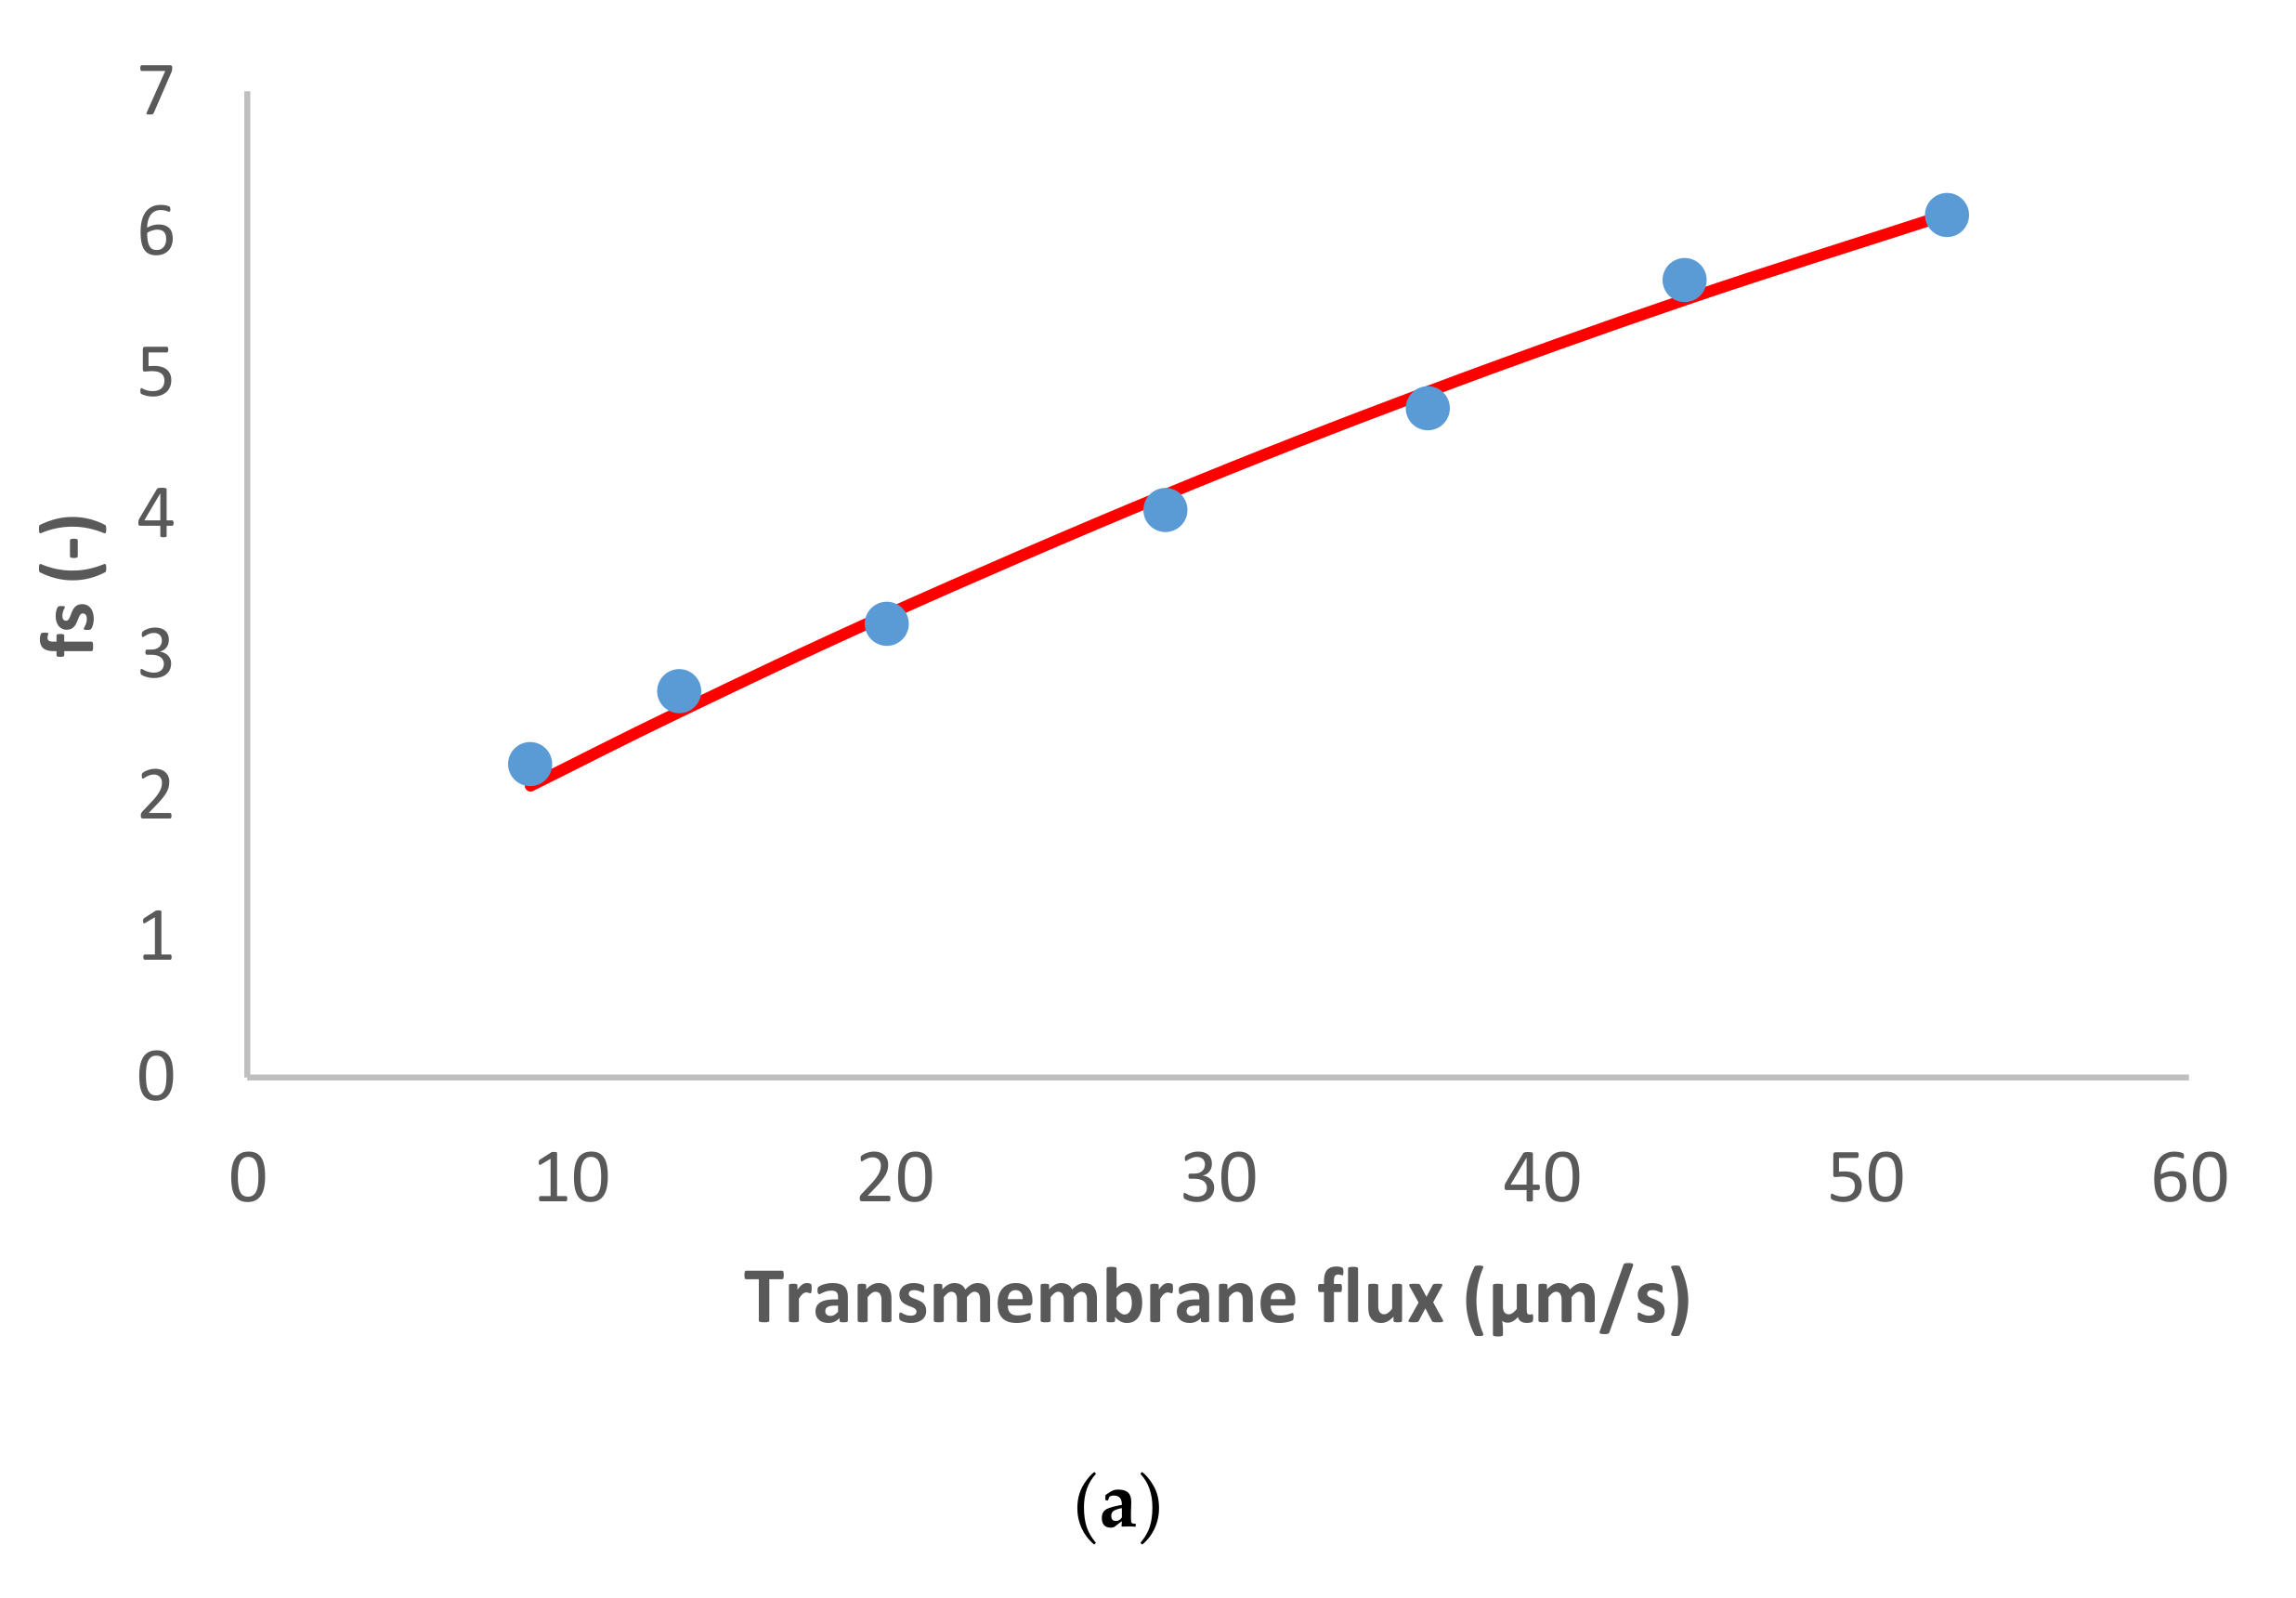
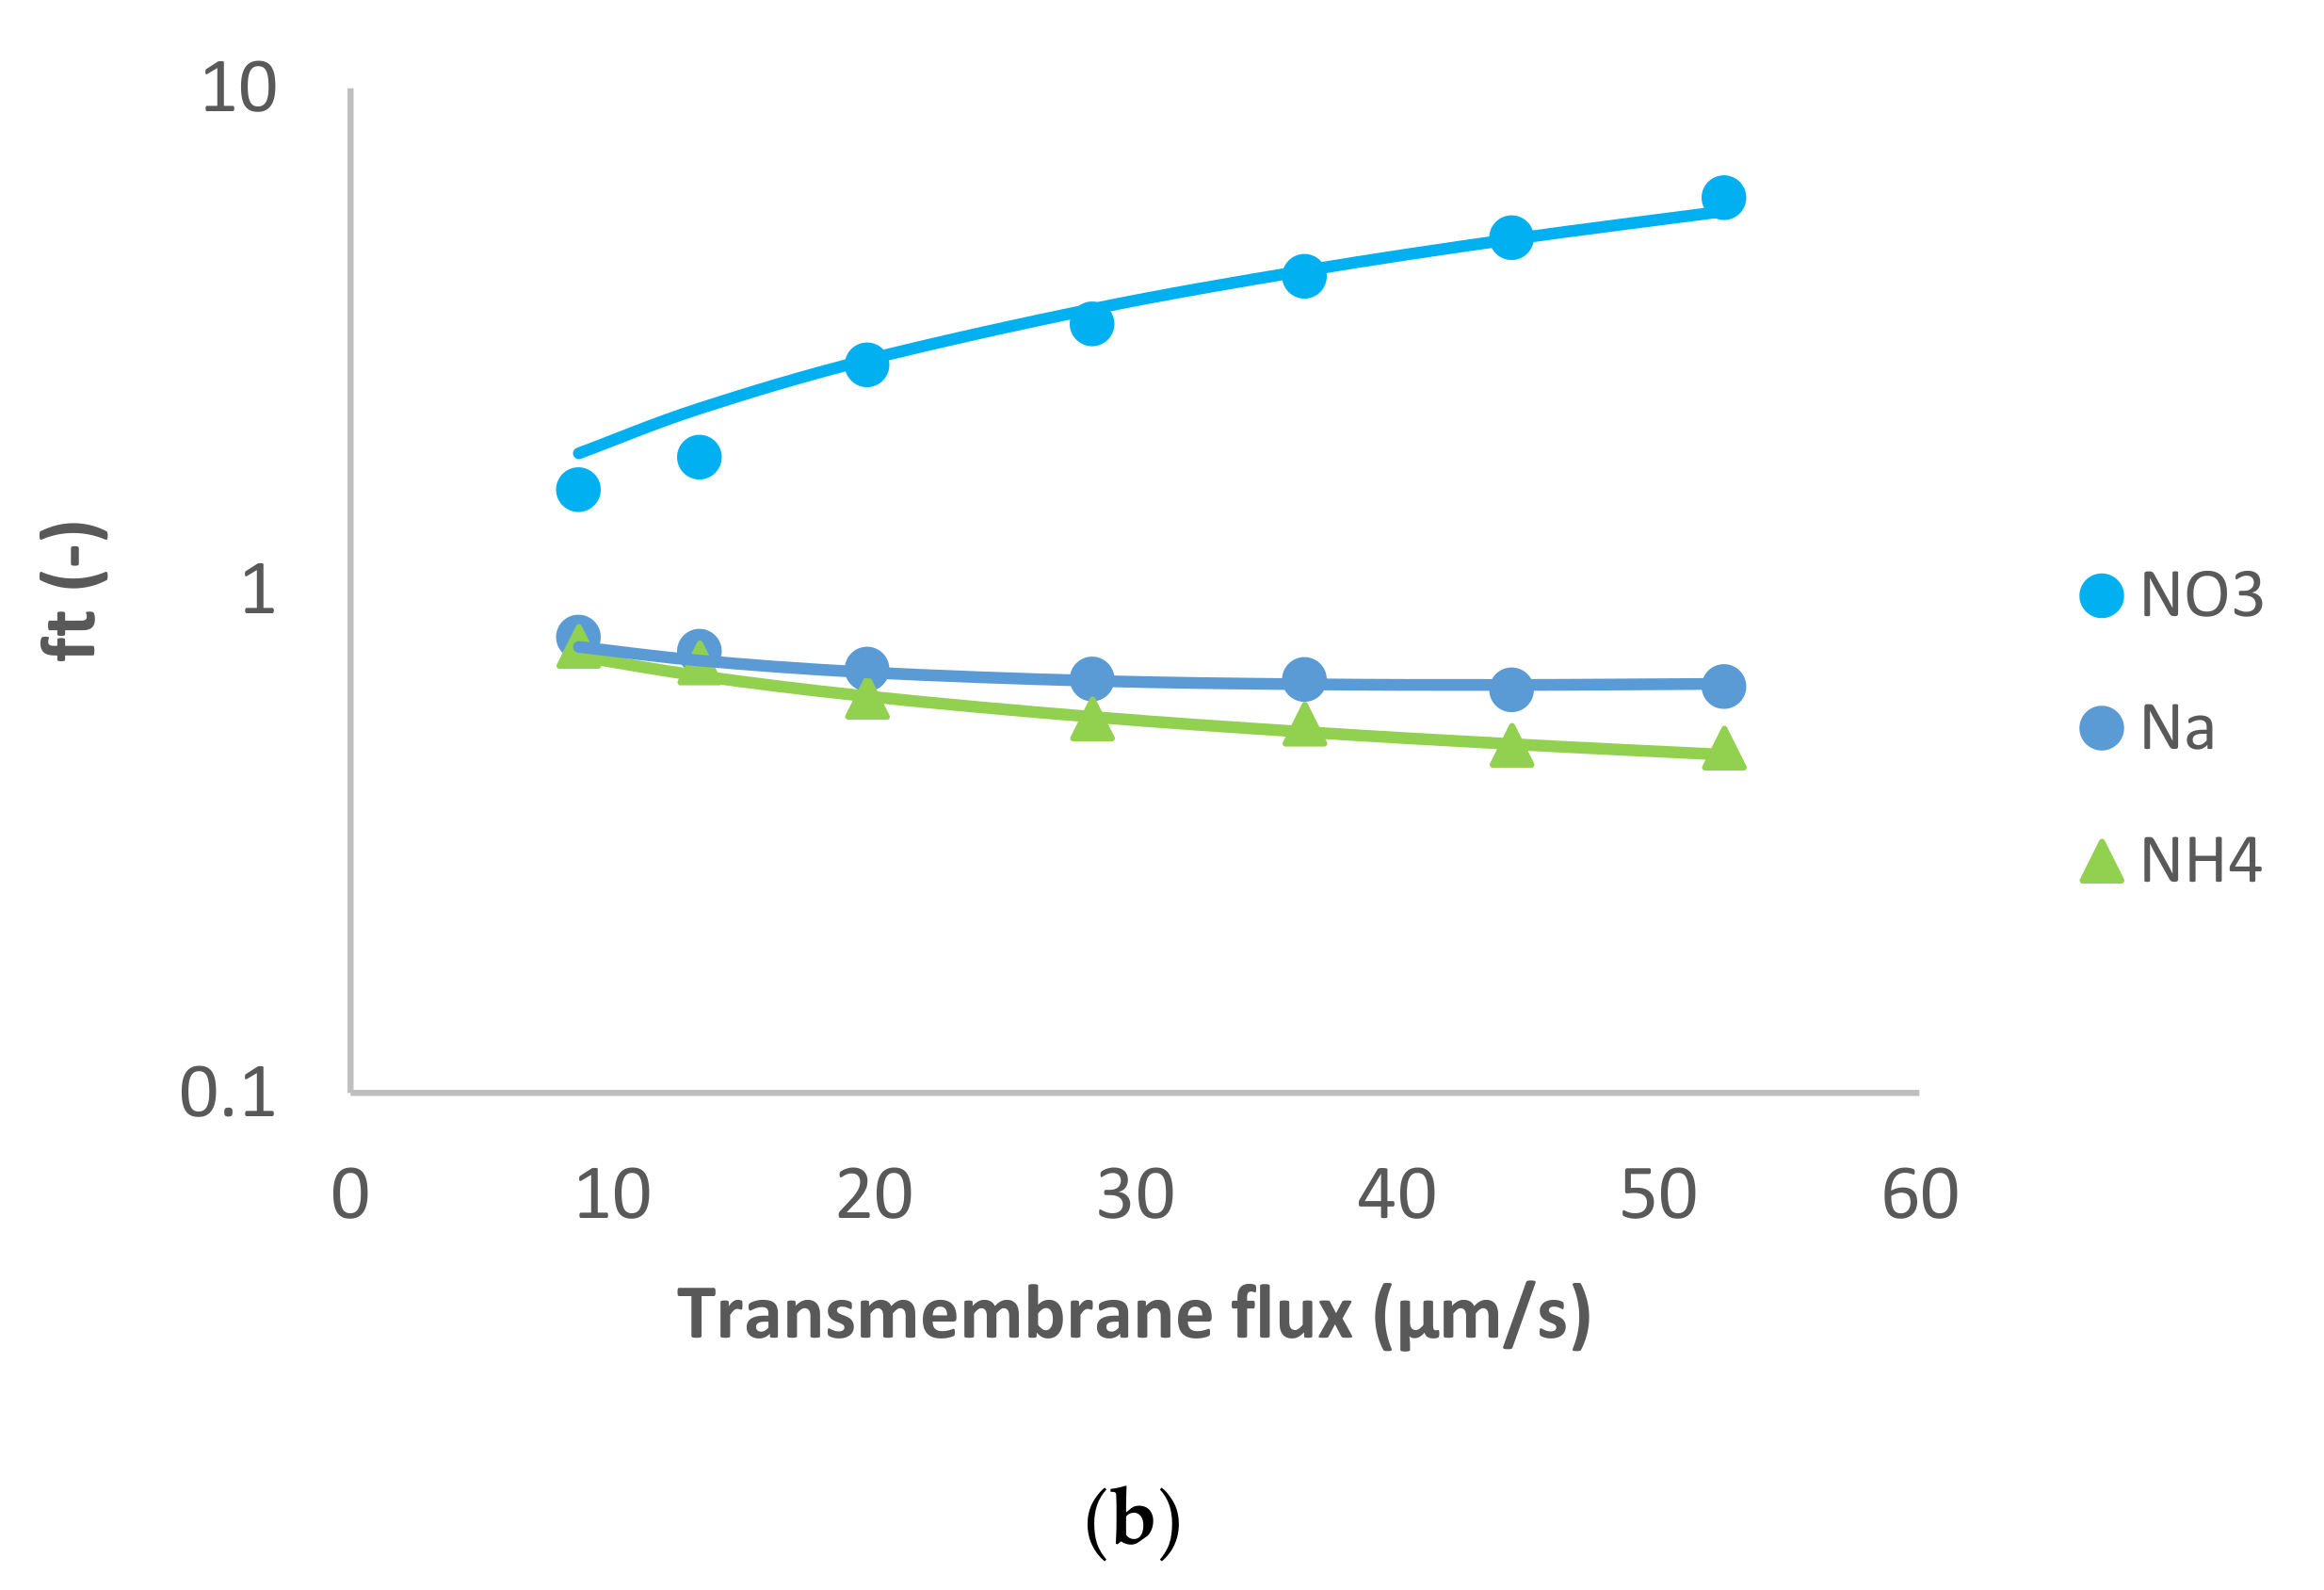
The following case study consisted of the dominant salt MgCl
2 and Na
+, NH
4+ and NO
3− as the trace ions.
Figure 2 shows the model fit of the experimental data. Similarly to the previous case, for the dominant salt there are some deviations between the experimental data and the modelling curves. However, the quality of the linear fit is quite good.
In this case, the presence of a divalent cation leads to the opposite situation compared with the previous case. The membrane permeance to Mg
2+ is lower than to Cl
− (see
Table 1), so the spontaneously arising electric field accelerates the cations. As a result, Na
+ and NH
4+ presented negative rejections whereas NO
3− rejection was positive as can be seen in
Figure 2.
MgCl
2 dominant salt rejections are higher than those of NaCl (between 45–90%), which is expectable considering that dielectric exclusion is stronger in electrolytes with double-charge ions. Accordingly, the membrane permeance to MgCl
2 is lower than to NaCl (
Table 1). Due to the better rejection of MgCl
2 (the larger difference in the permeances between Mg
2+ and Cl
−, and much higher ion permeances for both trace cations) in this case the cationic traces experience quite pronounced negative rejections as discussed previously [
17]. Similarly to the previous case, for both NH
4+ and Na
+ the fitted ion rejections were rather insensitive to the assumed values of ion permeances so these could only be determined by the order of magnitude. Nonetheless, they are clearly by an order of magnitude larger than in the case of dominant NaCl. This may be due to a much stronger exclusion of Mg
2+ ions from the membrane phase than that of Cl
−. As demonstrated in [
18] such preferential exclusion of cations gives rise to the appearance of an interphase electrostatic-potential difference that can enhance the partitioning of other cations (including monovalent) into the membrane phase and can considerably increase the membrane permeance to them.
On the other hand, NO3− was much better rejected than in the presence of NaCl as the dominant salt (intrinsic rejections were up to 85%), which is expected in view of the fact that the electric field decreases the passage of NO3− through the membrane when MgCl2 is the dominant salt.
Pagès et al. [
14] studied MgCl
2 as a dominant salt and a number of trace ions using a higher feed solution concentration (0.1 M) than the one used in this work. The authors reported a membrane permeance to dominant salt around 2 µm/s, which is lower than the one estimated in this work at a lower feed solution concentration. Unlike the case of dominant NaCl, this trend is in disagreement with the simple Donnan rejection mechanism but has already been reported in other studies for MgCl
2 [
19] as well as for CaCl
2 [
3]. A possible explanation for this as a result of combination of impact of unequal ion exclusion from the membrane and its negative surface charge has been put forward in [
20].
The last two cases (Na
2SO
4 and MgSO
4) have in common the divalent anion SO
42−. The membrane permeance to this ion is much lower than the permeance to either of the dominant cations (see
Table 1). Therefore, in both cases the transport of trace anions is improved whereas that of trace cations is retarded. In these cases, trace ions cannot be accounted as authentic traces due to the very high rejections of SO
42−. Accordingly, the reciprocal transmission of the more permeable ion (such as Na
+ in Na
2SO
4) could be basically lower than that for SO
42− since the transmembrane passing of anion traces partially contributed to the fulfilment of zero electric current condition.
Figure 3 shows the results obtained in the case of dominant Na
2SO
4 and traces of NH
4+, Cl
− and NO
3−. Notably, in situations of a very strong asymmetry in the permeances to the dominant cation and anions (like in the case of Na
2SO
4), the determination of permeance of the more permeable ion (such as Na
+ in Na
2SO
4) becomes very imprecise since its variation does not influence the salt permeance. Accordingly, the value of Na
+ permeance in this case is just orientative. The situation with NH
4+ is similar.
The dominant salt was highly rejected as well as the NH4+ trace. Concerning the trace anions, a different behavior was observed between the two traces: NO3− presented initially pronounced negative rejections (as much as 131%) that turned to positive reaching a maximum value of 63% while Cl− rejections were positive in all the transmembrane flux range studied (between 21–85%).
Such behavior of trace NO3− is primarily explained by the very high rejection of dominant salt (and very strong asymmetry in the permeances to the dominant cations and anions). Due to these factors, the spontaneously arising electric fields are very strong already at quite small transmembrane volume flows (hence the initially pronounced negative rejections). At the same time, these fields tend to become saturated at relatively low fluxes, which gives rise to the rapid change to the positive rejections of trace NO3−. The comparison of the behavior of traces of NO3− and Cl− in this case shows that occurrence of negative rejections also requires the trace anion to have a certain minimum permeance, which is largely surpassed by NO3− but not reached by Cl− (hence, the lack of negative rejections for it).
The last case studied is MgSO
4 like dominant salt and NH
4+, Na
+, Cl
− and NO
3− as trace ions (
Figure 4). The dominant salt was highly rejected, as in the previous case, and the trace cations were also rejected. Both trace anions exhibited negative rejections in this case: Cl
− was negatively rejected at small transmembrane flux (−70%), but its rejection increased up to 60%, while the values for NO
3− were negative in all the range of transmembrane fluxes studied (from −151% to −5%). To fit these more pronounced negative rejections by the model we had to assume noticeably higher ion permeances for the trace single-charge anions than in the case of dominant Na
2SO
4. Remarkably, the ratio of permeances to NO
3− and Cl
− for all the studied cases was roughly around 3.
The obtained sequence of membrane permeances to dominant salt is in qualitative agreement with the published results for negatively charged membranes [
14,
21]. It can be explained by a combination of Donnan and dielectric exclusion of ions. Donnan exclusion is due to the interactions of ions with fixed electric charges. Dielectric exclusion is caused by interactions between charged solutes and bound charges induced by them at pore surfaces due to the different dielectric constants of the membrane matrix and the liquid inside the pores [
22]. Donnan exclusion is stronger for double-charge coions (ions whose charge sign coincide with that of fixed charges) while dielectric exclusion is much stronger for double-charge ions irrespective of the sign of their charge. This explains the much lower membrane permeance to Na
2SO
4 than to NaCl. Dielectric exclusion alone would give rise to a still stronger exclusion of MgSO
4 than of Na
2SO
4. However, the double-charged Mg
2+ may well strongly bind to the negative surface charge thus reducing its magnitude and that of the Donnan exclusion as pointed out by Freger et al. [
3] and recently developed by Freger [
23]. Likely for that reason there were deviations from Donnan and dielectric exclusion mechanisms and the membrane permeance to MgSO
4 was somewhat higher than to Na
2SO
4.
Na
+ and Cl
− were studied both as dominant and trace ions. In the cases where Na
+ was part of a dominant salt (NaCl, Na
2SO
4) lower values of permeances were obtained. The lowest permeance to Na
+ corresponds to Na
2SO
4, which is expected given that it is strongly affected by dielectric exclusion in this case. Indeed, the interphase potential attracting sulfate ions to the membrane phase (to make their concentration stoichiometric to that of Na
+) simultaneously expulses positively charged Na
+ ions [
18]. In the case of dominant MgCl
2, the situation is the opposite, namely, the interphase potential (arising due to the different extents of dielectric exclusion for Mg
2+ and Cl
−) attracts cations to the membrane phase in this case making the permeance to Na
+ ions high. Finally, in the case of MgSO
4 the extent of dielectric exclusion for both dominant ions is roughly the same so the additional trace Na
+ attraction to the membrane phase does not occur and the permeance to it is lower, accordingly.
Regarding Cl−, the highest permeance was obtained for it when added as a trace to dominant MgSO4. This could be explained by the presence of a divalent cation, which reduced the Donnan exclusion of anions (see above). Qualitatively the same occurrence could explain the relatively large permeance to Cl− as a part of dominant MgCl2. The Cl− permeances are surprisingly close in the cases of dominant NaCl and Na2SO4. Given the very different patterns of interaction of dominant anions with the membrane in these two cases, this seems to be rather a result of the accidental compensation of counteracting trends characteristic of Donnan and dielectric exclusion.
NH4+ and NO3− were trace ions in all the experiments. For the NH4+ traces, the fitted permeances in most cases were so high that the rejections became insensitive to the permeance to this ion. Accordingly, only the lower limits for the permeances could be determined. Just for the dominant MgSO4 the fitting procedure allowed to estimate a specific value for the NH4+ permeance. Even though the permeances could not be determined accurately, the results seem to indicate that the highest permeance occurred in MgCl2, which could have the same mechanisms as in the case of traces of Na+ (see above). In the case of dominant Na2SO4, the asymmetry of the dielectric exclusion of the dominant cations and anions was in favor of the latter. Accordingly, the interphase potential repulsed cations (including traces of NH4+) from the membrane phase, hence the lower permeance. Overall, the permeances of NH4+ seem to be noticeably larger than those of Na+, which is rather difficult to explain by simple mechanisms given, for example, the very close hydrated radii of those two ions in aqueous solutions. Apparently, some more subtle phenomena related to different details of the interaction of these two ions with water and membrane matrix are in play.
The dependence of the permeances of NO3− on the kind of dominant salt roughly followed that observed for Cl− but the NO3− permeances on average were around three times larger. Again, this is rather difficult to explain by simple mechanisms given the very close hydrated radii of those two ions in aqueous solutions. As in the case of NH4+ vs. Na+ subtler mechanisms seem to be in play.


