
Understanding of Adsorption and Desorption Mechanisms of Anthocyanins and Proanthocyanidins on Heterogeneous and Homogeneous Cation-Exchange Membranes

 ,
,  ,
, 
Abstract
:1. Introduction
2. Materials and Methods
2.1. Materials
2.1.1. Cranberry Juice
2.1.2. Membranes
2.2. Methods
2.2.1. Characterization of Pristine Membrane Properties
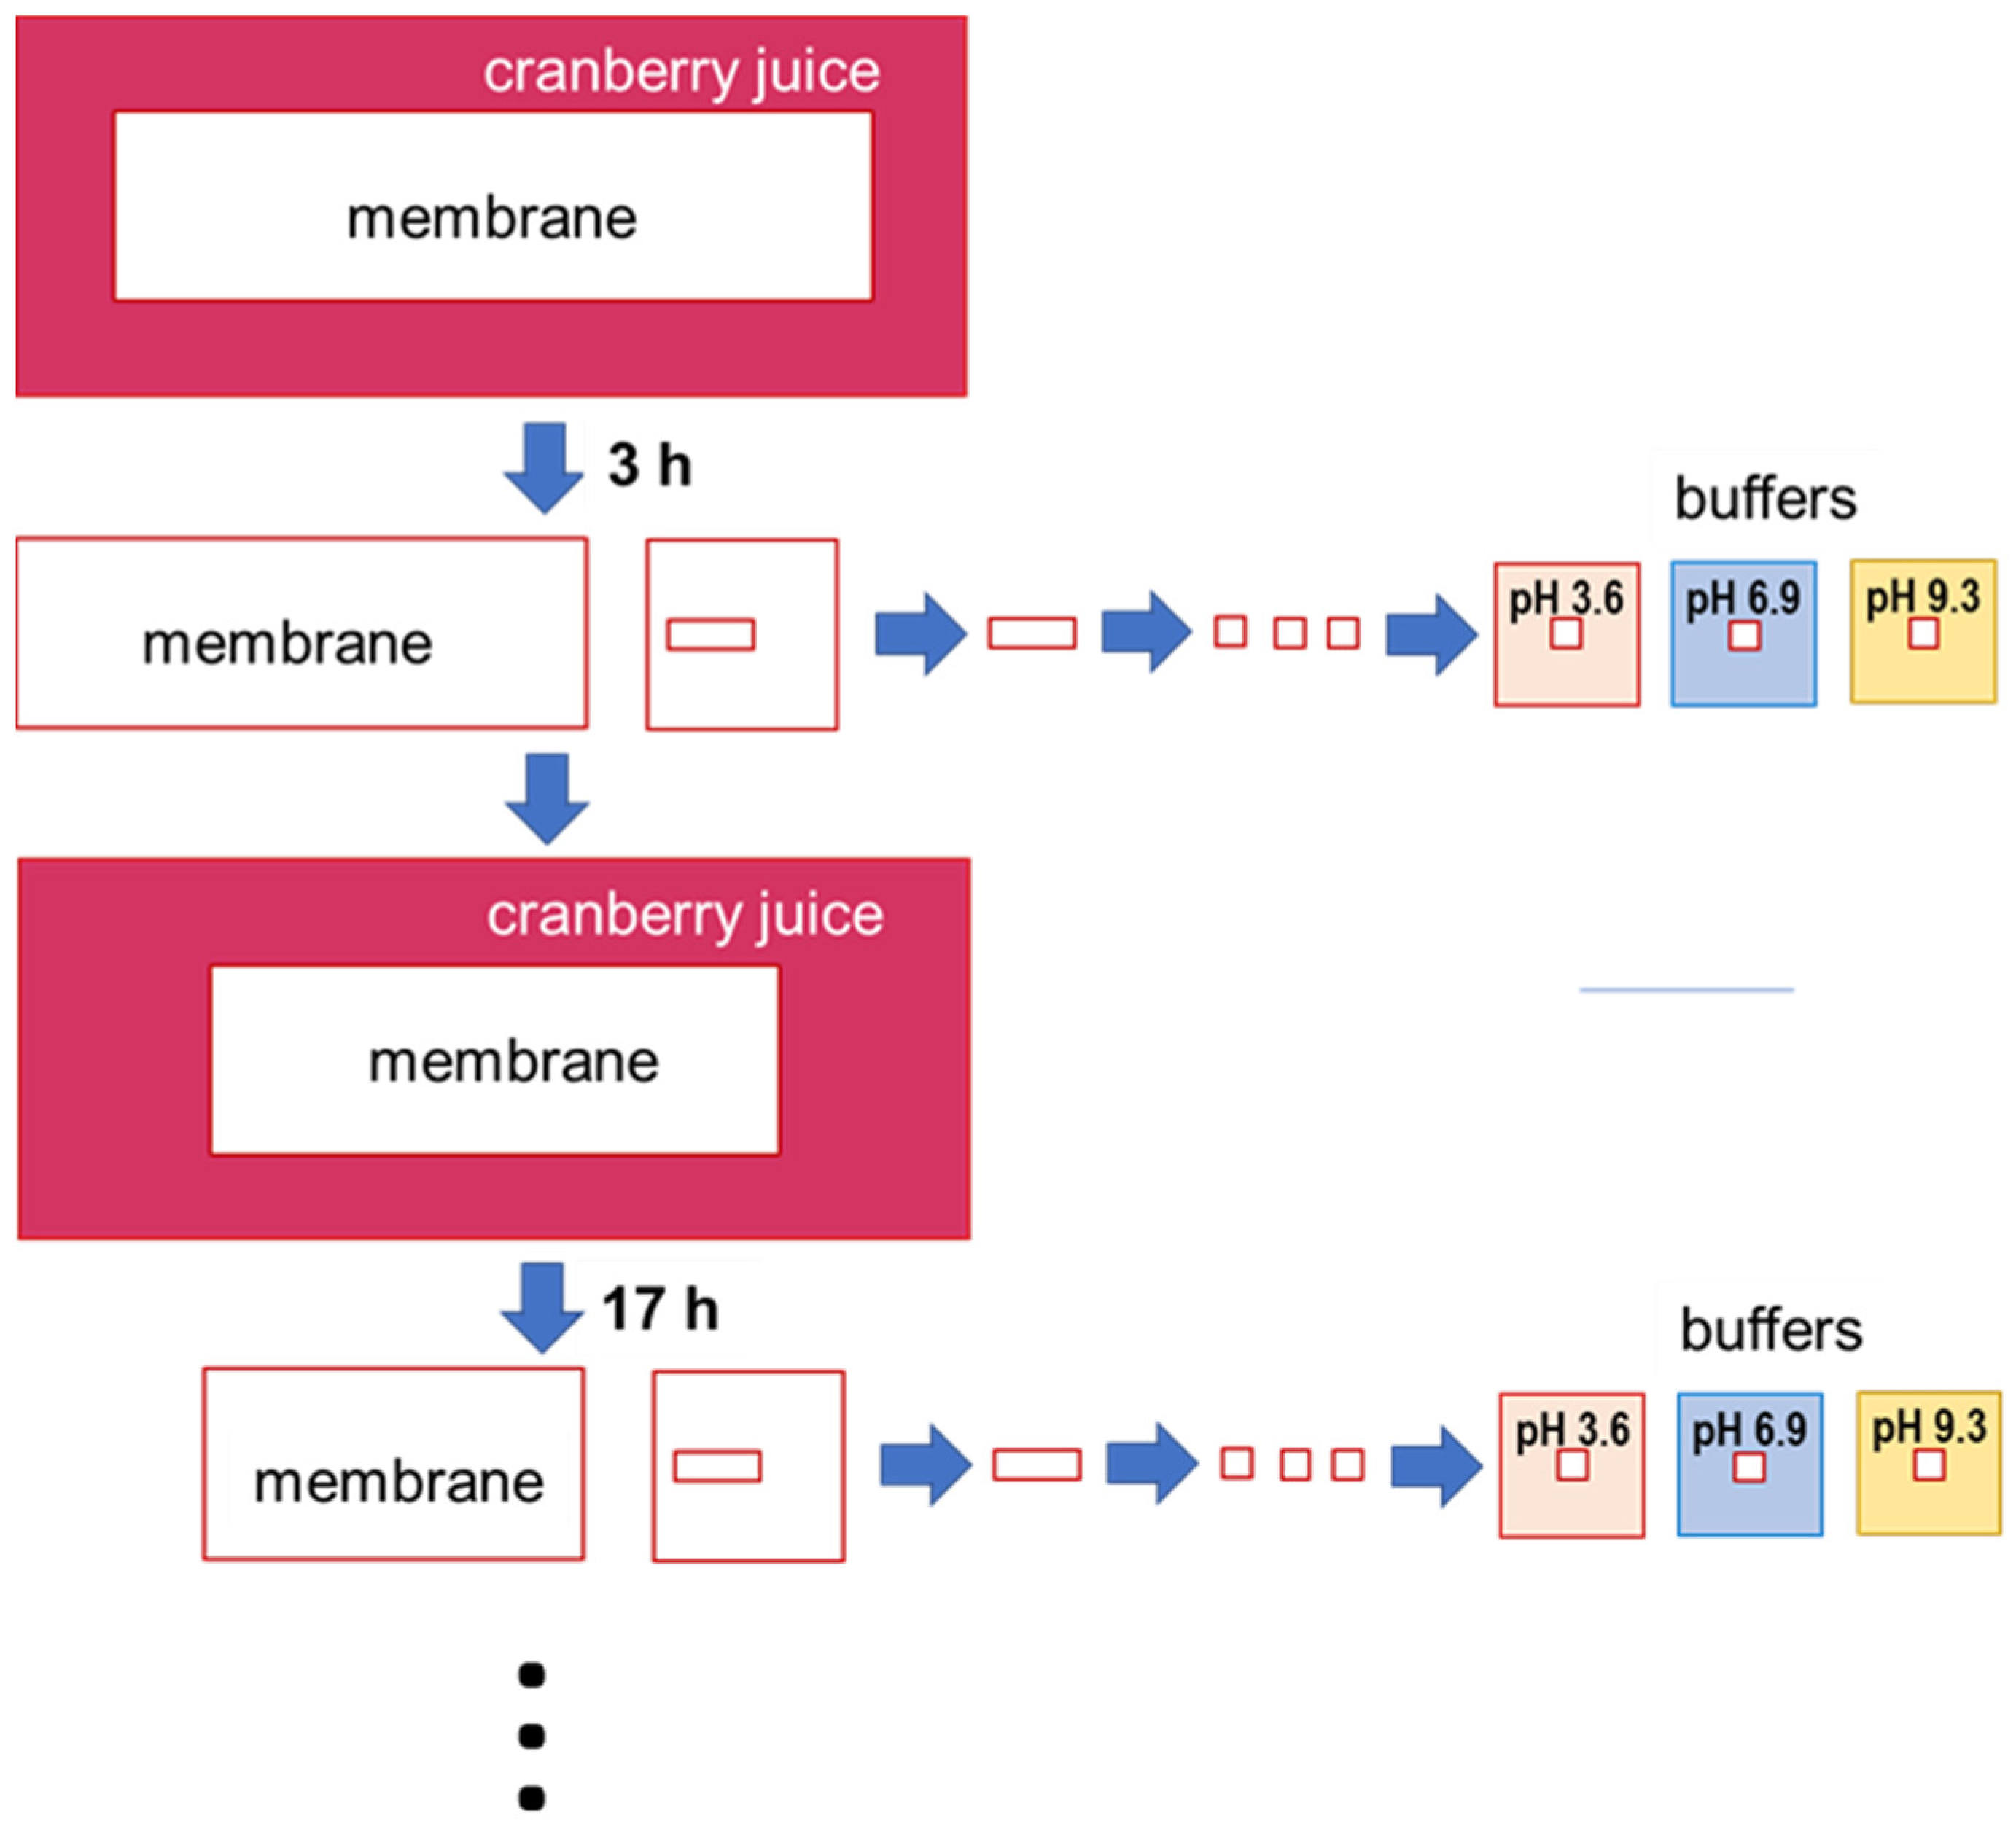
2.2.2. Membrane Fouling Kinetics
2.2.3. Desorption Procedures
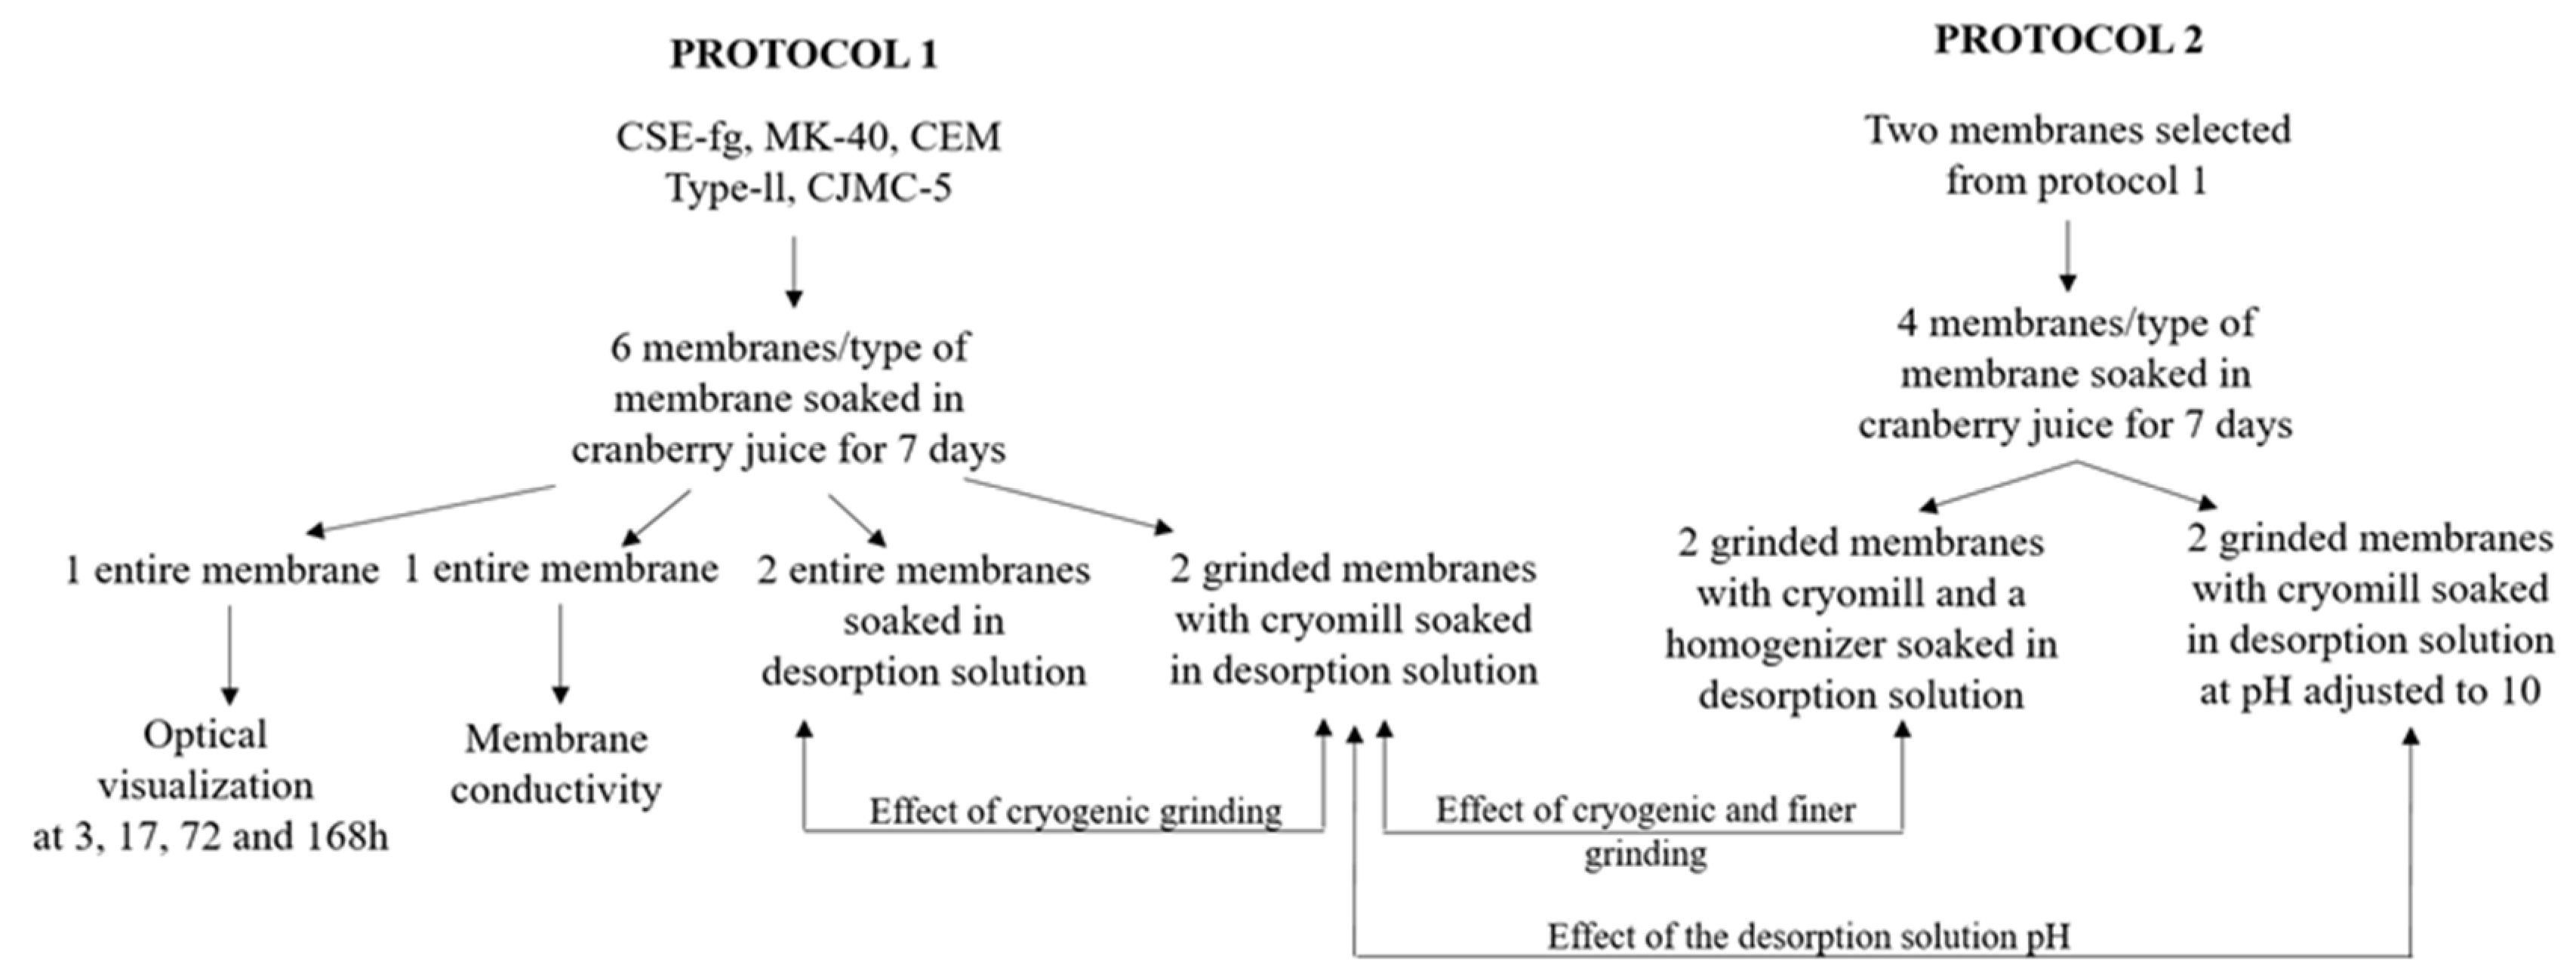
2.2.3.1. Protocol 1: Effect of Grinding on Desorption
2.2.3.2. Protocol 2: Effect of Finer Grinding and pH of the Desorption Solution on Desorption
2.2.4. Analyses
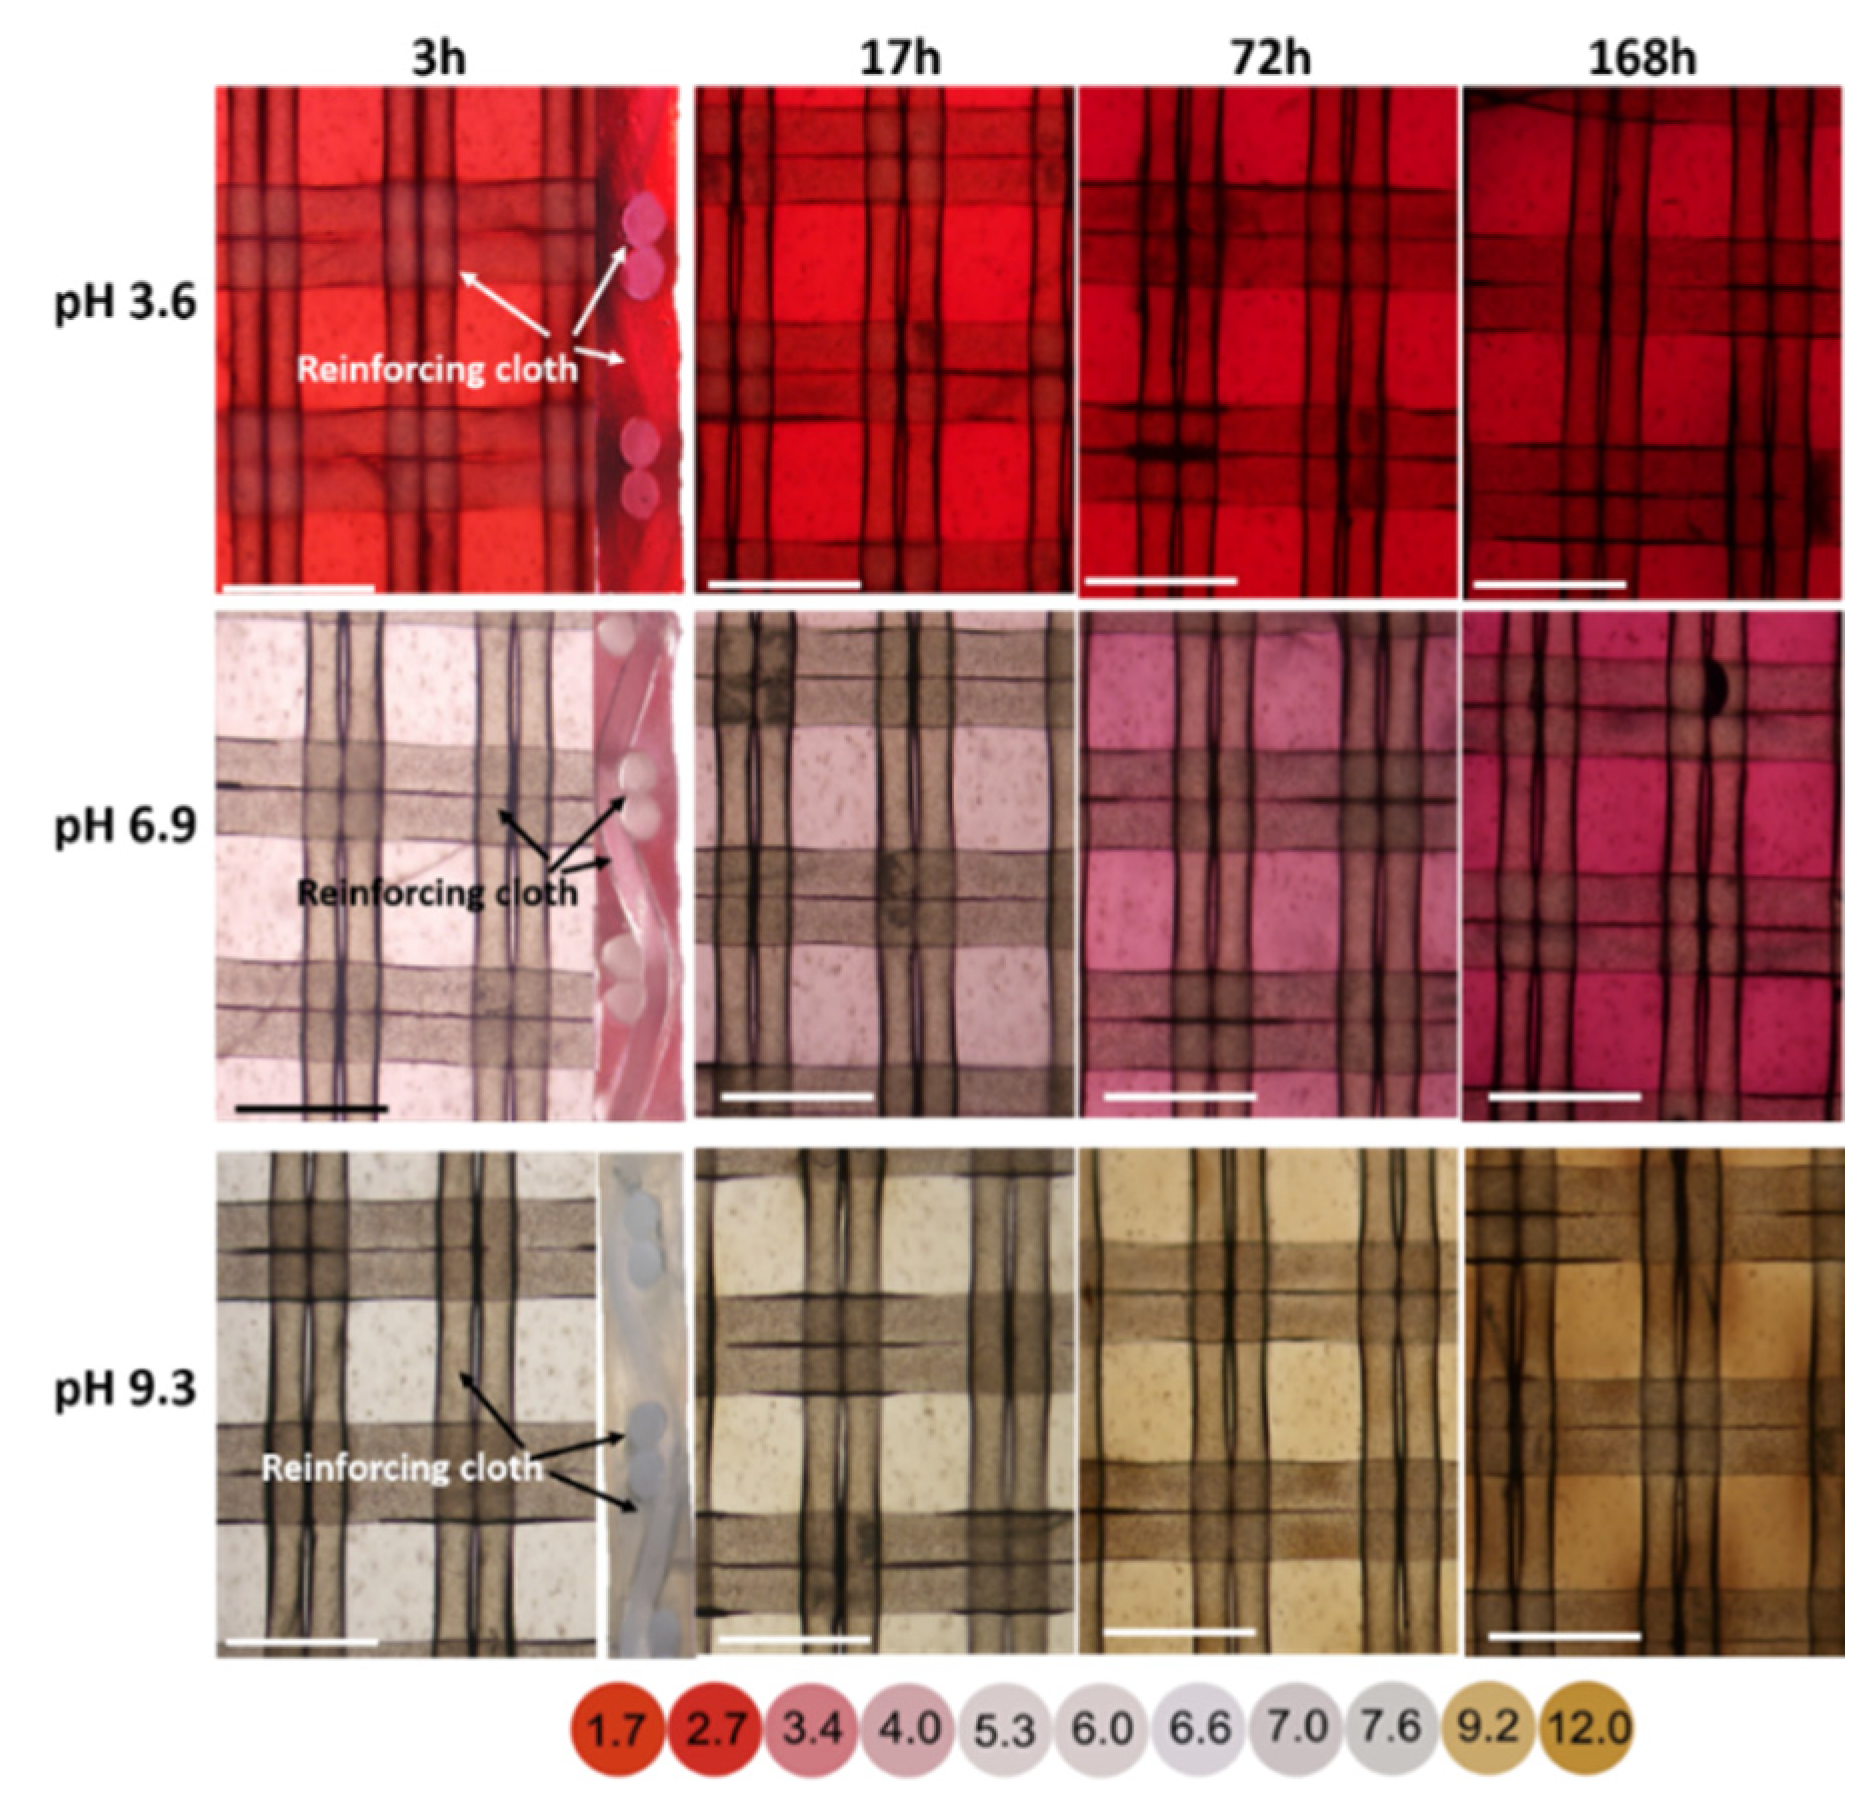
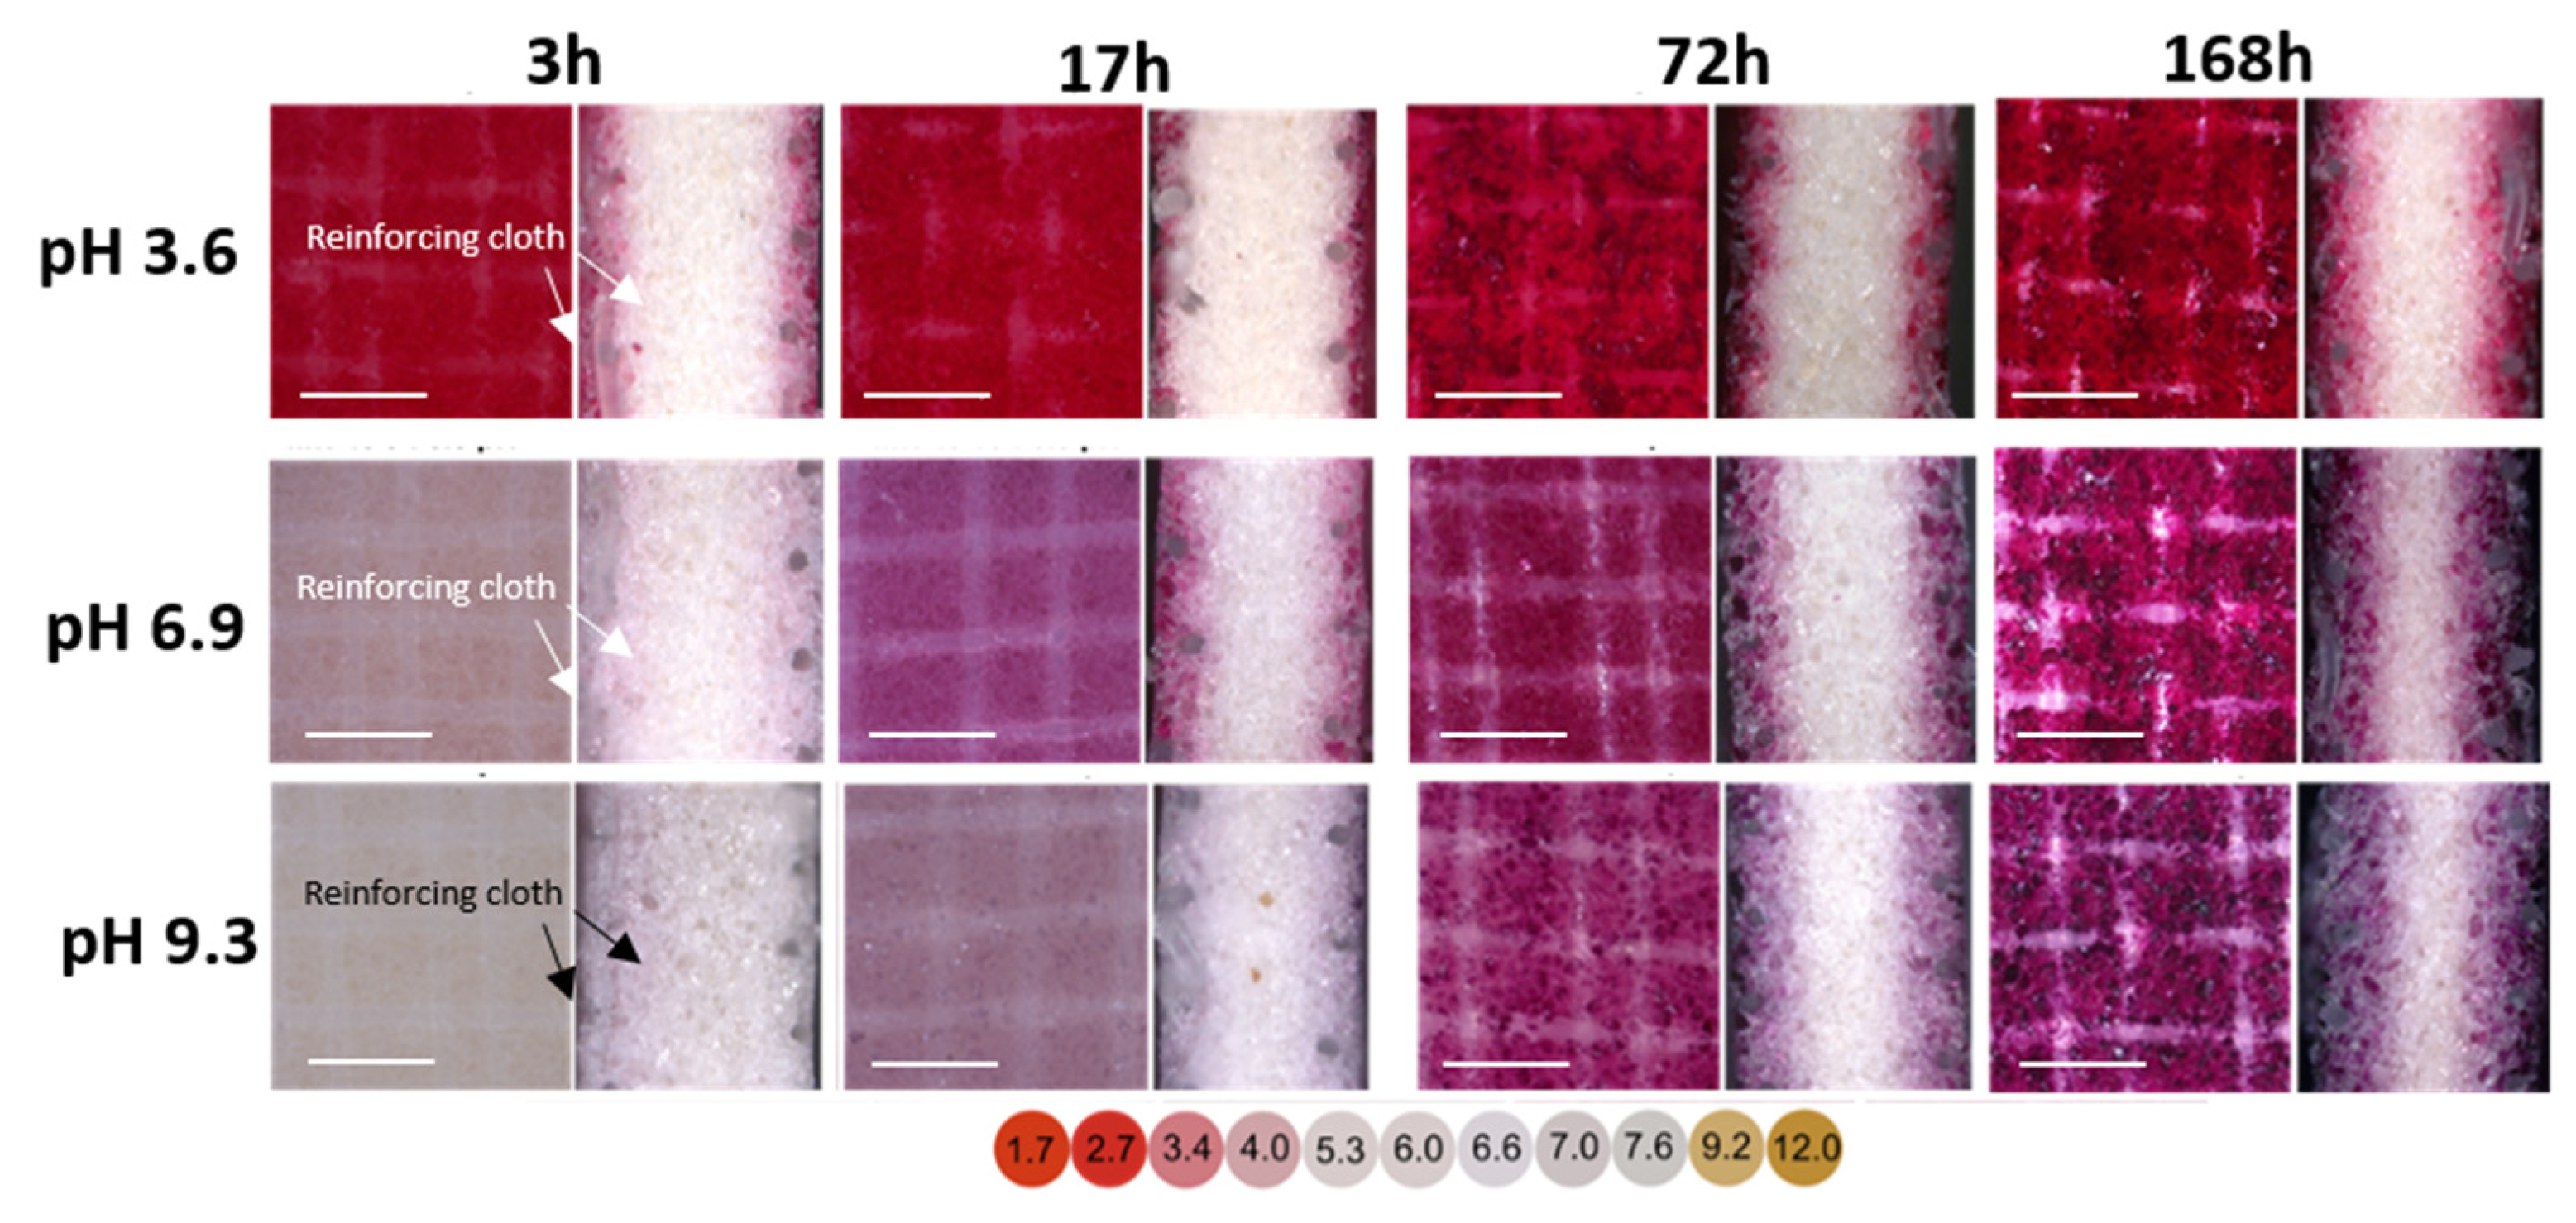
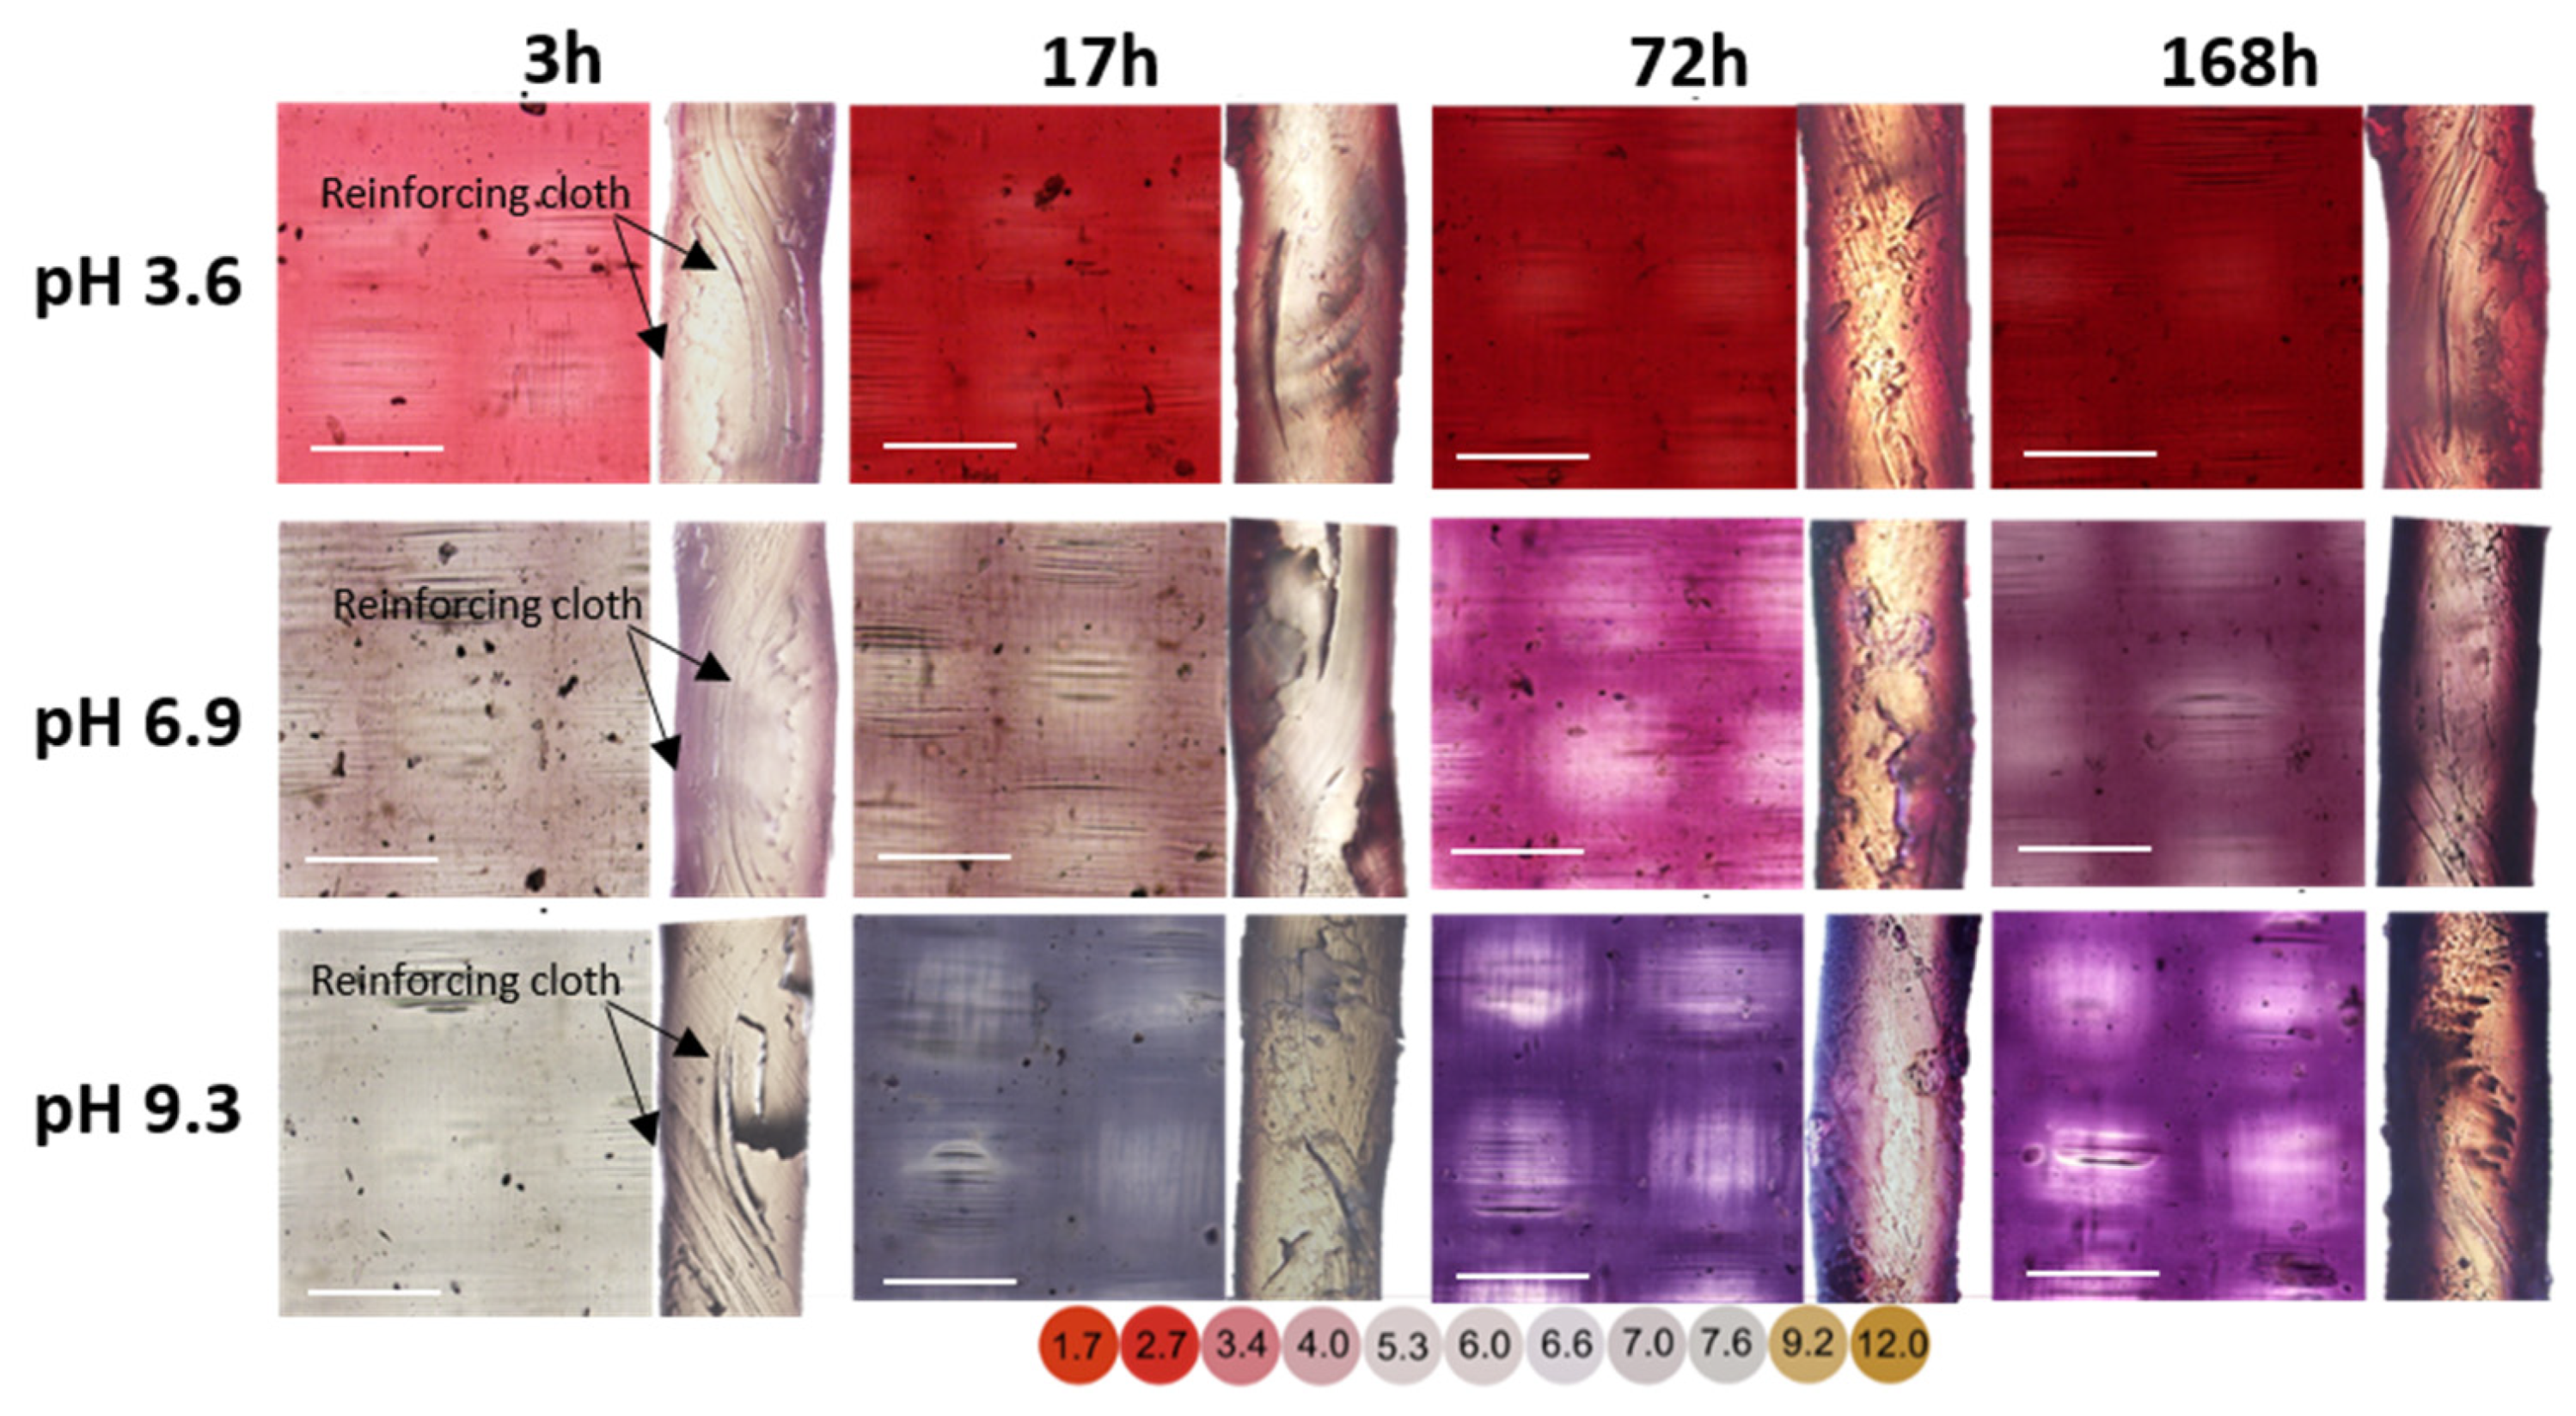
2.2.4.1. Optical Microscopy
2.2.4.2. Thickness
2.2.4.3. Ion-Exchange Capacity
2.2.4.4. Conductivity
2.2.4.5. Volume Fraction of the Intergel Space
2.2.4.6. Electrical Conductivity and Ion-Exchange Capacity of the Gel Phase
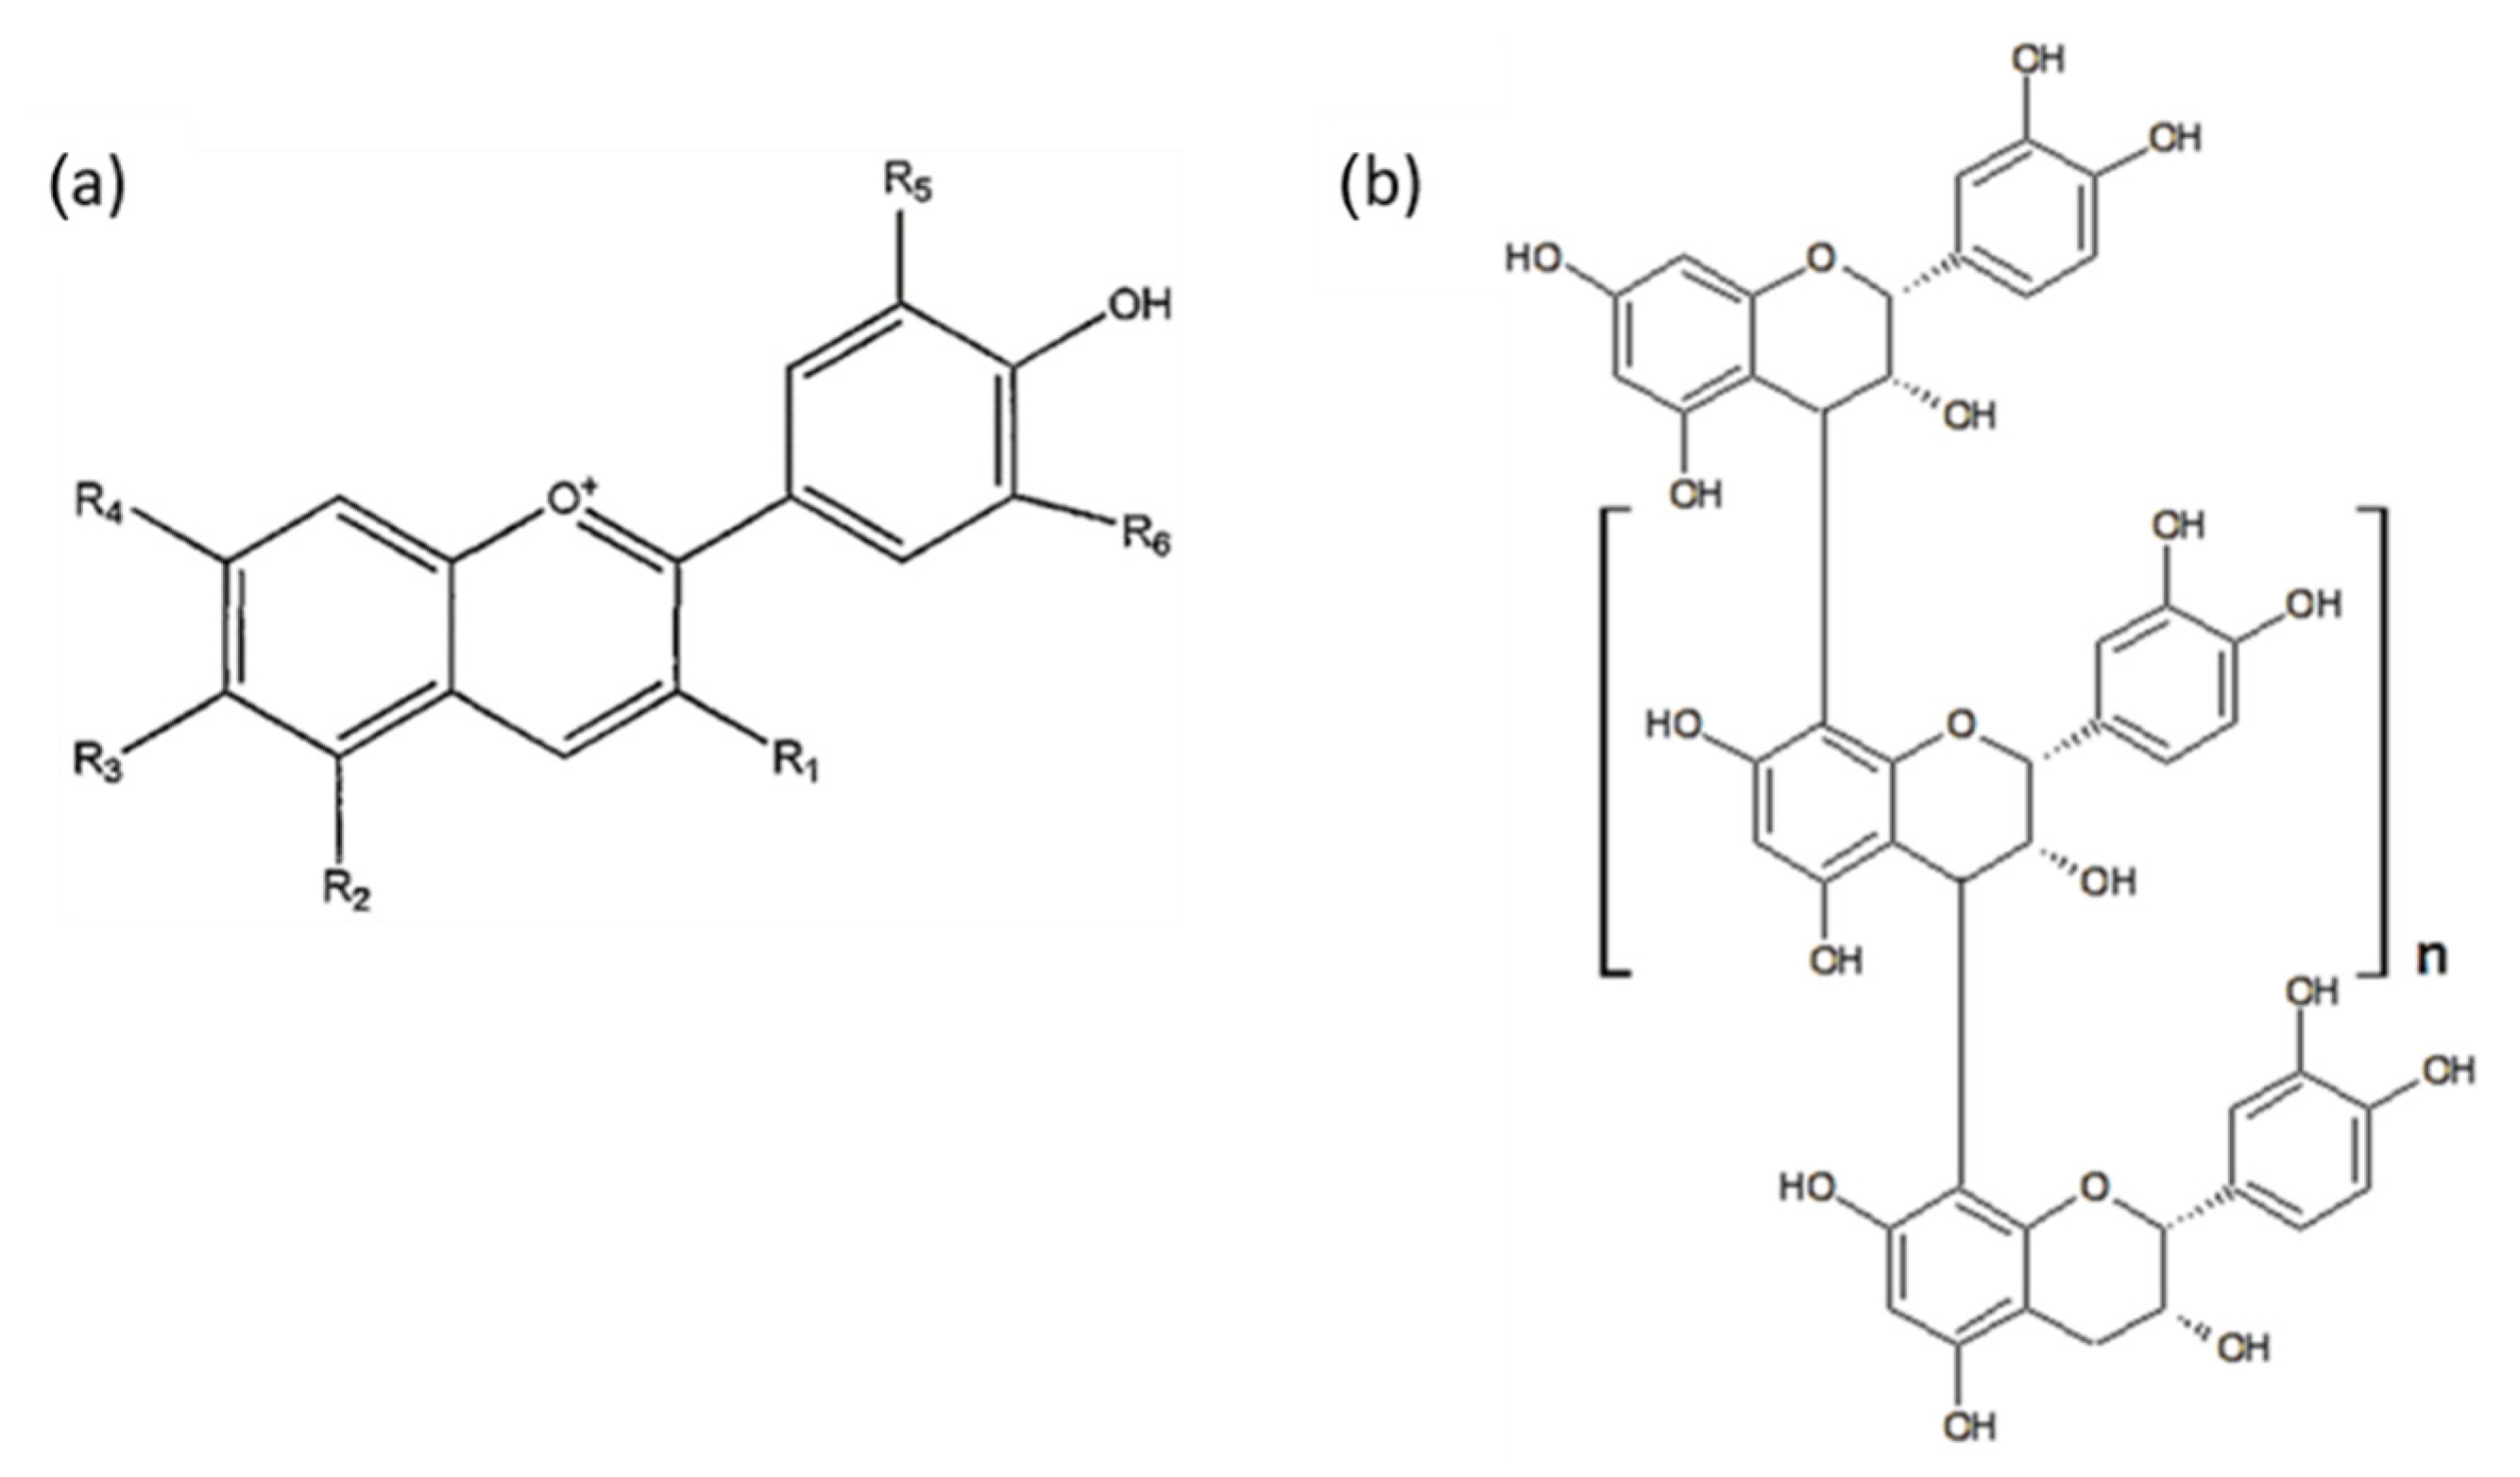
2.2.4.7. Proanthocyanidin Content
2.2.4.8. Anthocyanin Content
2.3. Statistical Analyses
3. Results and Discussion
3.1. Characterization of the Pristine Membranes
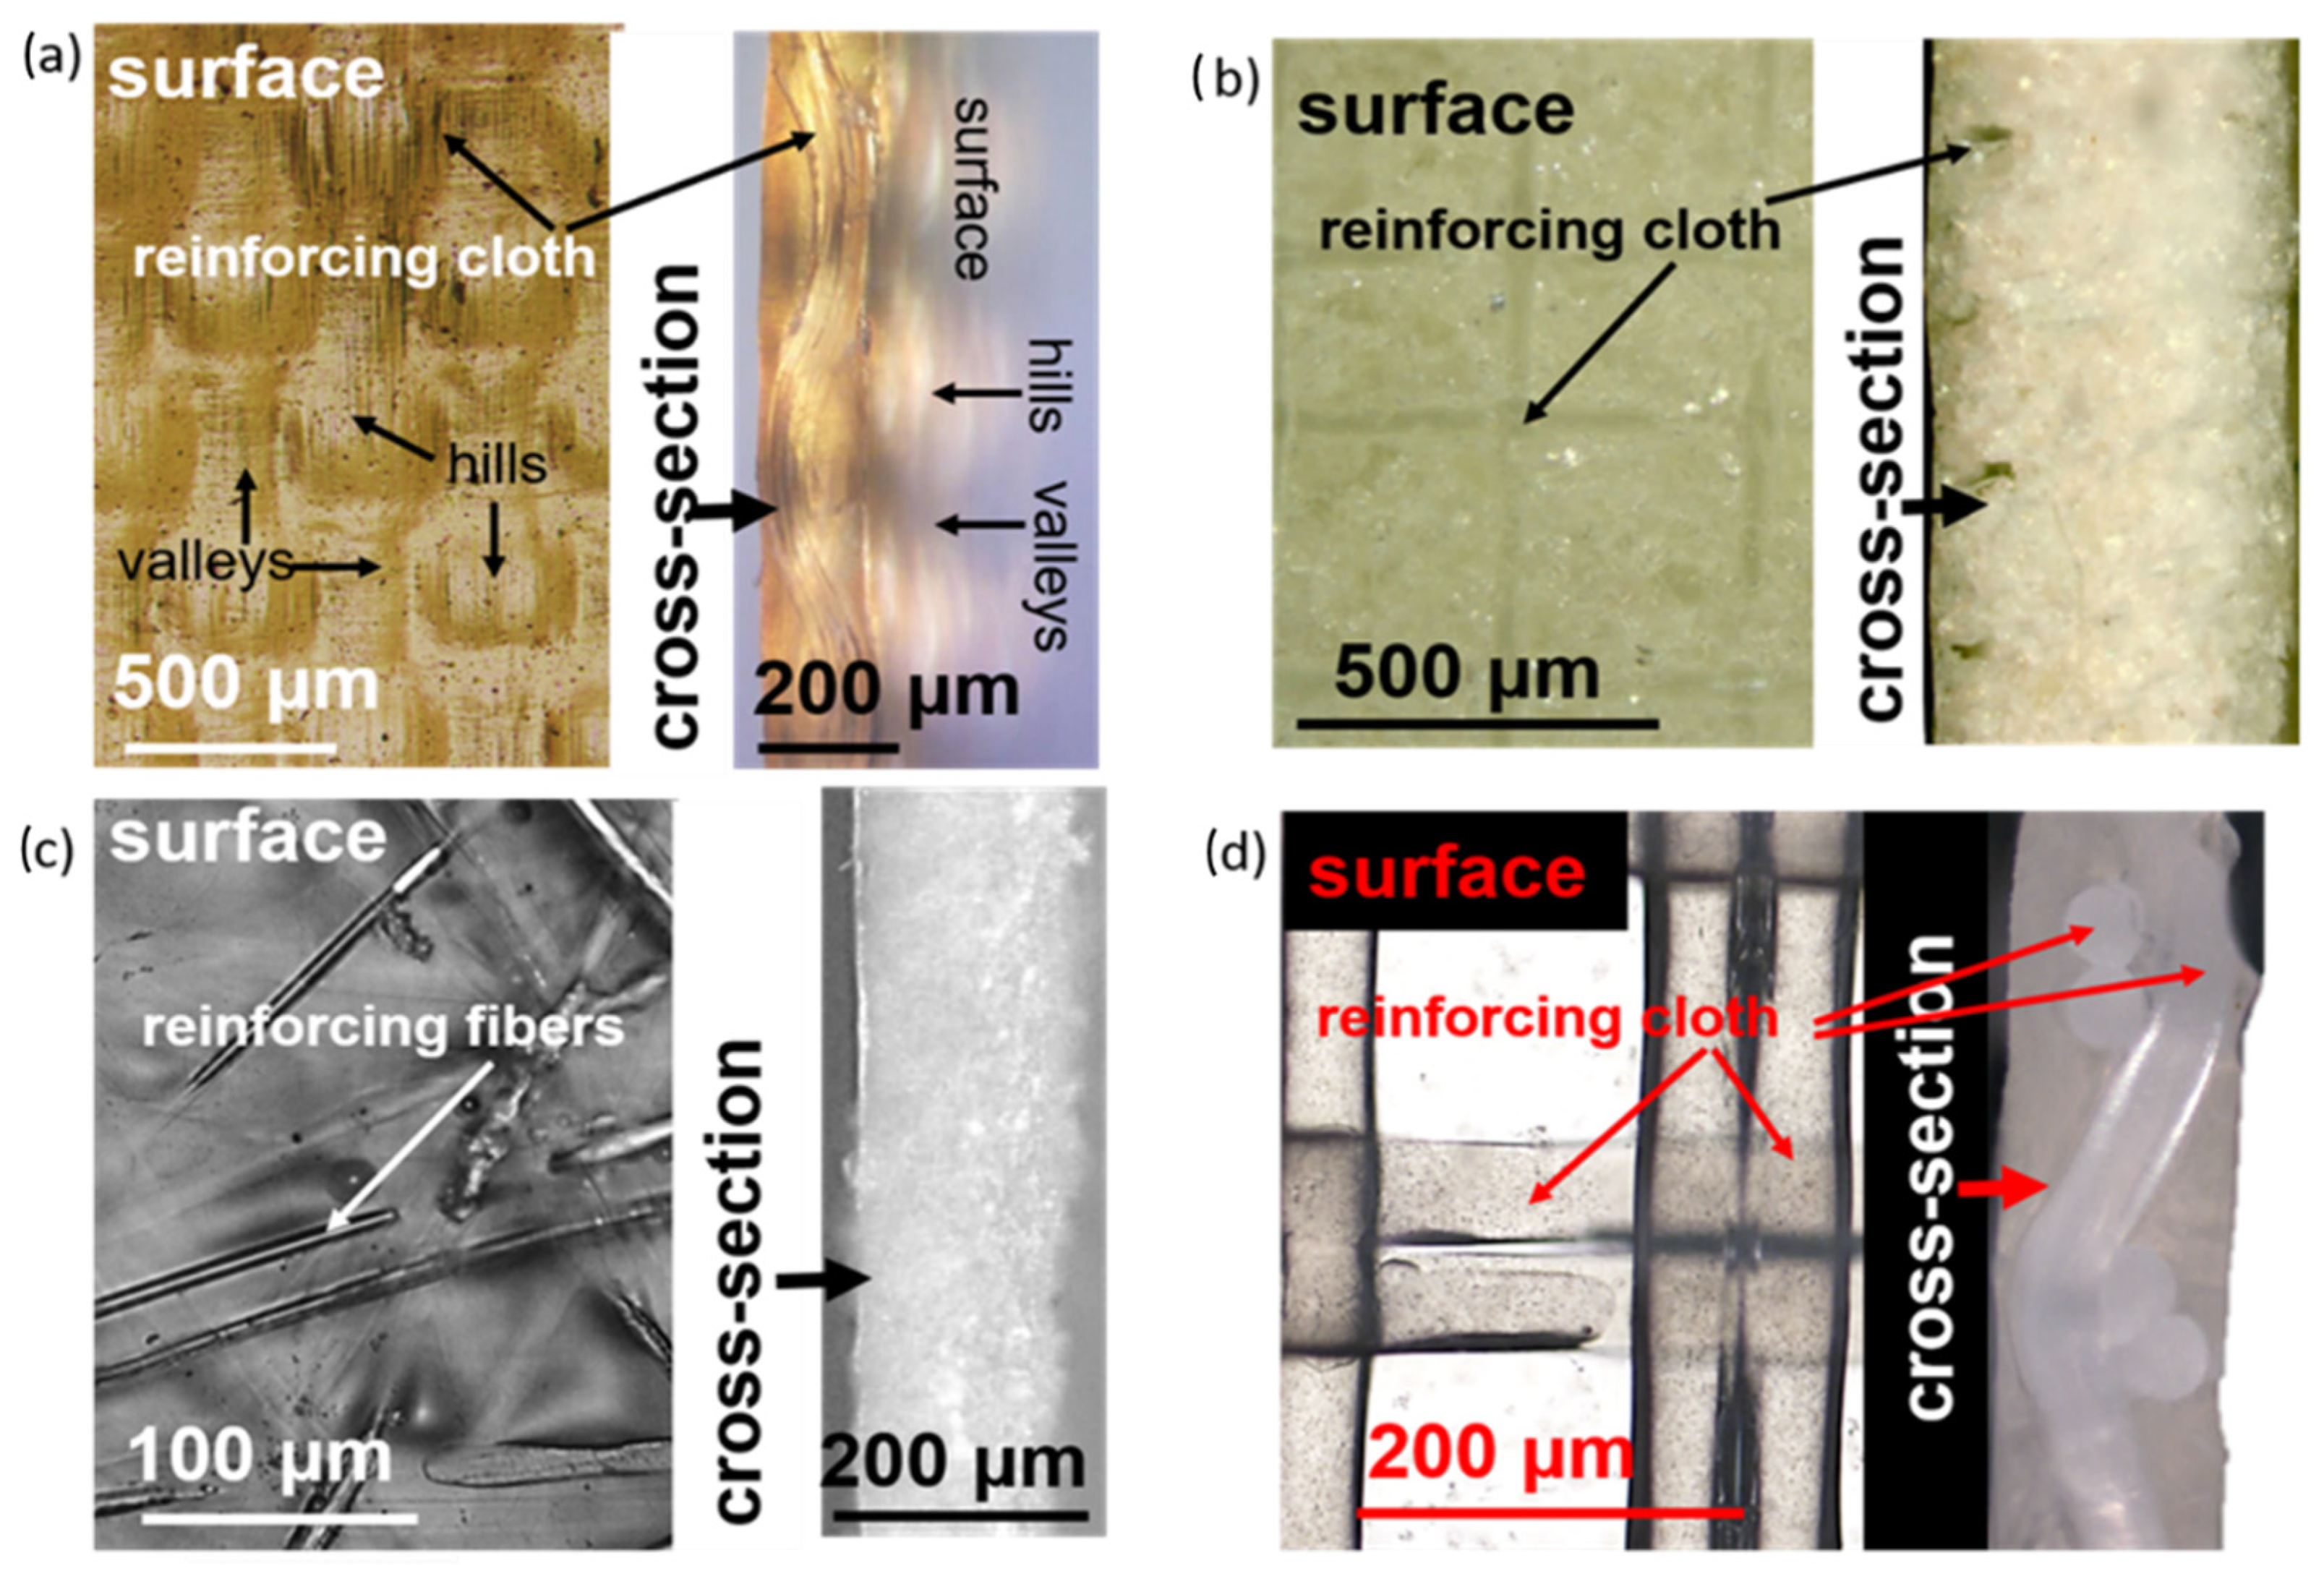
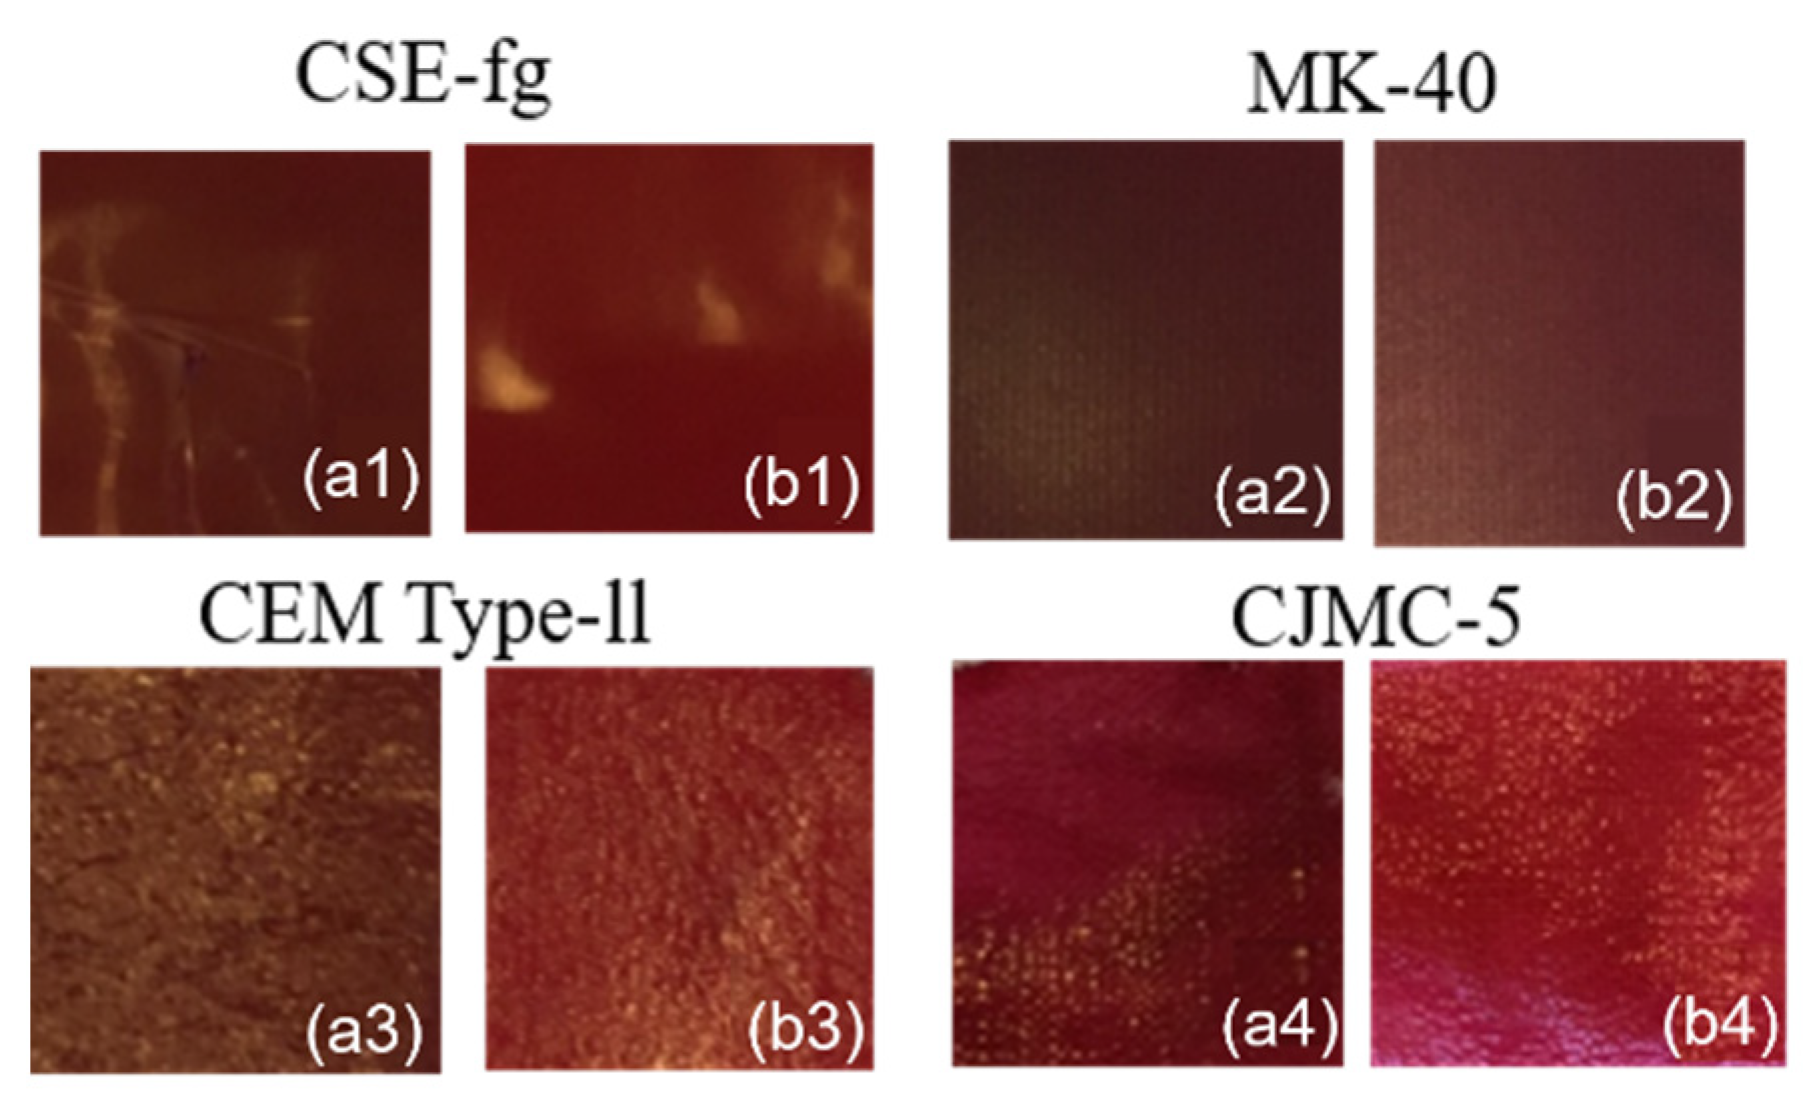
3.1.1. Optical Microscopy
3.1.2. Thickness
3.1.3. Ion-Exchange Capacity
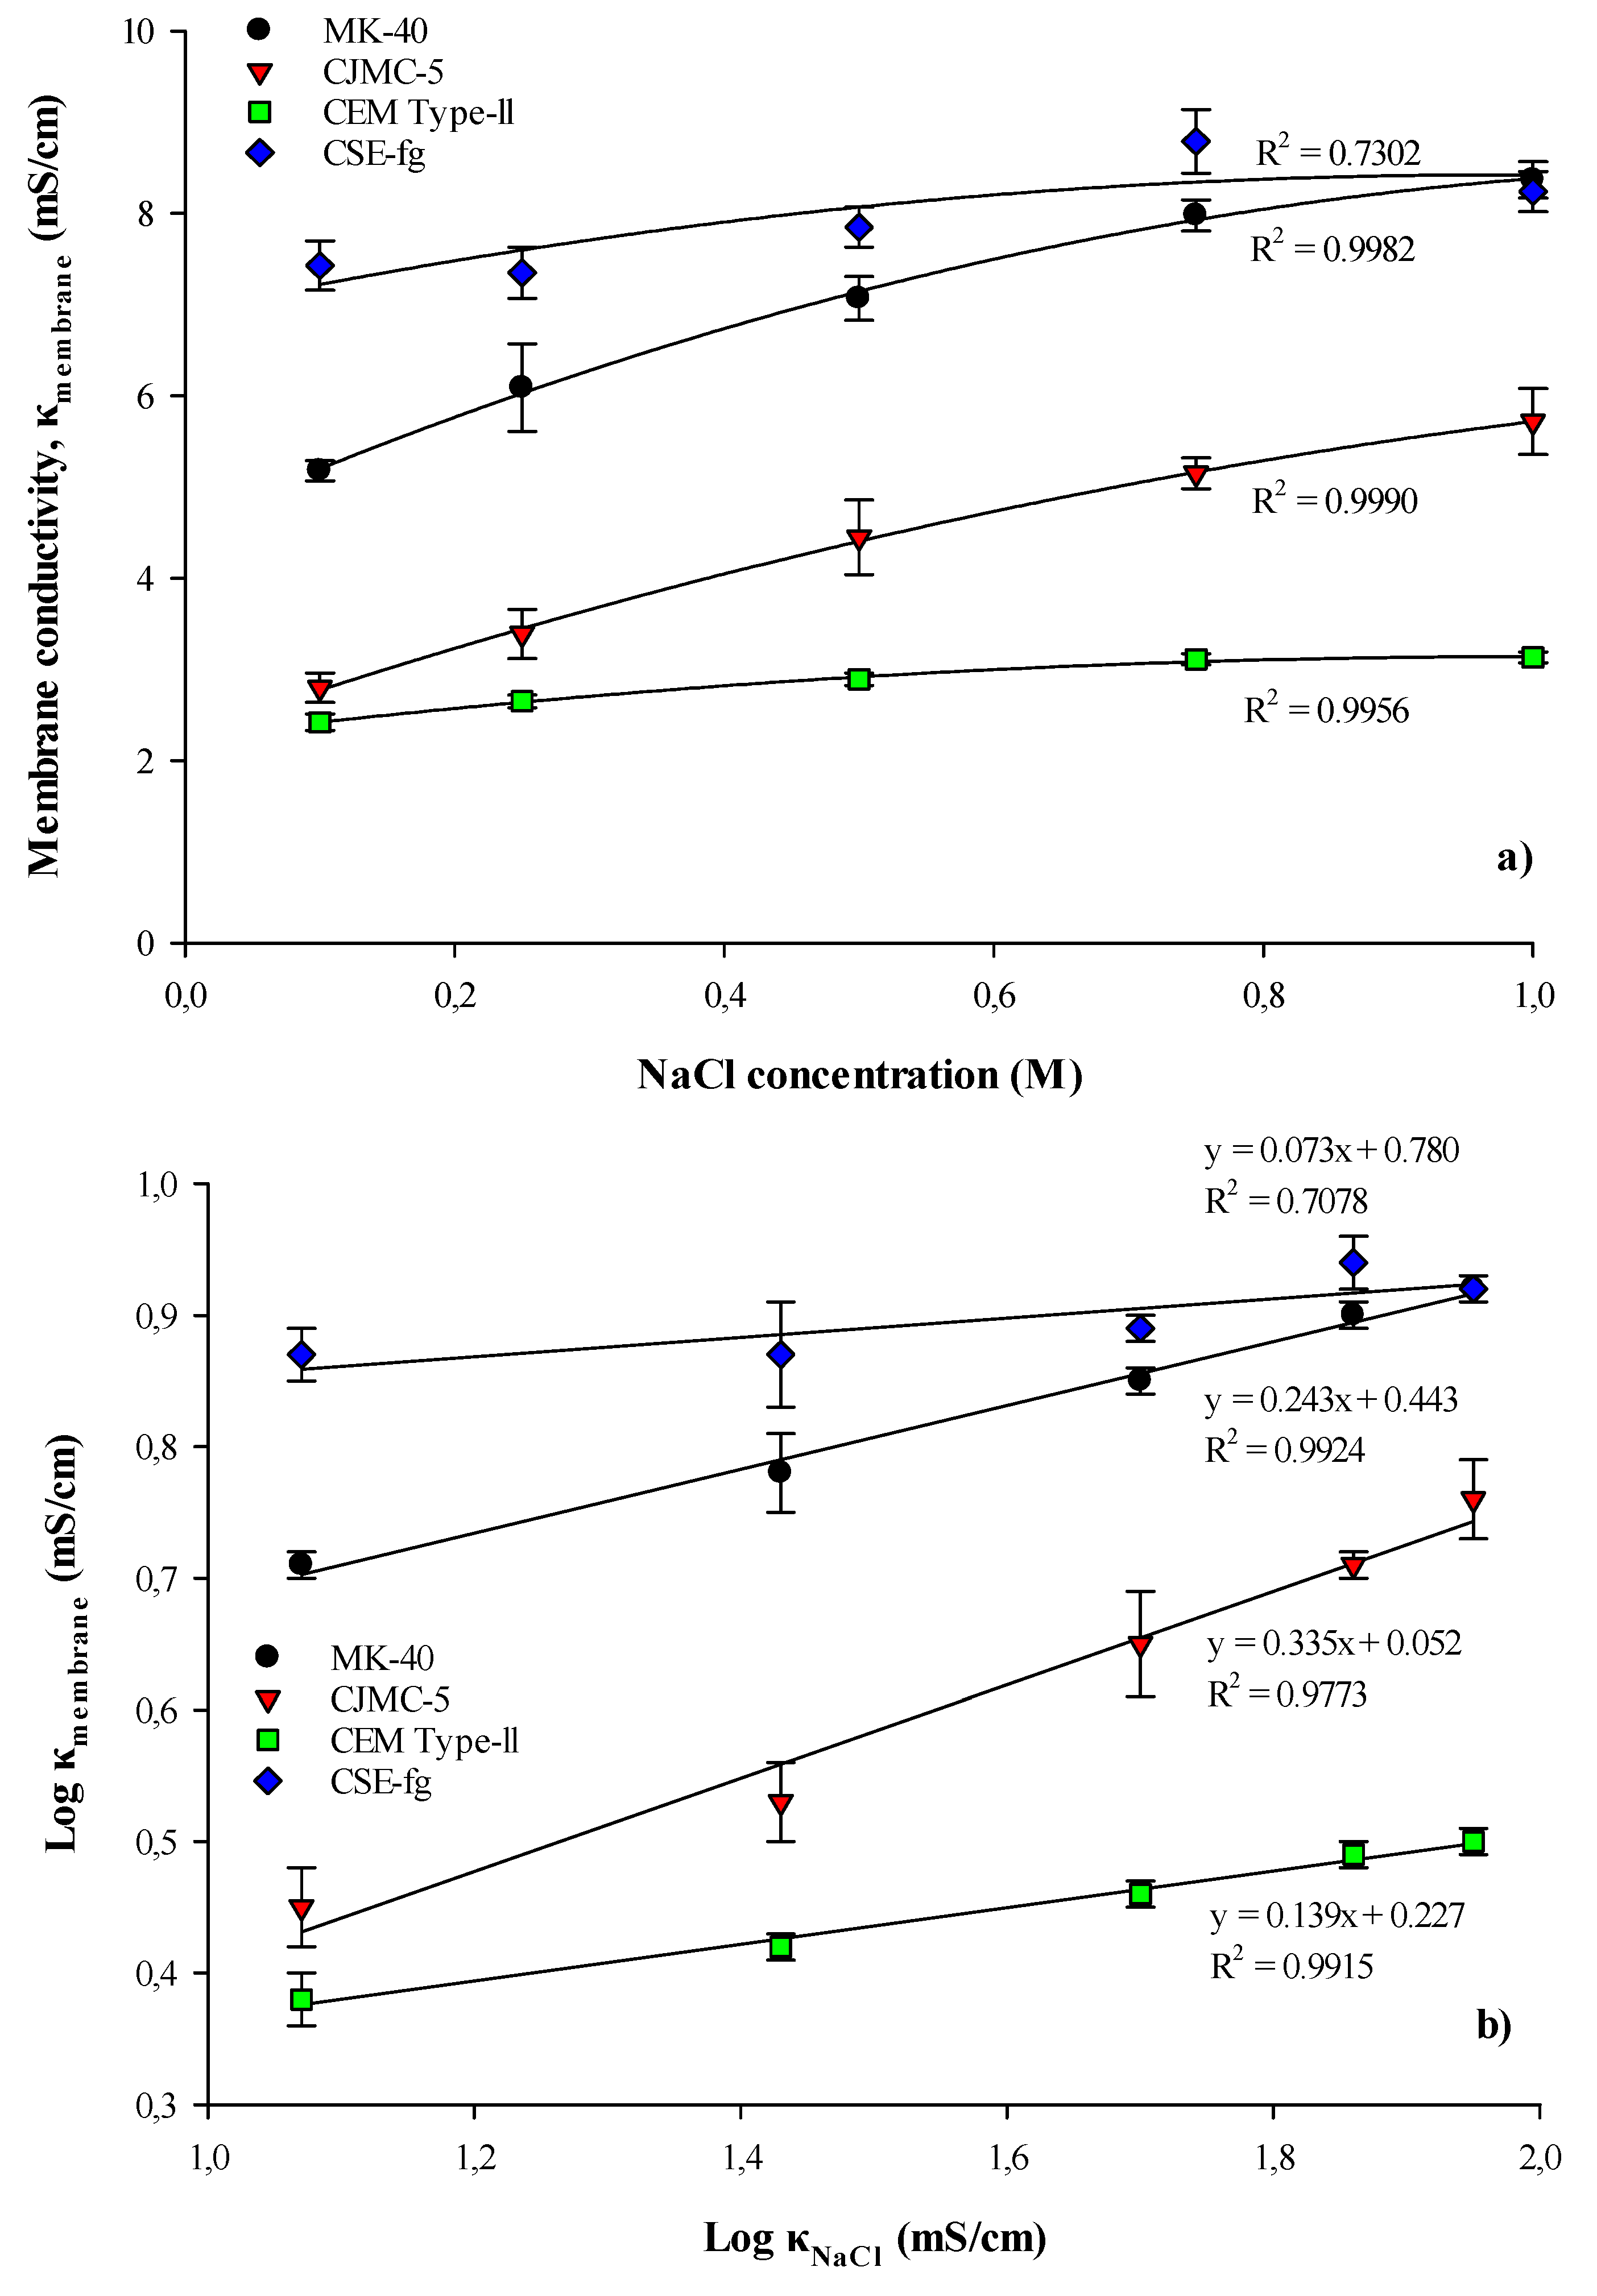
3.1.4. Conductivity
3.2. Membrane Fouling Kinetics
3.2.1. Membrane Conductivity after Soaking in Cranberry Juice
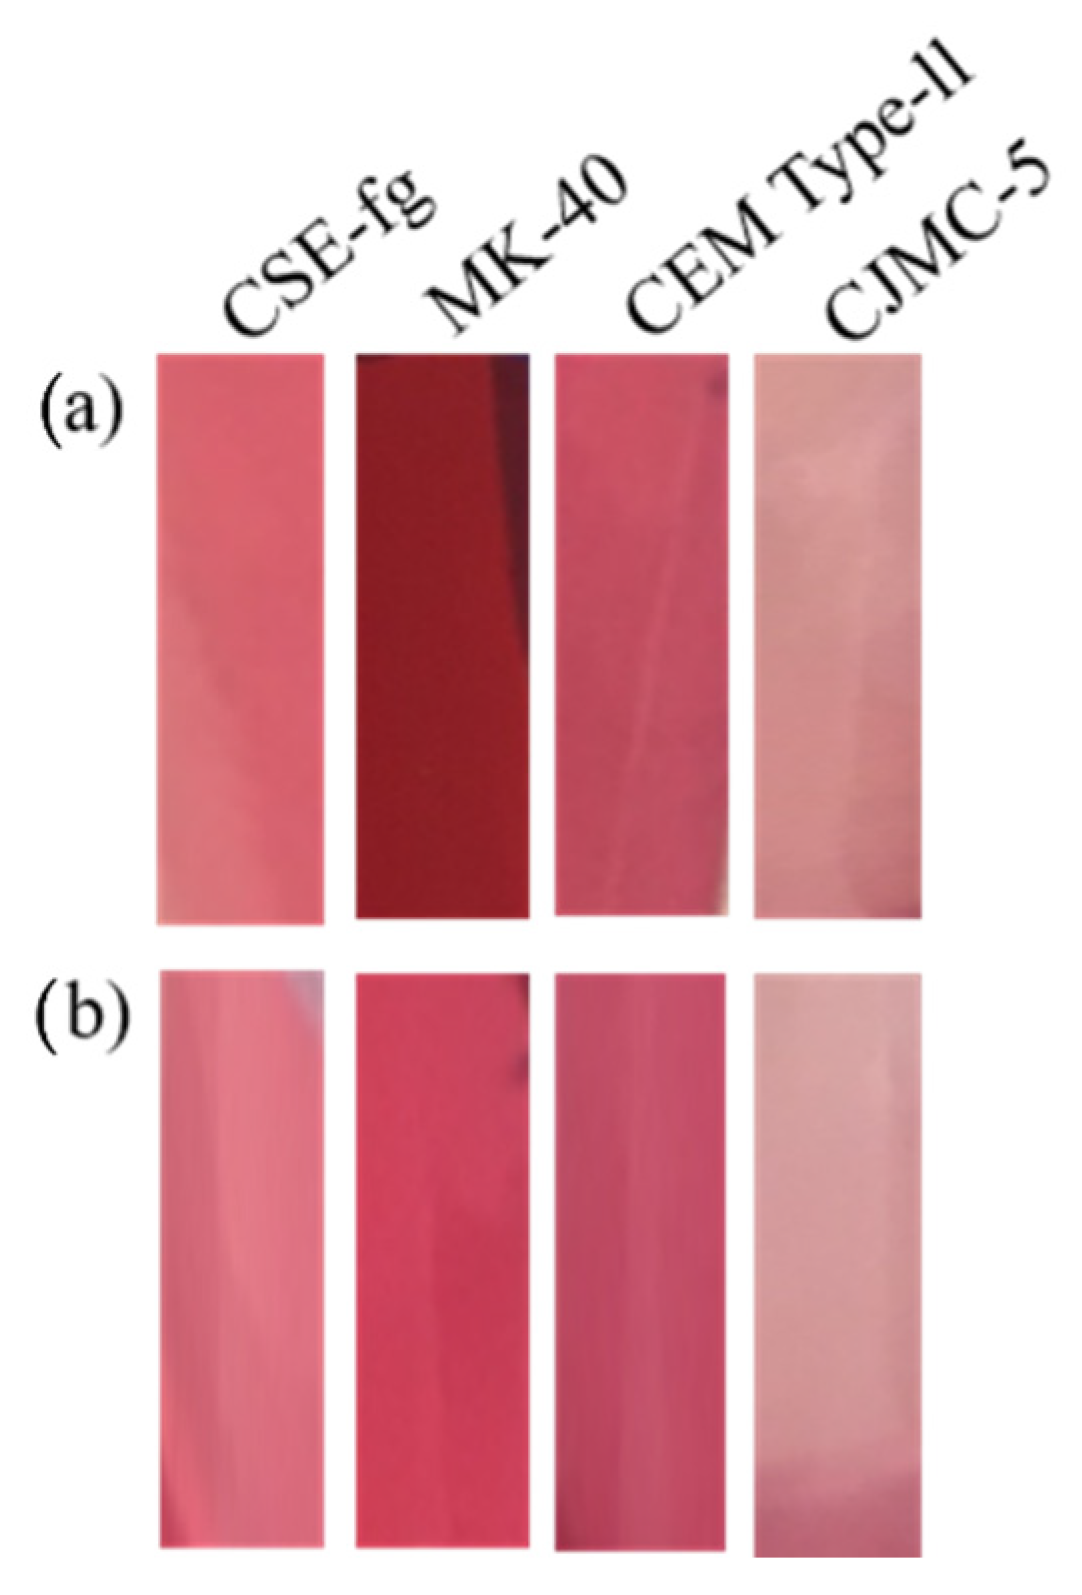
3.2.2. Fouling Kinetics and Color Indication of Anthocyanins
3.3. Desorption of Polyphenols from Membranes
3.3.1. Entire Coupons
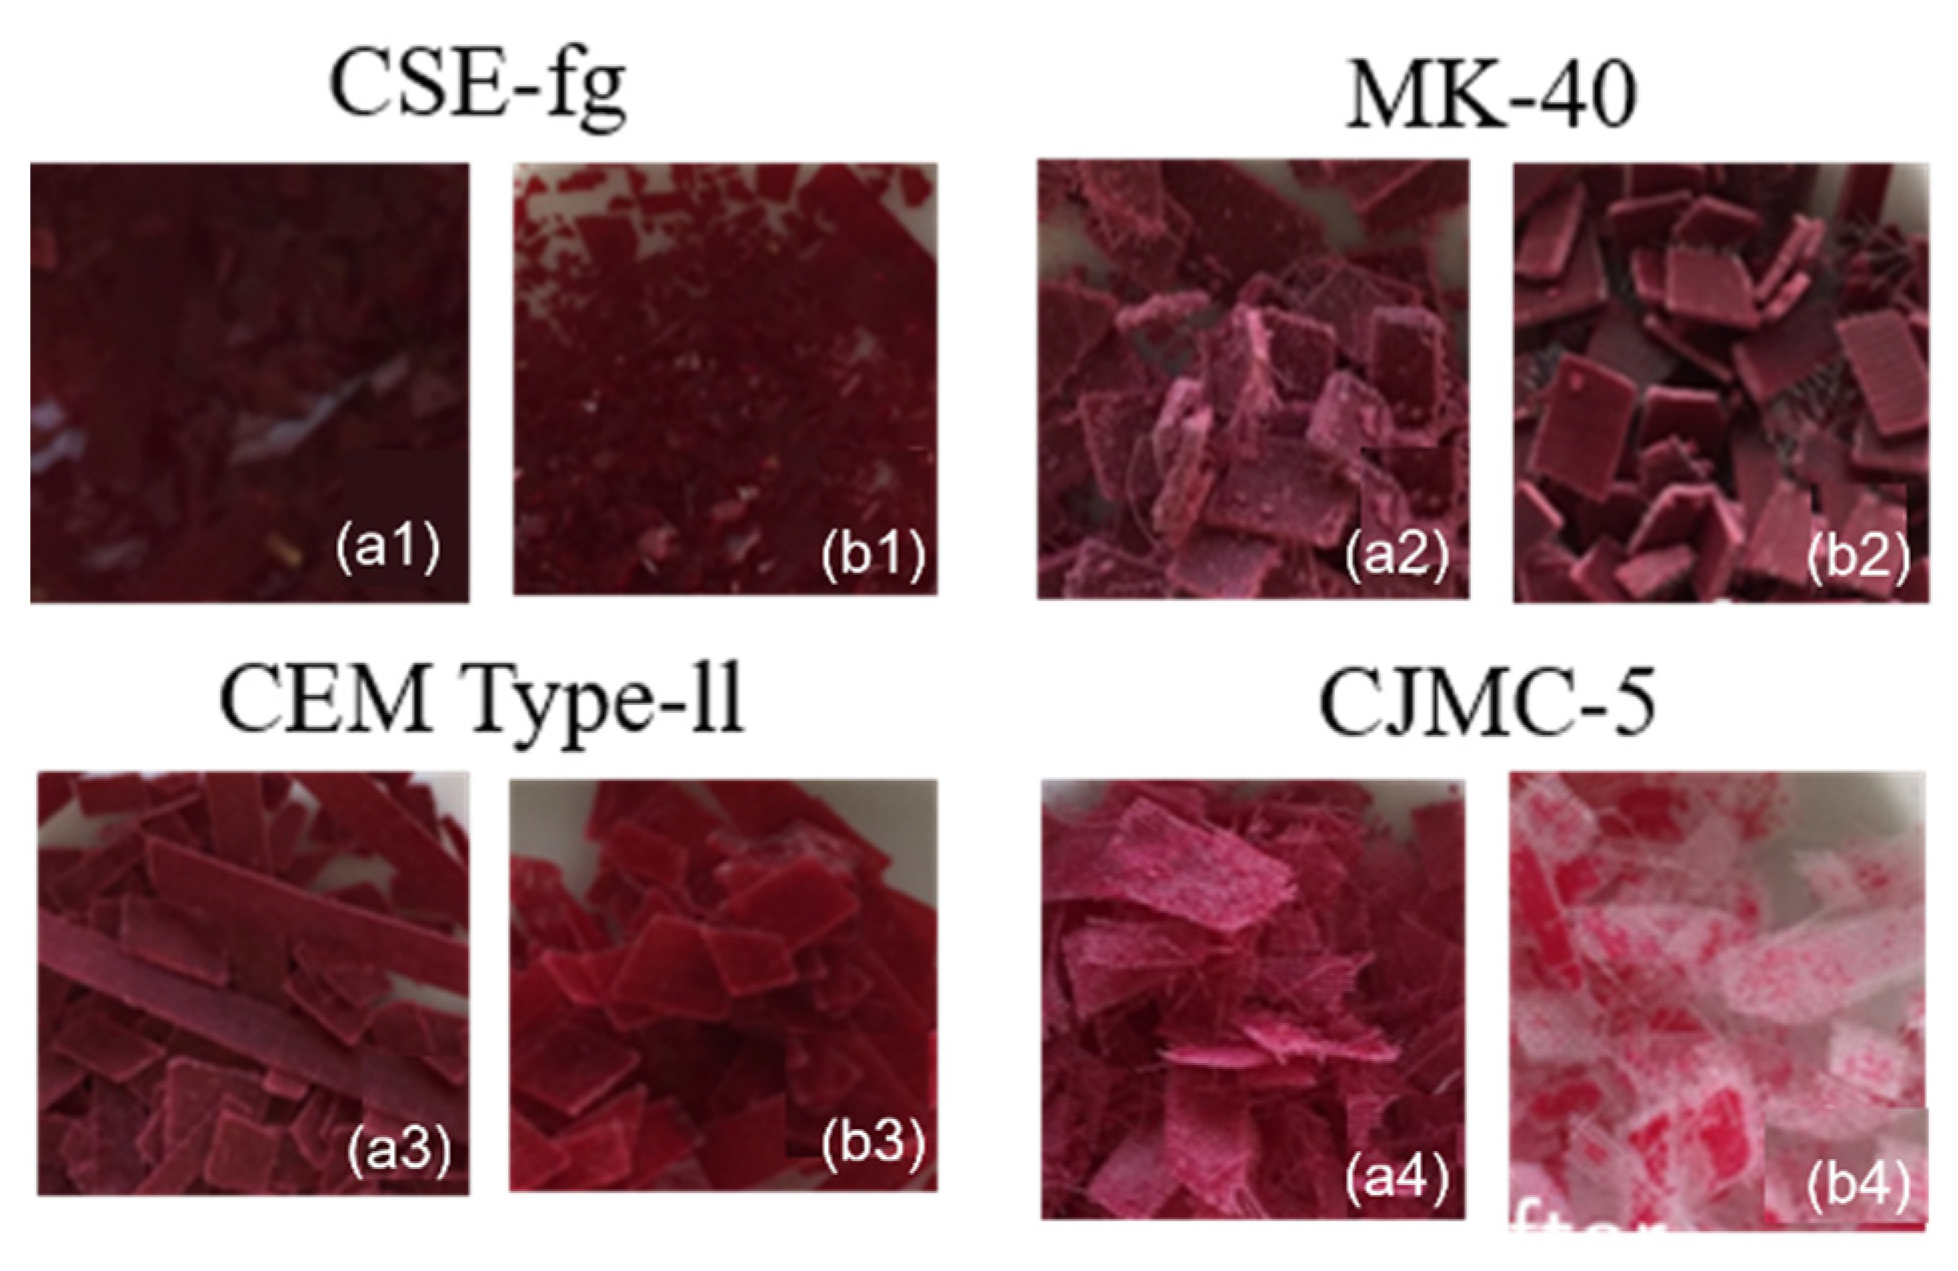
3.3.2. Effect of Grinding
3.3.3. Effect of Finer Grinding by Homogenizer
3.3.4. Effect of pH of the Desorption Solution
4. Conclusions
Author Contributions
Funding
Institutional Review Board Statement
Informed Consent Statement
Data Availability Statement
Acknowledgments
Conflicts of Interest
References
- Bukhovets, A.; Eliseeva, T.; Oren, Y. Fouling of anion-exchange membranes in electrodialysis of aromatic amino acid solution. J. Membr. Sci. 2010, 364, 339–343. [Google Scholar] [CrossRef]
- Mikhaylin, S.; Bazinet, L. Fouling on ion-exchange membranes: Classification, characterization and strategies of prevention and control. Adv. Colloid Interface Sci. 2016, 229, 34–56. [Google Scholar] [CrossRef]
- Grebenyuk, V.; Chebotareva, R.; Peters, S.; Linkov, V. Surface modification of anion-exchange electrodialysis membranes to enhance anti-fouling characteristics. Desalination 1998, 115, 313–329. [Google Scholar] [CrossRef]
- Bazinet, L.; Geoffroy, T.R. Electrodialytic Processes: Market Overview, Membrane Phenomena, Re-cent Developments and Sustainable Strategies. Membranes 2020, 10, 221. [Google Scholar] [CrossRef]
- Bdiri, M.; Perreault, V.; Mikhaylin, S.; Larchet, C.; Hellal, F.; Bazinet, L.; Dammak, L. Identification of phenolic compounds and their fouling mechanisms in ion-exchange membranes used at an in-dustrial scale for wine tartaric stabilization by electrodialysis. Sep. Purif. Technol. 2020, 233, 115995. [Google Scholar] [CrossRef]
- Persico, M.; Bazinet, L. Fouling prevention of peptides from a tryptic whey hydrolysate during electromembrane processes by use of monovalent ion permselective membranes. J. Membr. Sci. 2018, 549, 486–494. [Google Scholar] [CrossRef]
- Belashova, E.; Mikhaylin, S.; Pismenskaya, N.; Nikonenko, V.; Bazinet, L. Impact of cation-exchange membrane scaling nature on the electrochemical characteristics of membrane system. Sep. Purif. Technol. 2017, 189, 441–448. [Google Scholar] [CrossRef]
- Persico, M.; Mikhaylin, S.; Doyen, A.; Firdaous, L.; Hammami, R.; Chevalier, M.; Flahaut, C.; Dhulster, P.; Bazinet, L. Formation of peptide layers and adsorption mechanisms on a negatively charged cation-exchange membrane. J. Colloid Interface Sci. 2017, 508, 488–499. [Google Scholar] [CrossRef]
- Mikhaylin, S.; Nikonenko, V.V.; Pourcelly, G.; Bazinet, L. Intensification of demineralization process and decrease in scaling by application of pulsed electric field with short pulse/pause conditions. J. Membr. Sci. 2014, 468, 389–399. [Google Scholar] [CrossRef]
- Park, J.-S.; Lee, H.-J.; Choi, S.-J.; Geckeler, K.E.; Cho, J.; Moon, S.-H. Fouling mitigation of anion exchange membrane by zeta potential control. J. Colloid Interface Sci. 2003, 259, 293–300. [Google Scholar] [CrossRef]
- Gonçalves, F.; Fernandes, C.; dos Santos, P.C.; de Pinho, M.N. Wine tartaric stabilization by electrodialysis and its assessment by the saturation temperature. J. Food Eng. 2003, 59, 229–235. [Google Scholar] [CrossRef]
- Rozoy, E.; Boudesocque, L.; Bazinet, L.; Boudesocque-Delaye, L. Deacidification of Cranberry Juice by Electrodialysis with Bipolar Membranes. J. Agric. Food Chem. 2015, 63, 642–651. [Google Scholar] [CrossRef]
- Yan, X.; Murphy, B.T.; Hammond, G.B.; Vinson, J.A.; Neto, C.C. Antioxidant activities and anti-tumor screening of extracts from cranberry fruit (Vaccinium macrocarpon). J. Agric. Food Chem. 2002, 50, 5844–5849. [Google Scholar] [CrossRef]
- Blumberg, J.B.; Camesano, T.A.; Cassidy, A.; Kris-Etherton, P.; Howell, A.; Manach, C.; Ostertag, L.M.; Sies, H.; Skulas-Ray, A.; Vita, J.A. Cranberries and their bioactive constituents in human health. Adv. Nutr. 2013, 4, 618–632. [Google Scholar] [CrossRef] [PubMed] [Green Version]
- Sarapulova, V.; Nevakshenova, E.; Nebavskaya, X.; Kozmai, A.; Aleshkina, D.; Pourcelly, G.; Nikonenko, V.; Pismenskaya, N. Characterization of bulk and surface properties of anion-exchange membranes in initial stages of fouling by red wine. J. Membr. Sci. 2018, 559, 170–182. [Google Scholar] [CrossRef]
- Bdiri, M.; Dammak, L.; Larchet, C.; Hellal, F.; Porozhnyy, M.; Nevakshenova, E.; Pismenskaya, N.; Nikonenko, V. Characterization and cleaning of anion-exchange membranes used in electrodialy-sis of polyphenol-containing food industry solutions; comparison with cation-exchange mem-branes. Sep. Purif. Technol. 2019, 210, 636–650. [Google Scholar] [CrossRef]
- Ulbricht, M.; Ansorge, W.; Danielzik, I.; König, M.; Schuster, O. Fouling in microfiltration of wine: The influence of the membrane polymer on adsorption of polyphenols and polysaccharides. Sep. Purif. Technol. 2009, 68, 335–342. [Google Scholar] [CrossRef]
- Falina, I.V.; Demina, O.A.; Kononenko, N.A.; Annikova, L.A. Influence of inert components on the formation of conducting channels in ion-exchange membranes. J. Solid State Electrochem. 2016, 21, 767–775. [Google Scholar] [CrossRef]
- Yan, H.; Wang, Y.; Xu, T. Developing ion exchange membrane for treating high salinity water us-ing electrodialysis. In Proceedings of the 5th International Conferences on Sustainable Chemical Product and Process Engineering (SCPPE), Tianjin, China, 30 June–3 July 2019; pp. 65–67, Abstract number K6-5. [Google Scholar]
- Zhao, L.; Temelli, F. Preparation of anthocyanin-loaded liposomes using an improved supercritical carbon dioxide method. Innov. Food Sci. Emerg. Technol. 2017, 39, 119–128. [Google Scholar] [CrossRef]
- Pismenskaya, N.; Sarapulova, V.; Klevtsova, A.; Aleshkina, D.; Mikhaylin, S.; Bazinet, L. Adsorption of anthocyanins by cation and anion exchange resins with an aromatic and aliphatic polymer matrix. Int. J. Mol. Sci. 2020, 21, 7874. [Google Scholar] [CrossRef] [PubMed]
- Bazinet, L.; Ippersiel, D.; Montpetit, D.; Mahdavi, B.; Amiot, J.; Lamarche, F. Effect of membrane permselectivity on the fouling of cationic membranes during skim milk electroacidification. J. Membr. Sci. 2000, 174, 97–110. [Google Scholar] [CrossRef]
- Lteif, R.; Dammak, L.; Larchet, C.; Auclair, B. Conductivité électrique membranaire: Étude de l’effet de la concentration, de la nature de l’électrolyte et de la structure membranaire. Eur. Polym. J. 1999, 35, 1187–1195. [Google Scholar] [CrossRef]
- Lebrun, L.; Da Silva, E.; Pourcelly, G.; Métayer, M. Elaboration and characterisation of ion-exchange films used in the fabrication of bipolar membranes. J. Membr. Sci. 2003, 227, 95–111. [Google Scholar] [CrossRef]
- Buess-Herman, C. Study of water content and microheterogeneity of CMS cation exchange mem-brane. Chem. Phys. Lett. 2007, 434, 49–55. [Google Scholar]
- Zabolotsky, V.I.; Nikonenko, V.V. Effect of structural membrane inhomogeneity on transport properties. J. Membr. Sci. 1993, 79, 181–198. [Google Scholar] [CrossRef]
- Faucher, M.; Serre, É.; Langevin, M.-È.; Mikhaylin, S.; Lutin, F.; Bazinet, L. Drastic energy consump-tion reduction and ecoefficiency improvement of cranberry juice deacidification by electrodialysis with bipolar membranes at semi-industrial scale: Reuse of the recovery solution. J. Membr. Sci. 2018, 555, 105–114. [Google Scholar] [CrossRef]
- Güler, E.; van Baak, W.; Saakes, M.; Nijmeijer, K. Monovalent-ion-selective membranes for reverse electrodialysis. J. Membr. Sci. 2014, 455, 254–270. [Google Scholar] [CrossRef]
- Nebavskaya, K.; Sarapulova, V.; Sabbatovskiy, K.; Sobolev, V.; Pismenskaya, N.; Sistat, P.; Cretin, M.; Nikonenko, V. Impact of ion exchange membrane surface charge and hydrophobicity on elec-troconvection at underlimiting and overlimiting currents. J. Membr. Sci. 2017, 523, 36–44. [Google Scholar] [CrossRef]
- Długołęcki, P.; Anet, B.; Metz, S.J.; Nijmeijer, D.C.; Wessling, M. Transport limitations in ion exchange membranes at low salt concentrations. J. Membr. Sci. 2010, 346, 163–171. [Google Scholar] [CrossRef]
- Kamcev, J.; Paul, D.R.; Freeman, B.D. Effect of fixed charge group concentration on equilibrium ion sorption in ion exchange membranes. J. Mater. Chem. A 2017, 5, 4638–4650. [Google Scholar] [CrossRef]
- Gohil, G.; Shahi, V.K.; Rangarajan, R. Comparative studies on electrochemical characterization of homogeneous and heterogeneous type of ion-exchange membranes. J. Membr. Sci. 2004, 240, 211–219. [Google Scholar] [CrossRef]
- Pismenskaya, N.; Laktionov, E.; Nikonenko, V.; El Attar, A.; Auclair, B.; Pourcelly, G. Dependence of composition of anion-exchange membranes and their electrical conductivity on concentration of sodium salts of carbonic and phosphoric acids. J. Membr. Sci. 2001, 181, 185–197. [Google Scholar] [CrossRef]
- Sarapulova, V.; Shkorkina, I.; Mareev, S.; Pismenskaya, N.; Kononenko, N.; Larchet, C.; Dammak, L.; Nikonenko, V. Transport Characteristics of Fujifilm Ion-Exchange Membranes as Compared to Homogeneous Membranes AMX and CMX and to Heterogeneous Membranes MK-40 and MA-41. Membranes 2019, 9, 84. [Google Scholar] [CrossRef] [PubMed] [Green Version]
- Berezina, N.; Kononenko, N.; Dyomina, O.; Gnusin, N. Characterization of ion-exchange membrane materials: Properties vs. structure. Adv. Colloid Interface Sci. 2008, 139, 3–28. [Google Scholar] [CrossRef] [PubMed]
- Kononenko, N.; Nikonenko, V.; Grande, D.; Larchet, C.; Dammak, L.; Fomenko, M.; Volfkovich, Y. Porous structure of ion exchange membranes investigated by various techniques. Adv. Colloid Interface Sci. 2017, 246, 196–216. [Google Scholar] [CrossRef] [PubMed]
- Vasil’Eva, V.I.; Pismenskaya, N.D.; Akberova, E.M.; Nebavskaya, K.A. Effect of thermochemical treatment on the surface morphology and hydrophobicity of heterogeneous ion-exchange membranes. Russ. J. Phys. Chem. A 2014, 88, 1293–1299. [Google Scholar] [CrossRef]
- Zhou, J.; Kuang, H.; Zhuang, W.; Chen, Y.; Liu, N.; Ying, H.; Wu, J. Application of electrodialysis to extract 5′-ribonucleotides from hydrolysate: Efficient decolorization and membrane fouling. RSC Adv. 2018, 8, 29115–29128. [Google Scholar] [CrossRef] [Green Version]
- He, F.; Mu, L.; Yan, G.-L.; Liang, N.-N.; Pan, Q.-H.; Wang, J.; Reeves, M.J.; Duan, C.-Q. Biosynthesis of anthocyanins and their regulation in colored grapes. Molecules 2010, 15, 9057–9091. [Google Scholar] [CrossRef] [Green Version]
- Costa, A.M.S.; Sobral, M.M.C.; Delgadillo, I.; Cerdeira, A.; Rudnitskaya, A. Astringency quantifica-tion in wine: Comparison of the electronic tongue and FT-MIR spectroscopy. Sens. Actuators B 2015, 207, 1095–1103. [Google Scholar] [CrossRef]
- Pismenskaya, N.; Sarapulova, V.; Nevakshenova, E.; Kononenko, N.; Fomenko, M.; Nikonenko, V. Concentration Dependencies of Diffusion Permeability of Anion-Exchange Membranes in Sodium Hydrogen Carbonate, Monosodium Phosphate, and Potassium Hydrogen Tartrate Solutions. Membranes 2019, 9, 170. [Google Scholar] [CrossRef] [Green Version]
- Czochanska, Z.; Foo, L.Y.; Newman, R.H.; Porter, L.J. Polymeric proanthocyanidins. Stereochemis-try, structural units, and molecular weight. J. Chem. Soc. Perkin Trans. 1980, 1, 2278–2286. [Google Scholar] [CrossRef]
- Khoo, H.E.; Azlan, A.; Tang, S.T.; Lim, S.M. Anthocyanidins and anthocyanins: Colored pigments as food, pharmaceutical ingredients, and the potential health benefits. Food Nutr. Res. 2017, 61, 1361779. [Google Scholar] [CrossRef] [PubMed] [Green Version]
- Castañeda-Ovando, A.; de Lourdes Pacheco-Hernández, M.; Páez-Hernández, M.E.; Rodríguez, J.A.; Galán-Vidal, C.A. Chemical studies of anthocyanins: A review. Food Chem. 2009, 113, 859–871. [Google Scholar] [CrossRef]
- Ribéreau-Gayon, P.; Glories, Y.; Maujean, A.; Dubourdieu, D. Handbook of Enology, Volume 2: The Chemistry of Wine-Stabilization and Treatments; John Wiley & Sons: Hoboken, NJ, USA, 2006; Volume 2. [Google Scholar]


| pH | 2.45 ± 0.02 |
| °Brix | 17.8 ± 0.1 |
| Conductivity (µS/cm) | 3817.3 ± 20.2 |
| Proanthocyanidins (ppm) | |
| Monomers | 87.8 ± 1.1 |
| 2-mers | 202.3 ± 16.0 |
| 3-mers | 87.2 ± 3.6 |
| 4-mers | 40.1 ± 1.2 |
| 5-mers | 14.9 ± 1.2 |
| 6-mers | 10.0 ± 0.7 |
| 7-mers | 1.2 ± 2.1 |
| Polymers | 44.3 ± 16.9 |
| Anthocyanins (ppm) | |
| Cyanidine 3-galactoside | 78.7 ± 0.3 |
| Cyanidine 3-glucoside | 3.6 ± 0.1 |
| Cyanidine 3-arabinoside | 70.7 ± 0.4 |
| Peonidine 3-galactoside | 96.1 ± 0.5 |
| Peonidine 3-glucoside | 7.5 ± 0.3 |
| Peonidine 3-arabinoside | 47.4 ± 0.4 |
| Membrane | Ion Exchange Matrix | Macropores | Fixed Groups | Reinforcing Cloth |
|---|---|---|---|---|
| CSE-fg | Aromatic DVB+PS | Absence | -SO3H | PVC fabric |
| MK-40 | Aromatic DVB+PS | Presence | -SO3H | nylon mesh |
| CEM Type-II | Aliphatic polyamide | Absence | -SO3H | 3D polyolefin fibers structure |
| CJMC-5 | Aliphatic PVDF+SSS | Presence | -SO3H | polyester mesh |
| Membrane | Thickness (μm) | ||||
|---|---|---|---|---|---|
| 0.10 M | 0.25 M | 0.50 M | 0.75 M | 1.00 M | |
| CSE-fg | 142 ± 3 dAB | 136 ± 4 cA | 142 ± 3 dAB | 137 ± 4 dA | 145 ± 4 dB |
| MK-40 | 525 ± 11 aAB | 518 ± 11 aAB | 532 ± 15 aA | 514 ± 6 aB | 530 ± 7 aAB |
| CEM Type-II | 179 ± 4 bA | 170 ± 5 bB | 175 ± 3 bAB | 169 ± 3 bB | 176 ± 3 bC |
| CJMC-5 | 154 ± 3 cA | 145 ± 5 cB | 154 ± 2 cA | 145 ± 3 cB | 153 ± 4 cA |
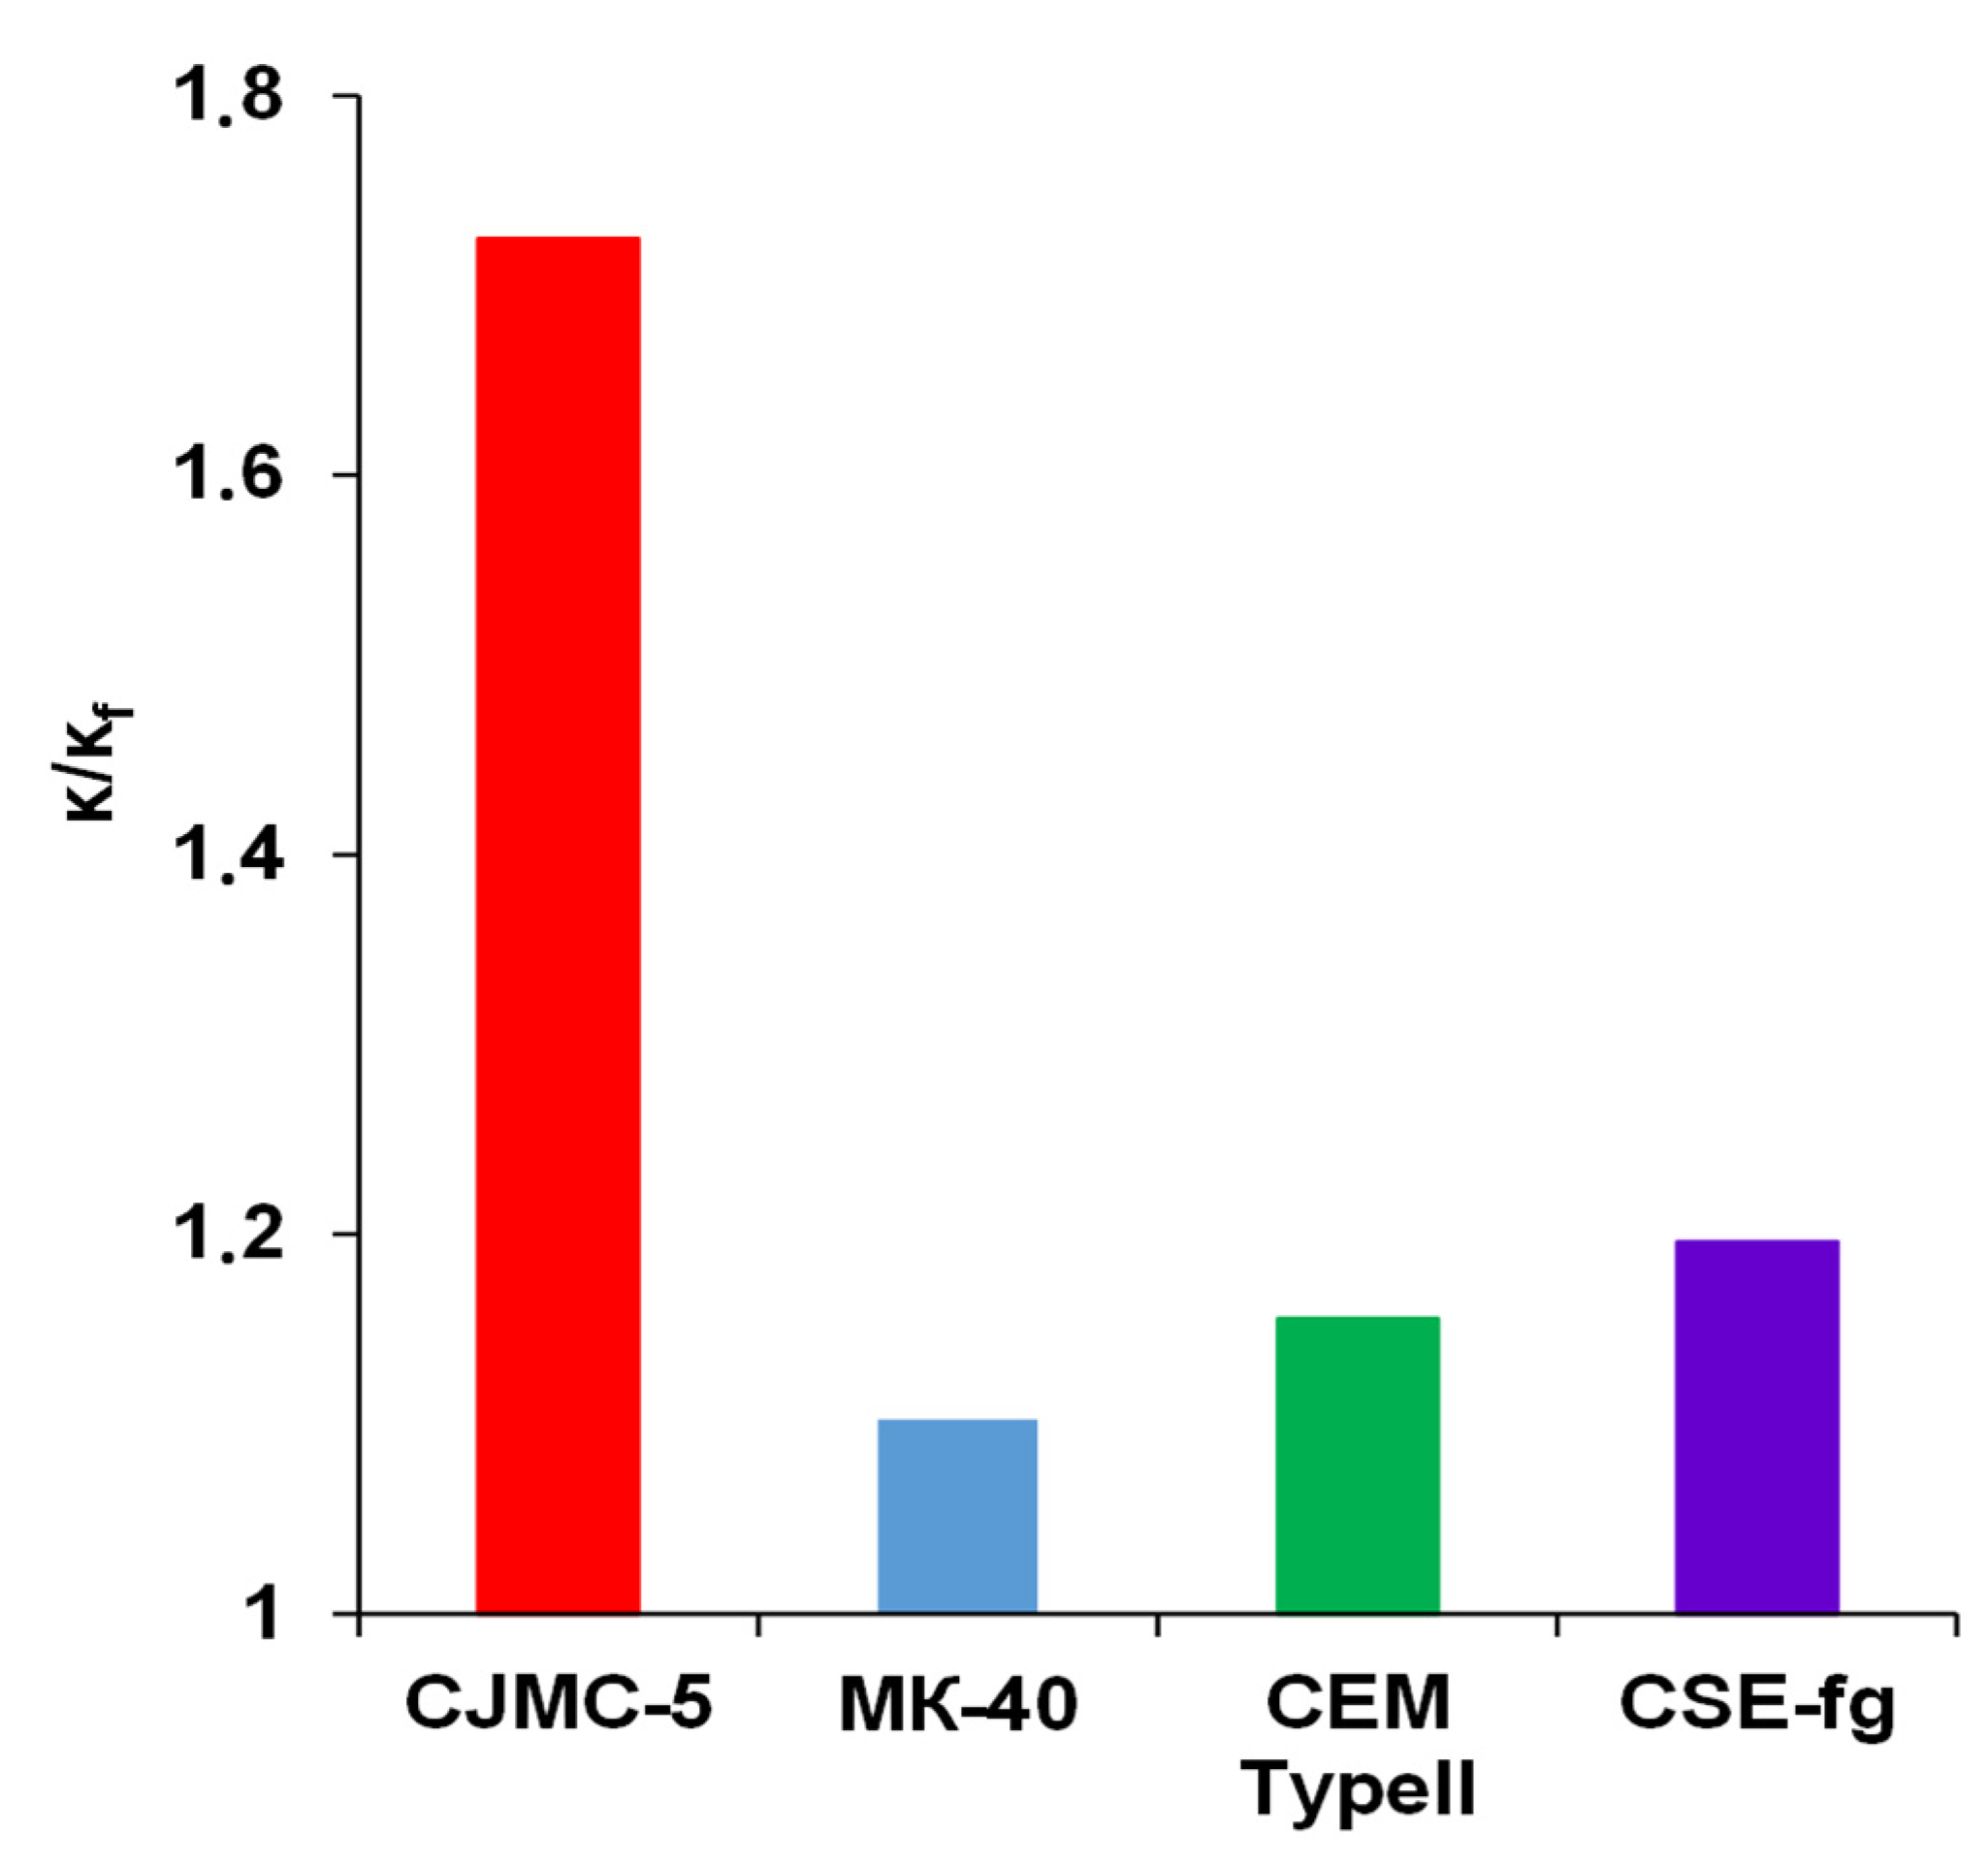
| Matrix | Membrane | f2 | ||
|---|---|---|---|---|
| Aromatic | CSE-fg | 0.073 ± 0.030 | 6.9 ± 0.8 | 1.73 ± 0.05 |
| MK-40 | 0.243 ± 0.010 | 3.8 ± 0.3 | 1.88 ± 0.03 | |
| Aliphatic | CEM Type II | 0.139 ± 0.010 | 1.8 ± 0.1 | 1.57 ± 0.03 |
| CJMC-5 | 0.335 ± 0.060 | 1.2 ± 0.3 | 0.88 ± 0.08 |
| External Solution | Internal Solution |
|---|---|
| 3.6 | 2.7 |
| 6.9 | 4.0 |
| 9.3 | 7.0 |
| Membrane Soaking Time in Cranberry Juice (h) | Membrane Thickness (μm) | Thickness of the Anthocyanins-Free Layer (µm) |
|---|---|---|
| 3 | 521 ± 2 | 370 ± 5 |
| 17 | 523 ± 2 | 350 ± 5 |
| 72 | 532 ± 2 | 270 ± 5 |
| 168 | 549 ± 2 | 170 ± 5 |
| PAC | Desorption Method | CSE-fg | MK-40 | CEM Type-II | CJMC-5 |
|---|---|---|---|---|---|
| Monomers | Entire, DS pH 6 | ND bA | 76.4 ± 2.9 aA | ND bA | ND bA |
| Cryogenic grinding, DS pH 6 | ND bA | 55.0 ± 12.8 aB | ND bA | ND bA | |
| Cryogenic grinding, DS pH 10 | 89.6 ± 5.6 bB | 62.1 ± 5.9 aAB | - | - | |
| Cryogenic + finer grinding, DS pH 6 | 95.6 ± 3.6 bB | 57.2 ± 2.4 aB | - | - | |
| 2 mers | Entire, DS pH 6 | ND bA | 375.0 ± 14.7 aA | ND bA | ND bA |
| Cryogenic grinding, DS pH 6 | ND bA | 210.0 ± 91.2 aB | ND bA | ND bA | |
| Cryogenic grinding + pH 10 | 80.3 ± 5.3 bB | 226.4 ± 21.0 aB | - | - | |
| Cryogenic + finer grinding, DS pH 6 | 39.4 ± 1.5 bC | 16.9 ± 0.7 aC | - | - | |
| 3 mers | Entire, DS pH 6 | ND bA | 39.8 ± 11.5 aA | ND bA | ND bA |
| Cryogenic grinding, DS pH 6 | ND bA | 13.9 ± 8.0 aBC | ND bA | ND bA | |
| Cryogenic grinding, DS pH 10 | ND bA | 17.4 ± 1.9 aBC | - | - | |
| Cryogenic + finer grinding, DS pH 6 | ND bA | 6.3 ± 0.6 aC | - | - | |
| 4 mers | Entire, DS pH 6 | ND bA | 12.3 ± 2.2 aAB | ND bA | ND bA |
| Cryogenic grinding, DS pH 6 | ND bA | 3.0 ± 5.2 aB | ND bA | ND bA | |
| Cryogenic grinding, DS pH 10 | ND aA | ND aC | ND aA | ND aA | |
| Cryogenic + finer grinding, DS pH 6 | ND aA | ND aC | ND aA | ND aA | |
| Polymers | Entire, DS pH 6 | ND aA | ND aA | ND aA | ND aA |
| Cryogenic grinding, DS pH 6 | ND aA | ND aA | ND aA | ND aA | |
| Cryogenic grinding, DS pH 10 | ND aA | ND aA | - | - | |
| Cryogenic + finer grinding, DS pH 6 | 98.9 ± 87.8 aB | 30.2 ± 0.5 aB | - | - |
| Anthocyanin | Desorption Method | CSE-fg | MK-40 | CEM Type-ll | CJMC-5 |
|---|---|---|---|---|---|
| Cyanidin 3- galactoside | Entire, DS pH 6 | 24.5 ± 2.9 dA | 74.4 ± 7.5 aA | 88.4 ± 47.7 aA | 4.6 ± 8.0 bA |
| Cryogenic grinding, DS pH 6 | 68.9 ± 2.6 aB | 47.7 ± 10.5 aB | 48.7± 13.9 aA | ND bB | |
| Cryogenic grinding, DS pH 10 | 341.0 ± 29.3 bC | 470.6 ± 30.1 aC | - | - | |
| Cryogenic + finer grinding, DS pH 6 | 21.3 ± 2.5 bA | 10.9 ± 2.4 aD | - | - | |
| Cyanidin 3- glucoside | Entire, DS pH 6 | ND bA | 4.1 ± 0.4 aA | ND bA | ND bA |
| Cryogenic grinding, DS pH 6 | ND bA | 0.10 ± 0.01 aB | ND bA | ND bA | |
| Cryogenic grinding, DS pH 10 | 13.8 ± 1.6 bB | 18.1 ± 1.0 aC | - | - | |
| Cryogenic + finer grinding, DS pH 6 | ND bA | 0.8 ± 0.2 aB | - | - | |
| Cyanidin 3- arabinoside | Entire, DS pH 6 | 29.0 ± 5.7 dA | 76.0 ± 8.2 aA | 124.3 ± 63.8 aA | 5.0 ± 8.6 bA |
| Cryogenic grinding, DS pH 6 | 73.8 ± 3.7 cB | 39.4 ± 7.7 aB | 52.7 ± 11.5 aA | ND bB | |
| Cryogenic grinding, DS pH 10 | 405.9 ± 27.7 bC | 504.7 ± 25.5 aC | - | - | |
| Cryogenic + finer grinding, DS pH 6 | 12.0 ± 11.1 aA | 8.9 ± 1.7 aD | - | - | |
| Peonidin 3- galactoside | Entire, DS pH 6 | 32.2 ± 1.8 bA | 83.2 ± 10.3 aA | 108.1 ± 57.9 aA | 7.4 ± 12.8 b* |
| Cryogenic grinding, DS pH 6 | 89.5 ± 5.7 bB | 62.8 ± 16.9 abA | 53.7 ± 10.2 aA | ND c | |
| Cryogenic grinding, DS pH 10 | 338.8 ± 35.5 bC | 520.9 ± 29.8 aB | - | - | |
| Cryogenic + finer grinding, DS pH 6 | 27.7 ± 3.8 bA | 1.5 ± 0.3 aC | - | - | |
| Peonidin 3- glucoside | Entire, DS pH 6 | ND bA | 10.2 ± 0.8 aA | ND bA | ND bA |
| Cryogenic grinding, DS pH 6 | ND bA | 7.0 ± 1.8 aB | ND bA | ND bA | |
| Cryogenic grinding, DS pH 10 | 28.5 ± 2.9 bB | 43.9 ± 2.7 aC | - | - | |
| Cryogenic + finer grinding, DS pH 6 | ND bA | 15.7 ± 3.1 aD | - | - | |
| Peonidin 3- arabinoside | Entire, DS pH 6 | 26.0 ± 3.4 acA | 46.4 ± 6.3 aA | 82.3 ± 40.3 aA | 3.3 ± 5.7 bA |
| Cryogenic grinding, DS pH 6 | 52.5 ± 3.6 cB | 28.3 ± 6.8 aB | 33.0 ± 9.0 aA | ND bB | |
| Cryogenic grinding, DS pH 10 | 213.8 ± 20.0 bC | 294.2 ± 15.5 aC | - | - | |
| Cryogenic + finer grinding, DS pH 6 | 16.7 ± 3.4 bD | 7.3 ± 1.6 aD | - | - |
| Phenomenon | Probability of Impact on Sorption Capacity | |||
|---|---|---|---|---|
| CSE-fg | MK-40 | CEM Type-II | CJMC-5 | |
| Electrostatic interactions between polyphenolic ions and fixed groups of membranes (depends on the exchange capacity of the membranes) | high | moderate | moderate | low |
| Hydrophobic-hydrophobic π-π (stacking) interactions of aromatic rings of polyphenols and membrane’s polymers | high | high | negligible | low |
| Ion-dipole (hydrogen bonds) and dipole-dipole (Van der Waals) interactions. Hydrogen bonds between –OH and/or carbonic groups of polyphenols with oxygen of the sulfonic fixed groups as well as hydrogen of the aliphatic chains of materials that are part of the membrane (PA, PVC, nylon, etc.) | moderate | moderate | high | high |
| Steric limits on the transport of large particles (depends on the presence of macropores and their localization) | high | low | moderate | negligible |
Publisher’s Note: MDPI stays neutral with regard to jurisdictional claims in published maps and institutional affiliations. |
© 2021 by the authors. Licensee MDPI, Basel, Switzerland. This article is an open access article distributed under the terms and conditions of the Creative Commons Attribution (CC BY) license (http://creativecommons.org/licenses/by/4.0/).
Share and Cite
Perreault, V.; Sarapulova, V.; Tsygurina, K.; Pismenskaya, N.; Bazinet, L. Understanding of Adsorption and Desorption Mechanisms of Anthocyanins and Proanthocyanidins on Heterogeneous and Homogeneous Cation-Exchange Membranes. Membranes 2021, 11, 136. https://doi.org/10.3390/membranes11020136
Perreault V, Sarapulova V, Tsygurina K, Pismenskaya N, Bazinet L. Understanding of Adsorption and Desorption Mechanisms of Anthocyanins and Proanthocyanidins on Heterogeneous and Homogeneous Cation-Exchange Membranes. Membranes. 2021; 11(2):136. https://doi.org/10.3390/membranes11020136
Chicago/Turabian StylePerreault, Véronique, Veronika Sarapulova, Ksenia Tsygurina, Natalia Pismenskaya, and Laurent Bazinet. 2021. "Understanding of Adsorption and Desorption Mechanisms of Anthocyanins and Proanthocyanidins on Heterogeneous and Homogeneous Cation-Exchange Membranes" Membranes 11, no. 2: 136. https://doi.org/10.3390/membranes11020136