Article

Partial Desalination of Saline Groundwater: Comparison of Nanofiltration, Reverse Osmosis and Membrane Capacitive Deionisation

1
Chair of Process Engineering in Hydro Systems, Institute of Urban and Industrial Water Management, Faculty of Environmental Sciences, Technische Universität Dresden, 01062 Dresden, Germany
2
Chair of Forest Biometrics and Forest Systems Analysis, Department of Forest Sciences, Faculty of Environmental Sciences, Technische Universität Dresden, 01062 Dresden, Germany
*
Author to whom correspondence should be addressed.
Membranes 2021, 11(2), 126; https://doi.org/10.3390/membranes11020126
Submission received: 31 December 2020 / Revised: 31 January 2021 / Accepted: 3 February 2021 / Published: 12 February 2021
(This article belongs to the Special Issue Selected Papers from the MELPRO 2020)

Abstract

:
Saline groundwater (SGW) is an alternative water resource. However, the concentration of sodium, chloride, sulphate, and nitrate in SGW usually exceeds the recommended guideline values for drinking water and irrigation. In this study, the partial desalination performance of three different concentrated SGWs were examined by pressure-driven membrane desalination technologies: nanofiltration (NF), brackish water reverse osmosis (BWRO), and seawater reverse osmosis (SWRO); in addition to one electrochemical-driven desalination technology: membrane capacitive deionisation (MCDI). The desalination performance was evaluated using the specific energy consumption (SEC) and water recovery, determined by experiments and simulations. The experimental results of this study show that the SEC for the desalination of SGW with a total dissolved solid (TDS) concentration of 1 g/L by MCDI and NF is similar and ranges between 0.2–0.4 kWh/m3 achieving a water recovery value of 35–70%. The lowest SECs for the desalination of SGW with a TDS concentration ≥2 g/L were determined by the use of BWRO and SWRO with 0.4–2.9 kWh/m3 for a water recovery of 40–66%. Even though the MCDI technique cannot compete with pressure-driven membrane desalination technologies at higher raw water salinities, this technology shows a high selectivity for nitrate and a high potential for flexible desalination applications.

Graphical Abstract

1. Introduction

Due to a continuously growing population, economic development, and changing consumption patterns, potable water consumption has increased globally. At the same time, the quality of groundwater and surface water has decreased, causing a reduction in the levels of terrestrial water storage and water scarcity in regions such as the Middle East, India, Australia, and Africa [1,2,3,4]. Salinization can be both natural and anthropogenically induced and is caused by the long-term degradation of water quality in surface and groundwater resources [5]. In particular, coastal aquifers in semiarid and arid areas can be affected by saltwater intrusion [6,7,8,9]. Based on the mass concentration of chloride ( Cl ) and total dissolved solids (TDS), saline groundwater (SGW) is classified as either slightly SGW, moderately SGW or highly SGW [10,11], as listed in Table 1. Due to high concentrations of salt ions (e.g., sodium ( Na + ), Cl , sulphate ( SO 4 2 ), and nitrate ( NO 3 ))—exceeding the corresponding drinking water and irrigation guidelines—SGW is generally not suitable for either potable use or agricultural use [12,13]. However, compared to seawater, the ion concentration of SGW is often lower, making SGW a better option for energy efficient desalination [14,15].
Desalination is a separation process used to reduce the concentration of TDS in saline water. Desalination technologies can be classified by the separation procedure. Either the pure water is removed from the feedwater as is the case in distillation and pressure-driven membrane desalination, or the salts are removed from the feedwater as is done in electrodialysis and capacitive deionisation [16]. At present, reverse osmosis (RO), which is a pressure-driven membrane desalination technique, is the most common desalination process for seawater and brackish water, due to its low energy consumption [16,17]. RO uses hydrostatic pressure greater than the osmotic pressure of the saline solution to drive the liquid through a membrane against the natural direction of osmosis producing a permeate stream on the effluent site and a concentrate stream (brine) on the influent site of the membrane (Figure 1) [12]. RO membranes do not have definable pores whereby the solution-diffusion-model can describe the transport of water and salt in such membranes [18]. RO can be grouped into seawater RO (SWRO) and brackish water RO (BWRO), according to the characteristics of the specific membranes. SWRO is usually used for a salinity close to seawater. SWRO membranes are characterized by a high salt rejection but a low permeate flux. In contrast, BWRO membranes are usually applied for feed water with a salinity range of 0.5–10 g/L and offer a higher permeate flux, a lower salt rejection, and require a lower transmembrane pressure [12]. Referring to Voutchkov [19], the average volume-related specific energy consumption ( S E C V ) for BWRO ranges between 0.3–2.8 kWh/m3 and for SWRO between 2.5–4.0 kWh/m3.
Nanofiltration is another cost-effective desalination technique characterized by a looser membrane compared to RO membranes, resulting in a higher permeate flux and a lower rejection of monovalent ions [18]. According to Dach [20], and Schäfer and Richards [21], the S E C V for SGW desalination by NF ranges between 0.2–3.5 kWh/m3 depending on the feed and target water concentration.
Electrochemical-driven membrane technologies such as electrodialysis and capacitive deionisation (CDI) are alternative flexible desalination technologies for brackish water with a low requirement for chemical additives [22]. Electrodialysis (reversal) has been applied in practice for several decades and is a proven energy efficient technology for brackish water desalination [23]. In contrast, CDI is an innovative technology and is seldomly used at the pilot-scale. However, CDI has become one of the most investigated electrochemical-driven desalination technologies in the last decade [24,25,26,27,28]. CDI is a cyclic desalination technique which removes charged ions from water using direct current power to generate an electric field between a positively and a negatively charged electrode which adsorb anions and cations, respectively, of saline water to generate a desalinated water stream (diluate) [29,30]. After the adsorption cycle, the rejected ions desorb into a wasted feed stream (brine) by short-circuiting the electrodes or by reversing the electrical current. The latter makes it possible to recover the electrical energy stored in the electrodes [31,32]. In order to increase the salt rejection in CDI, ion exchange membranes or ion exchange coating can be used to reduce the effect of co-ion adsorption—the adsorption of ions to an electrode carrying the same charge—and allow the electric charge to reverse during the desorption cycle [31,33]. This enhanced desalination technique is called membrane capacitive deionisation (MCDI) (Figure 1). However uncharged compounds, such as organics or biological species, are not removed by (M)CDI [14]. According to Qin et al. [34] and Zhao et al. [35], the average S E C V for MCDI ranges between 0.1–3.5 kWh/m3, treating brackish water with a salinity of 1–5 g/L and a water-recovery of 50%.
The steadily increasing demand for freshwater in regions affected by saltwater intrusion is driving the need for energy efficient desalination technologies. The desalination of SGW is—due to the relatively low salinity and low required energy consumption compared to seawater desalination—a vital solution for solving problems related to water stress and scarcity [14,36]. Many previous studies have compared the performance of RO and MCDI but have only used NaCl as the feed solution or have not fulfilled the requirements for a fair comparison of both technologies with the same boundary conditions regarding a similar level of water recovery and salt rejection [34,35,36,37].
Hence, the objective of this study is to compare the desalination performance of SGW by pressure-driven membrane desalination technologies—using NF, BWRO, and SWRO—and an electrochemical technique—using MCDI—to answer the research question: which technique has the lowest SEC regarding different desalination scenarios? Therefore, the desalination performance in this study is evaluated by the volume-related specific energy consumption ( S E C V ), removed ion-related specific energy consumption ( S E C I o n ) , energy efficiency, specific salt rejection, and the water recovery. Thereby, this study is not focused on the total desalination of SGW, but on partial desalination, producing “fit-for-purpose” water [27]. This was done by a small-scale experiment with constant conditions using different realistic mixed ion concentrations in the feedwater and different realistic target concentrations for the produced desalinated water. Thereby, this study evaluates the desalination performance, according to the rejection of TDS, Na + , Cl , NO 3 , and SO 4 2 . Additionally, the small-scale results for pressure-driven membrane desalination techniques were compared to simulations by using commercial membrane manufacturing software. Finally, the findings are discussed regarding future research demands.

2. Materials and Methods

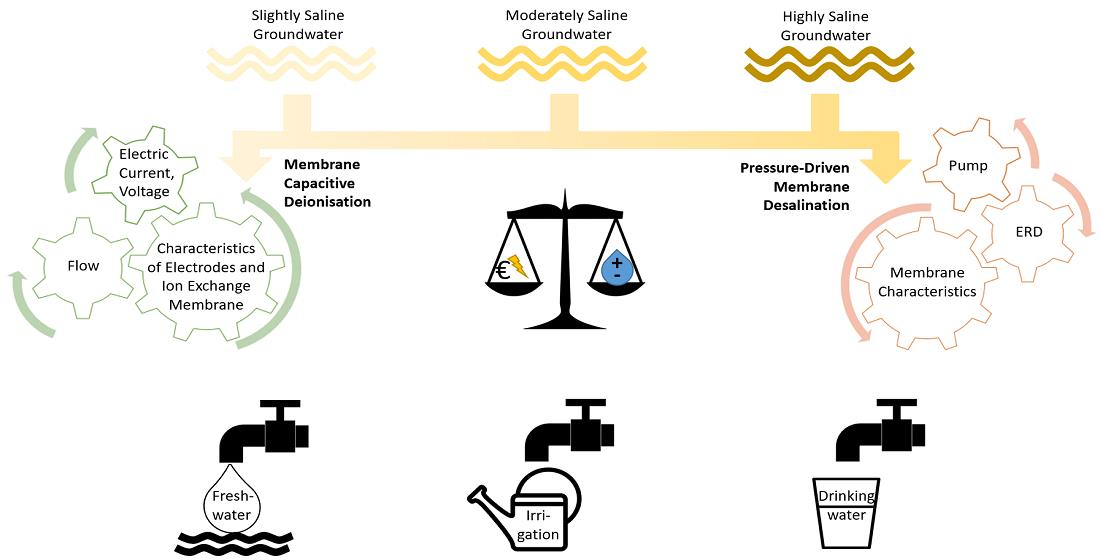
2.1. Investigated Desalination Scenarios

The performance of SGW desalination was studied in small-scale experiments using synthetic SGW with three different water compositions, as shown in Table 1: a slightly SGW with 1.0 g TDS/L, a moderately SGW with 2.2 g TDS/L, and a highly SGW with 18.3 g TDS/L. To represent realistic desalination scenarios, SGW concentrations were chosen from wells located in Dalian in China, Salalah in Oman, and the Nile Delta in Egypt. The specific ion concentrations are shown in Table 2. Thereby, it is obvious that the concentrations of Na + , Cl , bicarbonate ( HCO 3 ), and SO 4 2 are lower in SGW compared to seawater. The concentrations of calcium ( Ca 2 + ), magnesium ( Mg 2 + ), and SO 4 2 are variable in SGW according to the hydro-geochemical reactions and biological processes in the aquifer [38,39]. The synthetic SGW was prepared by adding CaCl 2 , KCl , MgCl 2 · 6 H 2 O , MgSO 4 · 7 H 2 O , NaCl , Na 2 SO 4 , NaHCO 3 , NaNO 3 , and Ca ( NO 3 ) 2 · 4 H 2 O into deionized water in 30–100 L basins, which were tempered according to the realistic local groundwater temperatures (±0.5 °C) in Table 2.
The target concentrations in this study were chosen according to three possible applications for partial desalinated SGW in the above-mentioned regions. Since the injection of desalinated SGW can be a used for managed aquifer recharge to artificially alter the hydraulic gradient in order to reduce or even reverse the process of saltwater intrusion [40,41], the first target concentration was set to be close to the local fresh groundwater quality [42]. The second and third target concentrations were chosen according to the recommended target concentrations for irrigation [13] and drinking water [43,44]. Hence, the different desalination scenarios were defined by three different SGW qualities and three different target concentrations (Table 2).
The sodium adsorption ratio (SAR) is defined by the ratio of Na + to Ca 2 + and Mg 2 + . A high SAR may lead to a lower water infiltration rate into the soil, especially for water with low electric conductivity [13]. Since the rejection of divalent ions is higher than for Na + for pressure-driven membrane desalination [18] as well as for MCDI [53], the SAR cannot only be managed by desalination but also by adding Ca 2 + and Mg 2 + in the post treatment. Since this study is focused only on desalination itself, this parameter is not considered in this study.

2.2. Specific Energy Consumption and Water Recovery

The mass concentrations of SGW ( β S G W , j ) and the target concentrations in the desalinated water ( c P r o d u c t , j ) are shown in Table 2 for specific ions ( j ). These concentrations define the required system-scale salt rejection ( R S y s t e m , j ; Equation (1)) and the required removed ion concentration ( c i , r e m o v e d ; Equation (2)) which are equally defined for each desalination technique. Thereby, the molar concentration ( c j ) is calculated by the ion specific molar mass ( M j ) and the mass concentration ( β j ) in Equation (3).
R S y s t e m , j = 1 c P r o d u c t , j c S G W , j
c j , r e m o v e d = c S G W , j c P r o d u c t , j
c j = β j M j
The volume-related specific energy consumption ( S E C V ; Equation (4)) and the ion-related specific energy consumption ( S E C I o n ; Equation (5)), which is required to ensure the needed salt rejection in the product water, is calculated by the consumed energy ( E ) per m3 desalinated product water ( V P r o d u c t ) and the removed ion concentration [34].
S E C V = E V P r o d u c t
S E C I o n = E V P r o d u c t · c j , r e m o v e d
Since the desalination performances were only evaluated for mixed salt solutions and not for single salt solutions, the S E C I o n is therefore determined for a mixed salt solution to comply with the target concentrations for either Na + , Cl , NO 3 or SO 4 2 . The S E C V was thereby determined to comply with all the target concentrations.
The concentration of the synthetic SGW and the target concentration in the product water were default values in this study. The water recovery, however, can vary depending on the operation and system parameters of the used desalination technology. Additionally, a distinction was made between the module-scale water recovery ( γ M o d u l e , w ) and the system-scale water recovery ( γ S y s t e m , w ; Equation (6)). The module-scale water recovery is the ratio of the permeate flow rate ( Q D W ) to the feed flow rate ( Q F e e d ), whereas the system-scale water recovery is defined by the ratio of the product water flow rate ( Q P r o d u c t , w ) to the SGW flow rate ( Q S G W , w ), which is characterised by the module-scale salt rejection ( R M o d u l e , j ; Equation (6)) (Figure 1).
γ S y s t e m , w = Q P r o d u c t , w Q S G W , w
The module-scale salt rejection depends on the properties of the specific pressure-driven membrane desalination and MCDI modules, as well as on the specific process parameters such as pressure, applied electrical current, and flow rate. Therefore, the module-scale salt rejection ( R M o d u l e , j ; Equation (7)) is not equal for each desalination configuration.
R M o d u l e , j = c D W , j c F e e d , j
In case R M o d u l e , j > R S y s t e m , j , the partial desalinated flow rate ( Q D W , w ) was blended by using an adequate bypass flow rate ( Q B y p a s s ,   w ) of SGW (Figure 1) to achieve a higher system-scale water recovery for pressure-driven membrane desalination due to the high salt retention of the membranes [12,19].
The theoretical minimum volume-related specific energy consumption ( S E C m i n , V ) for separating a saline solution into a partial desalinated stream and a concentrated brine can be calculated by the second law of thermodynamics [15,54]. The S E C m i n , V is thereby independent of the desalination technique and used in this paper to calculate the energy efficiency by the ratio of S E C m i n , V to S E C V of the respective desalination processes. Therefore, it is assumed that S E C m i n , V for separating, equals the minimum Gibbs free energy for salt-water mixtures, neglecting the energy loss by friction or heat. Since two ideal solutions—a high concentrated solution (here: brine) and a low saline solution (here: partial desalinated water)—which are initially separated by an impermeable membrane, react spontaneously to a mixed solution (by removing the impermeability of the membrane) due to diffusion, the change in the Gibbs free energy   ( G m i x ) can be calculated by the increase in entropy of the mixed solution ( S m i x ; Equation (7)) [55].
G m i x = T · S m i x = R g T   x j ln x j
where Rg is the ideal gas constant ( 8.314   k g   m 2 s 2 m o l   K ), T the temperature ( K ), and x j the mole fraction of the considered salt. Equation (8) can be transcribed to the following formula (Equation (9)) to calculate the S E C m i n , V for desalination [56].
S E C m i n , V = G m i x i R g T [ c F e e d γ l n ( c B r i n e c F e e d ) c P r o d u c t   l n ( c B r i n e c P r o d u c t ) ]
where i is the specific van’t Hoff factor. Since this study is focused on the mixed saltwater compositions, S E C m i n , V was calculated for the mixed salt concentrations in Table 2.

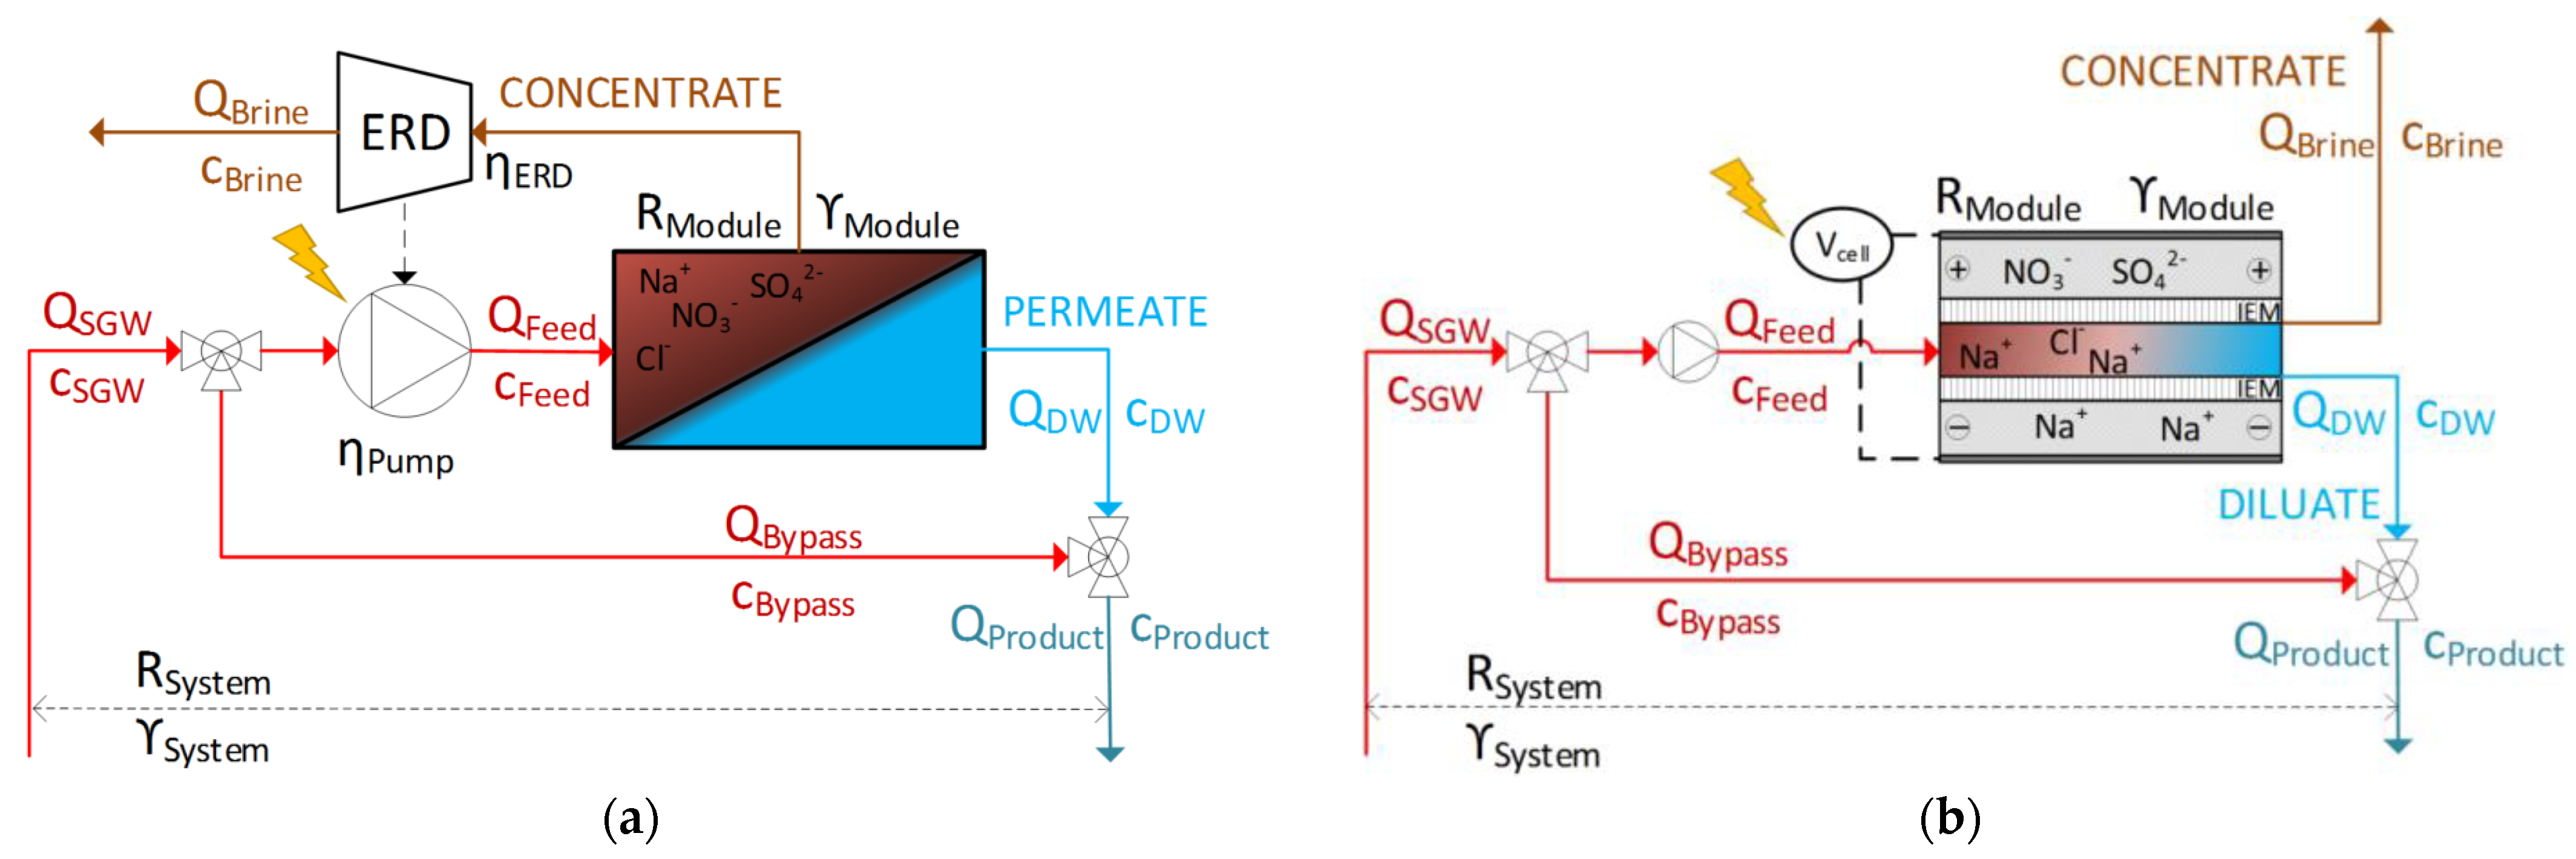
2.3. Pressure-Driven Membrane Desalination

2.3.1. Specific Energy Consumption

The energy-consuming factor for pressure-driven membrane desalination is the feed pressure. The feed pressure needs to be adjusted to ensure the required permeate (and concentrate) flow rate, considering the friction losses and the concentration polarization in a membrane module. Therefore, the feed pressure in a small-scale design differs from that in a big-scale design. In order to calculate the SEC for a realistic large-scale desalination plant, the production flow rate was set to 25 m3/h, which represents a small-desalination plant [19]. The required feed pressure, depends on the properties of the membrane and the properties of the solutions on each side of the membrane and inside the membrane [57]. In this study, the required feed pressure, which should be representative of a realistic plant, was calculated according to the solution–diffusion model [18]. The required feed pressure emerges from the water and salt permeability, which can be identified by small-scale experiments, a literature review, or by the usage of the commercial design software of the membrane manufactures (WAVE Design Software 1.58 by the DOW Chemical Company, Midland, MI, USA [58] and LewaPlus® Design Software 2.1.1 by LANXESS Deutschland GmbH, Cologne, Germany [59,60]). In this study, the water and salt permeability were obtained by small-scale experiments.
The water permeability ( A , Equation (10)) is calculated by the permeate flow rate ( Q D W ), the membrane surface area ( S ) and the net driving pressure [12,18].
A = Q D W S · ( P π )
The net driving pressure results from the pressure difference ( P ) regarding the feed pressure, the permeate pressure and the pressure drop, and the osmotic pressure difference between the feed side and the permeate side of the membrane ( π ).
The salt permeability ( B ; Equation (11)) is modelled as the Fickian diffusion by the specific salt flux ( N S ) and the difference of the average concentrate-side concentration ( β f c ) and the permeate concentration ( β D W ) of the small-scale experiments [12,18].
B = N S ( β f c β D W ) ,
The ideal desalination membrane has a high water permeability paired with a near-zero salt permeability for ions which need to be rejected [61]. Since both water and salt permeability vary with the operating temperature, A T - and B T -coefficients were calculated according to temperatures in Table 2, using the simplified design equations of LANXESS Deutschland GmbH (Köln, Germany) [60,62] and FilmTec™ (DuPont de Nemours, Wilmington, NC, USA) [63]. In order to compare the experimental determined water permeability with the literature, A 25 ° C coefficients were normalised to 25 °C.
The required feed pressure for each desalination scenario was set according to Equation (10). Therefore, a single-module design with 6-elements in series was selected. The number of parallel modules was adapted to the active surface area of the specific membrane modules, the required permeate flow, and the module-scale recovery. The module-scale recovery was set to 60% for NF and BWRO, and 40% for SWRO, according to the design guidelines for the specific membranes [58,59,62,63].
In total, the SEC for pressure-driven membrane desalination depends on the water and salt permeability of the membranes, the water temperature, and the salt concentration in the feedwater. The SEC for pressure-driven membrane desalination ( S E C P D M D , V )   was calculated considering the feed flow ( Q F e e d ) , the feed pressure ( P F e e d ) and the concentrate pressure ( P C o n c e n t r a t e ) , the water recovery, and the efficiency of the feed pump and energy recovery device (Equation (12)).
S E C P D M D , V = Q F e e d ( P F e e d P C o n c e n t r a t e ( 1 γ M o d u l e , w )   η E R D ) η P u m p Q P r o d u c t ,
In actual desalination plants, energy recovery devices are used in order to reduce the SEC by recovering the remaining pressure of the brine into mechanical energy via either turbines or pressure exchangers [14]. Here, the efficiency of the pump ( η P u m p ) and the efficiency of the energy recovery device ( η E R D ) were assumed to be both 80% [64,65].

2.3.2. Experimental Procedure

The small-scale pressure-driven membrane desalination experiments were performed with one single element using three different dense flat sheet membranes with a high NaCl -retention:
  • DOW FILMTEC™ Flat Sheet NF90;
  • Lewabrane® RO B085 HF;
  • DOW FILMTEC™ SW30XLE.
The desalination performance was investigated at the Leibniz Institute of Polymer Research Dresden using an OSMO Inspector 2 (Convergence Industry B.V., Enschede, Netherlands) and a stainless steel membrane holder of SIMA-tec® GmbH, Schwalmtal, Germany (UF10-85). The active membrane area was set to 210 mm × 40 mm. Since the height of the feed channel was set to 1.016 mm by the membrane holder, the same diamond shaped spacer with a height of 40 mil was used for all experiments. All experiments were performed using a constant feed pressure at two different pressure stages, which were adjusted to the recommended permeate flux ranges of the membrane manufacturers [58,59,63]. Since the lowest possible constant feed flow was 65 kg/h, the crossflow velocity was set to 0.44 m/s for all pressure-driven membrane desalination tests.
Before each desalination test, the membranes were wetted and compacted gradually with deionized water until the permeate flux was stable. Since the retention for highly SGW needed to be higher than 95%, NF was not evaluated for desalination of highly SGW. All desalination tests were performed in triplicate.
The permeate flow and the transmembrane pressure were measured online in each test period for 1–2 h. The concentration of single ions, the pH, and the electric conductivity were measured in the feed, concentrate, and permeate sample for each experimental run. The qualitative sample analyses were carried out at the Institute of Urban and Industrial Water Management at the Technische Universität Dresden. The pH and conductivity were measured using a HQ40D portable multi meter from Hach, Düsseldorf, Germany, with a PHC 301 electrode and a CDC 401 electrode. The cations were measured by atomic absorption spectroscopy using a SpectrAA 220FS Varian, Agilent, Palo Alto, CA, USA, according to DIN 38406-3:2002-03 [66] and DIN 38406-13/14:1992-07 [67,68]. The anions were measured by ion chromatography using an ICS 3000 from DIONEX, Sunnyvale, CA, USA, according to DIN EN ISO 10304-1:2009-07 [69], whereby the HCO 3 were determined by the acid capacity using 888 Titrando, Metrohm, Herisau, Switzerland according to DIN 38409-7:2005-12 [70].

2.4. Membrane Capacitive Deionisation

2.4.1. Specific Energy Consumption

The most energy-consuming factor of MCDI is the electric energy needed to generate an electric field between the electrodes. The energy demand of the feed pressure can be neglected, since the feedwater is just flowing by and not pressed through a membrane [34,35,71]. In this study, the specific energy consumption for MCDI ( S E C M C D I , V ; Equation (13)) is calculated by integrating the electrical current ( I e l , a d s ) and the cell voltage ( V c e l l ) over the adsorption time during three complete cycles in steady state. Since the electrical currents were reversed during desorption until the voltage dropped to 0 V, a part of the consumed energy during adsorption was recovered during desorption [32].
S E C M C D I , V =   0 t a d s ( V c e l l , a d s I e l , a d s ) d t a d s t c y c l e ( V c e l l , d e s I e l , d e s ) d t V P ,
The S E C V (Equation (4)) and S E C I o n (Equation (5)) were calculated as for the pressure-driven membrane desalination for a production of 25 m3/h desalinated water using Python 3.7 (Python Software Foundation, Wilmington, DE, USA).
The electrosorption process in CDI can be described by the formation of the electrical double layers within the micropores of the carbon electrodes [72]. In the past, the desalination performance was predicted mainly by the Gouy–Chapman–Stern model [73,74,75], considering the presence of a diffuse layer and an inner dense (Helmholtz/Stern) layer between the diffuse and the electrode surface; by the modified-Donnan model [76,77,78,79], considering the overlapping of the diffuse layer within the micropores and an ion specific chemical attraction term; or by the amphoteric-Donnan model [80], considering fixed basic and acidic chemical charges in the micropores. Including the ion transport, which can be described by the Nernst–Planck equation, these models can be used to predict the energy consumption and the ion rejection [78,79]. In rare studies in which the electrosorption of mixed salt were modelled, the selectivity of specific ions with the same valence was included by an experimentally determined attraction or affinity term [81]. In total, the ion specific adsorption and the interaction between ions are time dependent with regard to the ion specific valence, diffusion coefficient, hydrated radius, the applied electricity, the pH, and the ion concentration [53,82,83,84]. The ion volume exclusion interactions resulting in a preferred adsorption of ions with a smaller hydrated radius, were described by Suss and Guyes et al. [85,86]. However, as currently shown in the study of Tsai et al. [83], the influence of ion exchange membranes can reduce the affinity and thereby the selectivity. According to the knowledge of the authors, a multi-ion transport model does not exist, including the selective interactions in the micropore and the exclusion effects by the ion exchange membranes. Therefore, the rejection and energy consumption for MCDI were calculated in this study by experimental results.

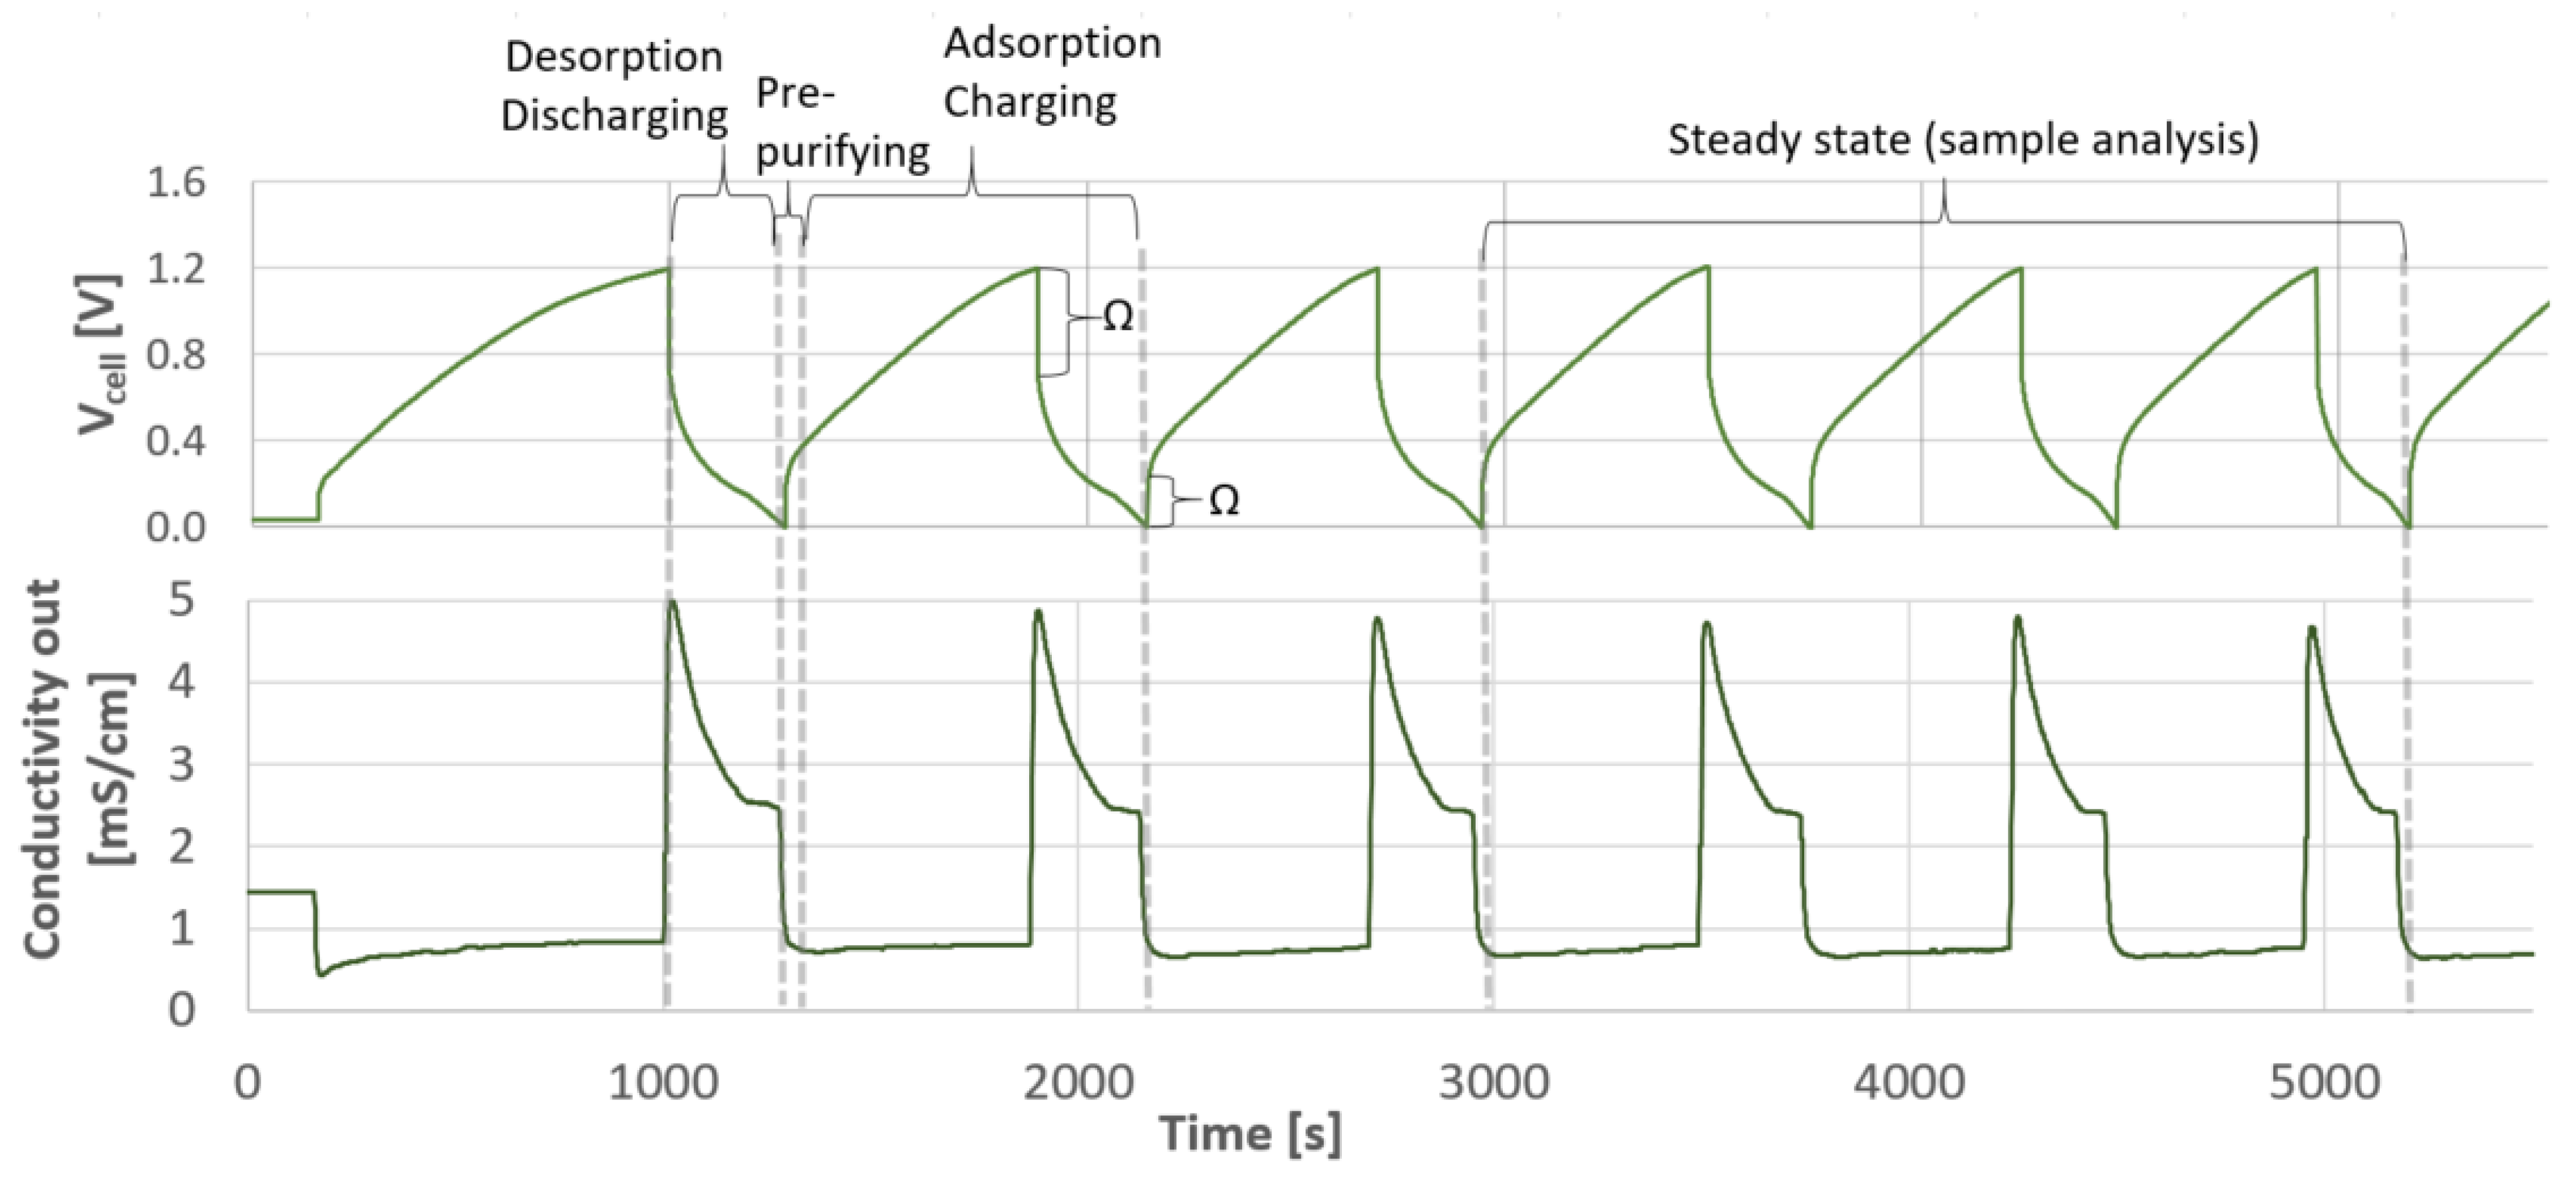
2.4.2. Experimental Procedure

The MCDI small-scale experiments were conducted with a C 03 25 DDRG MCDI module integrated in the CapDi Pilot Unit from 2010 of Voltea B.V., Sassenheim, Netherlands, at the Technische Universität Dresden. The pilot plant was controlled by using the “Demo Unit software” from Voltea B.V. (2010) and Tera Term v. 4.92. The total electrode surface area of the module was 3.7 m2. In this study, we wanted to achieve a constant diluate quality. Therefore, the desalination tests were performed using a constant electrical current [87]. The duration during charging of the electrodes were defined by the adoption time until the maximum voltage was reached. To obtain a low SEC, the electrical current was reversed during the desorption until the cell voltage ( V c e l l ) dropped back to 0 V [32].
The required electrical current ( I e l ) to obtain the wanted ion rejection, was calculated by the Faraday’s constant (F); the aimed average concentration of the diluate ( c D ), and the current efficiency ( η I ) , which was assumed to be approximately 80% (Equation (14)) [31,32,77].
I e l = F · Q F ·   ( c S G W , i c D ) η I ,
According to Equation (14), a higher electrical current was selected in order to achieve the higher required salt retention. However, the MCDI module used in this study is not designed for desalination of highly SGW. Hence, desalination tests were performed only with slightly SGW and moderately SGW. In this study, 10 A, 14 A, 18 A, 22 A and 26 A were applied for desalination of slightly SGW, and 20 A, 40 A, 45 A, 50 A and 55 A for moderately SGW. The feed flow ( Q F ) was constant and set to 1.0 L/min. The maximum voltage ( V c e l l , m a x ) was set at 1.2 V with the exception of runs at 55 A where   V c e l l , m a x was set to 1.6 V since the module-scale water recovery was too low for a V c e l l , m a x of 1.2 V. The variable module-scale water recovery for the MCDI ( γ M C D I ,   M o d u l e ) depends on the electrical current selected, the feed water quality and the feed flow and was calculated by the duration of adsorption and desorption and the pre-purifying duration (Equation (15)).
γ M C D I ,   M o d u l e = t a d s o r p t i o n t p r e p u r i f y i n g   t a d s o r p t i o n + t d e s o r p t i o n ,
where t adsorption is the duration of adsorption and t desorption   is the duration of desorption. The pre-purifying duration ( t pre purifying   )   is the duration which was needed to reach ≥90% of the potential salt rejection to circumvent the contamination of the diluate with salts remaining from the desorption mode.
After three complete adsorption and desorption cycles, the desalination performance was defined to be in steady state. The single ions were analyzed in feed water samples and diluate samples in mixed samples of three complete cycles in steady state. Here, the same analytical methods as for the pressure-driven membrane desalination processes were used. In addition, the conductivity of the inlet and outlet flow of the MCDI module, and the cell voltage were measured online.

3. Results

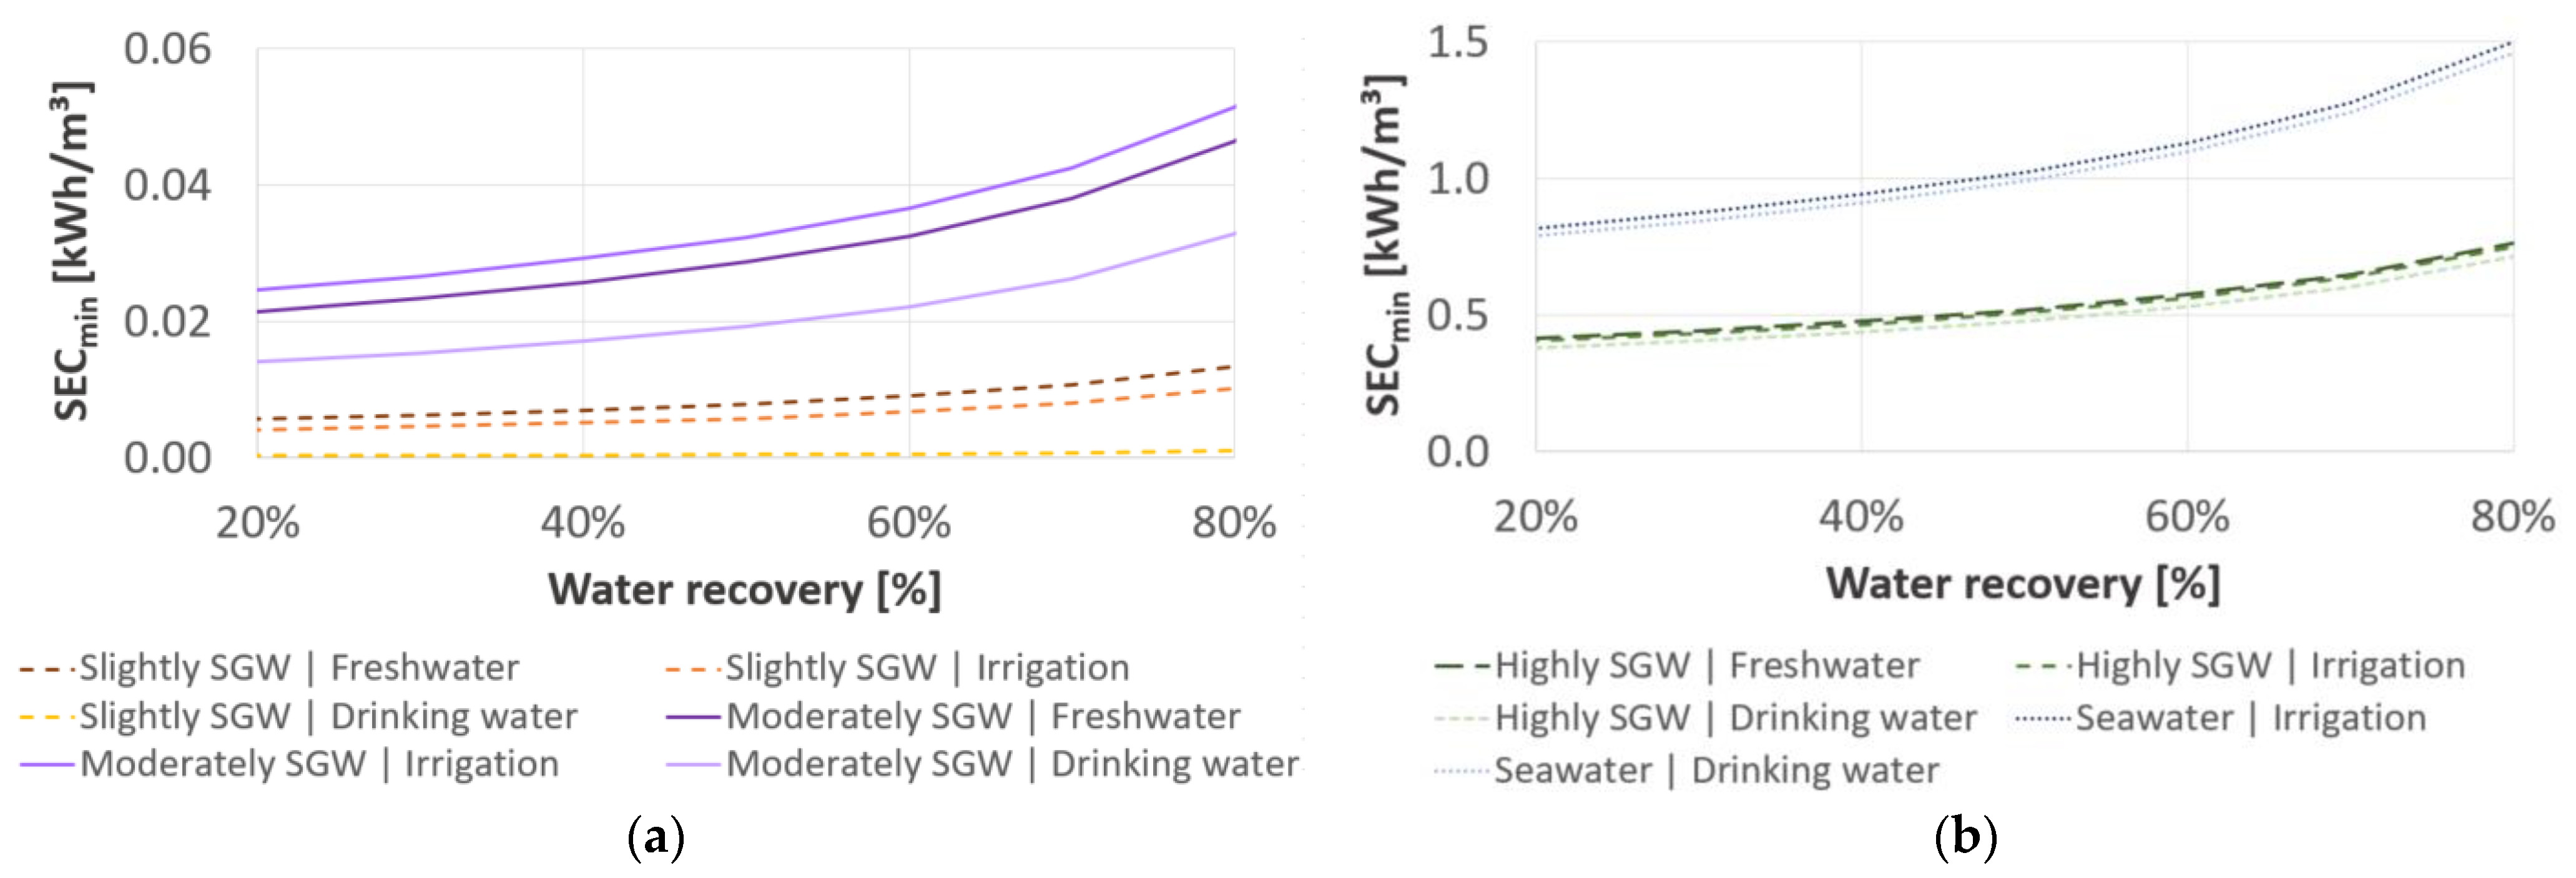
3.1. Minimum Specific Energy Consumption

Independent of desalination technology, the S E C m i n , V rises with an increasing feed concentration, salt rejection and an increasing water recovery (Equation (9)). However, the S E C m i n ,   V varies with the required salt retention according to the target concentration in the partial desalinated water (Table 2). As shown in Figure 2, the S E C m i n ,   V   is 1.1 kWh/m3 for seawater desalination at a water recovery of 60%, whereby the S E C m i n ,   V   is ≤0.01 kWh/m3, ≤0.04 kWh/m3 and ≤0.6 kWh/m3 for slightly SGW, moderately SGW and highly SGW, respectively. Therefore, the S E C m i n ,   V is higher for the target concentrations regarding the local freshwater and irrigation guidelines compared to the target concentrations for drinking water.

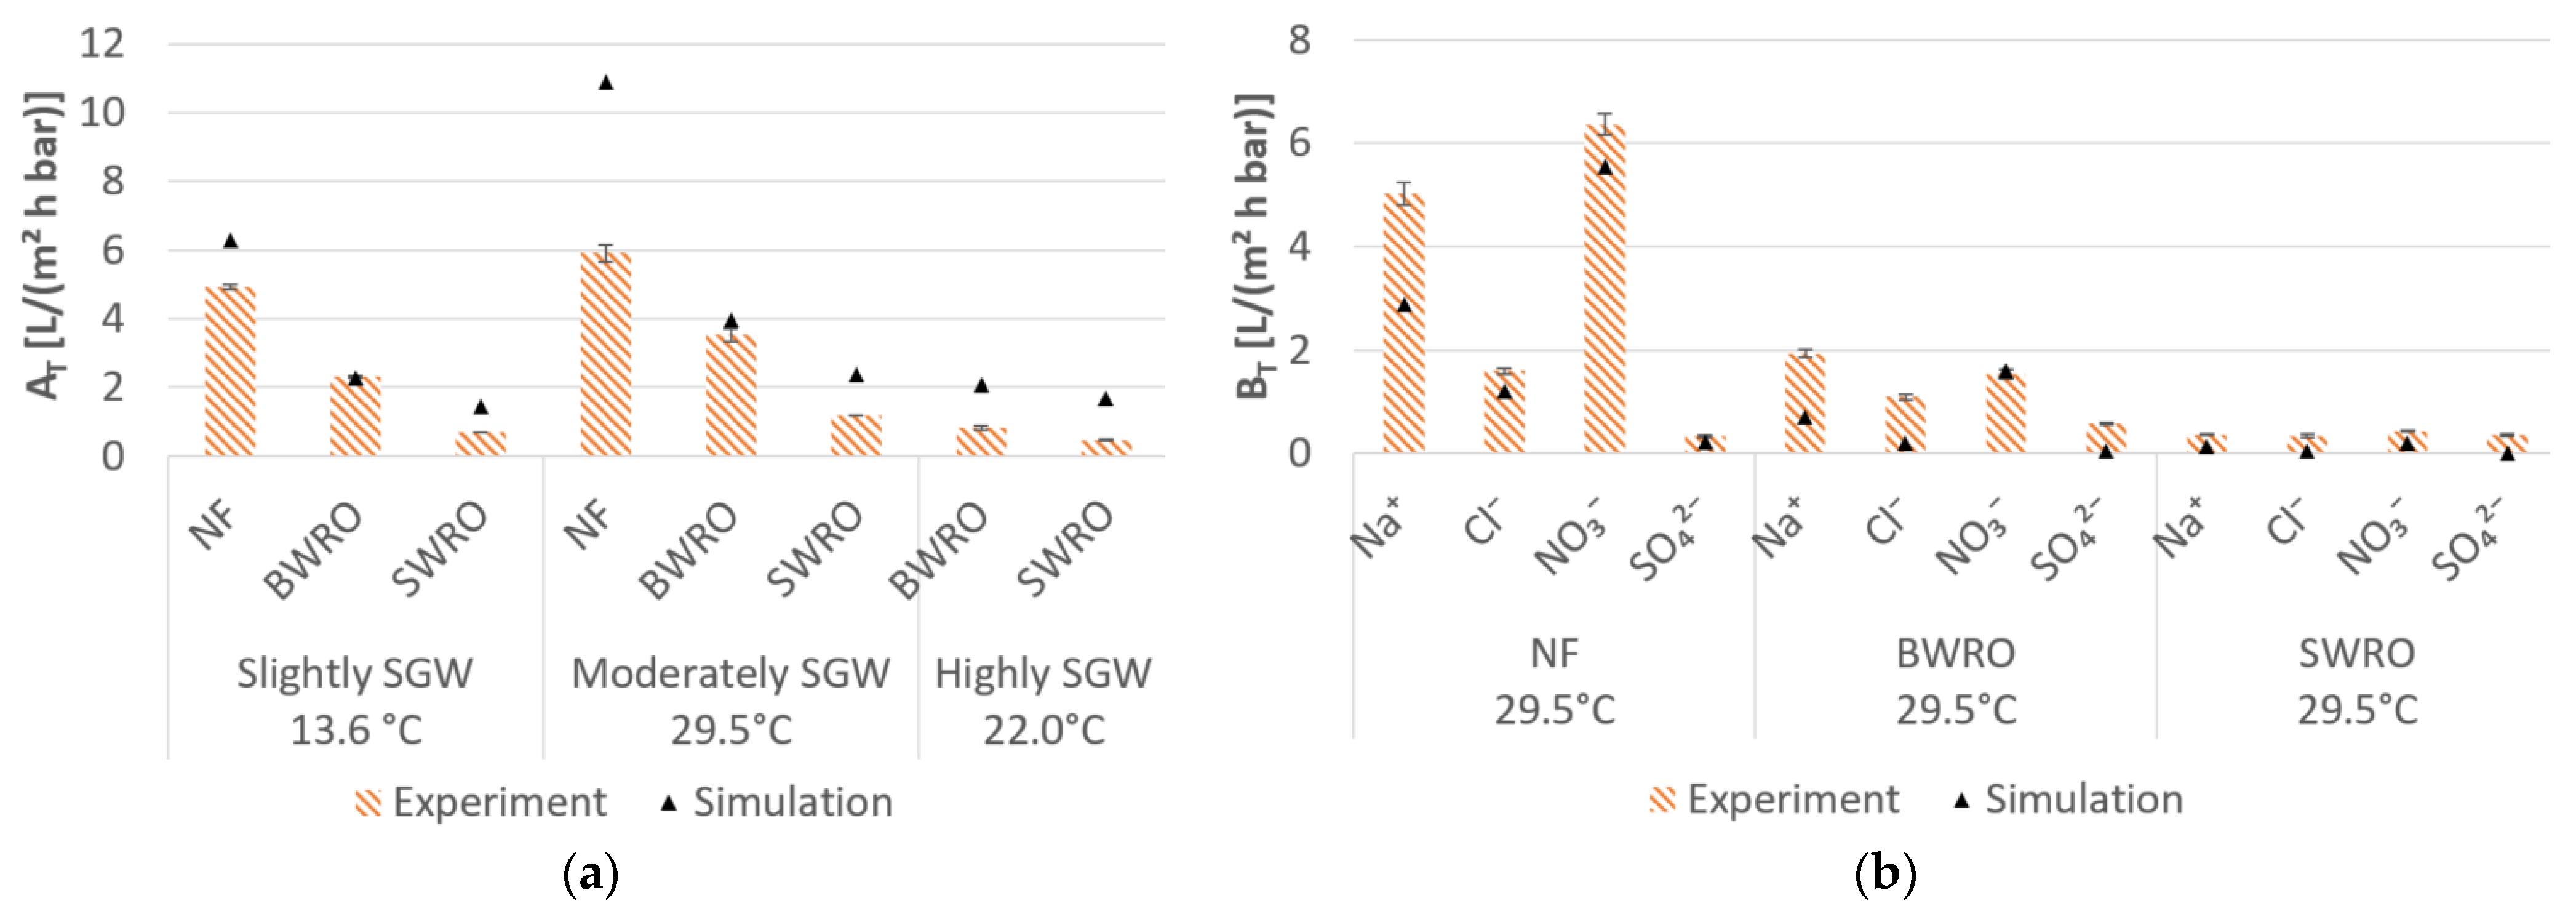
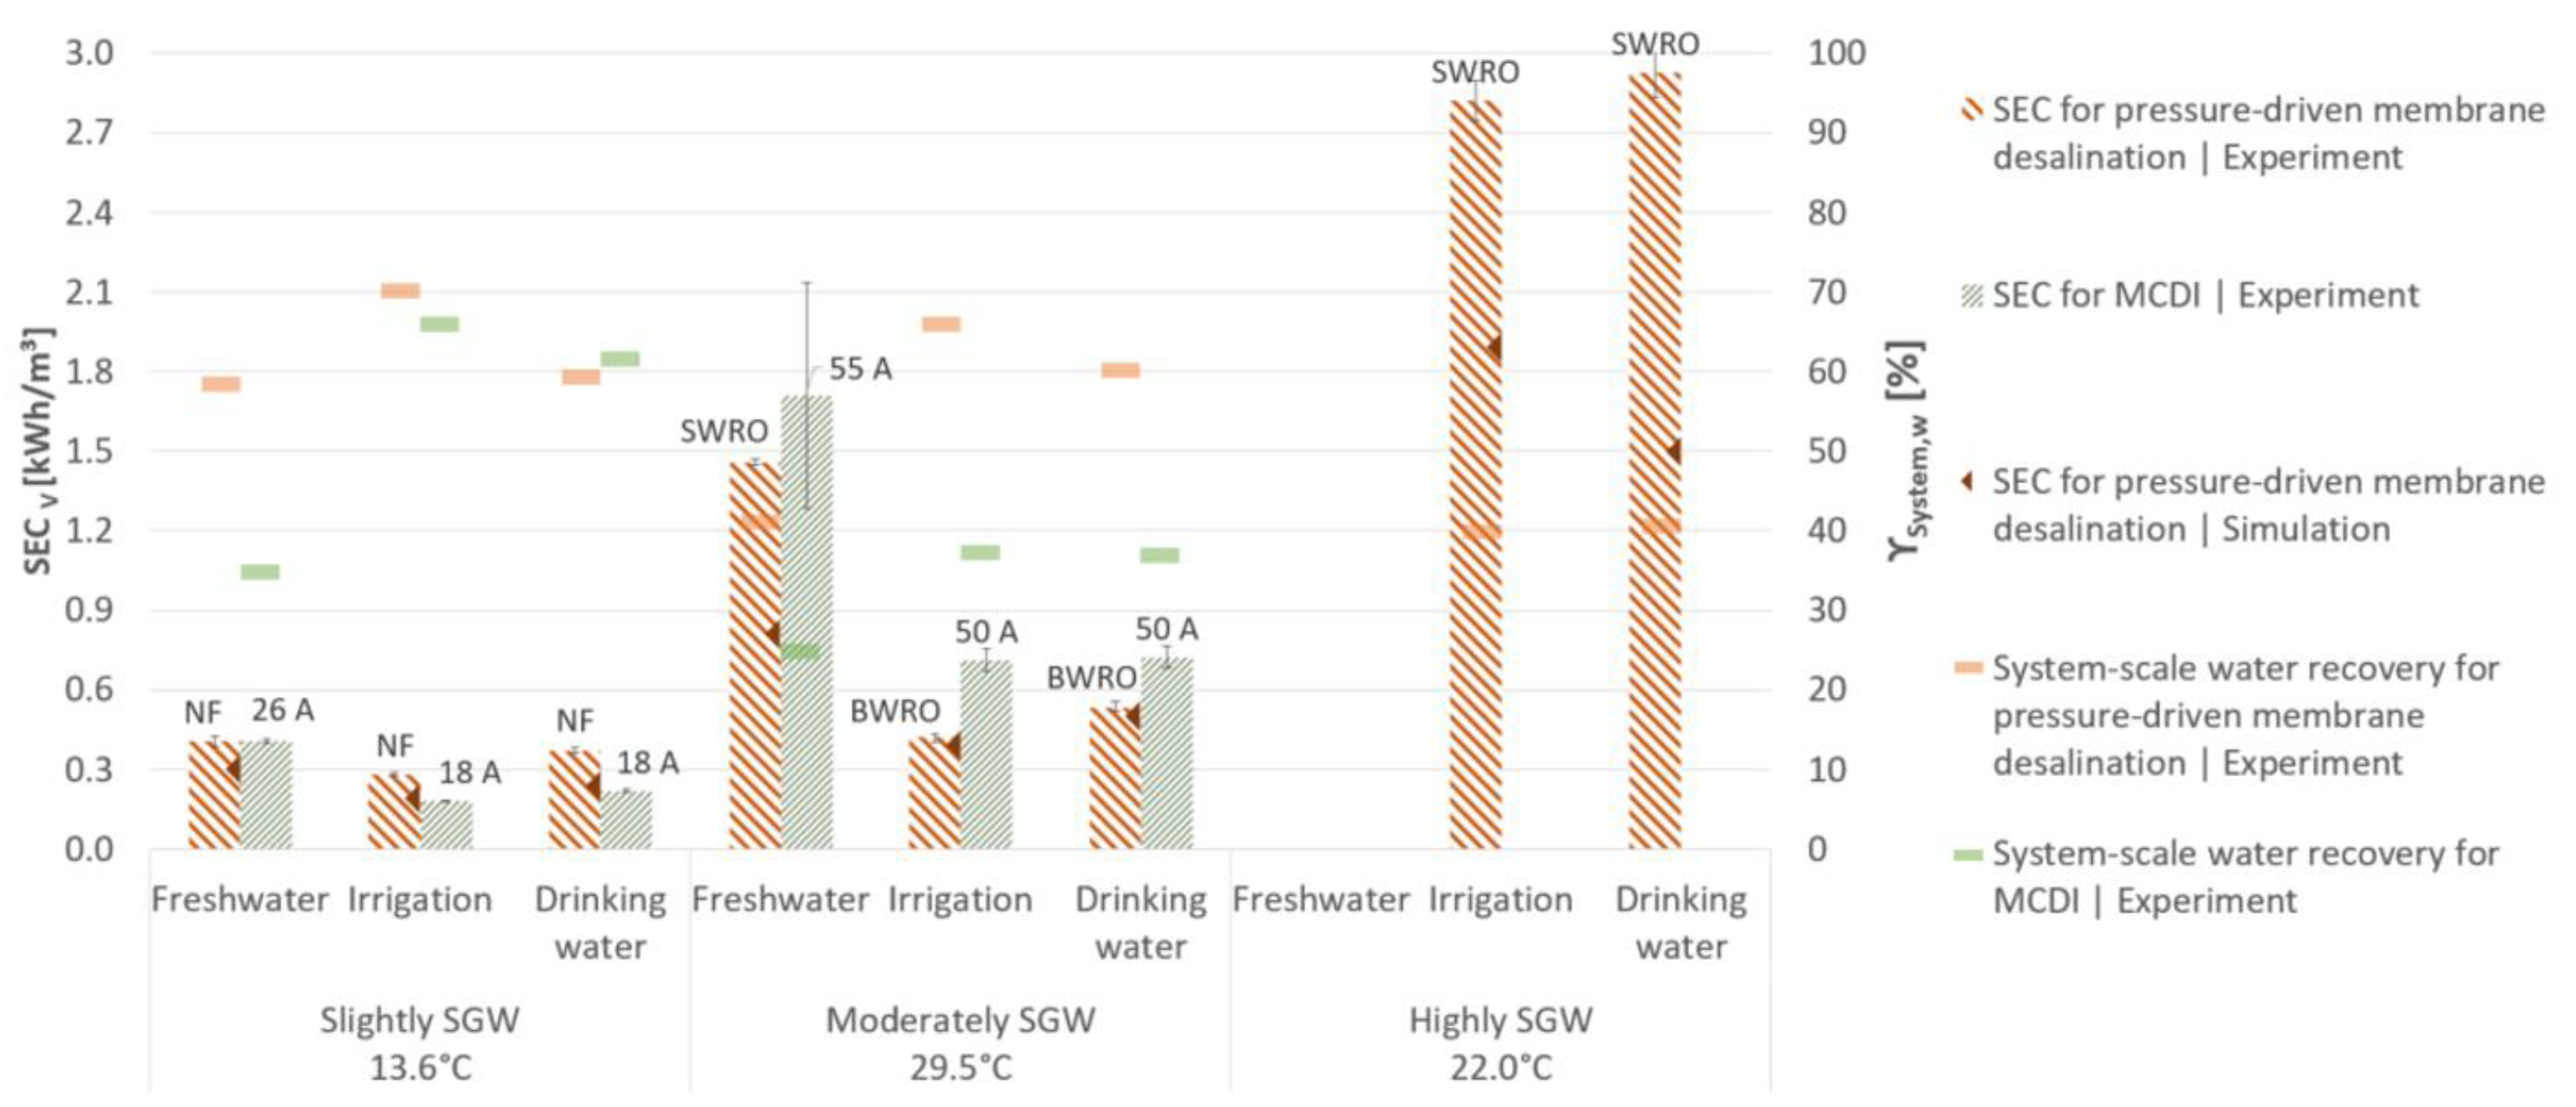
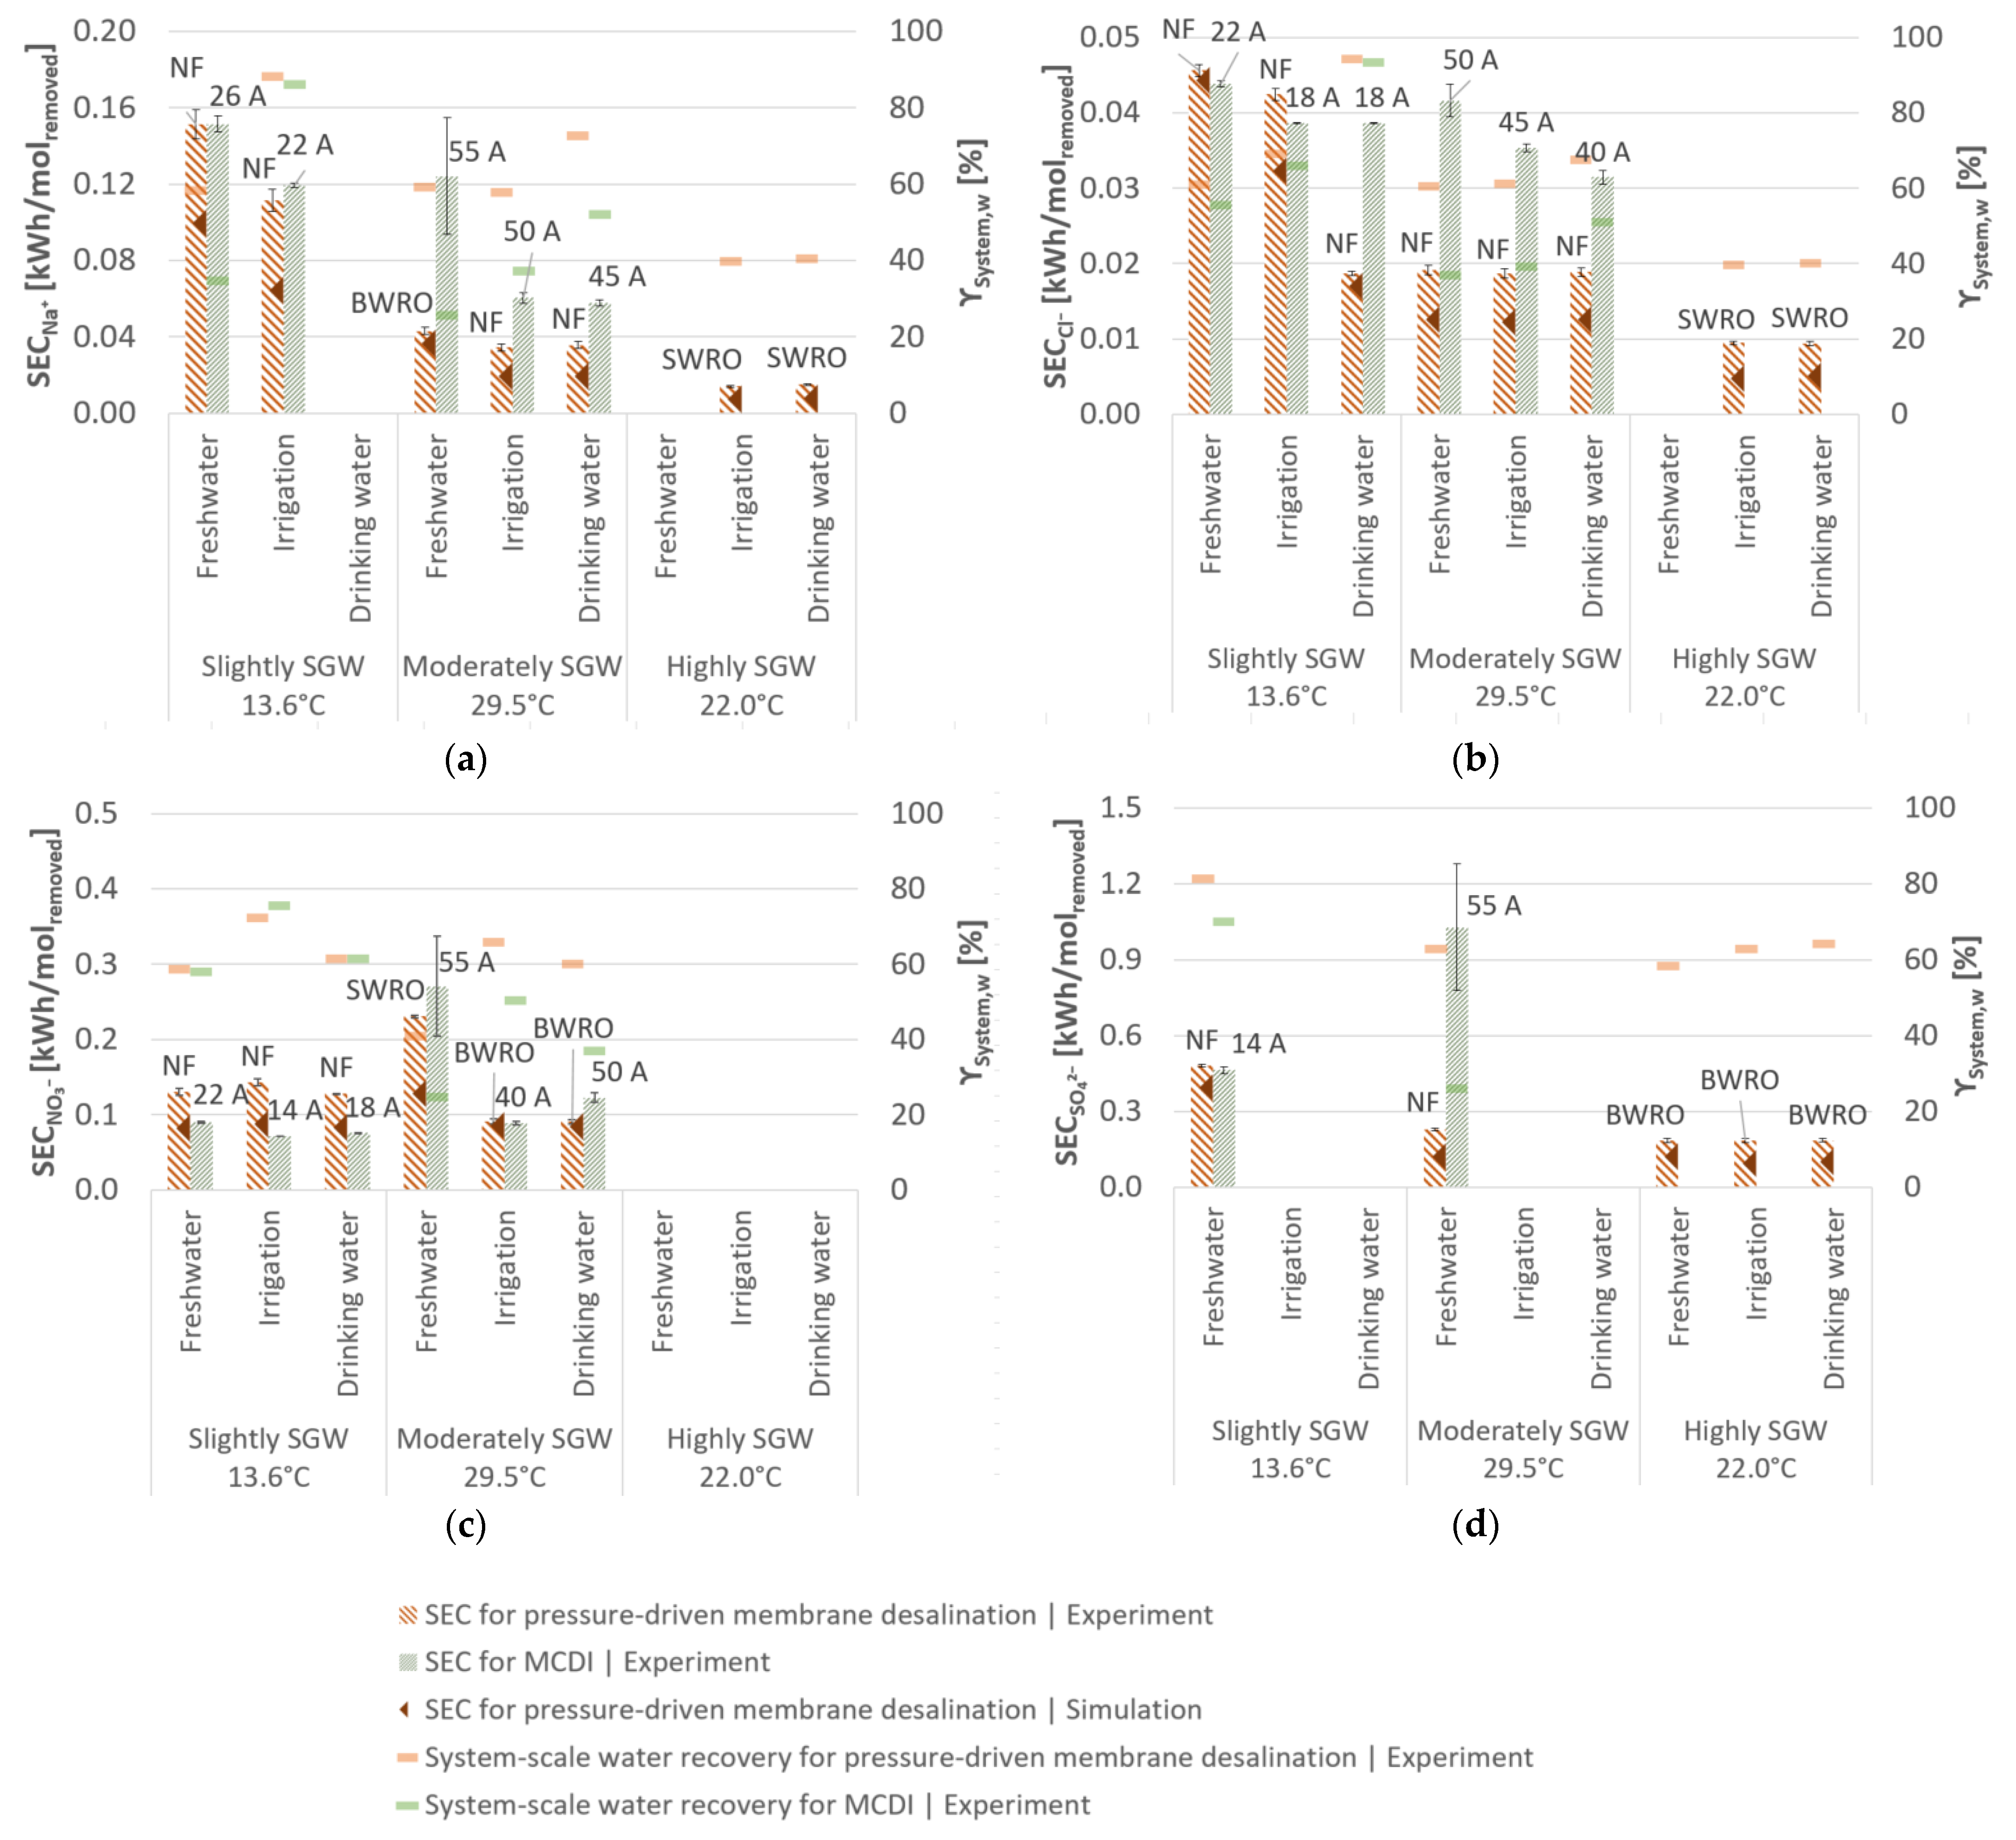
3.2. Desalination Performance of Pressure-Driven Membrane Desalination

Both the water and salt permeability follow the order of NF > BWRO > SWRO (Figure 3). The experimentally determined water permeability varied between 0.46 L/(m2 h bar) and 5.91 L/(m2 h bar) (Figure 3a). The highest water permeability was obtained for desalination of moderately SGW due to a feedwater temperature of 29.5 °C, despite the feedwater concentration in moderately SGW being higher than that in slightly SGW. The highest variances for the water permeability were obtained for NF and SWRO, for desalination of moderately SGW and highly SGW, respectively. The highest salt permeability was observed for Na + and NO 3 (Figure 3b).
The experimental determined normalized water permeability at 25.0 °C follows the order of slightly SGW > moderately SGW > highly SGW (Table 3). In general, the water and salt permeability obtained by the software was higher compared to experimental results (Figure 3, Table 3). With the exception of highly SGW, the experimentally obtained water permeabilities generally corresponds well with the literature (Table 3). Moreover, the feedwater concentration had a higher impact on the water permeability in the experiments compared to the modelled results (Table 3).
The lowest SEC was achieved with a high water permeability, a low salt permeability, and low a required salt rejection (Figure 3, Figure 4 and Figure 5). The modelled SEC was lower than the experimental SEC (Figure 4 and Figure 5) which can be explained by the higher water permeability and lower salt permeability determined by the simulation software (Figure 3). Hence, the average experimentally determined S E C P D M D , V varies depending on the feed salt concentration and target salt concentration. For desalination of slightly SGW with NF, the SEC ranged from 0.3 to 0.4 kWh/m3, whereas this was 0.4 to 1.5 kWh/m3 for desalination of moderately SGW with BWRO or SWRO (Figure 4). For desalination of highly SGW with SWRO, the SEC ranged from 2.8 to 2.9 kWh/m3. The achieved system-scale water recovery in one-stage design ranged between 48–70, 41–66, and 40% for NF, BWRO, and SWRO, respectively.
The highest energy efficiency ( S E C m i n ,   V / S E C V ) was achieved with <18% for highly SGW. The energy efficiency for slightly SGW and moderately SGW was ≤5 and ≤10%, respectively. The normalization of the water and salt permeability to 25 °C would change the S E C P D M D , V for slightly SGW, moderately SGW, and highly SGW by −25, +10 and −7%, respectively.
According to the high permeability for Na + and NO 3 for pressure-driven membrane desalination (Figure 3) and the low required salt rejection for SO 4 2 (Table 2), the highest experimentally determined S E C P D M D , I o n values were achieved for Na + with ≤0.15 kWh/molremoved, for NO 3 with ≤0.23 kWh/molremoved, and for SO 4 2 with ≤0.48 kWh/molremoved (Figure 5). For Cl the S E C P D M D , C l ranged between 0.01–0.05 kWh/molremoved. Since the S E C I o n depends on the required salt rejection, this parameter is not intended for comparing SEC of different desalination scenarios for pressure-driven membrane desalination, but rather for the comparison of the same scenarios for pressure-driven membrane desalination and MCDI. In general, the pH in the permeate was lower (6.1–7.3) than in the feed (8.1–8.3).

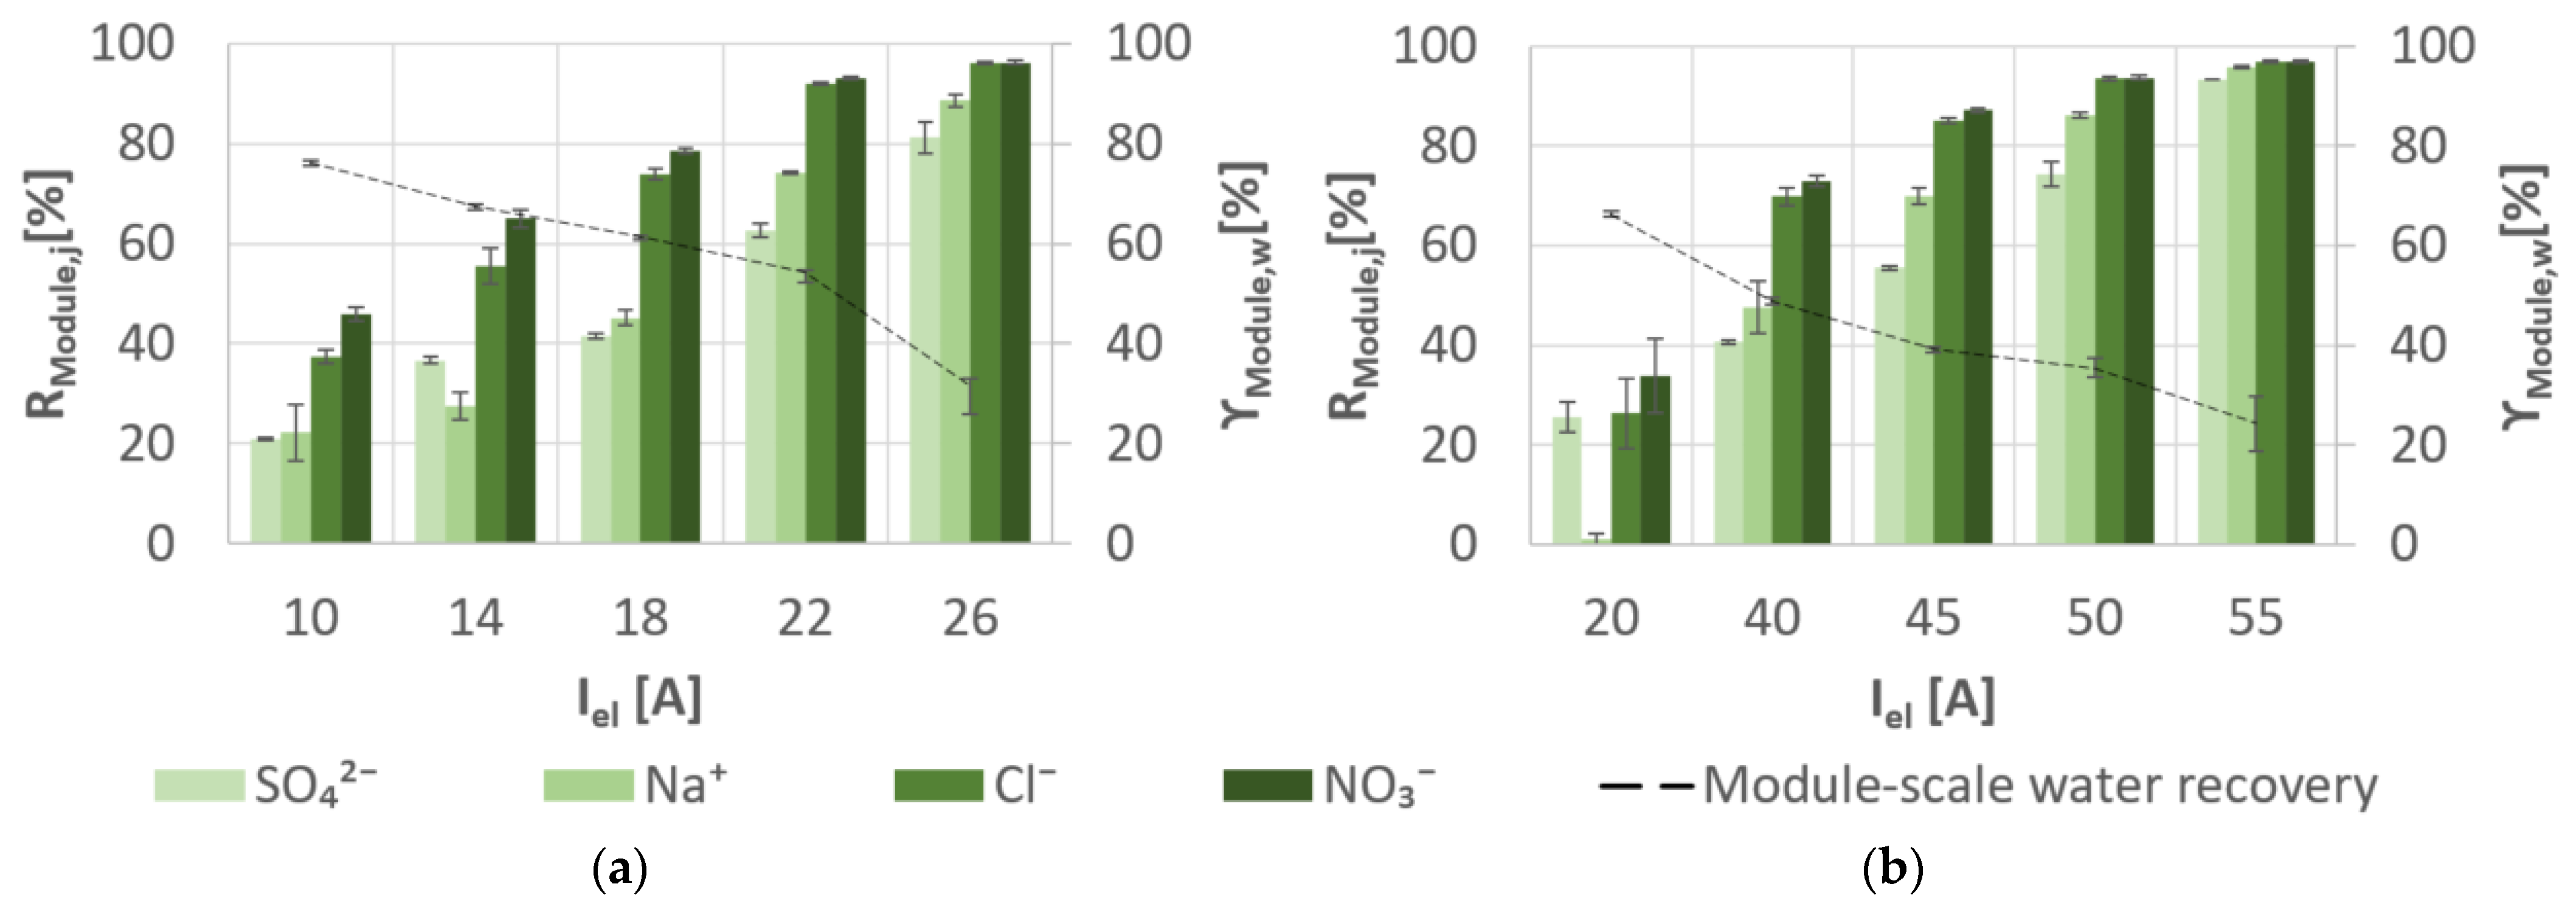
3.3. Desalination Performance of Membrane Capacitive Deionisation

In contrast to pressure-driven membrane desalination, the module-scale water recovery was not a default parameter for MCDI. The water recovery decreases with increasing the applied electrical current (Table 4), due to the decreasing relation of the produced diluate volume to the produced concentrate volume caused by the higher ohmic resistance in the solution (Figure 6) [35,94,95].
The SEC during adsorption—as well as the recovered energy during desorption—increases at higher electrical currents (Table 4). Since the energy recovery increase is lower regarding the simultaneous increase in the required energy demand during adsorption, the total energy demand is greater at higher applied electrical currents (Figure 4). The S E C M C D I , V , the recovered energy, and the module-scale salt rejection are positively correlated with the applied electrical current. The module-scale water recovery is negatively correlated with the applied electrical current. The S E C M C D I , V in Figure 4 varies from 0.2 to 0.4 kWh/m3 at 18–26 A and 0.7 to 1.7 kWh/m3 at 50–55 A, respectively, for slightly SGW and moderately SGW. The high confidence interval for the experiments with 55 A and a maximum voltage of 1.6 V results from the higher variance of adsorbed ions at a higher salt rejection. The achieved system-scale water recovery ranged between 35 and 66% for MCDI desalination of slightly SGW, whereas this was 25 to 37% for moderately SGW (Figure 4). The energy efficiency for slightly SGW and moderately SGW was ≤8 and ≤4%, respectively.
The ion selectivity in Figure 7 follows, in general, the order of NO 3 > Cl > Na + > SO 4 2 . Additionally, the module-scale salt rejection varied between 1–96% and increased with increasing the applied electrical current. The lowest S E C M C D I , I o n values were obtained for NO 3 and Cl with 0.07–0.27 kWh/molremoved and 0.03–0.04 kWh/molremoved, respectively (Figure 5). The S E C M C D I , I o n for Na + and SO 4 2 ranged between 0.06–0.15 kWh/molremoved and 0.46–1.03 kWh/molremoved, respectively. The pH in the diluate was slightly lower (6.6–8.3) than in the feed (7.3–8.7).

4. Discussion

Independent of the method used, the lowest S E C V values were generally achieved for desalination of slightly SGW due to the lower required salt rejection (Figure 2 and Figure 4). Therefore, the experimentally determined S E C V for desalination of slightly SGW was up to 36% lower for MCDI than for pressure-driven membrane desalination, regarding the target concentrations for irrigation and drinking water showing a similar system-scale water recovery. Even though the average S E C I o n for Na + (Figure 5) was marginal higher for MCDI for these desalination scenarios, here, MCDI overall showed a better desalination performance due to the high salt rejection for NO 3 and Cl , even at low applied electrical currents (Figure 7). As a result, MCDI can prove to be an energy efficient desalination technology especially for NO 3 -rich groundwater. However, the ion selectivity of mixed ion solutions within MCDI cannot yet be fully mathematically described. Therefore, more research is needed to understand and intensify these selective effects if necessary.
If a higher salt rejection for desalination of slightly SGW is required to comply with the target concentrations of local freshwater, pressure-driven membrane desalination technologies are more advantageous due to their higher system-scale water recovery, even though MCDI showed a similar S E C V (Figure 4). According to the desalination scenarios of moderately SGW and highly SGW, pressure-driven membrane desalination technologies show a lower S E C V and a higher system-scale water recovery and are therefore more suitable than MCDI. Thereby, the appropriate membrane (NF, BWRO or SWRO) has to be chosen according to the specific salt retention, system design and further boundary conditions of the desalination scenario.
The laboratory tests were examined under ideal conditions. Even though precipitation was not detected in the concentrate during short-term experiments, the solubility limit was exceeded by simulating big-scale pressure-driven membrane desalination. Other substances, which were not examined in this study, such as silica, iron or organic matter, can further enhance the scaling and fouling potential [12,96] and will therefore affect the SEC and water recovery. Hereby, scaling and fouling effects have been thoroughly investigated for pressure-driven membrane desalination and can be minimized by the operation procedure and scaling inhibitors. Since in MCDI the rejection is not driven by pressure, clogging effects are assumed to be lower for MCDI compared to pressure-driven membrane desalination [26]. The influence of scaling and fouling on the desalination performance of MCDI is, however, controversially discussed in the literature. Therefore, more research, including the temperature effect on scaling and fouling in realistic long-term and large-scale experiments, is mandatory in this study field [14]. Since SGW can further contain methane and hydrogen sulphide due to decomposition of organic matter under anoxic or anaerobic conditions [97], the pretreatment needs to be adjusted regarding the specific water composition and the used desalination technology.
The obtained S E C V for MCDI in this study corresponds well with results of Qin et al. [34] and Zhao et al. [35]. The experimental and simulated achieved S E C V by pressure-driven membrane desalination are in accordance with values generally reported in the literature [19,20,21]. Despite the water and salt permeability determined in NF and BWRO desalination experiments differing from simulated results, the experimentally obtained permeability results are still in accordance with the literature (Table 3). In total, the simulated permeability results generally underestimate SEC compared to the experimental results (Figure 4 and Figure 5). The experimental determined water permeability for highly SGW desalination was lower compared to the literature. Deviations in permeability obtained by experiments and simulations might result from different flow characteristics in small-scale experiments, usual production variabilities of the membranes and concentration polarisation. However, the influence of the saline concentration on the water permeability [98] for slightly SGW and moderately SGW desalination experiments could not be determined by the design software and was only visible by the experimental results (Table 3). Consequently, the simulated as well as the experimental determined SEC for pressure-driven membrane desalination should be considered for the performance comparison with MCDI.
In this study, the desalination performance was examined for one-stage configurations to ensure similar conditions for pressure-driven membrane desalination and MCDI. According to Werber et al. [99] and Shrivastava et al. [100], the application of multiple stages or concentrate recirculation can achieve lower SEC values with higher water recoveries. The SEC and the water recovery for MCDI can be increased by reducing the pre-purifying duration and by reducing—or even stopping—the flow during the desorption mode [37,101]. However, a higher water recovery results in a higher scaling potential and higher concentrations in the rejected brine, which might not comply with corresponding guidelines for surface water discharge [102].
Overall, the experimental and simulated results in this study showed higher S E C V (Figure 4) than S E C m i n , V values (Figure 2) due to irreversible energy losses. Therefore, the energy efficiency for pressure-driven membrane desalination increased with higher salt rejection (slightly SGW < moderately SGW < highly SGW) due to lower S E C I o n for these desalination scenarios. In contrast, the energy efficiency decreased for MCDI with higher salt rejections. Typical losses for pressure-driven membrane desalination are defined by inefficiencies of feed pump and energy recovery devices (ERD), the membrane and module performance, and losses caused by the system design [15,100]. According to Werber et al. [61] future research should be focused on a higher salt selectivity for pressure-driven membrane desalination. Conversely, typical losses for MCDI include the ionic resistive and electric resistive losses as well as the parasitic losses from Faradaic charge-transfer reactions [103]. In order to operate the MCDI close to the thermodynamic limit, further research is needed to reduce the resistive and parasitic energy losses caused by an increase in the specific salt rejection [33,103,104].
For pressure-driven membrane desalination as well, as for MCDI, the feedwater temperature is an important factor influencing the energy efficiency, the SEC, and the water recovery. In this study, the desalination performance was evaluated for the specific temperature of the respective SGW. The S E C V for pressure-driven membrane desalination decreases with a rising feedwater temperature due to the higher impact of the increasing water permeability compared to the increasing salt permeability. Since the resistance of an aquareous solution decreases with its temperature, the SEC should decrease, as is the case for electrodialysis [105]. However, according to the experimental CDI study by Mossad and Zou [106], the salt rejection was inversely related to the feedwater temperature probably due to a lower adsorption capacity, the tendency of metal ions to escape from the electrode surface or hydrophobic to hydrophilic transitions on the surface of the activated carbon. In total, a higher feedwater temperature would result in higher SEC for MCDI and lower SEC for pressure-driven membrane desalination.
The module-scale water recovery and the module-scale salt rejection of NF, BWRO, and SWRO were linked to narrow operation guidelines of the module specifications for the flow rate of the feed, permeate, and concentrate. The total flow rates therefore depend on the specific design of the membrane elements. The adjustment of the flow rate for MCDI was, however, flexibly adjustable according to the required salt rejection and the applied electrical current. Therefore, MCDI shows great potential for meeting flexible desalination demands in terms of salt rejection and water recovery [26]. Due to the flexibility by easily adapting the flow or the electric energy demand, MCDI is as electrodialysis compatible with the unstable and oscillating energy supply associated with renewable energy resources, such as photovoltaic or wind energy [23].
This study analysed the SEC for pressure-driven membrane desalination technologies and MCDI to compare the desalination performance for mixed salt solutions. In order to compare the total costs, further cost parameters, such as the capital costs, the required area for the desalination plant, and the adapted pre- and posttreatment costs need to be considered as well. Moreover, both desalination technologies—pressure-driven membrane desalination and MCDI—can benefit from each other in hybrid processes (Figure 8). Due to the adjustable selectivity effects of MCDI, this technique could be used in hybrid configurations as a pretreatment or second-permeate stage to increase the energy efficiency of pressure-driven membrane desalination technologies [107,108].

5. Conclusions

In this study, the desalination performance was examined for three different realistic SGW concentrations using NF, BWRO, SWRO, and MCDI. Our experimental results indicate that pressure-driven membrane desalination and MCDI show—depending on the operation procedure—different selectivity towards Na + , Cl , NO 3 , and SO 4 2 . The desalination performance of the specific desalination technology should, therefore, not only be evaluated for different feed concentrations, but also for mixed ion concentrations regarding different target concentrations.
The lowest SEC values for a low level of required salt rejection, such as for slightly SGW (TDS = 1 g/L), were achieved with MCDI and NF. Thereby, the lowest SEC values were obtained with MCDI for slightly SGW with regard to the guideline concentrations for irrigation and drinking water. However, if a higher salt rejection is required, as for the target concentration for local freshwater, NF demonstrated a better desalination performance than MCDI, due to a higher water recovery. Pressure-driven membrane desalination—such as BWRO and SWRO—demonstrated, independent of the target concentrations under the respective boundary conditions, a better desalination performance for TDS concentrations ≥2 g/L.
Even though the experiments of this study confirm that pressure-driven membrane desalination technologies show a higher energy efficiency regarding higher saline concentrations, we showed that MCDI is particularly suitable for desalination of NO 3 -rich groundwater, as well as for flexible boundary conditions. However, more research is needed to evaluate the impact of mixed ion solutions in long-term MCDI studies.

Author Contributions

Conceptualization, H.R.; data curation, H.R.; formal analysis, H.R.; methodology, H.R.; supervision, M.W. and A.L.; writing—original draft, H.R.; writing—review and editing, H.R., M.W. and A.L. All authors have read and agreed to the published version of the manuscript.

Funding

This research was funded by a European Social Fund (ESF-doctoral scholarship) from the free-state of Saxony, Germany. Further, we acknowledge support by the Open Access Publication Funds of the SLUB/Technische Universität Dresden.

Institutional Review Board Statement

Not applicable.

Informed Consent Statement

Not applicable.

Data Availability Statement

The data presented in this study are available on request from the corresponding author.

Acknowledgments

The authors thank Jochen Meier-Haack, head of the working group Polymeric Membrane Materials at the Leibniz Institute of Polymer Research Dresden, for the material support for membrane-driven experiments. We thank Fabian Fröhlich who performed the experimental retries within his master thesis. We would also like to thank LANXESS Deutschland GmbH for providing membrane material of Lewabrane® RO B085 HF 4040. Further thanks goes to Laila Soeberg for her proofreading.

Conflicts of Interest

The authors declare no conflict of interest. The funders had no role in the design of the study; in the collection, analyses, or interpretation of data; in the writing of the manuscript, or in the decision to publish the results.

References

  1. UNESCO. UN-Water United Nations World Water Development Report 2020: Water and Climate Change; UNESCO: Paris, France, 2020; ISBN 978-92-3-100371-4. [Google Scholar]
  2. Jiménez Cisneros, B.E.; Oki, T.; Arnell, N.W.; Benito, G.; Cogley, J.G.; Döll, P.; Jiang, T.; Mwakalila, S.S. Freshwater resources. In Climate Change 2014: Impacts, Adaptation, and Vulnerability. Part A: Global and Sectoral Aspects. Contribution of Working Group II to the Fifth Assessment Report of the Intergovernmental Panel on Climate Change; Field, C.B., Barros, V.R., Dokken, D.J., Mach, K.J., Mastrandrea, M.D., Bilir, T.E., Chatterjee, M., Ebi, K.L., Estrada, Y.O., Genova, R.C., et al., Eds.; Cambridge University Press: Cambridge, UK; New York, NY, USA, 2014; pp. 229–269. ISBN 978-1-107-05807-1. [Google Scholar]
  3. Rodell, M.; Famiglietti, J.S.; Wiese, D.N.; Reager, J.T.; Beaudoing, H.K.; Landerer, F.W.; Lo, M.-H. Emerging trends in global freshwater availability. Nat. Cell Biol. 2018, 557, 651–659. [Google Scholar] [CrossRef]
  4. Mekonnen, M.M.; Hoekstra, A.Y. Four billion people facing severe water scarcity. Sci. Adv. 2016, 2, e1500323. [Google Scholar] [CrossRef] [Green Version]
  5. Vengosh, A. Salinization and Saline Environments. In Treatise on Geochemistry; Elsevier BV: Amsterdam, The Netherlands, 2003; pp. 1–35. [Google Scholar]
  6. Werner, A.D.; Bakker, M.; Post, V.E.; Vandenbohede, A.; Lu, C.; Ataie-Ashtiani, B.; Simmons, C.T.; Barry, D. Seawater intrusion processes, investigation and management: Recent advances and future challenges. Adv. Water Resour. 2013, 51, 3–26. [Google Scholar] [CrossRef]
  7. Klassen, J.; Allen, D. Assessing the risk of saltwater intrusion in coastal aquifers. J. Hydrol. 2017, 551, 730–745. [Google Scholar] [CrossRef]
  8. Jones, B.F.; Vengosh, A.; Rosenthal, E.; Yechieli, Y. Geochemical Investigations. In Seawater Intrusion in Coastal Aquifers — Concepts, Methods and Practices; Bear, J., Cheng, A.H.-D., Sorek, S., Ouazar, D., Herrera, I., Eds.; Theory and Applications of Transport in Porous Media; Springer Netherlands: Dordrecht, The Netherlands, 1999; pp. 51–71. ISBN 978-94-017-2969-7. [Google Scholar]
  9. Alfarrah, N.; Walraevens, K. Groundwater Overexploitation and Seawater Intrusion in Coastal Areas of Arid and Semi-Arid Regions. Water 2018, 10, 143. [Google Scholar] [CrossRef] [Green Version]
  10. Rhoades, J.D.; Kandiah, A.; Mashali, A.M. The Use of Saline Waters for Crop Production; FAO Irrigation and Drainage Paper: Rome, Italy, 1992; ISBN 978-92-5-103237-4. [Google Scholar]
  11. Konikow, L.F.; Reilly, T.E. Seawater Intrusion in the United States. In Seawater Intrusion in Coastal Aquifers—Concepts, Methods and Practices; Theory and Applications of Transport in Porous Media; Bear, J., Cheng, A.H.-D., Sorek, S., Ouazar, D., Herrera, I., Eds.; Springer: Dordrecht, The Netherlands, 1999; pp. 463–506. ISBN 978-94-017-2969-7. [Google Scholar]
  12. Greenlee, L.F.; Lawler, D.F.; Freeman, B.D.; Marrot, B.; Moulin, P. Reverse osmosis desalination: Water sources, technology, and today’s challenges. Water Res. 2009, 43, 2317–2348. [Google Scholar] [CrossRef] [PubMed]
  13. Ayers, R.S.; Westcot, D.W. Water Quality for Agriculture; FAO Irrigation and Drainage Paper; Food and Agriculture Organization of the United Nations: Rome, Italy, 1985; ISBN 978-92-5-102263-4. [Google Scholar]
  14. Pan, S.-Y.; Haddad, A.Z.; Kumar, A.; Wang, S.-W. Brackish water desalination using reverse osmosis and capacitive deionization at the water-energy nexus. Water Res. 2020, 183, 116064. [Google Scholar] [CrossRef] [PubMed]
  15. Elimelech, M.; Phillip, W.A. The Future of Seawater Desalination: Energy, Technology, and the Environment. Science 2011, 333, 712–717. [Google Scholar] [CrossRef]
  16. Bazargan, A.; Salgado, B. Fundamentals of Desalination Technology. In A Multidisciplinary Introduction to Desalination; Bazargan, A., Ed.; IWA Publishing: London, UK, 2018; pp. 41–92. ISBN 978-1-78040-915-3. [Google Scholar]
  17. Qasim, M.; Badrelzaman, M.; Darwish, N.N.; Darwish, N.A.; Hilal, N. Reverse osmosis desalination: A state-of-the-art review. Desalination 2019, 459, 59–104. [Google Scholar] [CrossRef] [Green Version]
  18. Baker, R.W. Membrane Technology and Applications; John Wiley and Sons Inc.: Hoboken, NJ, USA, 2012; ISBN 9780470743720. [Google Scholar]
  19. Voutchkov, N. Desalination Project Cost Estimating and Management; Taylor & Francis: Boca Raton, FL, USA, 2018; ISBN 978-0-8153-7414-5. [Google Scholar]
  20. Dach, H. Comparison of Nanofiltration and Reverse Osmosis Processes for a Selective Desalination of Brackish Water Feeds. Ph.D. Thesis (Engineering Sciences), Université d’Angers, Angers, France, 2008. [Google Scholar]
  21. Schäfer, A.I.; Richards, B.S. Testing of a hybrid membrane system for groundwater desalination in an Australian national park. Desalination 2005, 183, 55–62. [Google Scholar] [CrossRef]
  22. Strathmann, H. Electrodialysis, a mature technology with a multitude of new applications. Desalination 2010, 264, 268–288. [Google Scholar] [CrossRef]
  23. Campione, A.; Gurreri, L.; Ciofalo, M.; Micale, G.; Tamburini, A.; Cipollina, A. Electrodialysis for water desalination: A critical assessment of recent developments on process fundamentals, models and applications. Desalination 2018, 434, 121–160. [Google Scholar] [CrossRef]
  24. Porada, S.; Zhao, R.; Van Der Wal, A.; Presser, V.; Biesheuvel, P. Review on the science and technology of water desalination by capacitive deionization. Prog. Mater. Sci. 2013, 58, 1388–1442. [Google Scholar] [CrossRef] [Green Version]
  25. Suss, M.E.; Porada, S.; Sun, X.; Biesheuvel, P.M.; Yoon, J.; Presser, V. Water desalination via capacitive deionization: What is it and what can we expect from it? Energy Environ. Sci. 2015, 8, 2296–2319. [Google Scholar] [CrossRef] [Green Version]
  26. Folaranmi, G.; Bechelany, M.; Sistat, P.; Cretin, M.; Zaviska, F. Towards Electrochemical Water Desalination Techniques: A Review on Capacitive Deionization, Membrane Capacitive Deionization and Flow Capacitive Deionization. Membranes 2020, 10, 96. [Google Scholar] [CrossRef] [PubMed]
  27. Honarparvar, S.; Zhang, X.; Chen, T.; Na, C.; Reible, D. Modeling technologies for desalination of brackish water—Toward a sustainable water supply. Curr. Opin. Chem. Eng. 2019, 26, 104–111. [Google Scholar] [CrossRef]
  28. Sillanpää, M.E.T.; Shestakova, M. Electrochemical Water Treatment Methods: Fundamentals, Methods and Full Scale Applications; Butterworth-Heinemann, an imprint of Elsevier: Oxford, UK, 2017; ISBN 978-0-12-811462-9. [Google Scholar]
  29. Welgemoed, T.; Schutte, C. Capacitive Deionization Technology™: An alternative desalination solution. Desalination 2005, 183, 327–340. [Google Scholar] [CrossRef]
  30. Oren, Y. Capacitive deionization (CDI) for desalination and water treatment—Past, present and future (a review). Desalination 2008, 228, 10–29. [Google Scholar] [CrossRef]
  31. Biesheuvel, P.M.; Van Der Wal, A. Membrane capacitive deionization. J. Membr. Sci. 2010, 346, 256–262. [Google Scholar] [CrossRef]
  32. Zhao, R.; Biesheuvel, P.M.; Van Der Wal, A. Energy consumption and constant current operation in membrane capacitive deionization. Energy Environ. Sci. 2012, 5, 9520–9527. [Google Scholar] [CrossRef] [Green Version]
  33. Hassanvand, A.; Wei, K.; Talebi, S.; Chen, G.Q.; Kentish, S.E. The Role of Ion Exchange Membranes in Membrane Capacitive Deionisation. Membranes 2017, 7, 54. [Google Scholar] [CrossRef] [Green Version]
  34. Qin, M.; Deshmukh, A.; Epsztein, R.; Patel, S.K.; Owoseni, O.M.; Walker, W.S.; Elimelech, M. Comparison of energy consumption in desalination by capacitive deionization and reverse osmosis. Desalination 2019, 455, 100–114. [Google Scholar] [CrossRef]
  35. Zhao, R.; Porada, S.; Biesheuvel, P.; Van Der Wal, A. Energy consumption in membrane capacitive deionization for different water recoveries and flow rates, and comparison with reverse osmosis. Desalination 2013, 330, 35–41. [Google Scholar] [CrossRef]
  36. Patel, S.K.; Qin, M.; Walker, W.S.; Elimelech, M. Energy Efficiency of Electro-Driven Brackish Water Desalination: Electrodialysis Significantly Outperforms Membrane Capacitive Deionization. Environ. Sci. Technol. 2020, 54, 3663–3677. [Google Scholar] [CrossRef] [PubMed] [Green Version]
  37. Porada, S.; Zhang, L.; Dykstra, J.E. Energy consumption in membrane capacitive deionization and comparison with reverse osmosis. Desalination 2020, 488, 114383. [Google Scholar] [CrossRef]
  38. Tomaszkiewicz, M.; Najm, M.A.; El-Fadel, M. Development of a groundwater quality index for seawater intrusion in coastal aquifers. Environ. Model. Softw. 2014, 57, 13–26. [Google Scholar] [CrossRef]
  39. Appelo, C.A.J.; Postma, D. Geochemistry, Groundwater and Pollution, 2nd ed.; CRC Press, Taylor & Francis Group: Boca Raton, FL, USA; London, UK; New York, NY, USA, 2005; ISBN 978-0-415-36421-8. [Google Scholar]
  40. Abd-Elhamid, H.F.; Javadi, A.A. A Cost-Effective Method to Control Seawater Intrusion in Coastal Aquifers. Water Resour. Manag. 2011, 25, 2755–2780. [Google Scholar] [CrossRef]
  41. Ebeling, P.; Händel, F.; Walther, M. Potential of mixed hydraulic barriers to remediate seawater intrusion. Sci. Total. Environ. 2019, 693, 133478. [Google Scholar] [CrossRef] [PubMed]
  42. Van Der Bruggen, B.; Milis, R.; Vandecasteele, C.; Bielen, P.; Van San, E.; Huysman, K. Electrodialysis and nanofiltration of surface water for subsequent use as infiltration water. Water Res. 2003, 37, 3867–3874. [Google Scholar] [CrossRef]
  43. World Health Organization. Guidelines for Drinking-Water Quality, 4th ed.; World Health Organization: Geneva, Switzerland, 2017; ISBN 978-92-4-154995-0. [Google Scholar]
  44. German Drinking Water Ordinance: Verordnung über die Qualität von Wasser für den menschlichen Gebrauch (Trinkwasserverordnung—TrinkwV 2001), Trinkwasserverordnung in der Fassung der Bekanntmachung vom 10. März 2016 (BGBl. I S. 459), die zuletzt durch Artikel 99 der Verordnung vom 19. Juni 2020 (BGBl. I S. 1328) geändert worden ist. 2020.
  45. Millero, F.J.; Feistel, R.; Wright, D.G.; McDougall, T.J. The composition of Standard Seawater and the definition of the Reference-Composition Salinity Scale. Deep. Sea Res. Part I Oceanogr. Res. Pap. 2008, 55, 50–72. [Google Scholar] [CrossRef]
  46. Pilson, M.E.Q. An Introduction to the Chemistry of the Sea; Cambridge University Press (CUP): Cambridge, UK, 2012. [Google Scholar]
  47. Han, D.; Post, V.E.; Song, X. Groundwater salinization processes and reversibility of seawater intrusion in coastal carbonate aquifers. J. Hydrol. 2015, 531, 1067–1080. [Google Scholar] [CrossRef]
  48. Askri, B.; Ahmed, A.T.; Al-Shanfari, R.A.; Bouhlila, R.; Al-Farisi, K.B.K. Isotopic and geochemical identifications of groundwater salinisation processes in Salalah coastal plain, Sultanate of Oman. Geochemistry 2016, 76, 243–255. [Google Scholar] [CrossRef]
  49. Askri, B.; Al-Shanfari, R.A. Assessment of Hydro-chemical Processes Inducing the Groundwater Salinisation in Coastal Regions: Case Study of the Salalah Plain, Sultanate of Oman. In The Economics of Water; Springer Nature: Berlin/Heidelberg, Germany, 2017; pp. 351–368. [Google Scholar]
  50. Elewa, H.H.; Shohaib, R.E.; Qaddah, A.A.; Nousir, A.M. Determining groundwater protection zones for the Quaternary aquifer of northeastern Nile Delta using GIS-based vulnerability mapping. Environ. Earth Sci. 2012, 68, 313–331. [Google Scholar] [CrossRef]
  51. Salalah Climate: Average Temperature, Weather by Month, Salalah Water Temperature—Climate-Data.Org. Available online: https://en.climate-data.org/asien/oman/dhofar/salala-2087/#climate-table (accessed on 19 October 2018).
  52. Port Said Climate: Average Temperature, Weather by Month, Port Said Water Temperature—Climate-Data.Org. Available online: https://en.climate-data.org/africa/egypt/port-said-governorate/port-said-504/#climate-table (accessed on 19 October 2018).
  53. Zhao, R.; Van Soestbergen, M.; Rijnaarts, H.H.M.; Van Der Wal, A.; Bazant, M.Z.; Biesheuvel, P.M. Time-dependent ion selectivity in capacitive charging of porous electrodes. J. Colloid Interface Sci. 2012, 384, 38–44. [Google Scholar] [CrossRef]
  54. Spiegler, K.; El-Sayed, Y. The energetics of desalination processes. Desalination 2001, 134, 109–128. [Google Scholar] [CrossRef]
  55. Atkins, P.W.; De Paula, J. Elements of Physical Chemistry, 7th ed.; Oxford University Press: Oxford, UK; New York, NY, USA, 2017; ISBN 978-1-4292-1813-9. [Google Scholar]
  56. Yip, N.Y.; Elimelech, M. Comparison of Energy Efficiency and Power Density in Pressure Retarded Osmosis and Reverse Electrodialysis. Environ. Sci. Technol. 2014, 48, 11002–11012. [Google Scholar] [CrossRef]
  57. Wijmans, J.G.; Baker, R.W. The solution-diffusion model: A review. J. Membr. Sci. 1995, 107, 1–21. [Google Scholar] [CrossRef]
  58. Water Application Value Engine (WAVE)—Software 1.58; The Dow Chemical Company: Midland, MI, USA, 2018.
  59. LewaPlus®-Software 2.1.1; LANXESS Deutschland GmbH: Cologne, Germany, 2020.
  60. Lipnizki, J.; Dinges, B.; Schaberger, H. Simulation und Auslegung mehrstufiger Wasser-Entsalzungsprozesse unter Einsatz von Umkehrosmose und Ionenaustausch. VGB Powertech 2013, 7, 87–93. [Google Scholar]
  61. Werber, J.R.; Deshmukh, A.; Elimelech, M. The Critical Need for Increased Selectivity, Not Increased Water Permeability, for Desalination Membranes. Environ. Sci. Technol. Lett. 2016, 3, 112–120. [Google Scholar] [CrossRef]
  62. LANXESS Deutschland GmbH Lewabrane—Technical Service Bulletins. 2013. Available online: https://lpt.lanxess.com/media-events/lewabrane-downloads/4/ (accessed on 12 June 2020).
  63. DuPontTM FILMTECTM. Reverse Osmosis Membranes—Technical Manual; DuPont Water Solutions: Wilmington, DE, USA, 2020; Volume 3. [Google Scholar]
  64. Kadaj, E.; Bosleman, R. Energy Recovery Devices in Membrane Desalination Processes. In Renewable Energy Powered Desalination Handbook; Elsevier BV: Amsterdam, The Netherlands, 2018; pp. 415–444. [Google Scholar]
  65. Chong, T.H.; Loo, S.L.; Fane, A.G.; Krantz, W.B. Energy-efficient reverse osmosis desalination: Effect of retentate recycle and pump and energy recovery device efficiencies. Desalination 2015, 366, 15–31. [Google Scholar] [CrossRef]
  66. DIN German Institute for Standardization, DIN 38406-3:2002-03, Deutsche Einheitsverfahren Zur Wasser-, Abwasser- Und Schlammuntersuchung - Kationen (Gruppe E) - Teil 3: Bestimmung von Calcium Und Magnesium, Komplexometrisches Verfahren (E 3); engl.: German standard methods for the examination of water, waste Water and sludge - cations (group E) - Part 3: Determination of calcium and magnesium, complexometric Method (E 3). Berlin: Beuth Verlag GmbH 2002. [CrossRef]
  67. DIN German Institute for Standardization, DIN 38406-13:1992-07, Deutsche Einheitsverfahren Zur Wasser-, Abwasser- Und Schlammuntersuchung; Kationen (Gruppe E); Bestimmung von Kalium Mittels Atomabsorptionsspektrometrie (AAS) in Der Luft-Acetylen-Flamme (E 13); engl.: German standard methods for the examination of water, waste water and sludge; cations (Group E); Determination of potassium by atomic absorption spectrometry (AAS) using an air-acetylene flame (E 13). Berlin: Beuth Verlag GmbH 1992. [CrossRef]
  68. DIN German Institute for Standardization, DIN 38406-14:1992-07, Deutsche Einheitsverfahren Zur Wasser-, Abwasser- Und Schlammuntersuchung; Kationen (Gruppe E); Bestimmung von Natrium Mittels Atomabsorptionsspektrometrie (AAS) in Der Luft-Acetylen-Flamme (E 14); engl.: German standard methods for the examination of water, waste water and sludge; cations (Group E); Determination of sodium by atomic absorption spectrometry (ASS) using an air-acetylene flame (E 14). Berlin: Beuth Verlag GmbH 1992. [CrossRef]
  69. DIN German Institute for Standardization, DIN EN ISO 10304-1:2009-07, Wasserbeschaffenheit - Bestimmung von Gelösten Anionen Mittels Flüssigkeits-Ionenchromatographie - Teil 1: Bestimmung von Bromid, Chlorid, Fluorid, Nitrat, Nitrit, Phosphat Und Sulfat (ISO 10304-1:2007); Deutsche Fassung EN ISO 10304-1:2009; engl.: Water quality - Determination of dissolved anions by liquid chromatography of ions - Part 1: Determination of bromide, chloride, fluoride, nitrate, nitrite, phosphate and sulfate (ISO 10304-1:2007); German Version EN ISO 10304-1:2009. Berlin: Beuth Verlag GmbH 2009. [CrossRef]
  70. DIN German Institute for Standardization, DIN 38409-7:2005-12, Deutsche Einheitsverfahren Zur Wasser-, Abwasser- Und Schlammuntersuchung - Summarische Wirkungs- Und Stoffkenngrößen (Gruppe H) - Teil 7: Bestimmung Der Säure- Und Basekapazität (H 7); engl.: German standard methods for the examination of water, waste water and sludge - Parameters characterizing effects and substances (Group H) - Part 7: Determination of acid and base-neutralizing capacities (H 7). Berlin: Beuth Verlag GmbH 2005. [CrossRef]
  71. Van Limpt, B.; Van Der Wal, A. Water and chemical savings in cooling towers by using membrane capacitive deionization. Desalination 2014, 342, 148–155. [Google Scholar] [CrossRef]
  72. Helmholtz, H. Ueber einige Gesetze der Vertheilung elektrischer Ströme in körperlichen Leitern mit Anwendung auf die thierisch-elektrischen Versuche. Ann. Phys. 1853, 165, 211–233. [Google Scholar] [CrossRef] [Green Version]
  73. Biesheuvel, P.M. Thermodynamic cycle analysis for capacitive deionization. J. Colloid Interface Sci. 2009, 332, 258–264. [Google Scholar] [CrossRef]
  74. Chapman, D.L. LI. A contribution to the theory of electrocapillarity. Lond. Edinb. Dublin Philos. Mag. J. Sci. 1913, 25, 475–481. [Google Scholar] [CrossRef] [Green Version]
  75. Stern, O. Zur Theorie Der Elektrolytischen Doppelschicht. Z. Elektrochem. Angew. Phys. Chemie 1924, 30, 508–516. [Google Scholar] [CrossRef]
  76. Porada, S.; Bryjak, M.; Van Der Wal, A.; Biesheuvel, P. Effect of electrode thickness variation on operation of capacitive deionization. Electrochim. Acta 2012, 75, 148–156. [Google Scholar] [CrossRef] [Green Version]
  77. Biesheuvel, P.M.; Porada, S.; Levi, M.; Bazant, M.Z. Attractive forces in microporous carbon electrodes for capacitive deionization. J. Solid State Electrochem. 2014, 18, 1365–1376. [Google Scholar] [CrossRef] [Green Version]
  78. Biesheuvel, P.M.; Zhao, R.; Porada, S.; Van Der Wal, A. Theory of membrane capacitive deionization including the effect of the electrode pore space. J. Colloid Interface Sci. 2011, 360, 239–248. [Google Scholar] [CrossRef] [Green Version]
  79. Dykstra, J.; Zhao, R.; Biesheuvel, P.M.; Van Der Wal, A. Resistance identification and rational process design in Capacitive Deionization. Water Res. 2016, 88, 358–370. [Google Scholar] [CrossRef] [PubMed]
  80. Biesheuvel, P.M. Activated Carbon Is an Electron-Conducting Amphoteric Ion Adsorbent. arXiv 2015, 9. arXiv:1509.06354. [Google Scholar]
  81. Mubita, T.; Dykstra, J.; Biesheuvel, P.; Van Der Wal, A.; Porada, S. Selective adsorption of nitrate over chloride in microporous carbons. Water Res. 2019, 164, 114885. [Google Scholar] [CrossRef]
  82. Hassanvand, A.; Chen, G.Q.; Webley, P.A.; Kentish, S.E. A comparison of multicomponent electrosorption in capacitive deionization and membrane capacitive deionization. Water Res. 2018, 131, 100–109. [Google Scholar] [CrossRef] [Green Version]
  83. Tsai, S.-W.; Hackl, L.; Kumar, A.; Hou, C.-H. Exploring the electrosorption selectivity of nitrate over chloride in capacitive deionization (CDI) and membrane capacitive deionization (MCDI). Desalination 2021, 497, 114764. [Google Scholar] [CrossRef]
  84. Zhang, X.; Zuo, K.; Zhang, X.; Zhang, C.; Liang, P. Selective ion separation by capacitive deionization (CDI) based technologies: A state-of-the-art review. Environ. Sci. Water Res. Technol. 2020, 6, 243–257. [Google Scholar] [CrossRef]
  85. Suss, M.E. Size-Based Ion Selectivity of Micropore Electric Double Layers in Capacitive Deionization Electrodes. J. Electrochem. Soc. 2017, 164, E270–E275. [Google Scholar] [CrossRef] [Green Version]
  86. Guyes, E.N.; Malka, T.; Suss, M.E. Enhancing the Ion-Size-Based Selectivity of Capacitive Deionization Electrodes. Environ. Sci. Technol. 2019, 53, 8447–8454. [Google Scholar] [CrossRef] [PubMed]
  87. Dykstra, J.E.; Porada, S.; Van Der Wal, A.; Biesheuvel, P.M. Energy consumption in capacitive deionization—Constant current versus constant voltage operation. Water Res. 2018, 143, 367–375. [Google Scholar] [CrossRef]
  88. Nicolini, J.V.; Borges, C.P.; Ferraz, H.C. Selective rejection of ions and correlation with surface properties of nanofiltration membranes. Sep. Purif. Technol. 2016, 171, 238–247. [Google Scholar] [CrossRef]
  89. Hilal, N.; Al-Zoubi, H.; Mohammad, A.; Darwish, N. Nanofiltration of highly concentrated salt solutions up to seawater salinity. Desalination 2005, 184, 315–326. [Google Scholar] [CrossRef]
  90. Mountadar, S.; Carbonell-Alcaina, C.; Luján-Facundo, M.; Ferrer-Polonio, E.; Soler-Cabezas, J.; Mendoza-Roca, J.; Tahiri, S. Desalination of brackish water and reverse osmotic retentate using nanofiltration membranes: Effects of TMP and feed concentration on the treatment. Desalination Water Treat. 2017, 87, 68–75. [Google Scholar] [CrossRef]
  91. Altaee, A.; Sharif, A.O. Alternative design to dual stage NF seawater desalination using high rejection brackish water membranes. Desalination 2011, 273, 391–397. [Google Scholar] [CrossRef]
  92. Okamoto, Y.; Lienhard, J.H. How RO membrane permeability and other performance factors affect process cost and energy use: A review. Desalination 2019, 470, 114064. [Google Scholar] [CrossRef]
  93. Hofs, B.; Schurer, R.; Harmsen, D.; Ceccarelli, C.; Beerendonk, E.; Cornelissen, E. Characterization and performance of a commercial thin film nanocomposite seawater reverse osmosis membrane and comparison with a thin film composite. J. Membr. Sci. 2013, 446, 68–78. [Google Scholar] [CrossRef]
  94. Długołęcki, P.; Van Der Wal, A. Energy Recovery in Membrane Capacitive Deionization. Environ. Sci. Technol. 2013, 47, 4904–4910. [Google Scholar] [CrossRef]
  95. Chen, L.; Yin, X.; Zhu, L.; Qiu, Y. Energy recovery and electrode regeneration under different charge/discharge conditions in membrane capacitive deionization. Desalination 2018, 439, 93–101. [Google Scholar] [CrossRef]
  96. Mossad, M.; Zou, L. Study of fouling and scaling in capacitive deionisation by using dissolved organic and inorganic salts. J. Hazard. Mater. 2013, 387–393. [Google Scholar] [CrossRef]
  97. Oest, J.; Elbracht, J.; Schloemer, S.; Illing, C.; Blumenberg, M. Methan im Grundwasser Niedersachsens; GeoBerichte 35; Landesamt für Bergbau, Energie und Geologie: Hannover, Germany, 2019; pp. 6–43. ISSN 1864–7529. [Google Scholar]
  98. Luo, J. Effects of PH and Salt on Nanofiltration—A Critical Review. J. Membr. Sci. 2013, 11, 18–28. [Google Scholar] [CrossRef]
  99. Werber, J.R.; Deshmukh, A.; Elimelech, M. Can batch or semi-batch processes save energy in reverse-osmosis desalination? Desalination 2017, 402, 109–122. [Google Scholar] [CrossRef] [Green Version]
  100. Shrivastava, A.; Rosenberg, S.; Peery, M. Energy efficiency breakdown of reverse osmosis and its implications on future innovation roadmap for desalination. Desalination 2015, 368, 181–192. [Google Scholar] [CrossRef]
  101. Tan, C.; He, C.; Fletcher, J.; Waite, T.D. Energy recovery in pilot scale membrane CDI treatment of brackish waters. Water Res. 2020, 168, 115146. [Google Scholar] [CrossRef] [PubMed]
  102. Xu, P.; Cath, T.Y.; Robertson, A.P.; Reinhard, M.; Leckie, J.O.; Drewes, J.E. Critical Review of Desalination Concentrate Management, Treatment and Beneficial Use. Environ. Eng. Sci. 2013, 30, 502–514. [Google Scholar] [CrossRef] [Green Version]
  103. Hemmatifar, A.; Ramachandran, A.; Liu, K.; Oyarzun, D.I.; Bazant, M.Z.; Santiago, J.G. Thermodynamics of Ion Separation by Electrosorption. Environ. Sci. Technol. 2018, 52, 10196–10204. [Google Scholar] [CrossRef] [PubMed] [Green Version]
  104. Wang, L.; Dykstra, J.E.; Lin, S. Energy Efficiency of Capacitive Deionization. Environ. Sci. Technol. 2019, 53, 3366–3378. [Google Scholar] [CrossRef] [PubMed]
  105. Choi, J.-H.; Lee, H.-J.; Moon, S.-H. Electrodialysis Desalination. In Desalination; Wiley: Hoboken, NJ, USA, 2019; pp. 287–326. [Google Scholar]
  106. Mossad, M.; Zou, L. A study of the capacitive deionisation performance under various operational conditions. J. Hazard. Mater. 2012, 491–497. [Google Scholar] [CrossRef] [PubMed]
  107. Jeong, K.; Yoon, N.; Park, S.; Son, M.; Lee, J.; Park, J.; Cho, K.H. Optimization of a nanofiltration and membrane capacitive deionization (NF-MCDI) hybrid system: Experimental and modeling studies. Desalination 2020, 493, 114658. [Google Scholar] [CrossRef]
  108. Choi, J.; Oh, Y.; Chae, S.; Hong, S. Membrane capacitive deionization-reverse electrodialysis hybrid system for improving energy efficiency of reverse osmosis seawater desalination. Desalination 2019, 462, 19–28. [Google Scholar] [CrossRef]
Figure 1. Process control diagram: (a) pressure-driven membrane desalination (e.g., reverse osmosis (RO) or nanofiltration (NF)); (b) membrane capacitive deionisation (MCDI) ( Q S G W : flow rate of saline groundwater (m3/h), Q F e e d : flow rate of feedwater (m3/h),   Q D W : flow rate of partial desalinated water (m3/h),   Q B y p a s s : flow rate of the bypass (m3/h),   Q P r o d u c t : flow rate of the product (m3/h),   Q B r i n e : flow rate of brine (m3/h),   c : molar salt concentration (mol/L),   R M o d u l e : salt rejection of module (%), γ M o d u l e : water recovery of module (%), R S y s t e m : salt rejection of system (%), γ S y s t e m : water recovery of system (%), η E R D : efficiency of energy recovery device (%), η P u m p : efficiency of pump (%), V c e l l : cell voltage (V), IEM: ion exchange membrane).
Membranes 11 00126 g001
Figure 2. Minimum volume-related specific energy consumption ( S E C m i n , V ) as a function of water recovery: (a) for slightly SGW and moderately SGW; (b) for highly SGW and seawater regarding the target concentrations for fresh groundwater, water for irrigation and drinking water.
Membranes 11 00126 g002
Figure 3. Average permeability: (a) water permeability ( A T ), (b) salt permeability ( B T ) for desalination of moderately SGW at 29.5 °C. The bars show the 95% confidence interval for the experimental results. NF: nanofiltration; BWRO: brackish water reverse osmosis; SWRO: seawater reverse osmosis.
Membranes 11 00126 g003
Figure 4. Volume-related specific energy consumption ( S E C V ) and system-scale water recovery ( γ S y s t e m , w ). The S E C V is shown for the most efficient desalination configuration of pressure-driven membrane desalination and membrane capacitive deionisation (MCDI) (the respective type of applied membrane and applied electrical current is given above the bars). Empty bars represents configurations not suitable for the aimed target concentration. The error bars represent the 95% confidence interval.
Membranes 11 00126 g004
Figure 5. Removed ion-related specific energy consumption ( S E C I o n ) and system-scale water recovery ( γ S y s t e m , w ) for (a) Na + , (b) Cl , (c) NO 3 , (d) SO 4 2 . The S E C I o n is shown for the most efficient desalination configuration of pressure-driven membrane desalination and MCDI (the respective type of applied membrane and applied electrical current is given above the bars). Empty bars represent configurations not suitable for the aimed target concentration (highly SGW) or that no salt retention was required (slightly SGW, moderately SGW). The error bars represent the 95% confidence interval.
Membranes 11 00126 g005
Figure 6. Cell voltage ( V c e l l ) and conductivity of the outflow of the MCDI module during desalination of slightly SGW at 14 A (Ω: ohmic resistance).
Membranes 11 00126 g006
Figure 7. Specific module-scale salt rejection ( R M o d u l e , j ) and module-scale water recovery ( γ M o d u l e , w ) for experimental desalination: (a) slightly SGW and (b) moderately SGW using MCDI.
Membranes 11 00126 g007
Figure 8. Benefits and drawbacks of pressure-driven membrane desalination (red and dashed frame) and membrane capacitive deionisation (green and solid frame) detected in this study.
Membranes 11 00126 g008
Table 1. Classification of water salinity based on the mass concentration of total dissolved solids (TDS) and chloride ( Cl ) [10,11].
Classification of Water Salinity T D S C l
mg/Lmg/L
Freshwater0–500<100
Slightly saline groundwater500–1500100–250
Moderately saline groundwater1500–7000250–500
Highly saline groundwater7000–35,000500–10,000
Seawater>35,000>10,000
Table 2. Ion mass concentration (β) (mg/L), conductivity (µS/cm) and temperature (°C) of seawater, slightly SGW, moderately SGW, highly SGW and the target concentrations (local fresh groundwater quality, global guideline concentrations for irrigation water for sensitive crops and global guideline concentrations for drinking water quality).
SeawaterDalian, ChinaSalalah, OmanNile Delta, EgyptGlobal
FreshwaterSlightly SGWFreshwaterModerately SGWFreshwaterHighly SGWIrrigationDrinking Water
Ref.[45,46][47]
w. n. 3
[47]
w. n. 13
[48]
w. n. 29
[49]
w. n. 4
[50]
w. n. 10
[50]
w. n. 10
[13][43,44]
Ca 2 + 41265 SAR172102 SAR22340 SAR546n.s. SARn.s.
N a + 10,78219 SAR8138 SAR34020 SAR465869 SAR200
Mg 2 + 128412 SAR3216 SAR10714 SAR1130n.s. SARn.s.
K + 39932179100n.s.n.s.
C l 19,35334273907023010,645106250
HCO 3 11312611823424216015492n.s.
S O 4 2 2712669727176191057200250
N O 3 n.s.4723024416n.s.n.s.130 150
TDS35,0553721004532221329218,289450600
Conductivityn.s.5601740794451044032,000700n.s.
pH87.87.6n.s.7.17.87.26.5–8.5
Temperature 2n.s.13.113.629.5 229.5 222.0 222.0 2n.s.n.s.
n.s. = not specified, w. n. = well number, SAR = sodium adsorption ratio, 1 nitrate-sensitive crops might have a lower target concentration. 2 groundwater temperature, which were not given in the respective literature, was assumed to be the mean air temperature above the land surface [51,52]. Bold: specific ions, which exceed the target concentrations. SGW: Saline groundwater.
Table 3. Average water permeability at 25 °C ( A 25 ° C ).
Membrane A 25   ° C   in   L / ( m 2   h   bar )
ExperimentsSimulationLiterature
Slightly SGWModerately SGWHighly SGWSlightly SGWModerately SGWHighly SGW
DOW FILMTEC™ NF90-400/34i7.375.18-9.439.55-4.0–10.2 [88,89,90]
LEWABRANE® RO B085 HF 40403.453.090.913.433.472.292.0–5.3 1 [61,91,92]
DOW FILMTEC™ SW30XLE-400i1.031.040.512.172.071.870.9–3.0 1 [6,91,93]
1 Since no water permeability coefficients for the specific membranes were found, results for similar polyamide thin-film composite membranes are shown.
Table 4. Average values of energy balance, module-scale water recovery ( γ M o d u l e , w ) and module-scale salt rejection ( R M o d u l e , T D S ) regarding the electrical current ( I e l ) for MCDI desalination experiments (without blending).
Figure I e l γ M o d u l e , w S E C M C D I , V   during   Charging Recovered Energy during DischargingEnergy Recovery R M o d u l e , T D S
A%kWh/m3kWh/m3%%
Slightly SGW1076.110.150.019.5737.10
1467.480.200.0314.1254.41
1861.460.270.0518.0168.09
2254.290.390.0820.8987.18
2631.450.620.1523.9893.49
Moderately SGW2066.340.290.0620.9525.18
4048.870.680.2436.0464.64
4539.100.940.3436.5980.27
5035.421.120.3531.2990.46
5524.222.440.6928.0596.31
Publisher’s Note: MDPI stays neutral with regard to jurisdictional claims in published maps and institutional affiliations.

