Power Generation Performance of a Pilot-Scale Reverse Electrodialysis Using Monovalent Selective Ion-Exchange Membranes


Abstract
:
1. Introduction
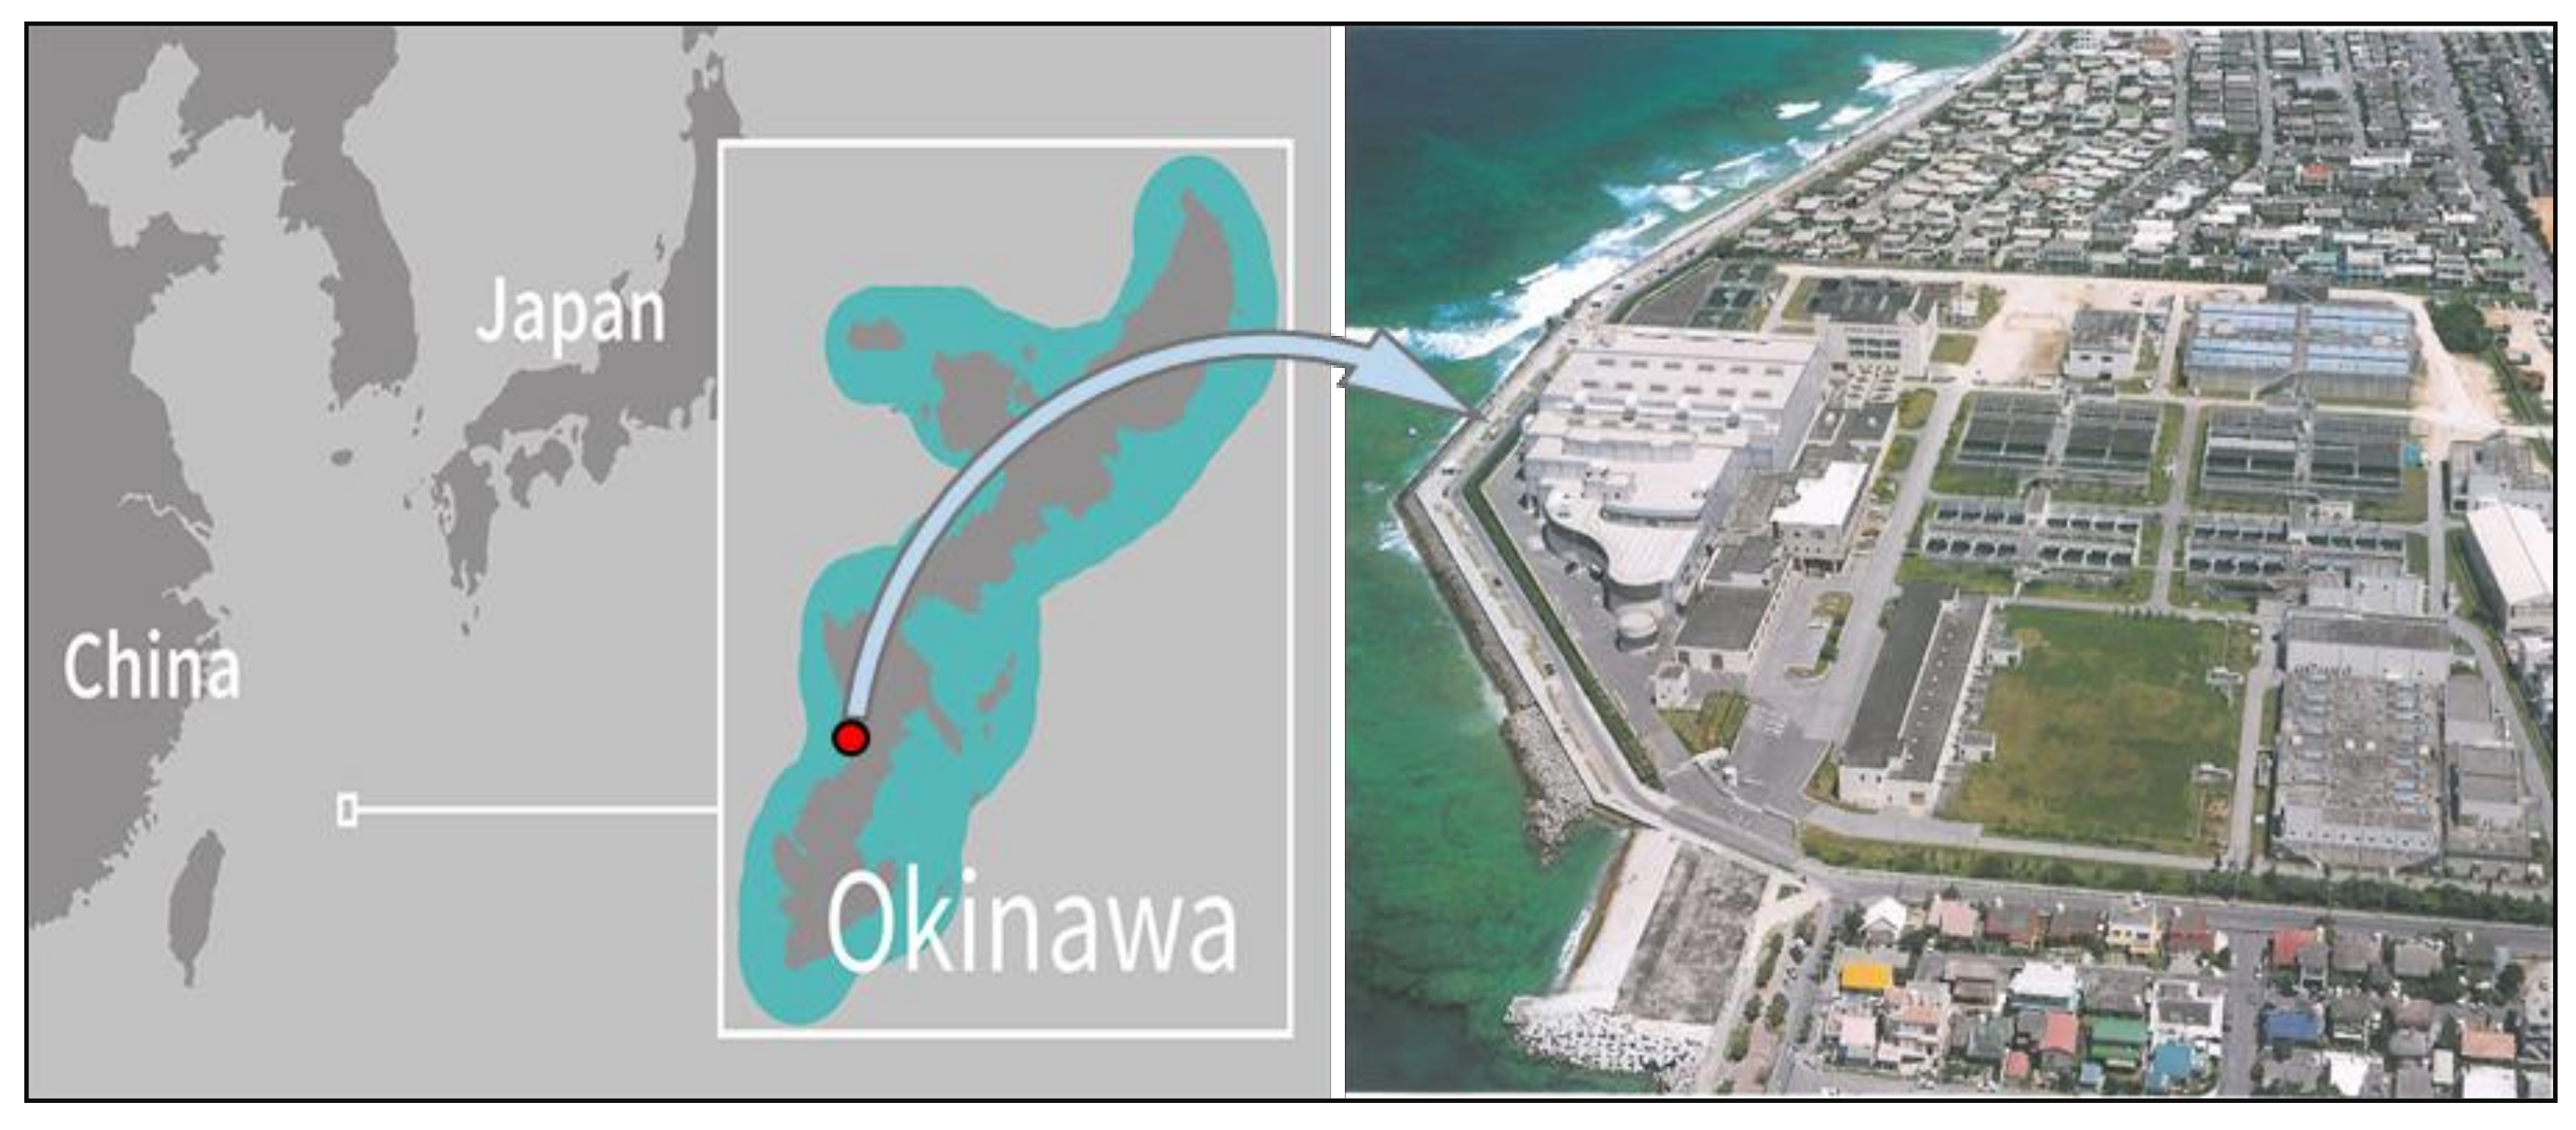
2. Case Study
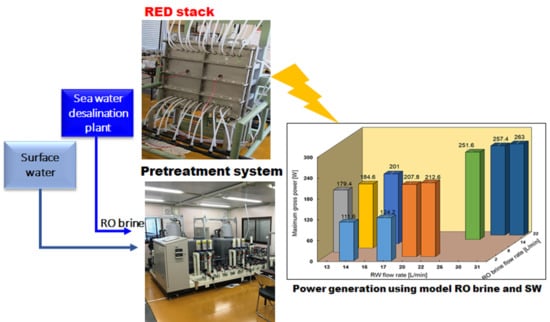
2.1. Desalination Unit
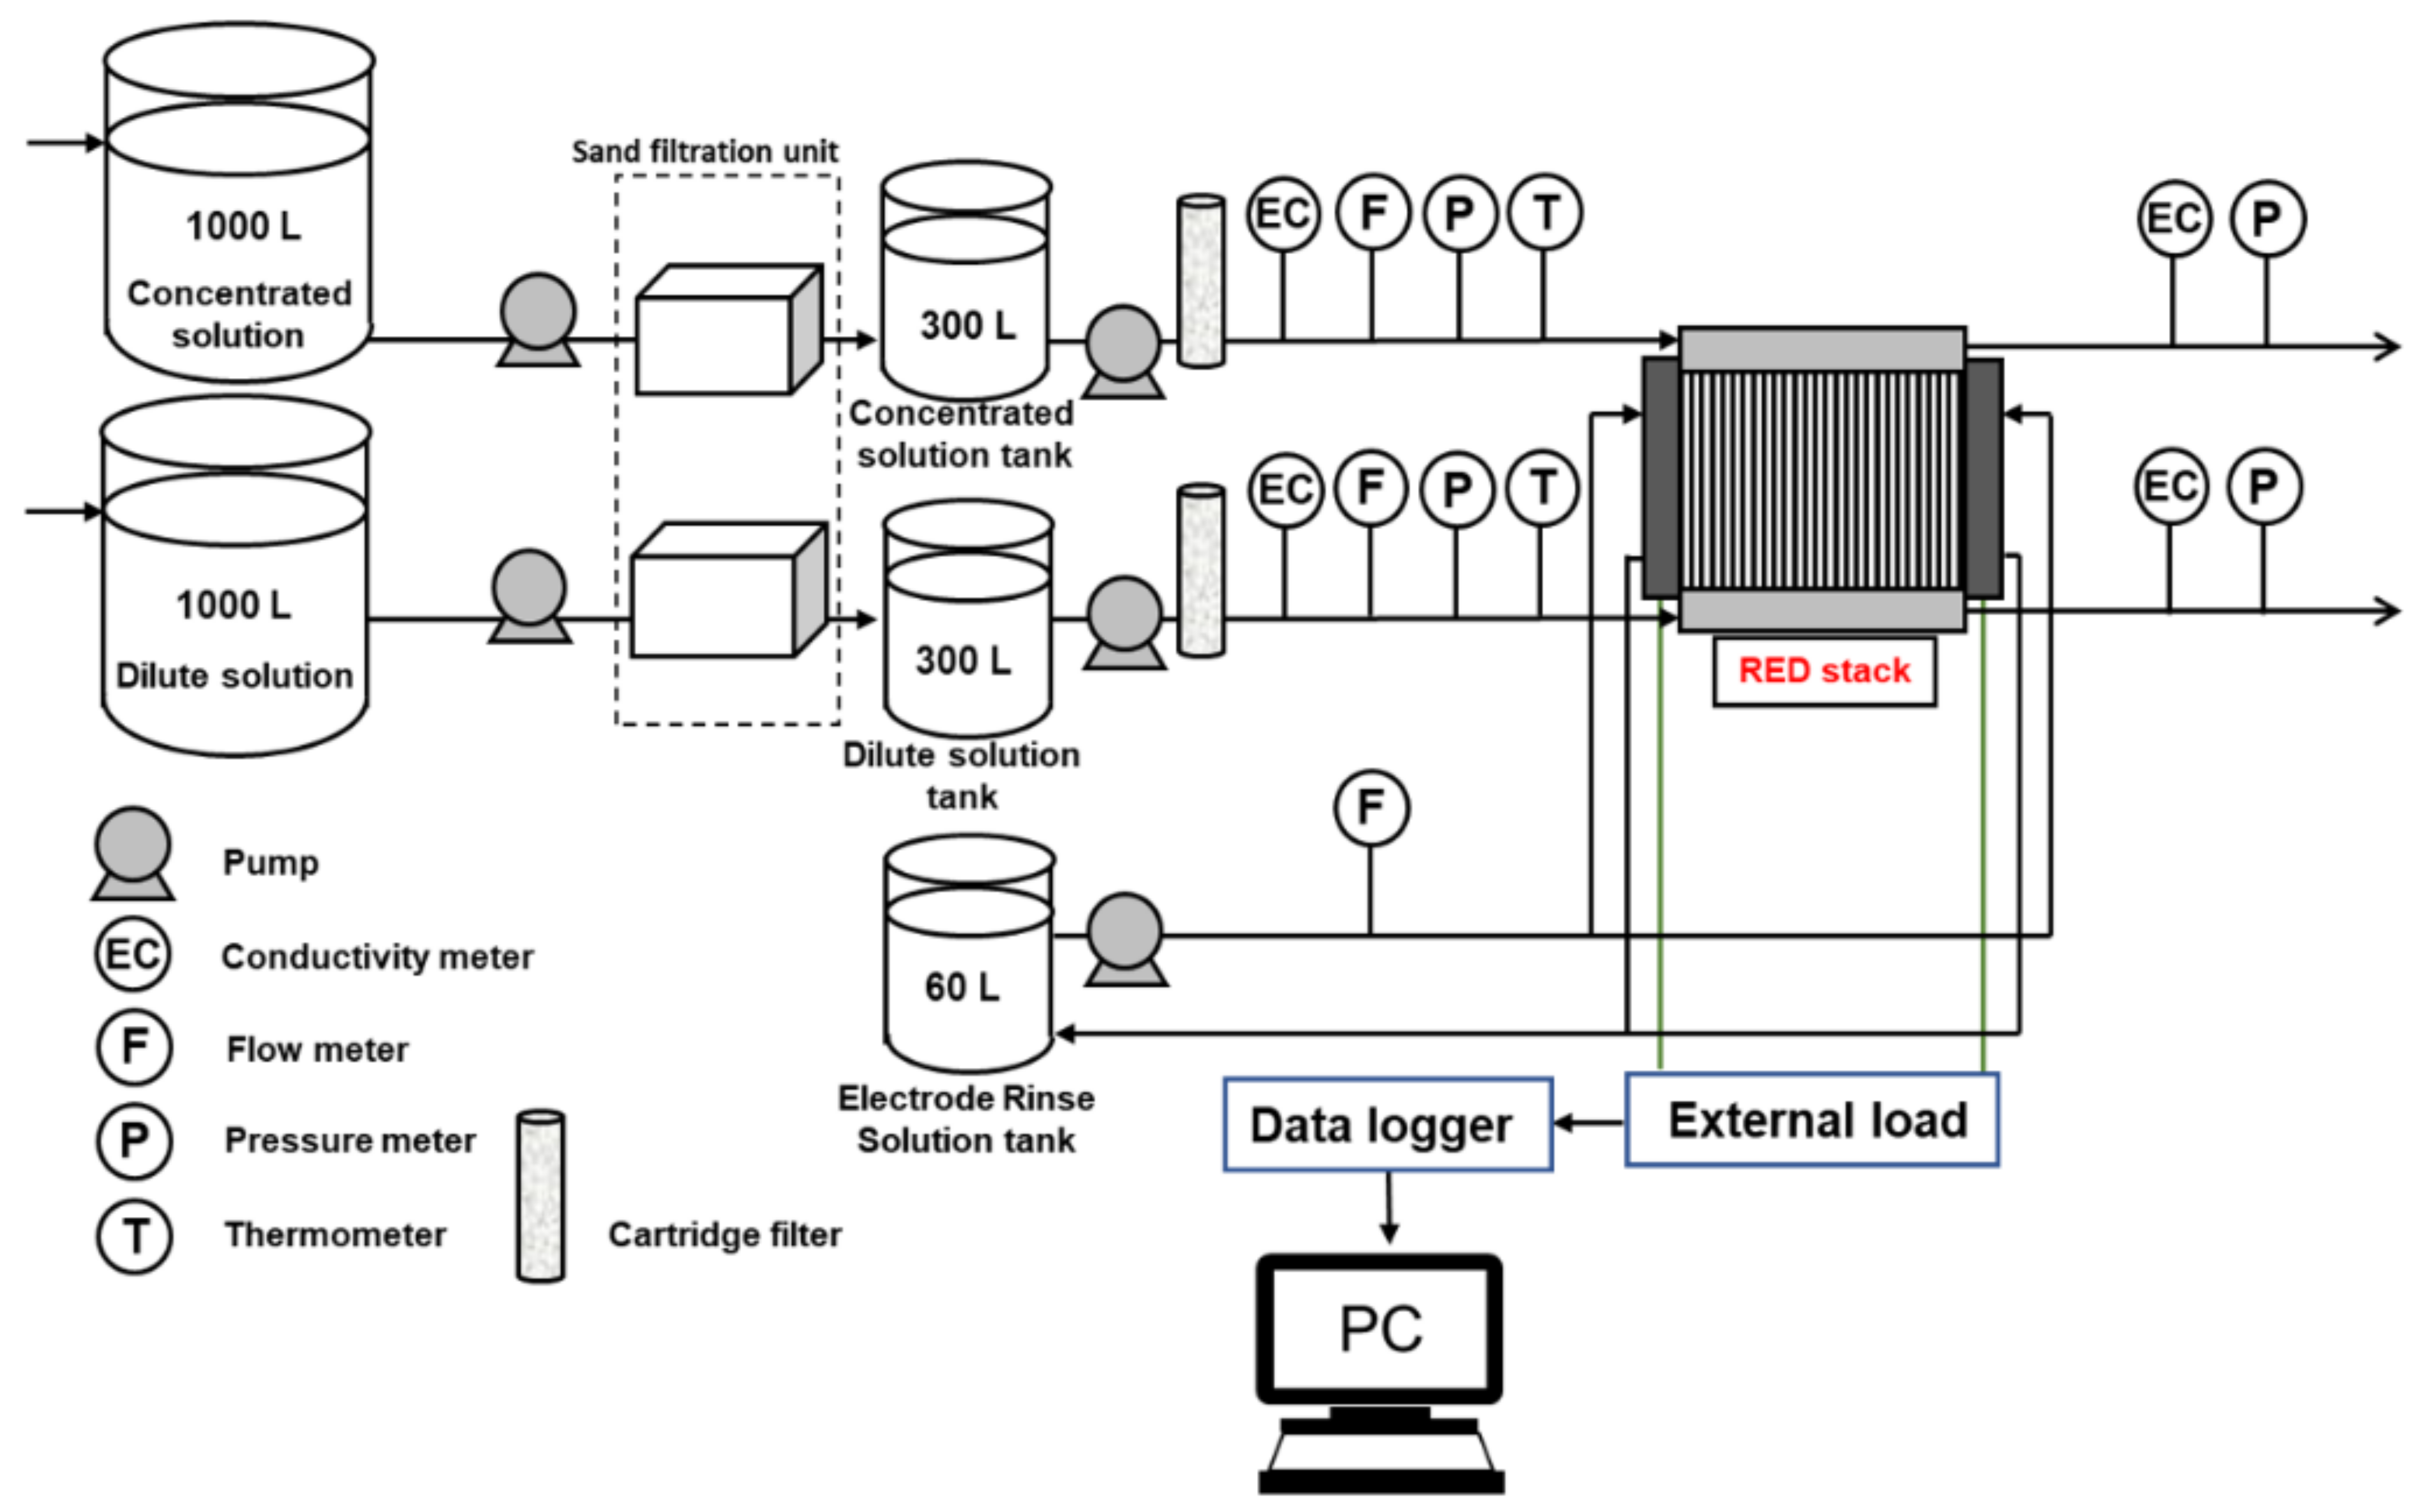
2.2. RED Pilot Plant
2.2.1. Feed Solution
2.2.2. Pre-Treatment
2.2.3. RED Stack
3. Experimental Procedure
3.1. RED Performance Test
3.2. Open Circuit Voltage (OCV)
3.3. Stack Resistance
3.4. Gross Power Output
4. Results and Discussion
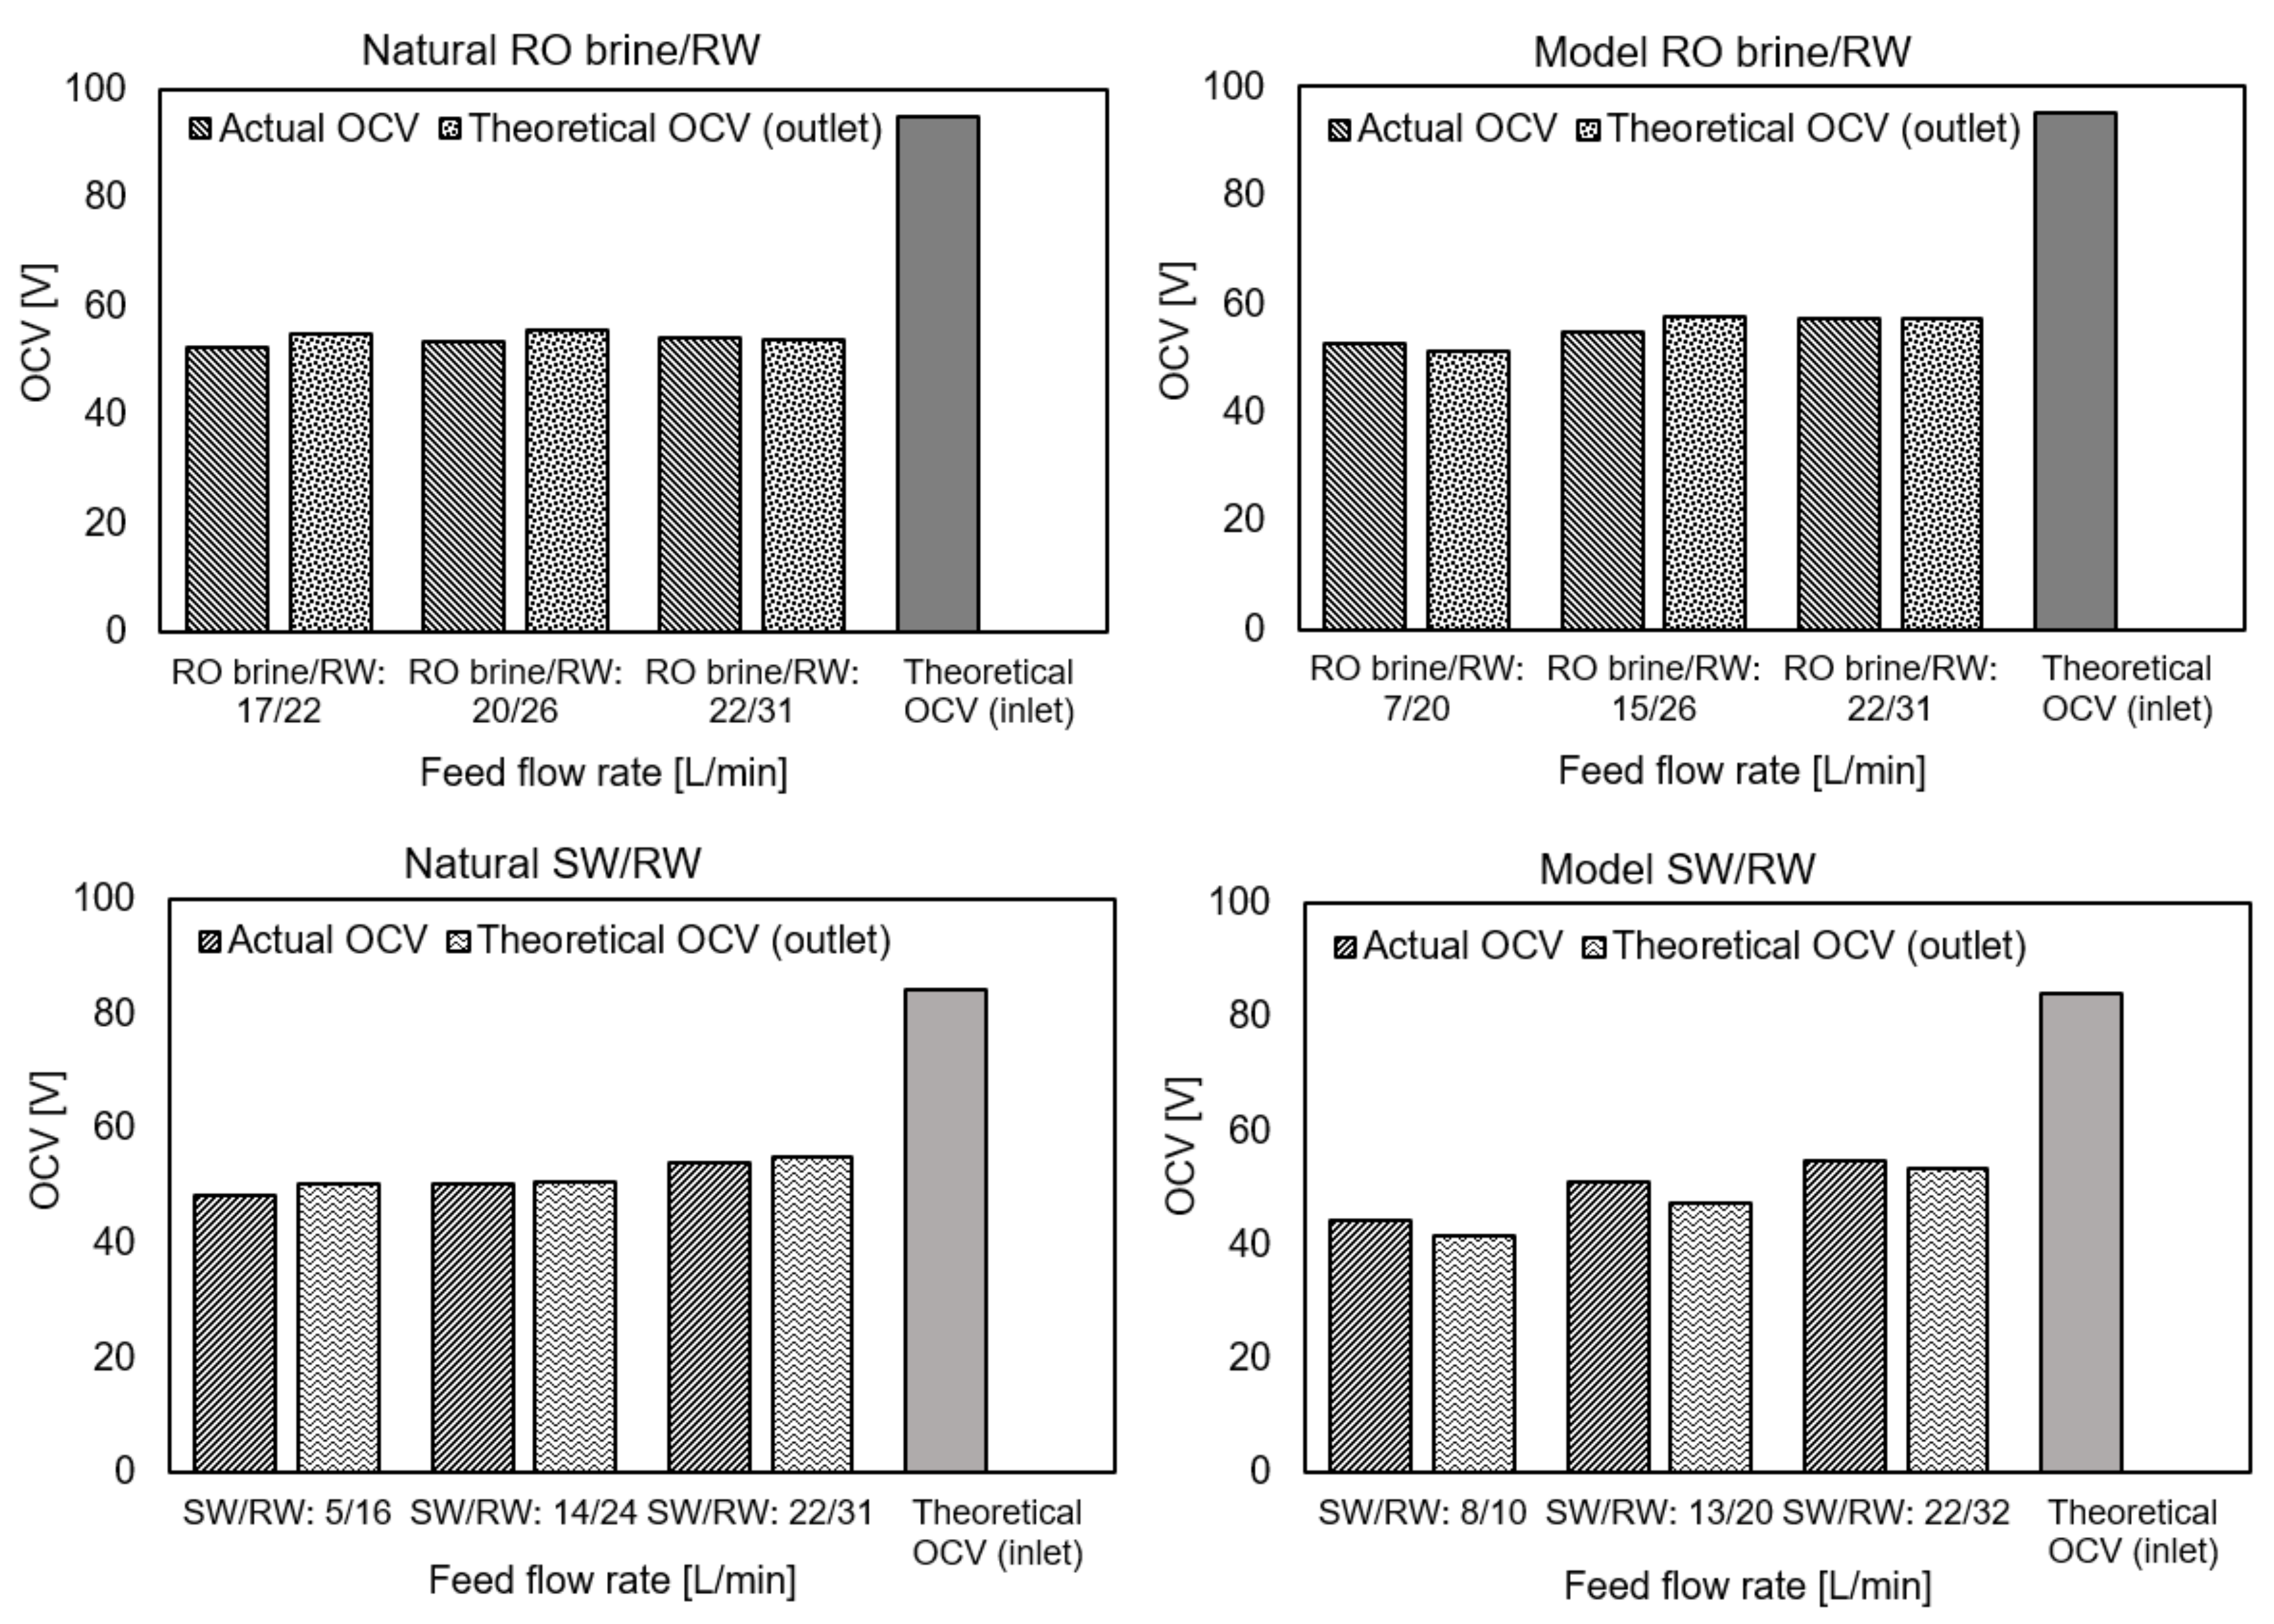
4.1. Open Circuit Voltage (OCV)
4.2. Stack Resistance (Ω)
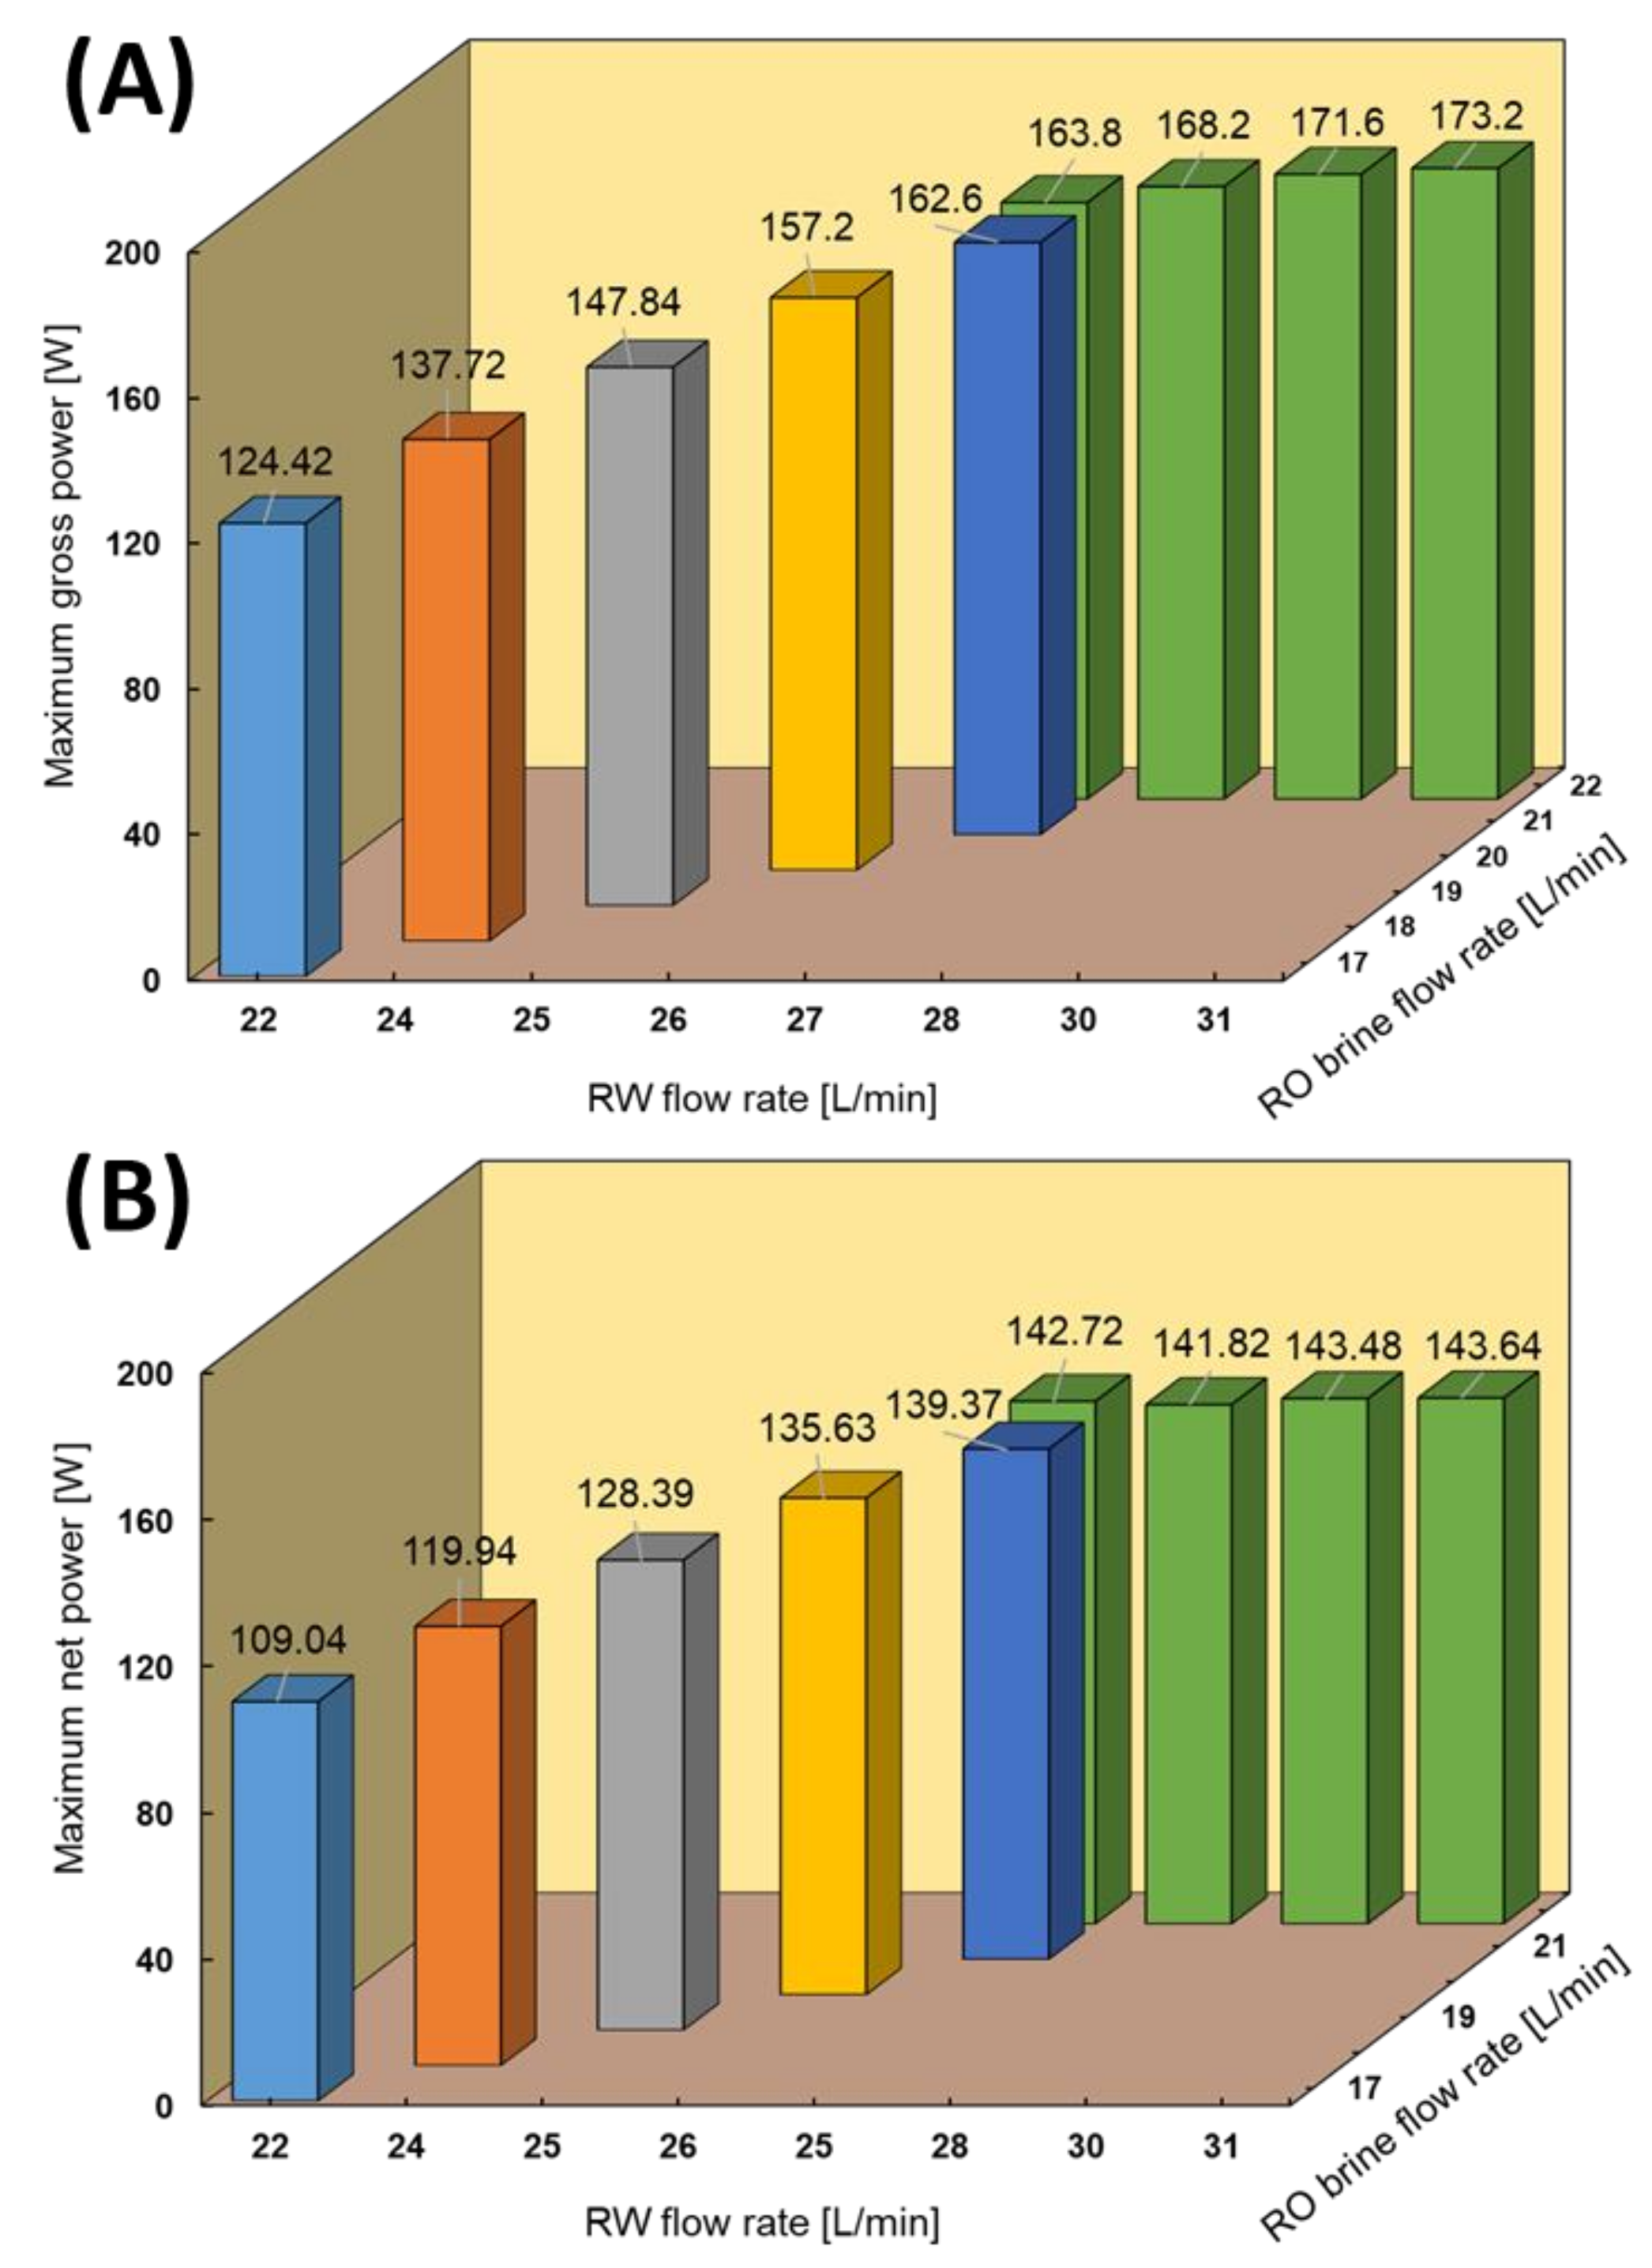
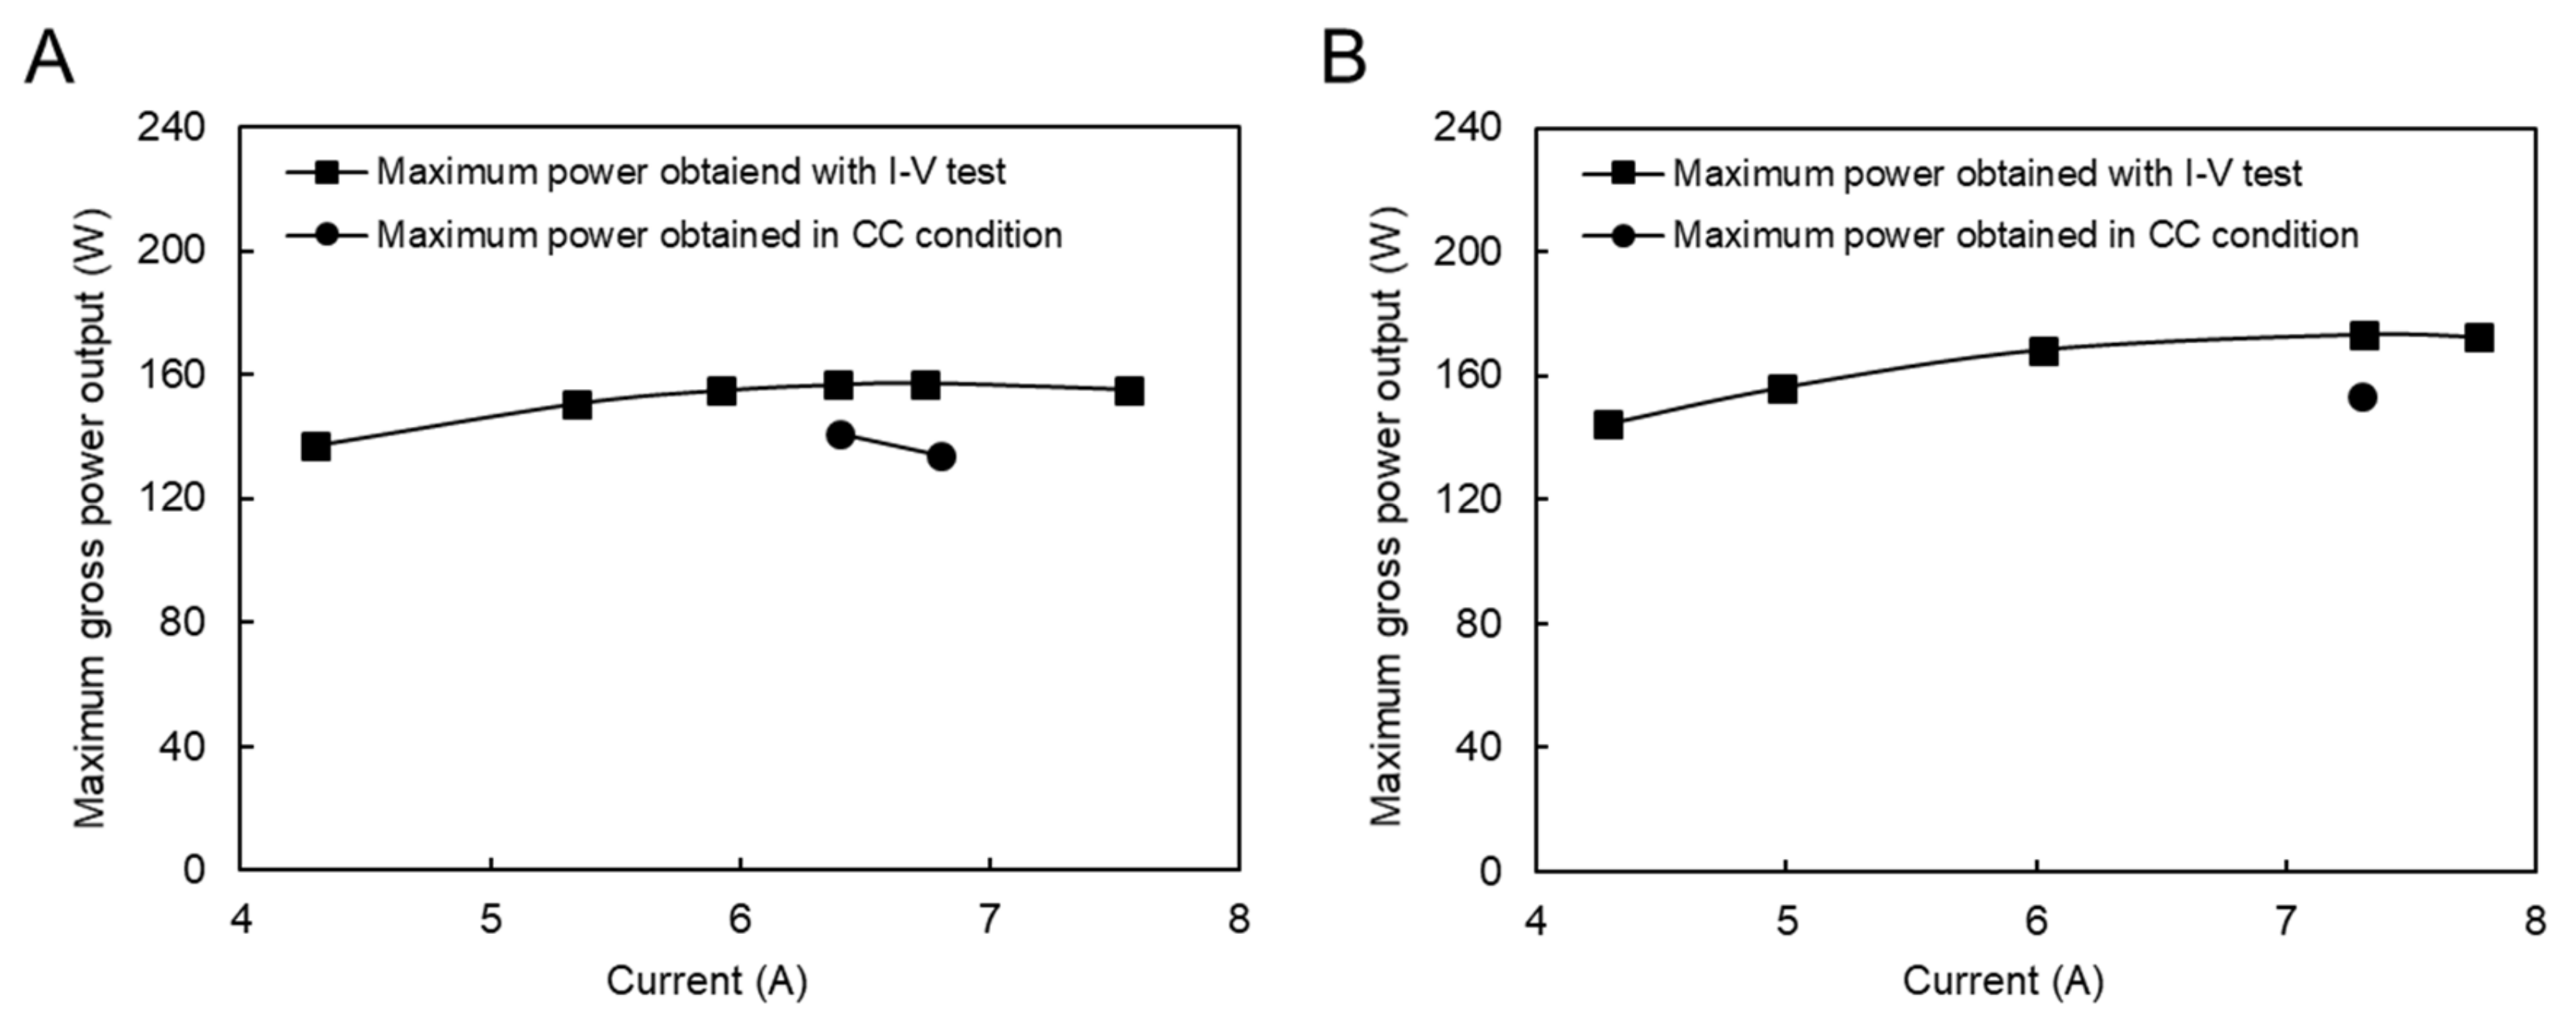
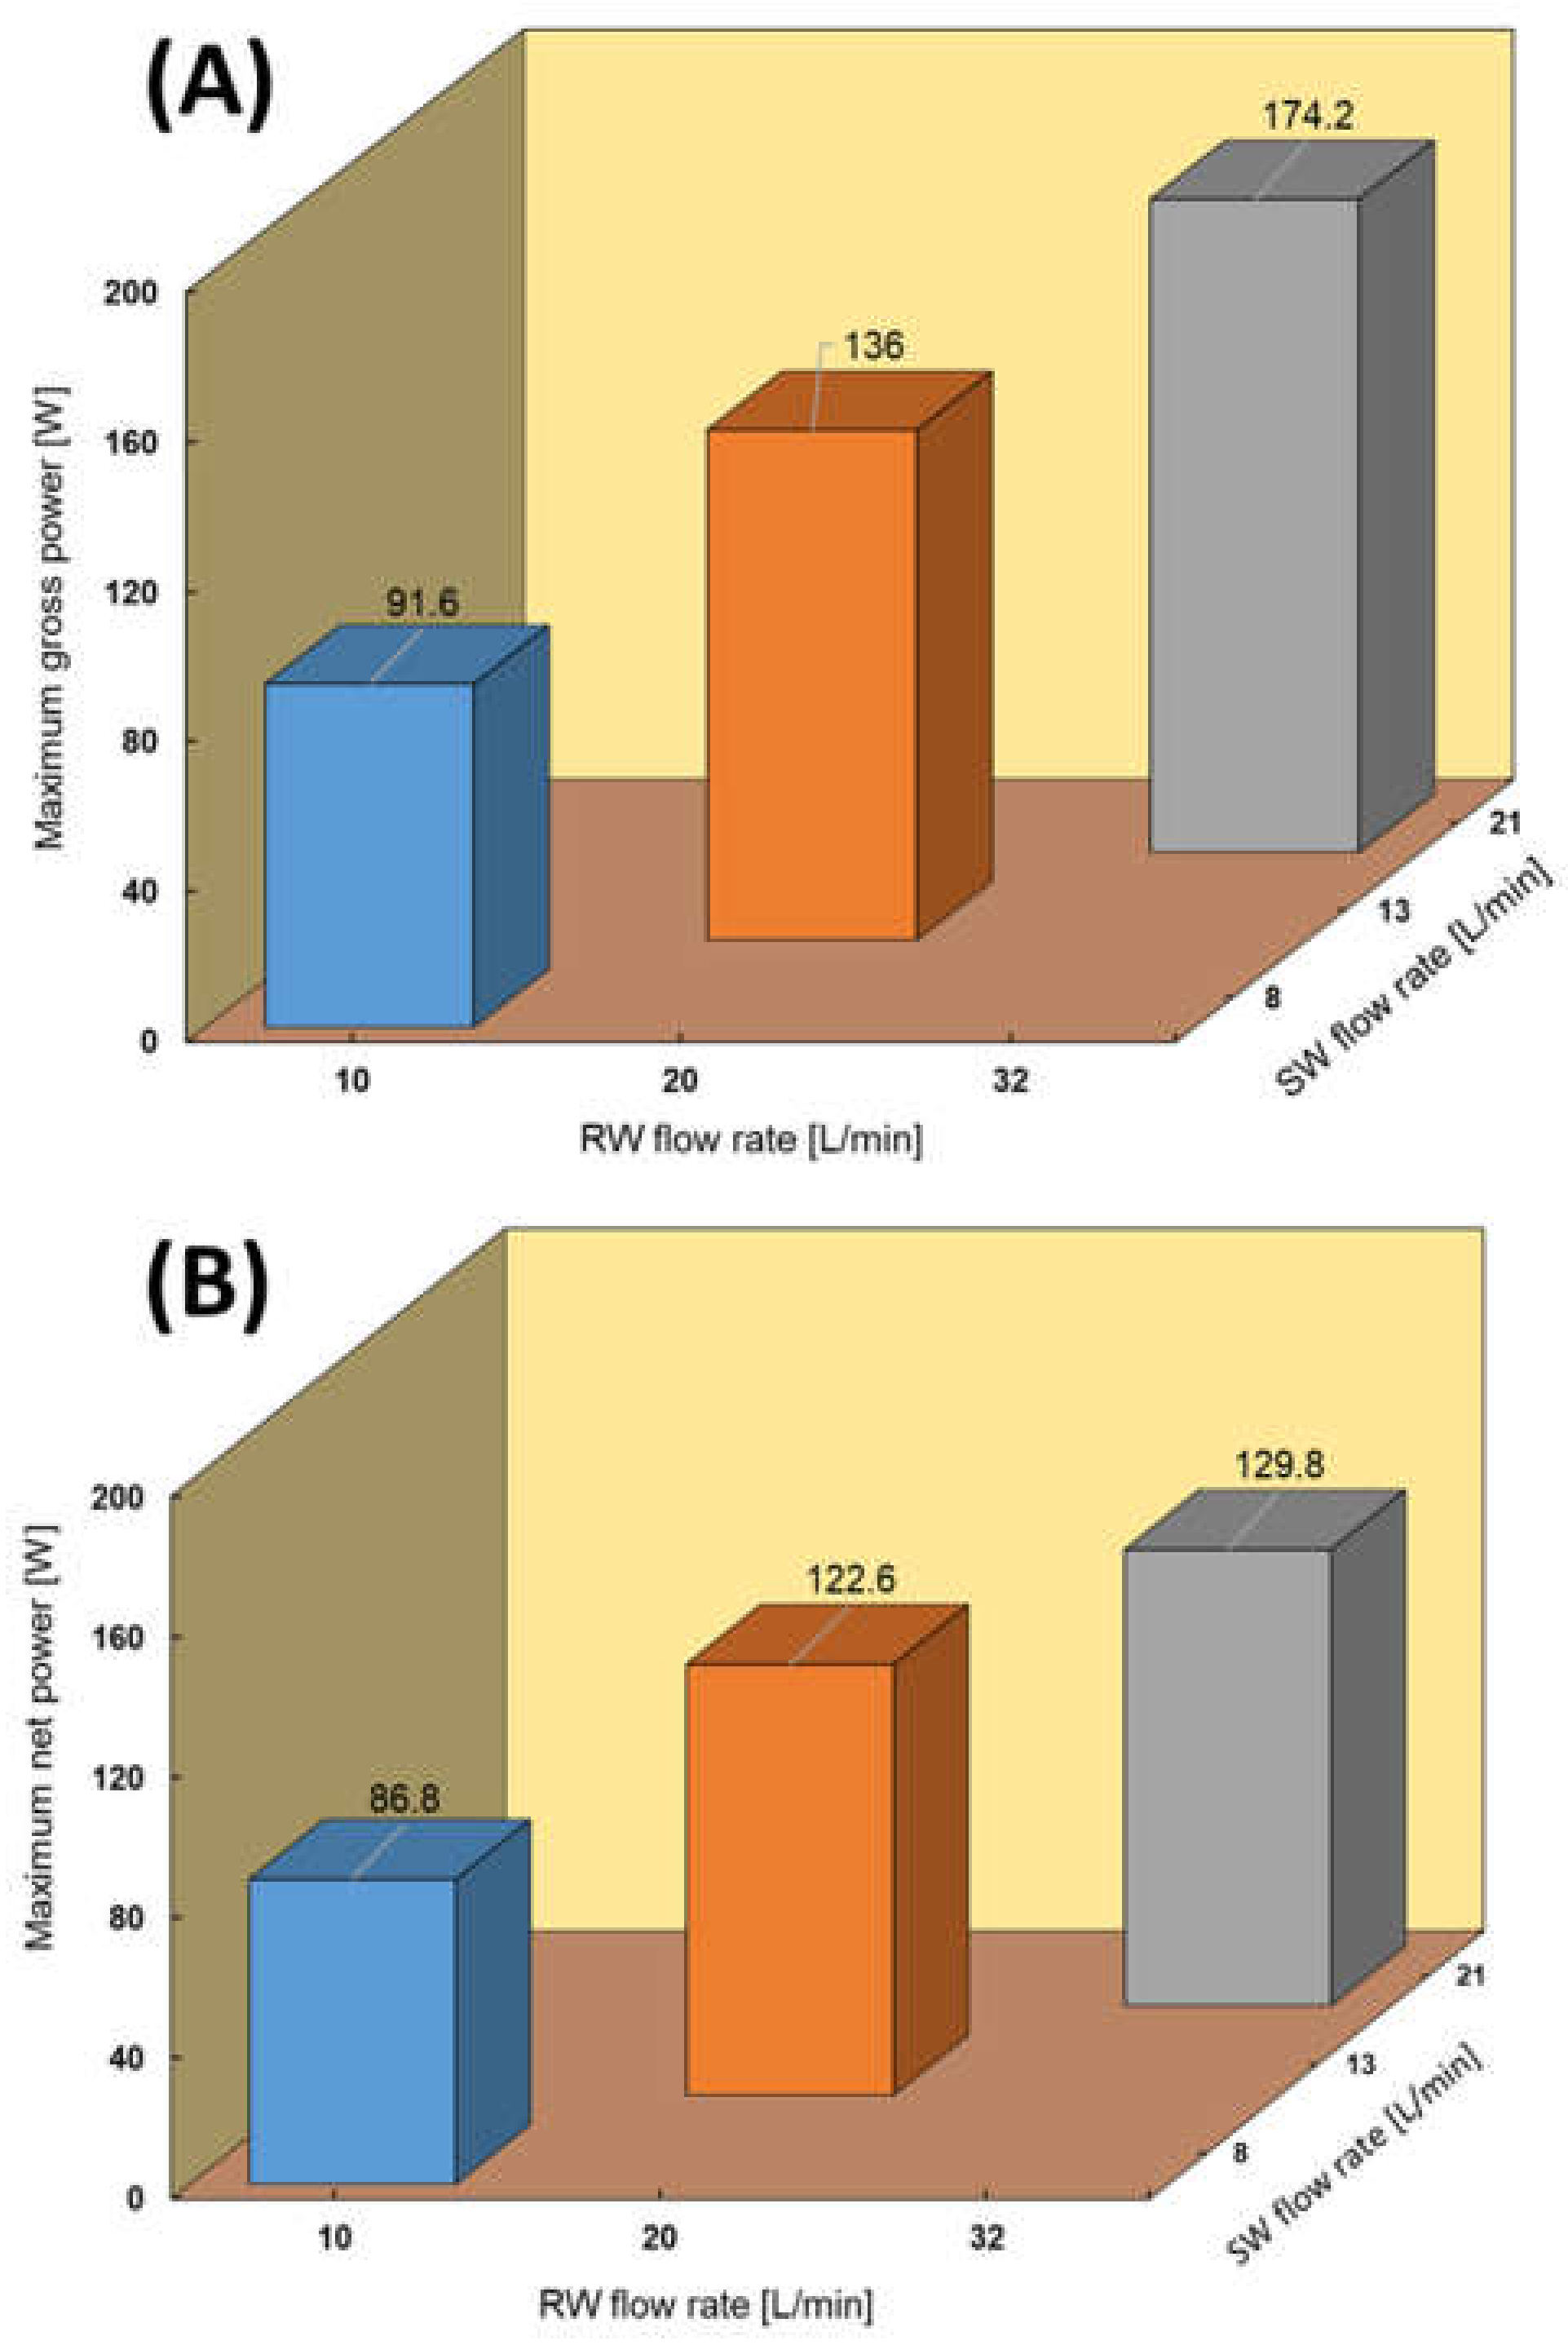
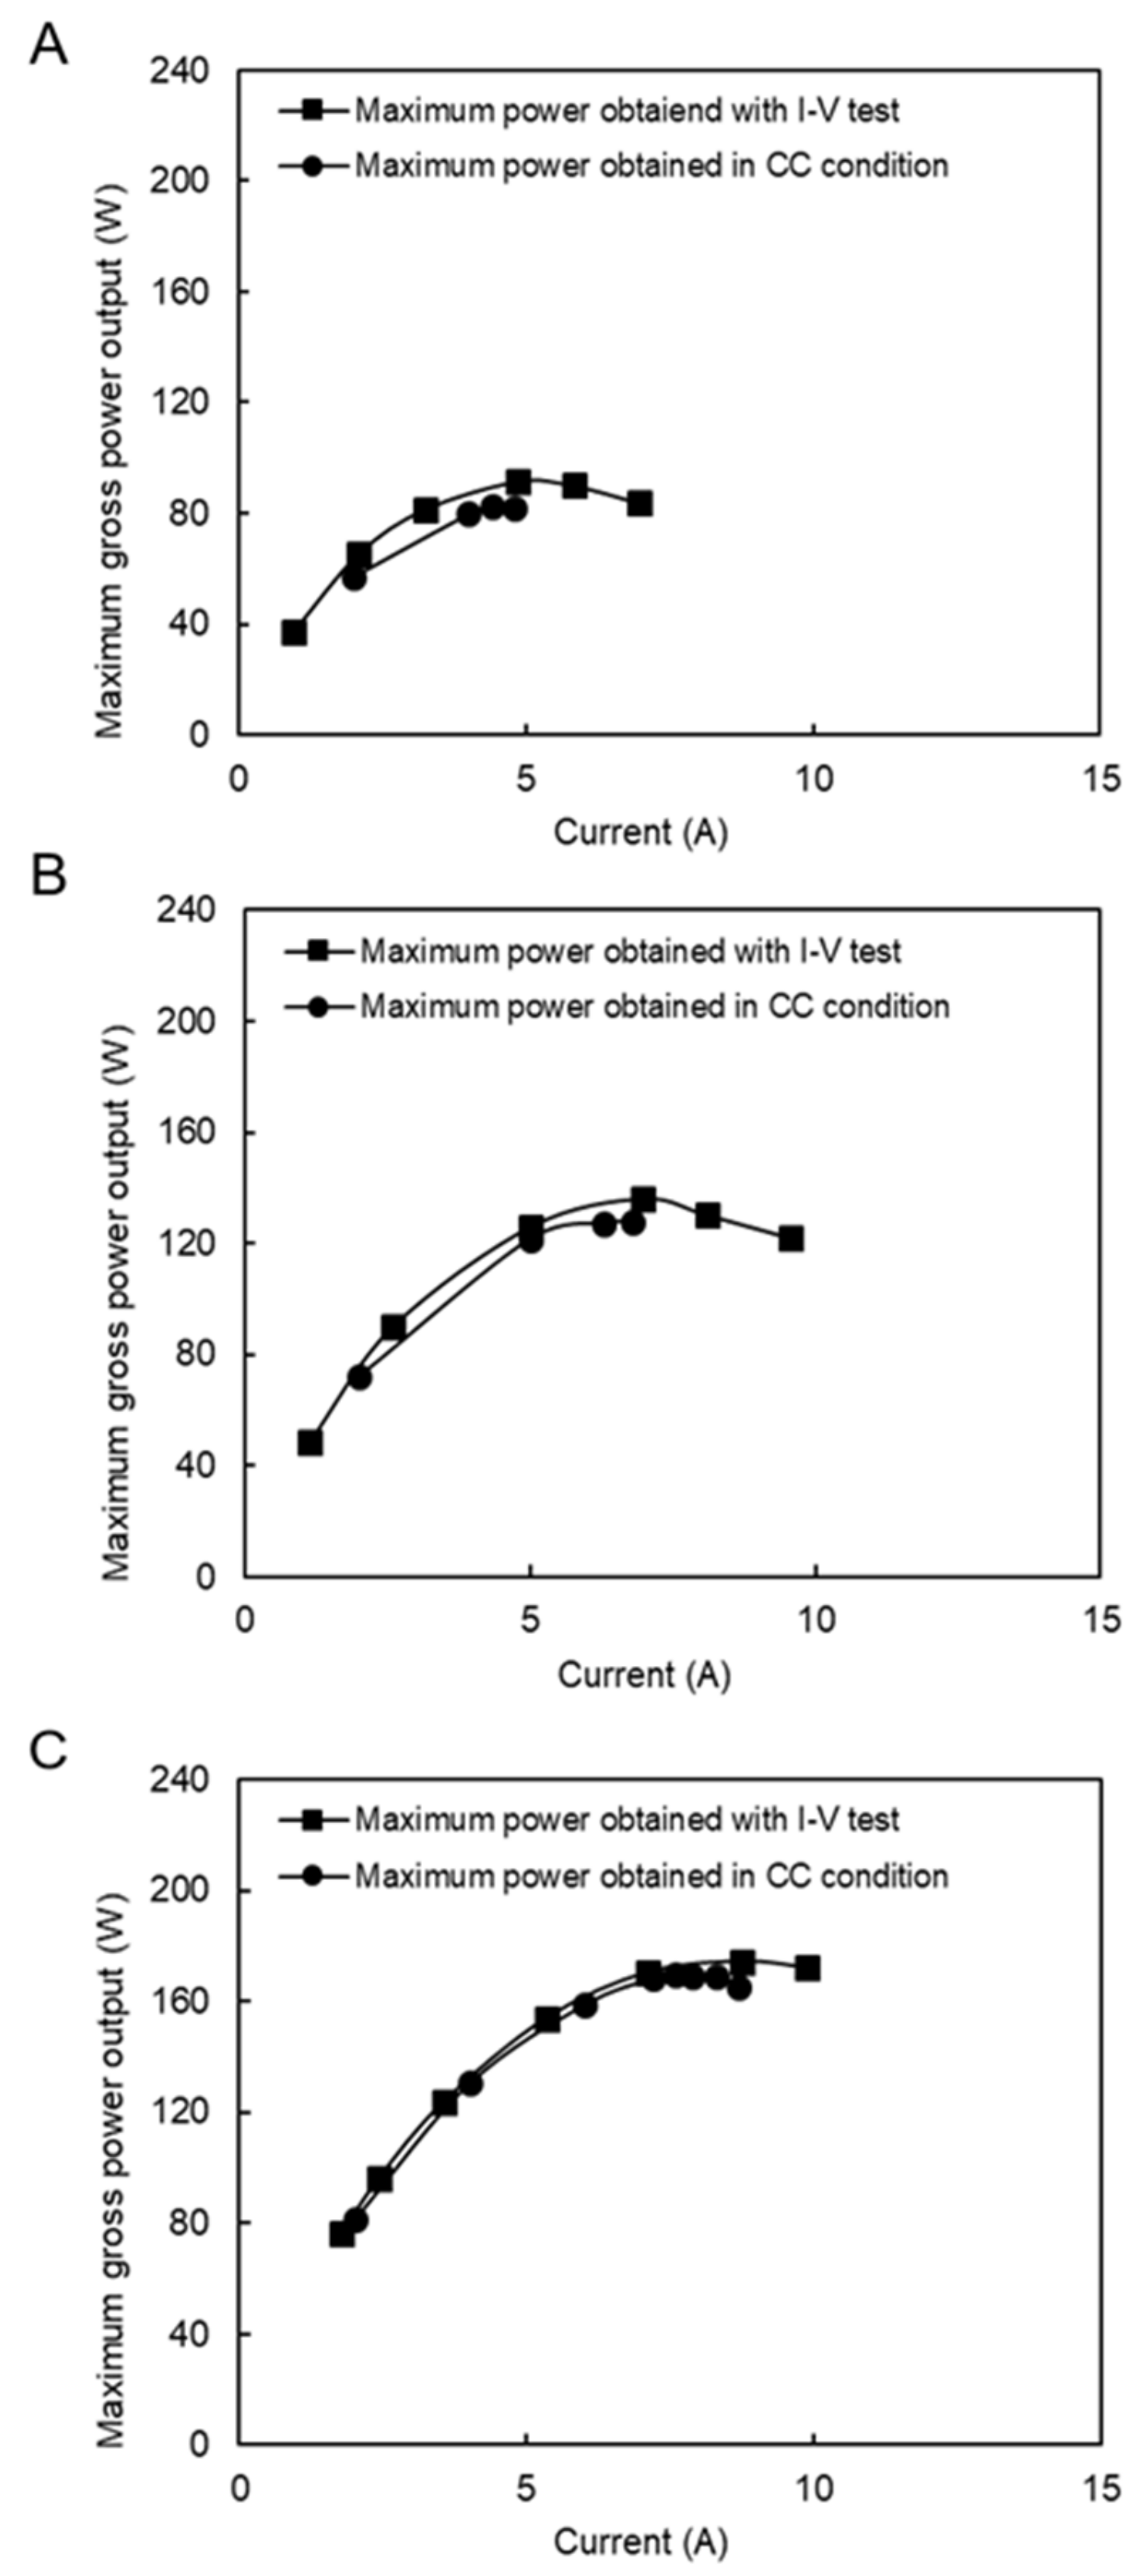
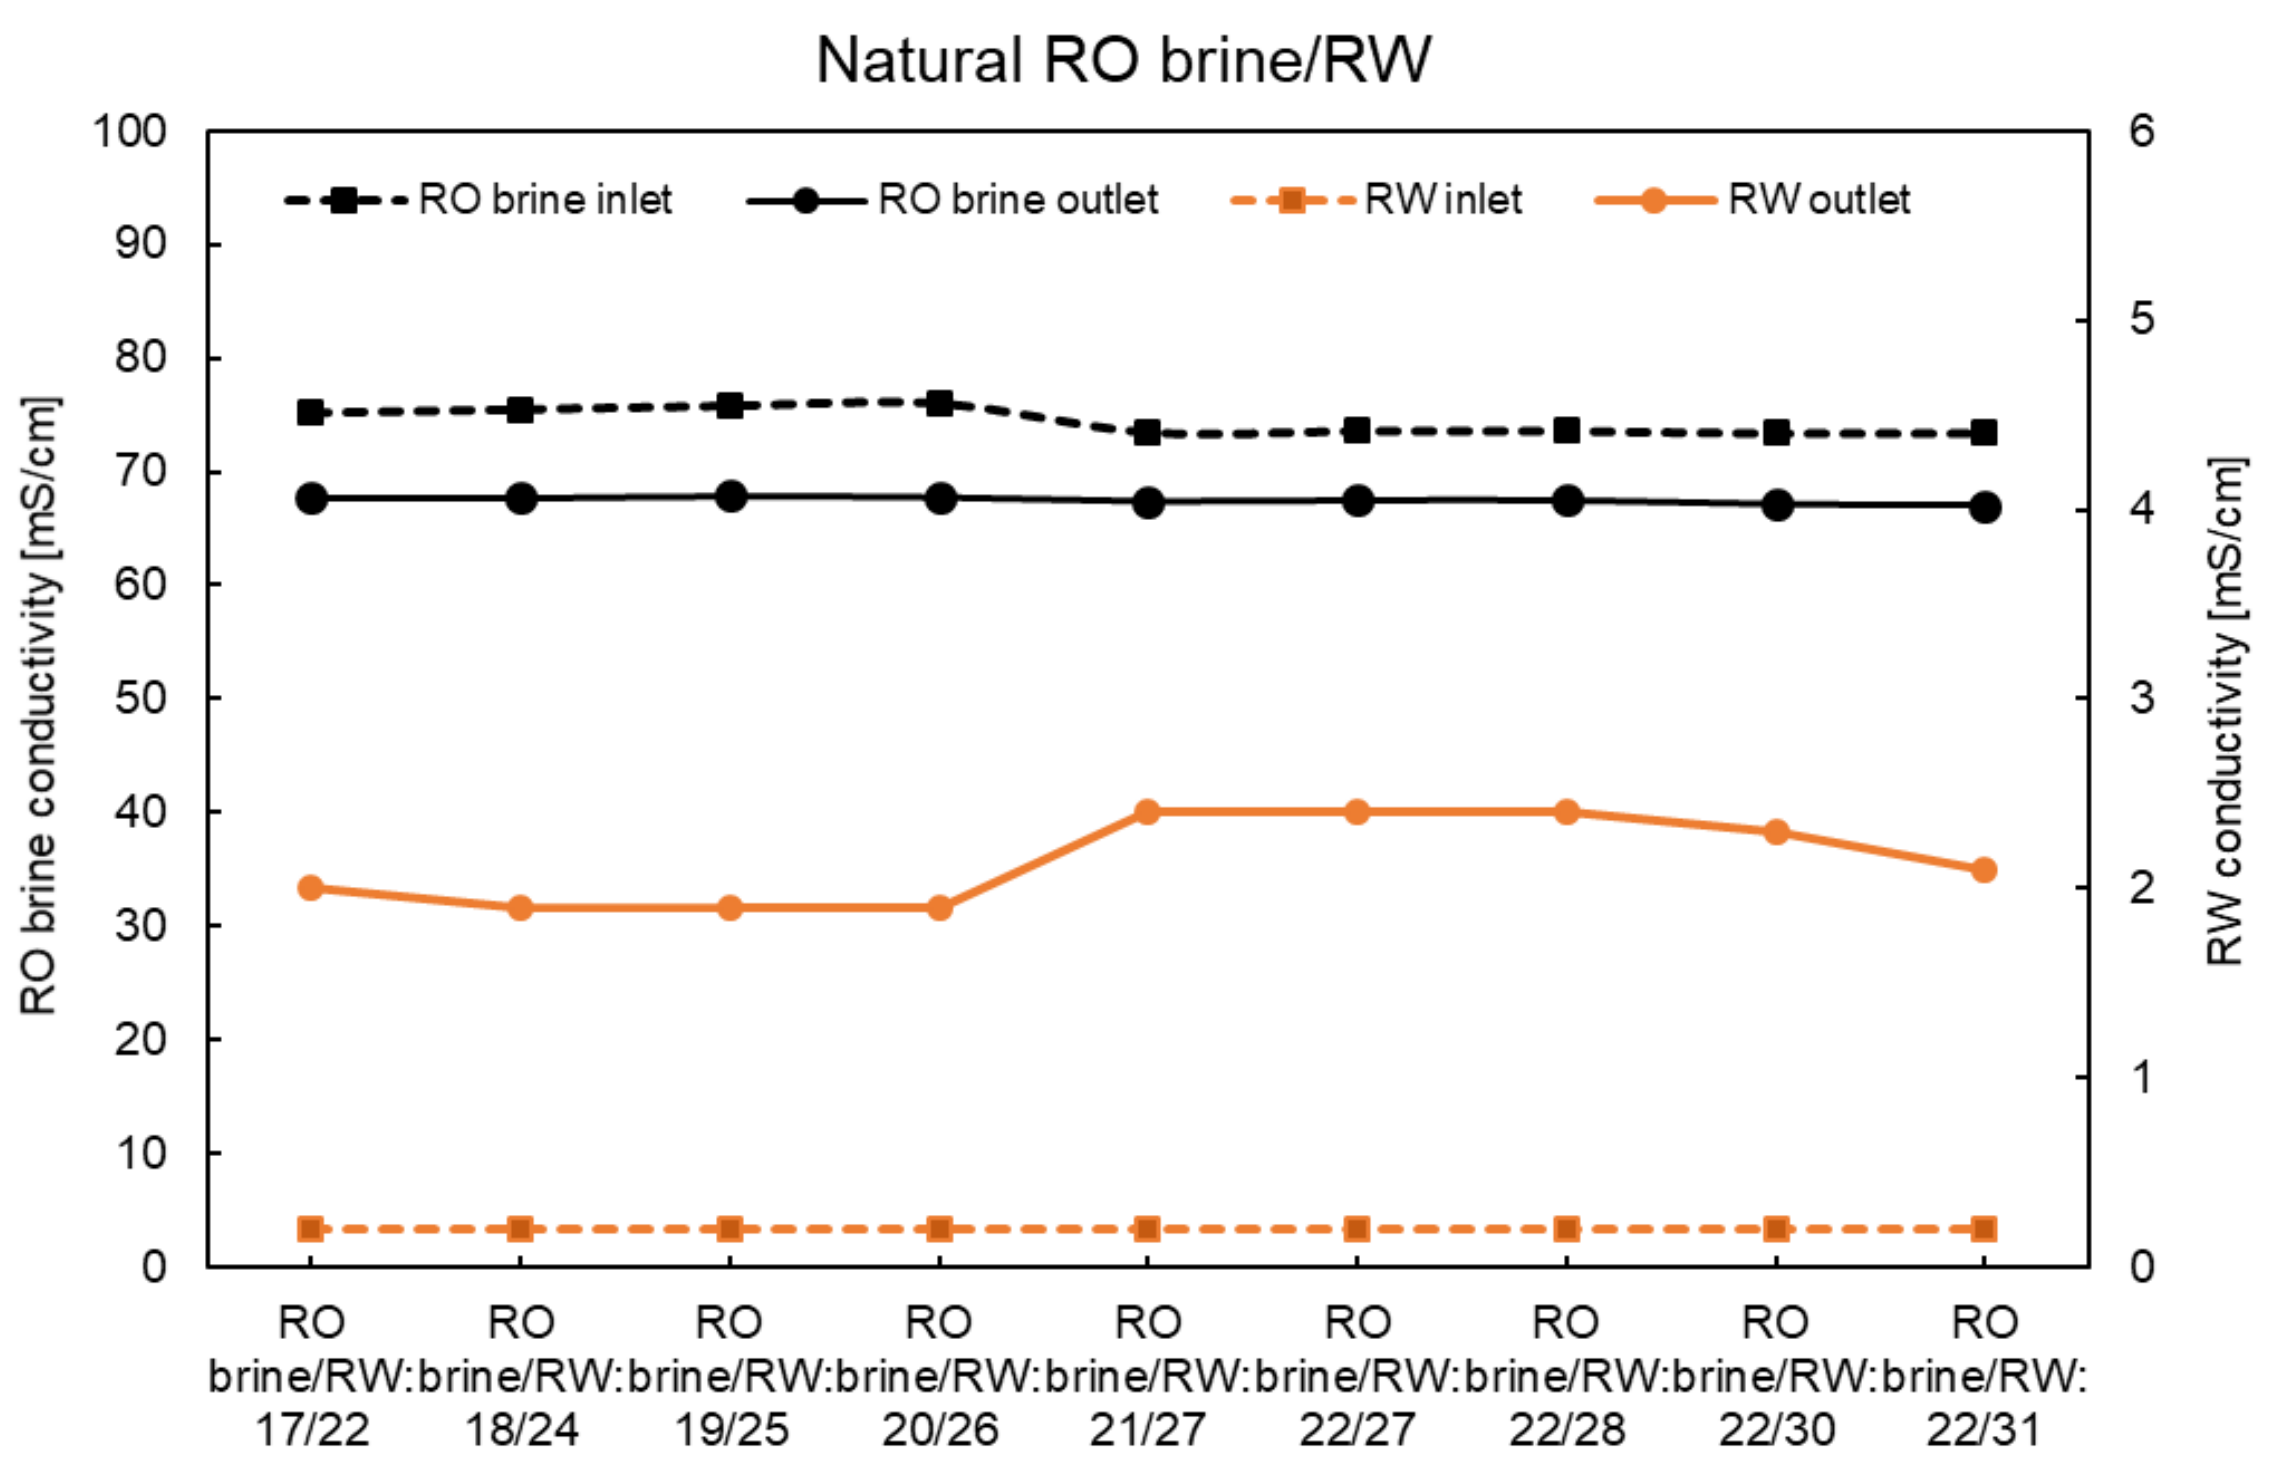
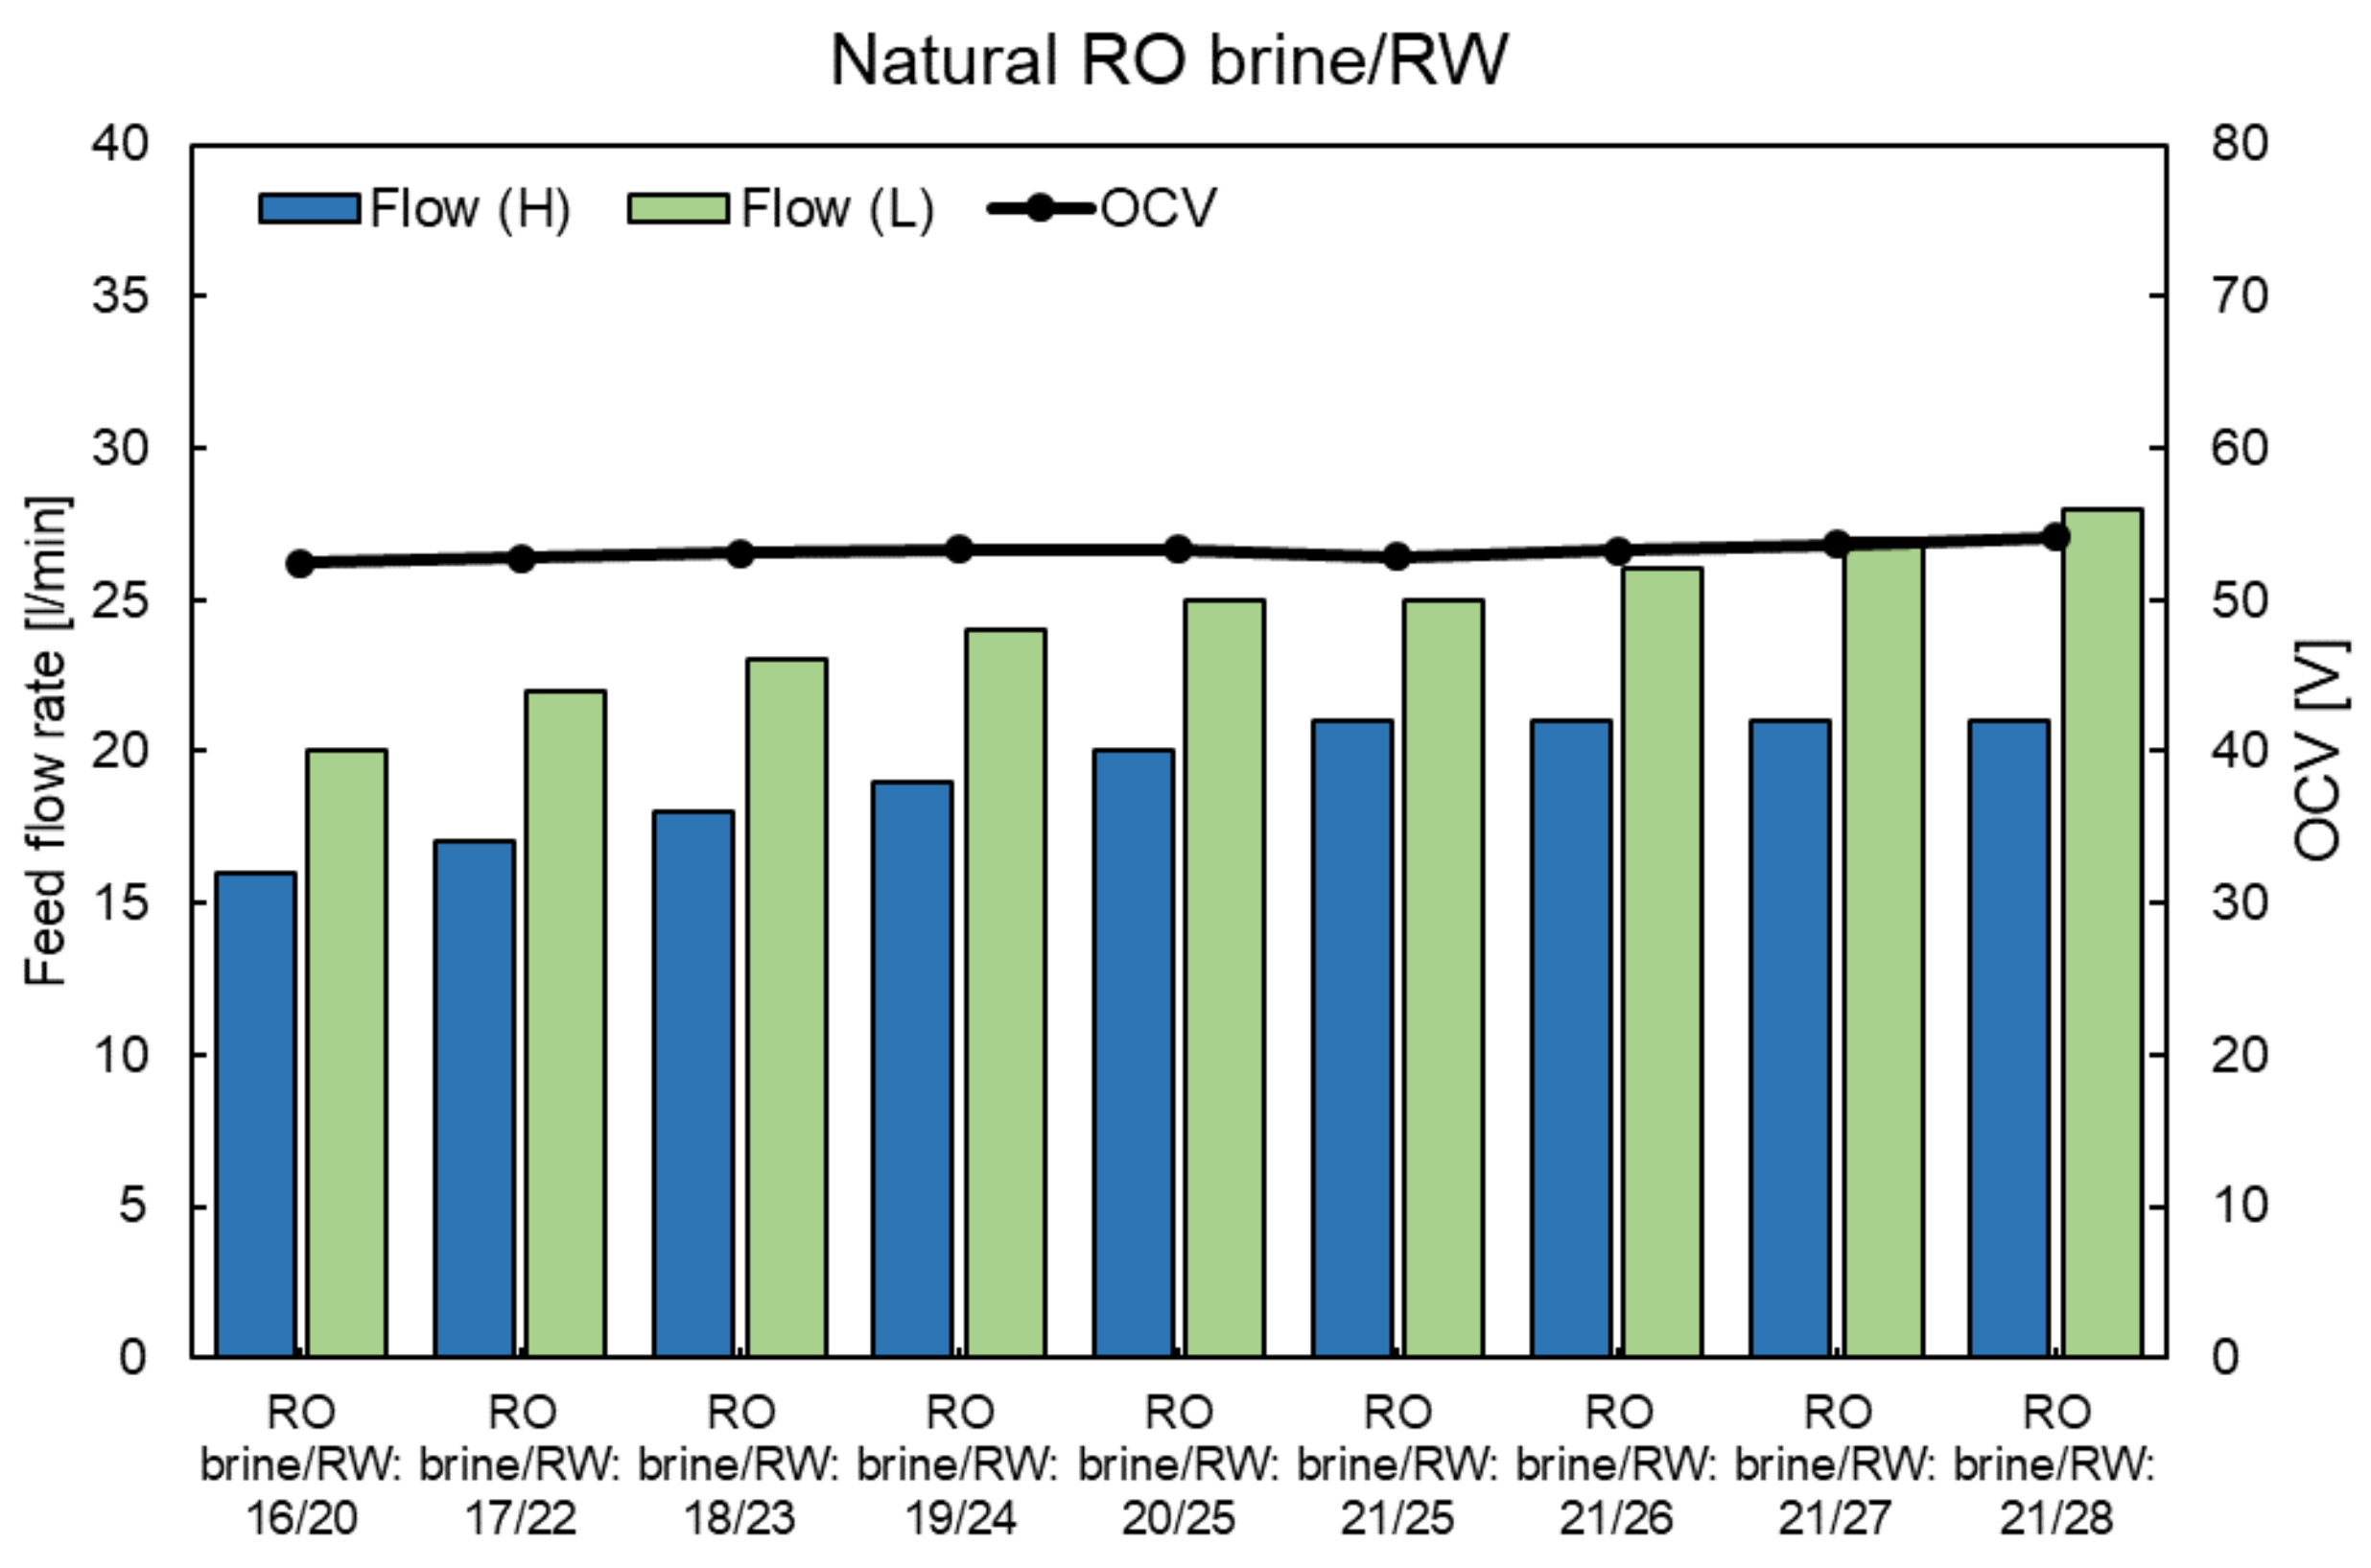
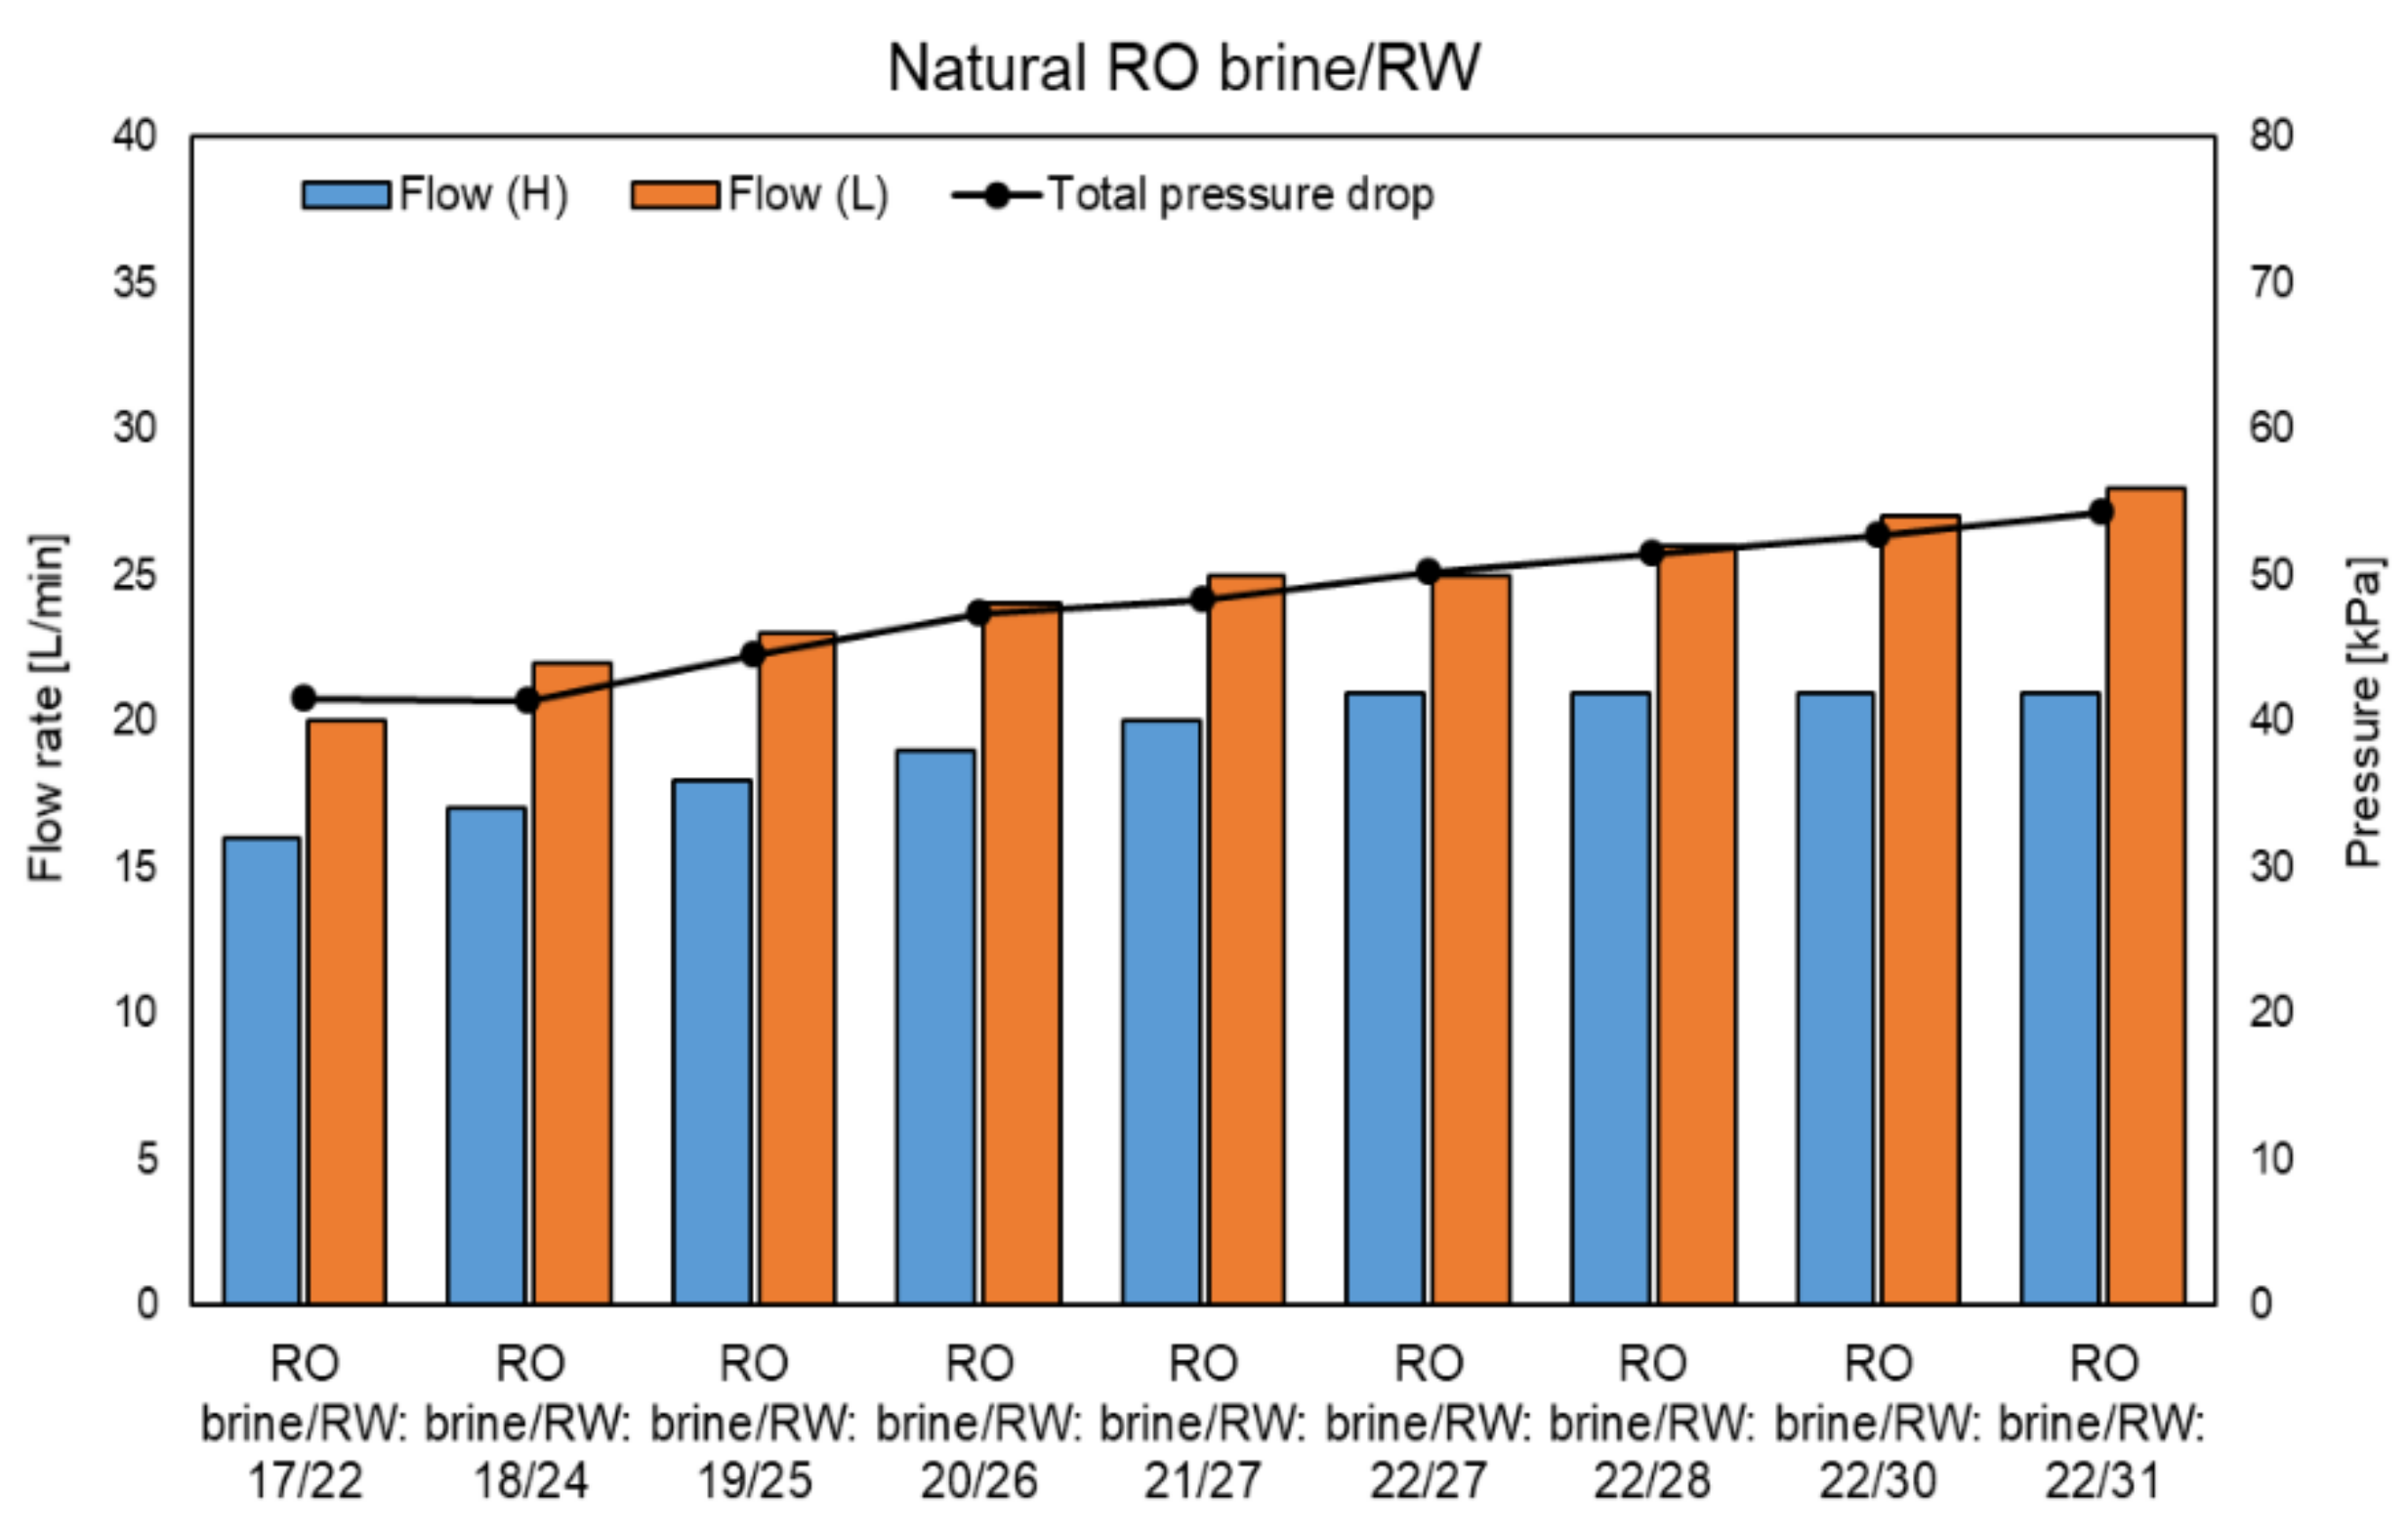
4.3. RED Performance Using the Natural RO Brine and RW
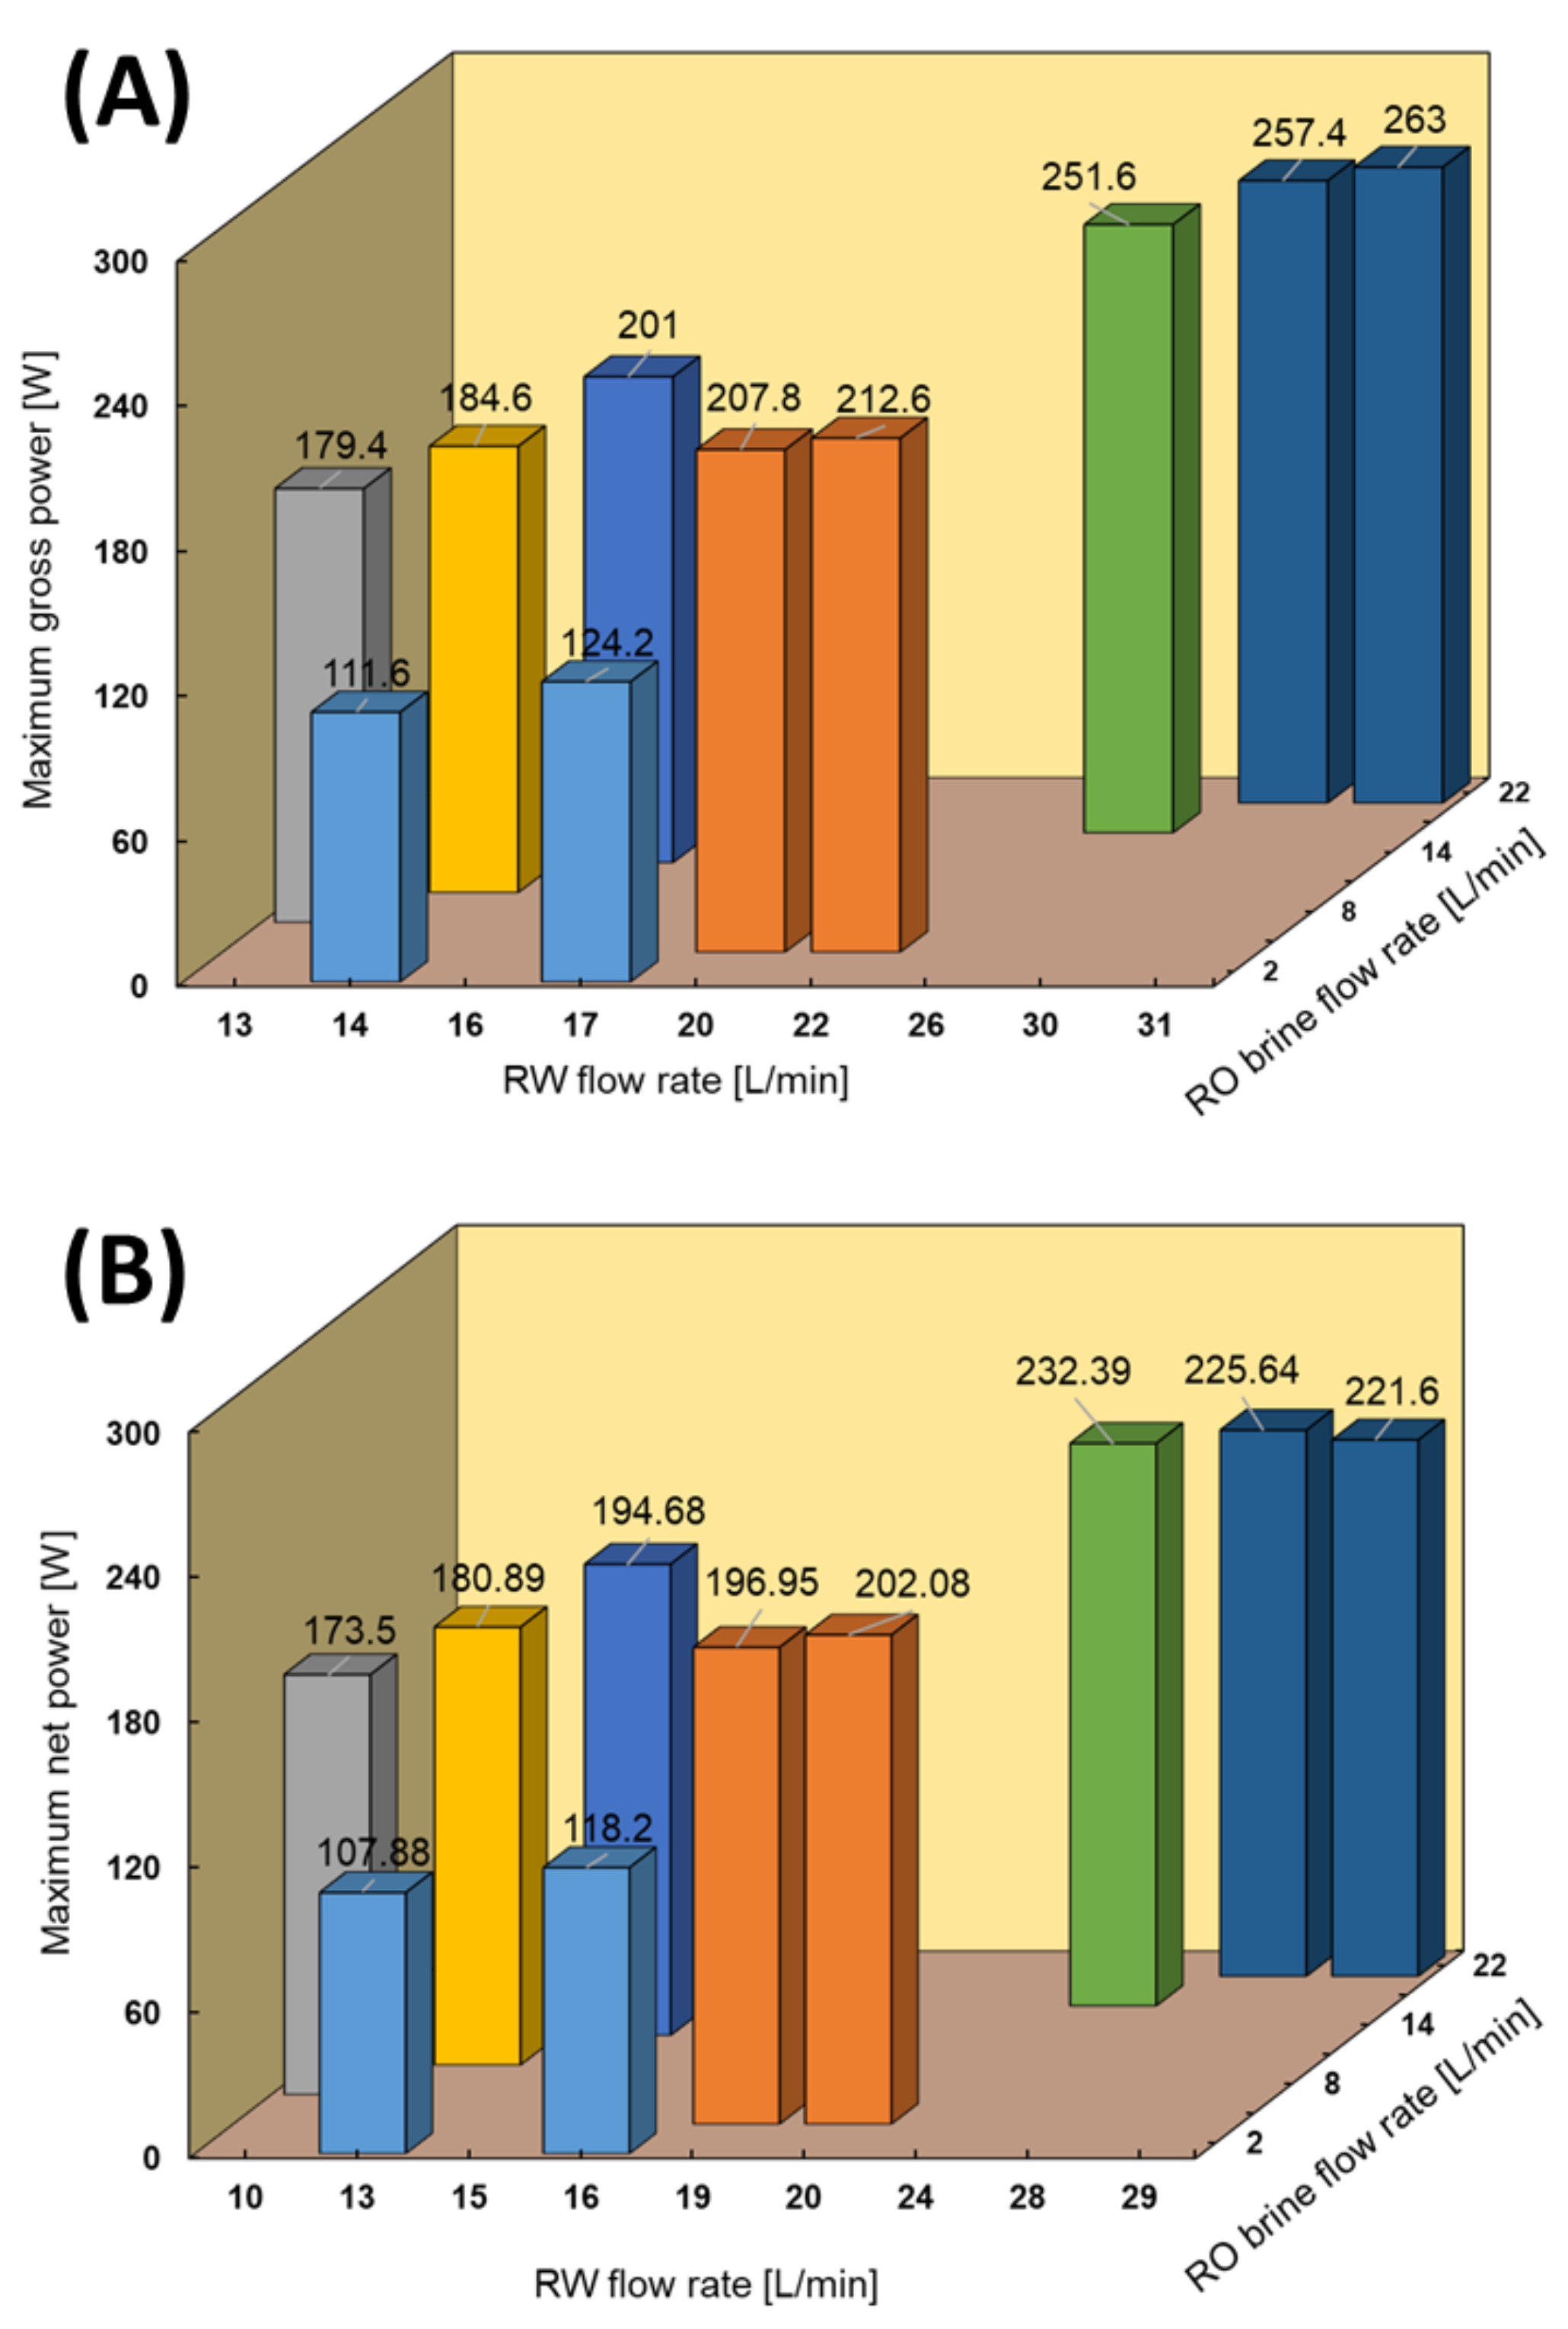
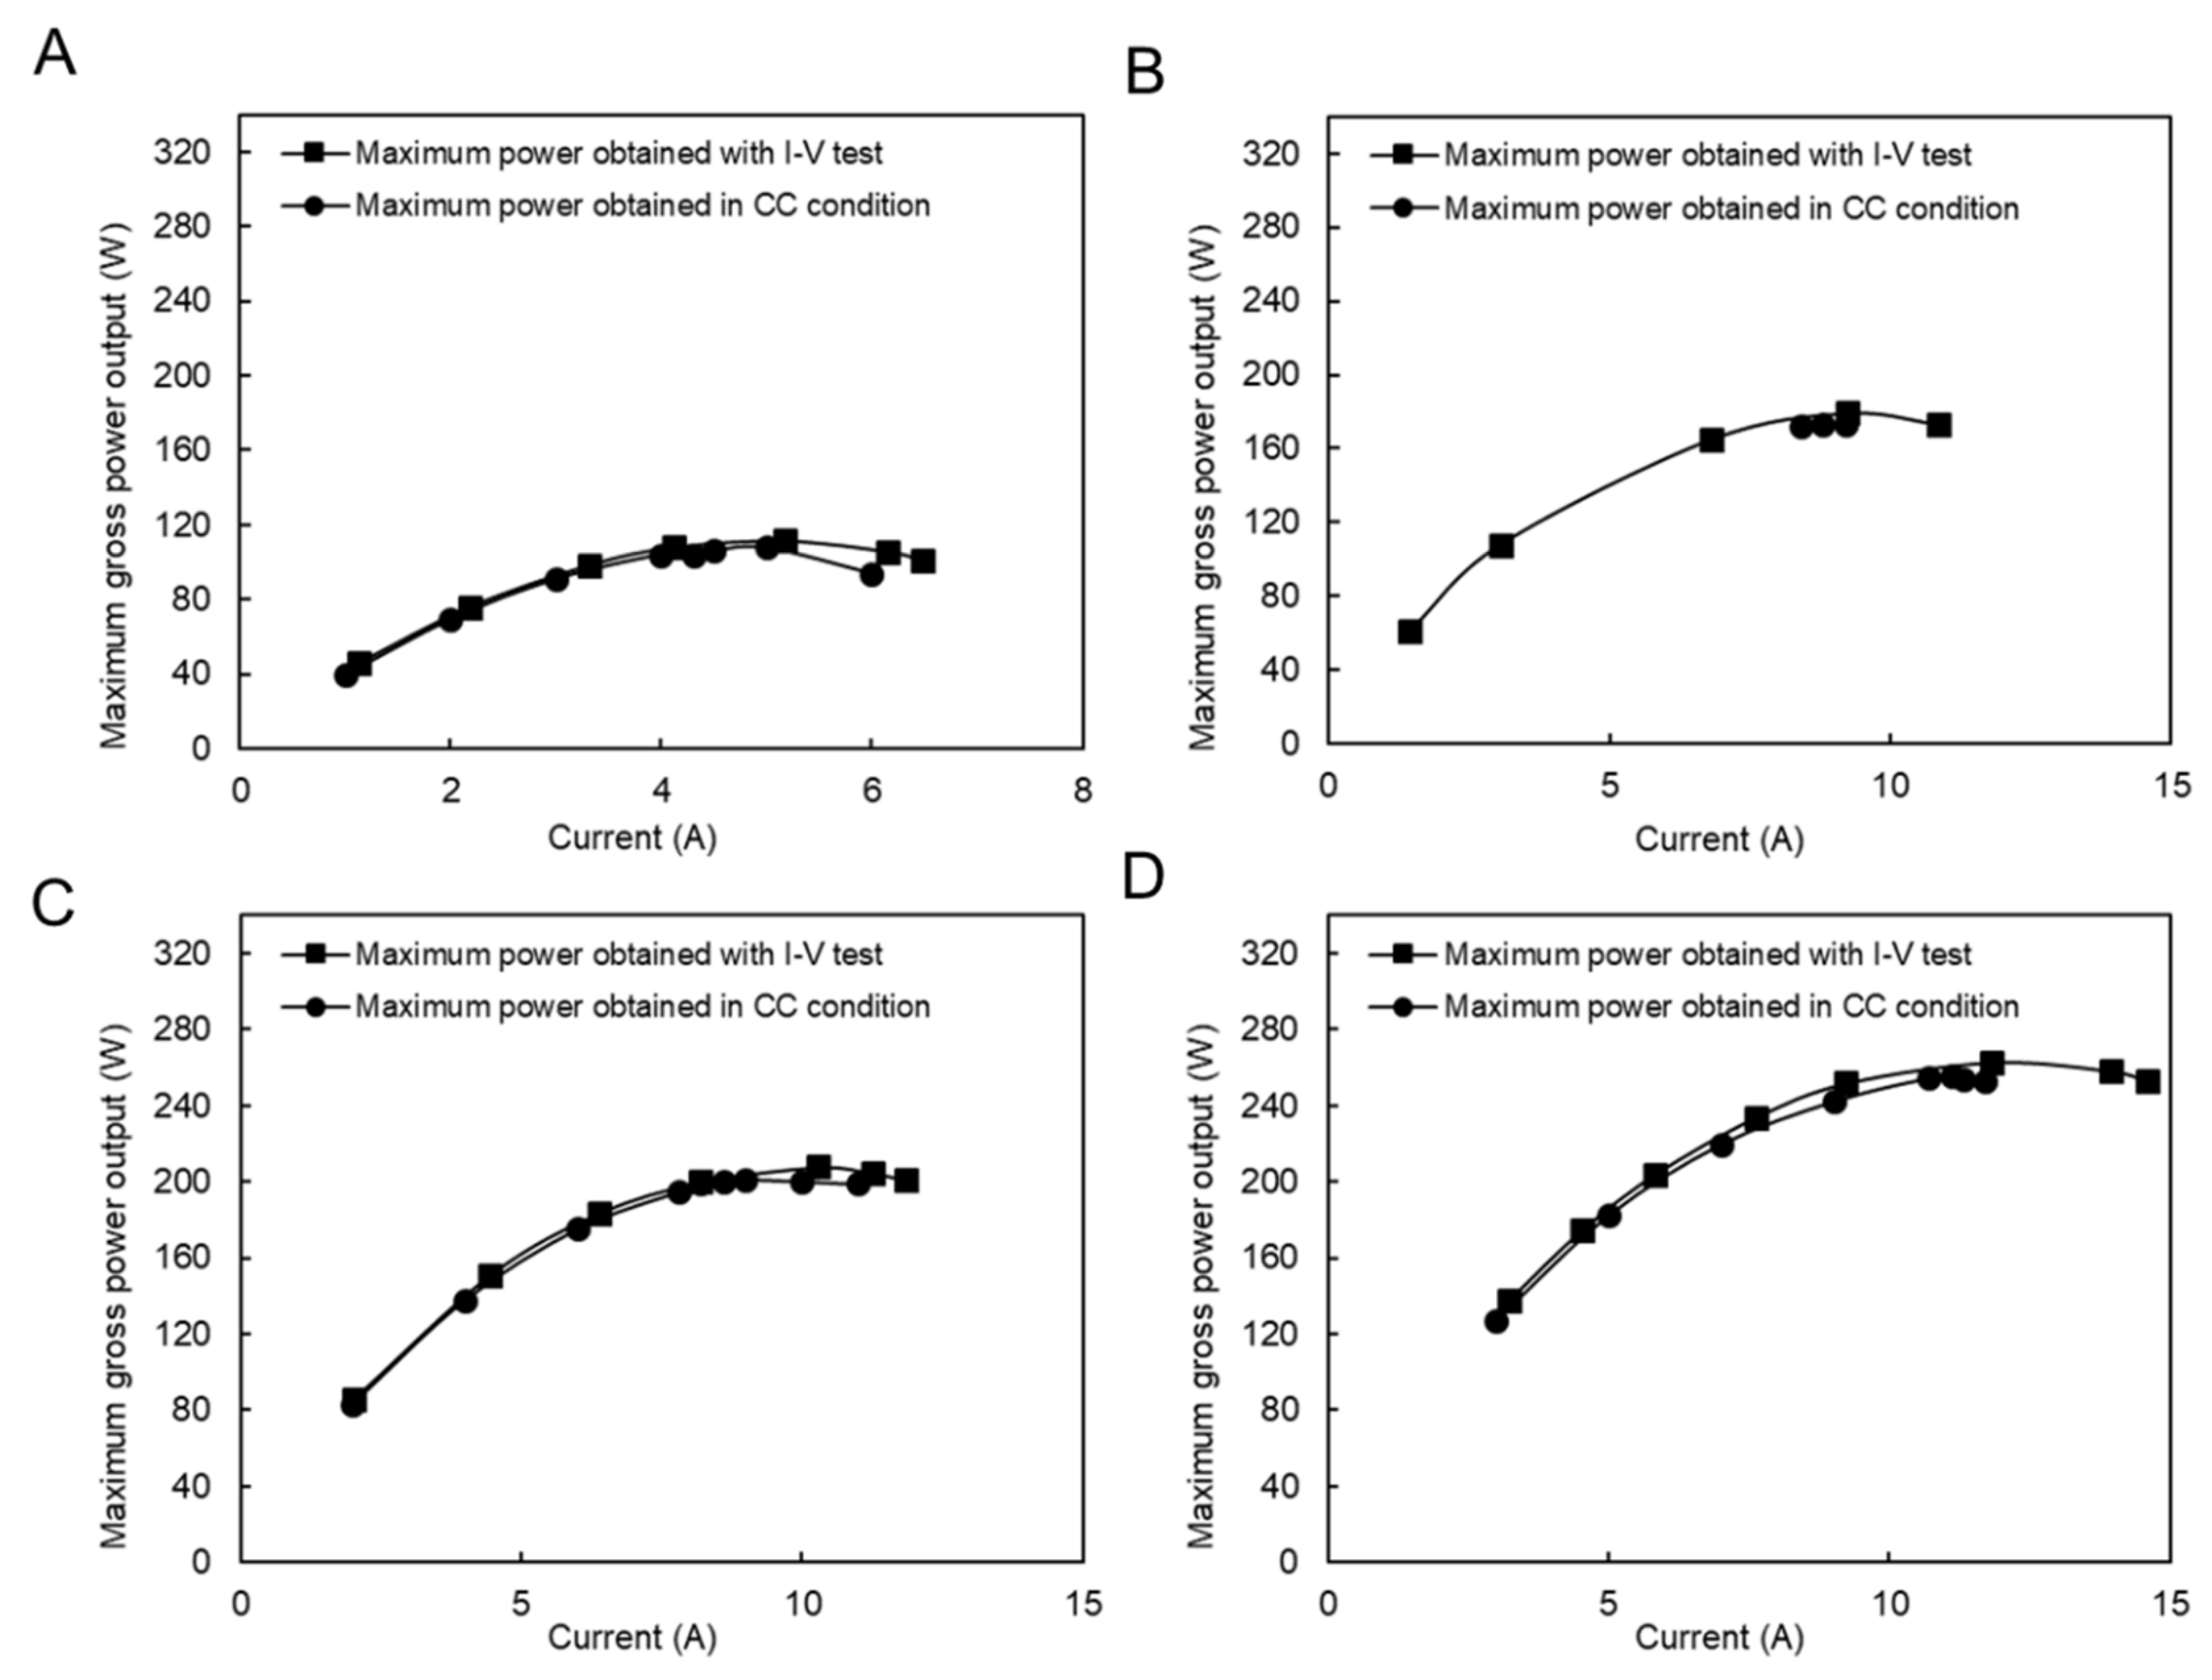
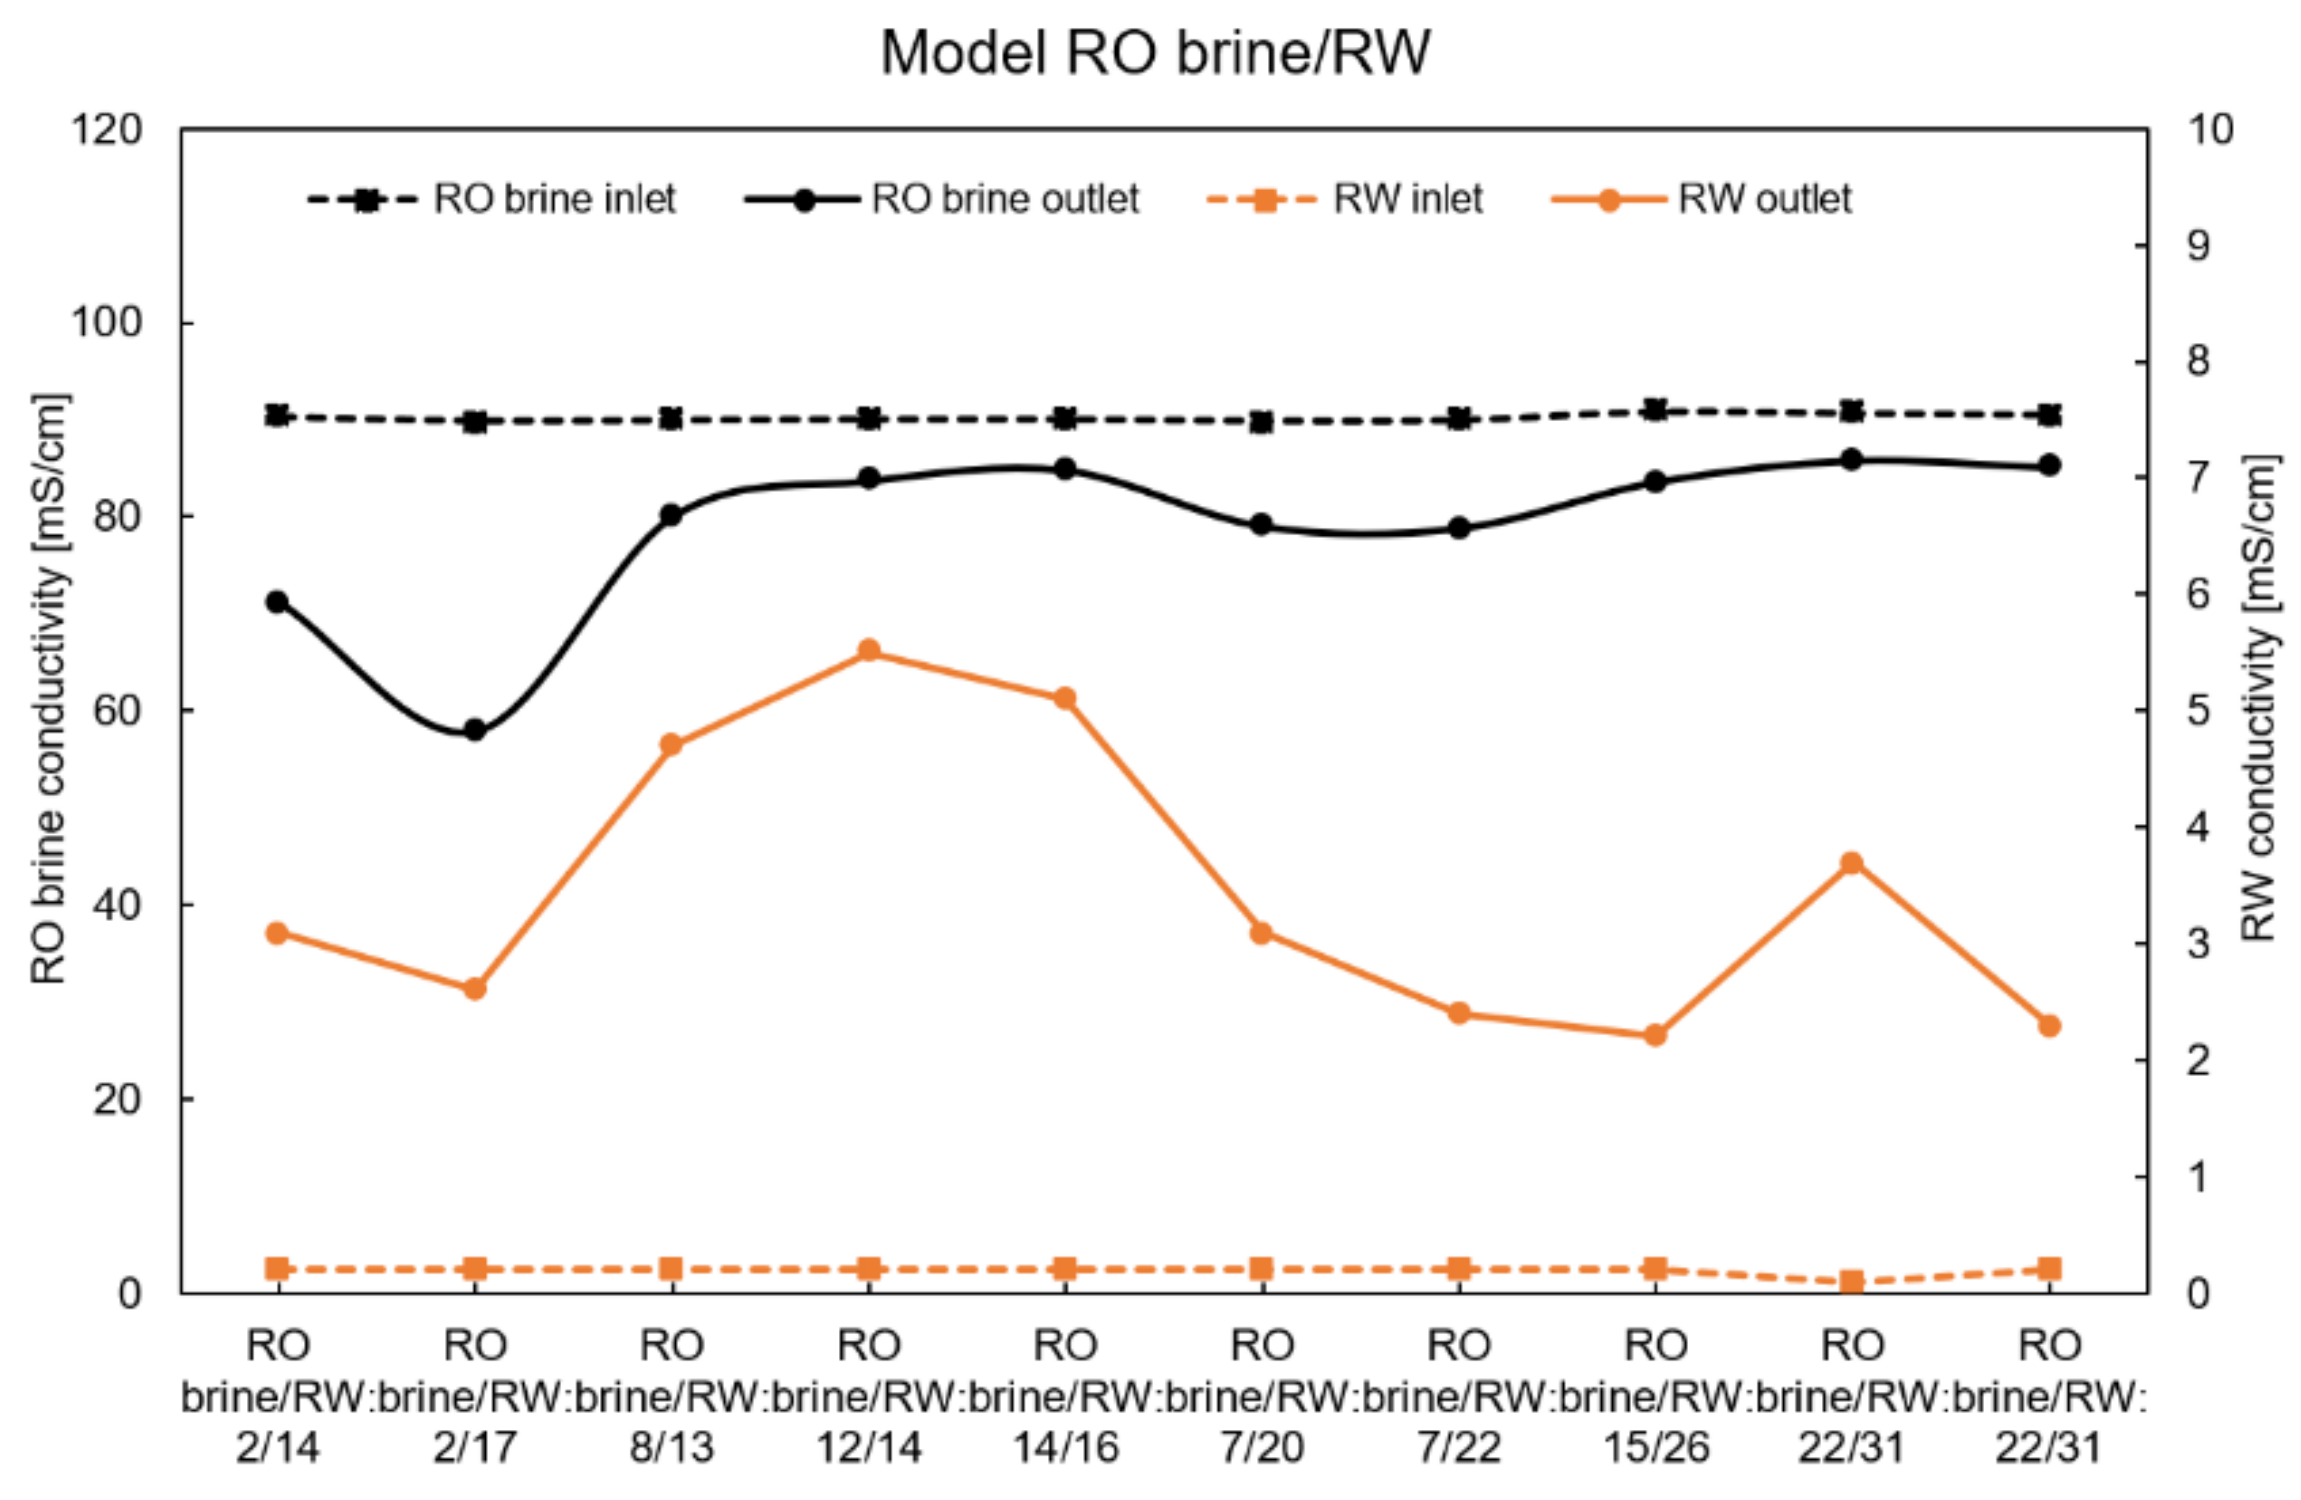
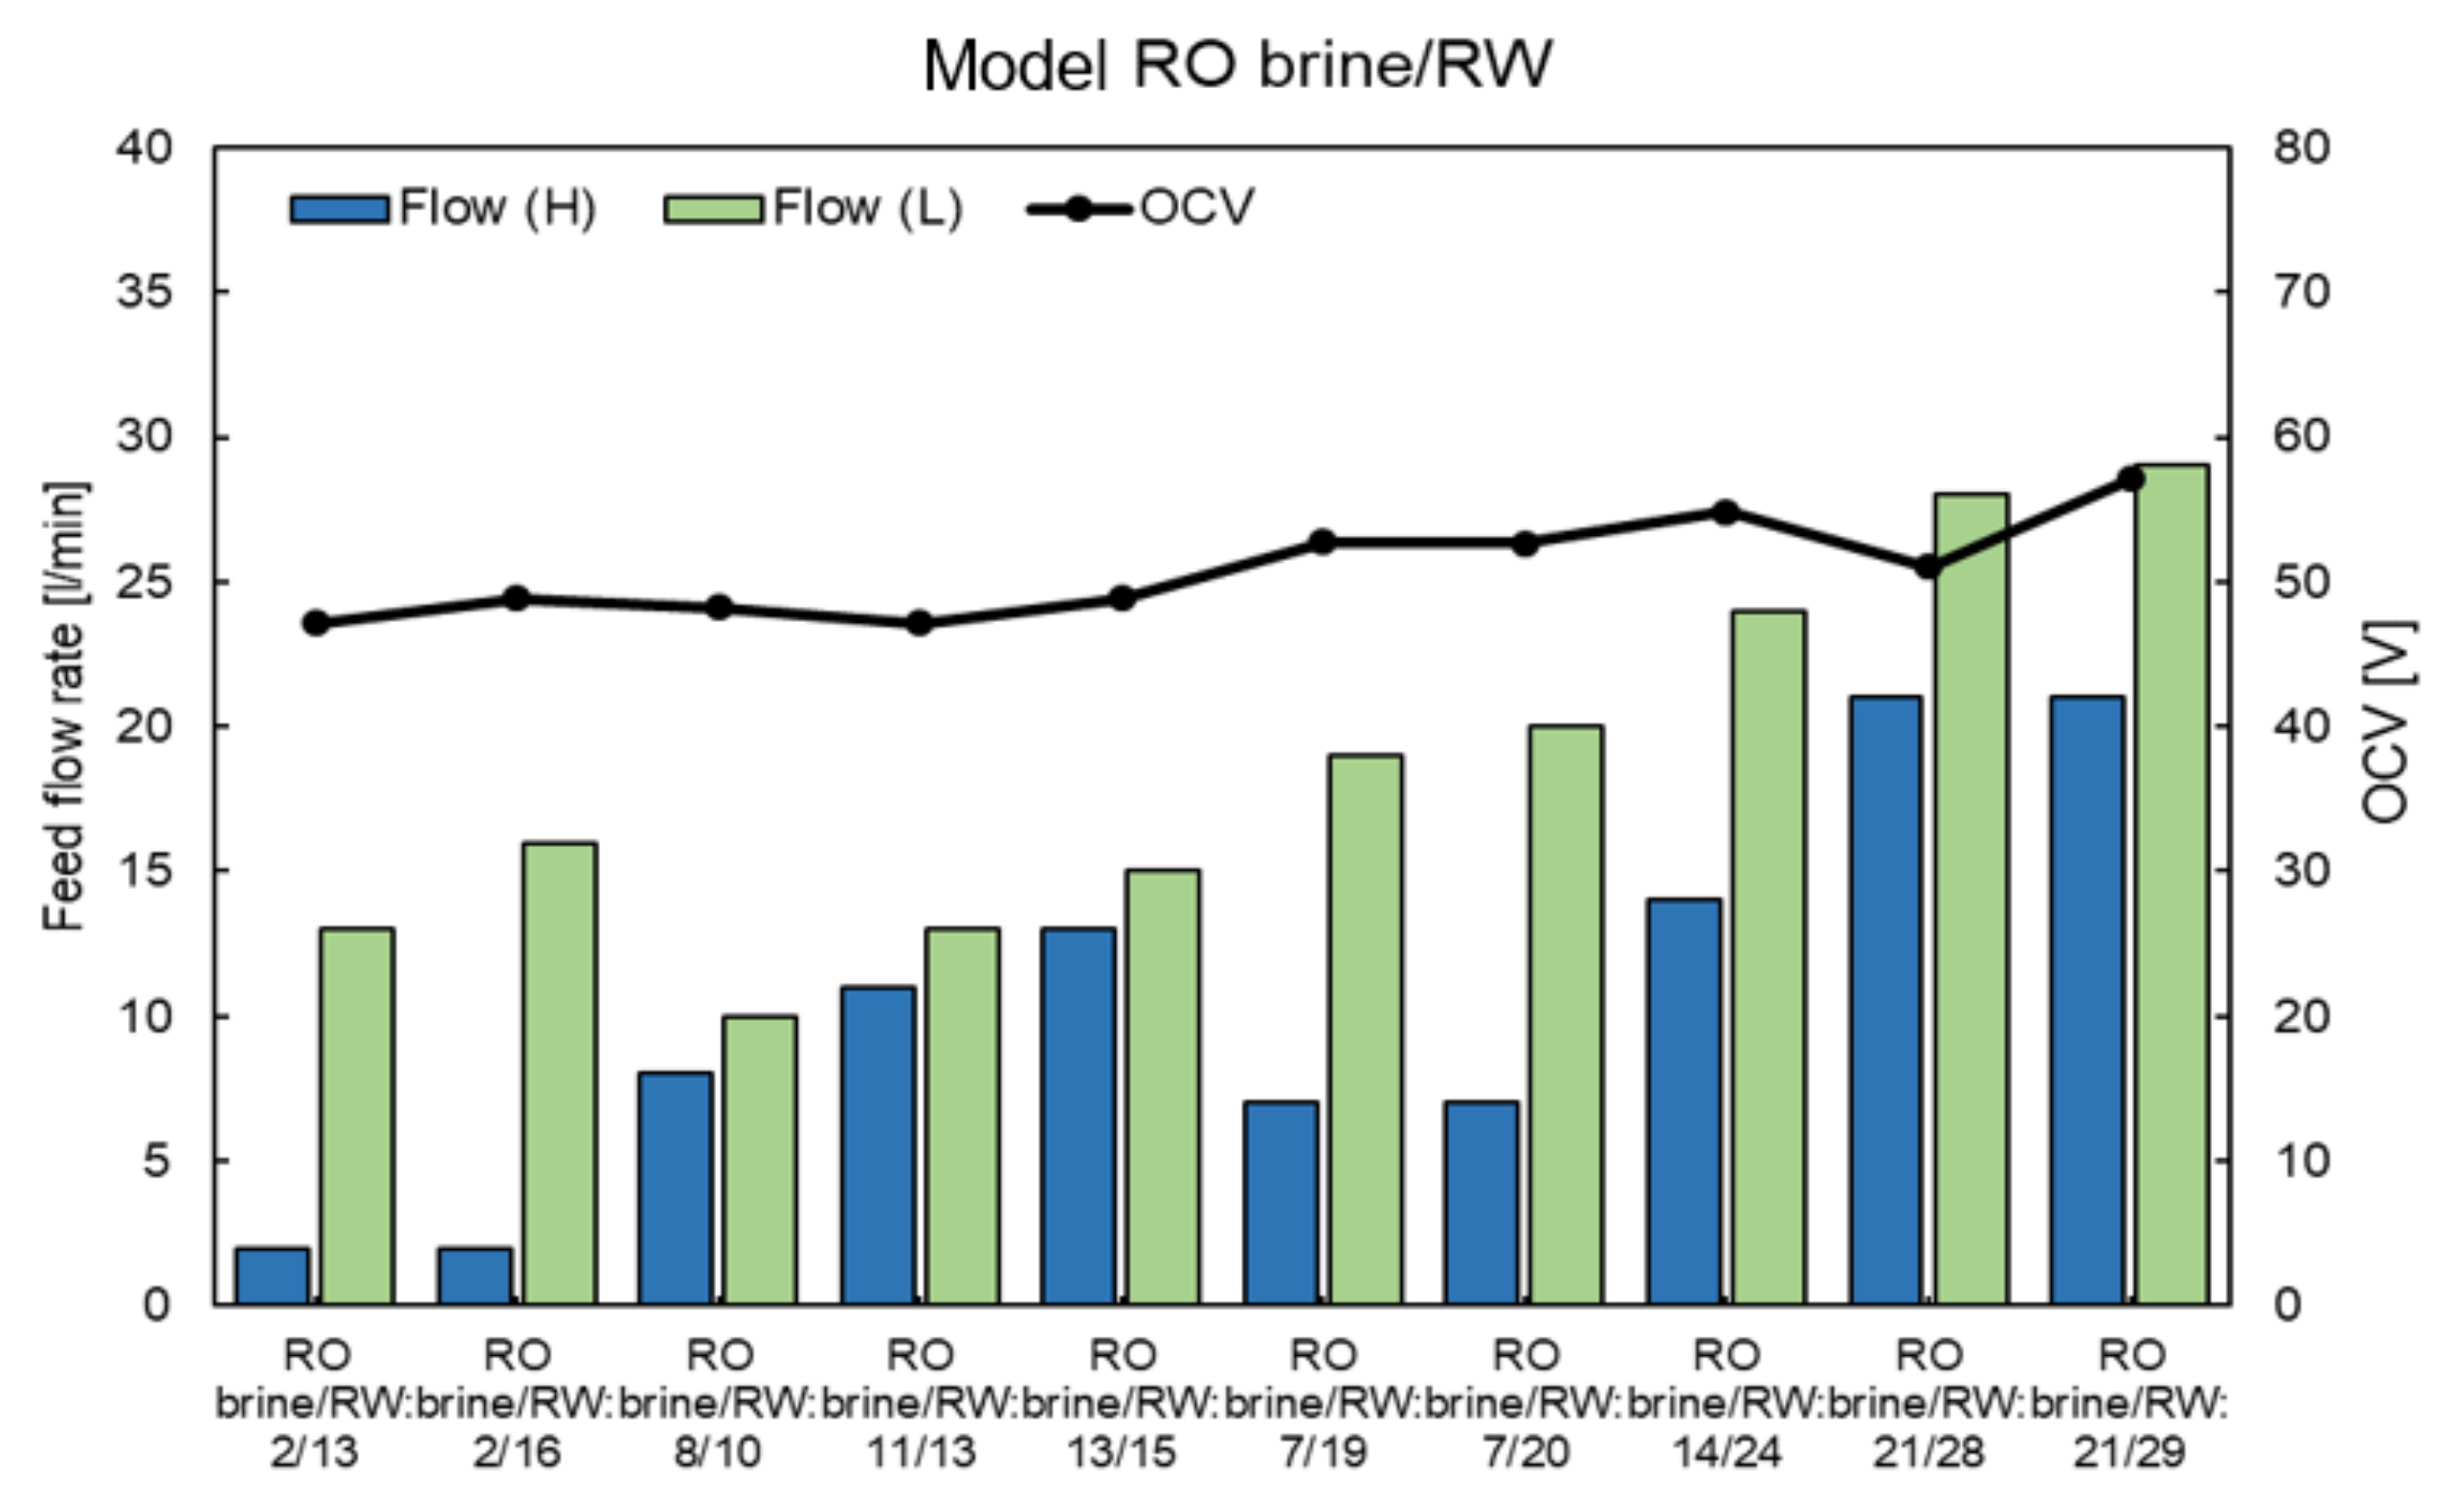
4.4. Performance with Model RO Brine and RW
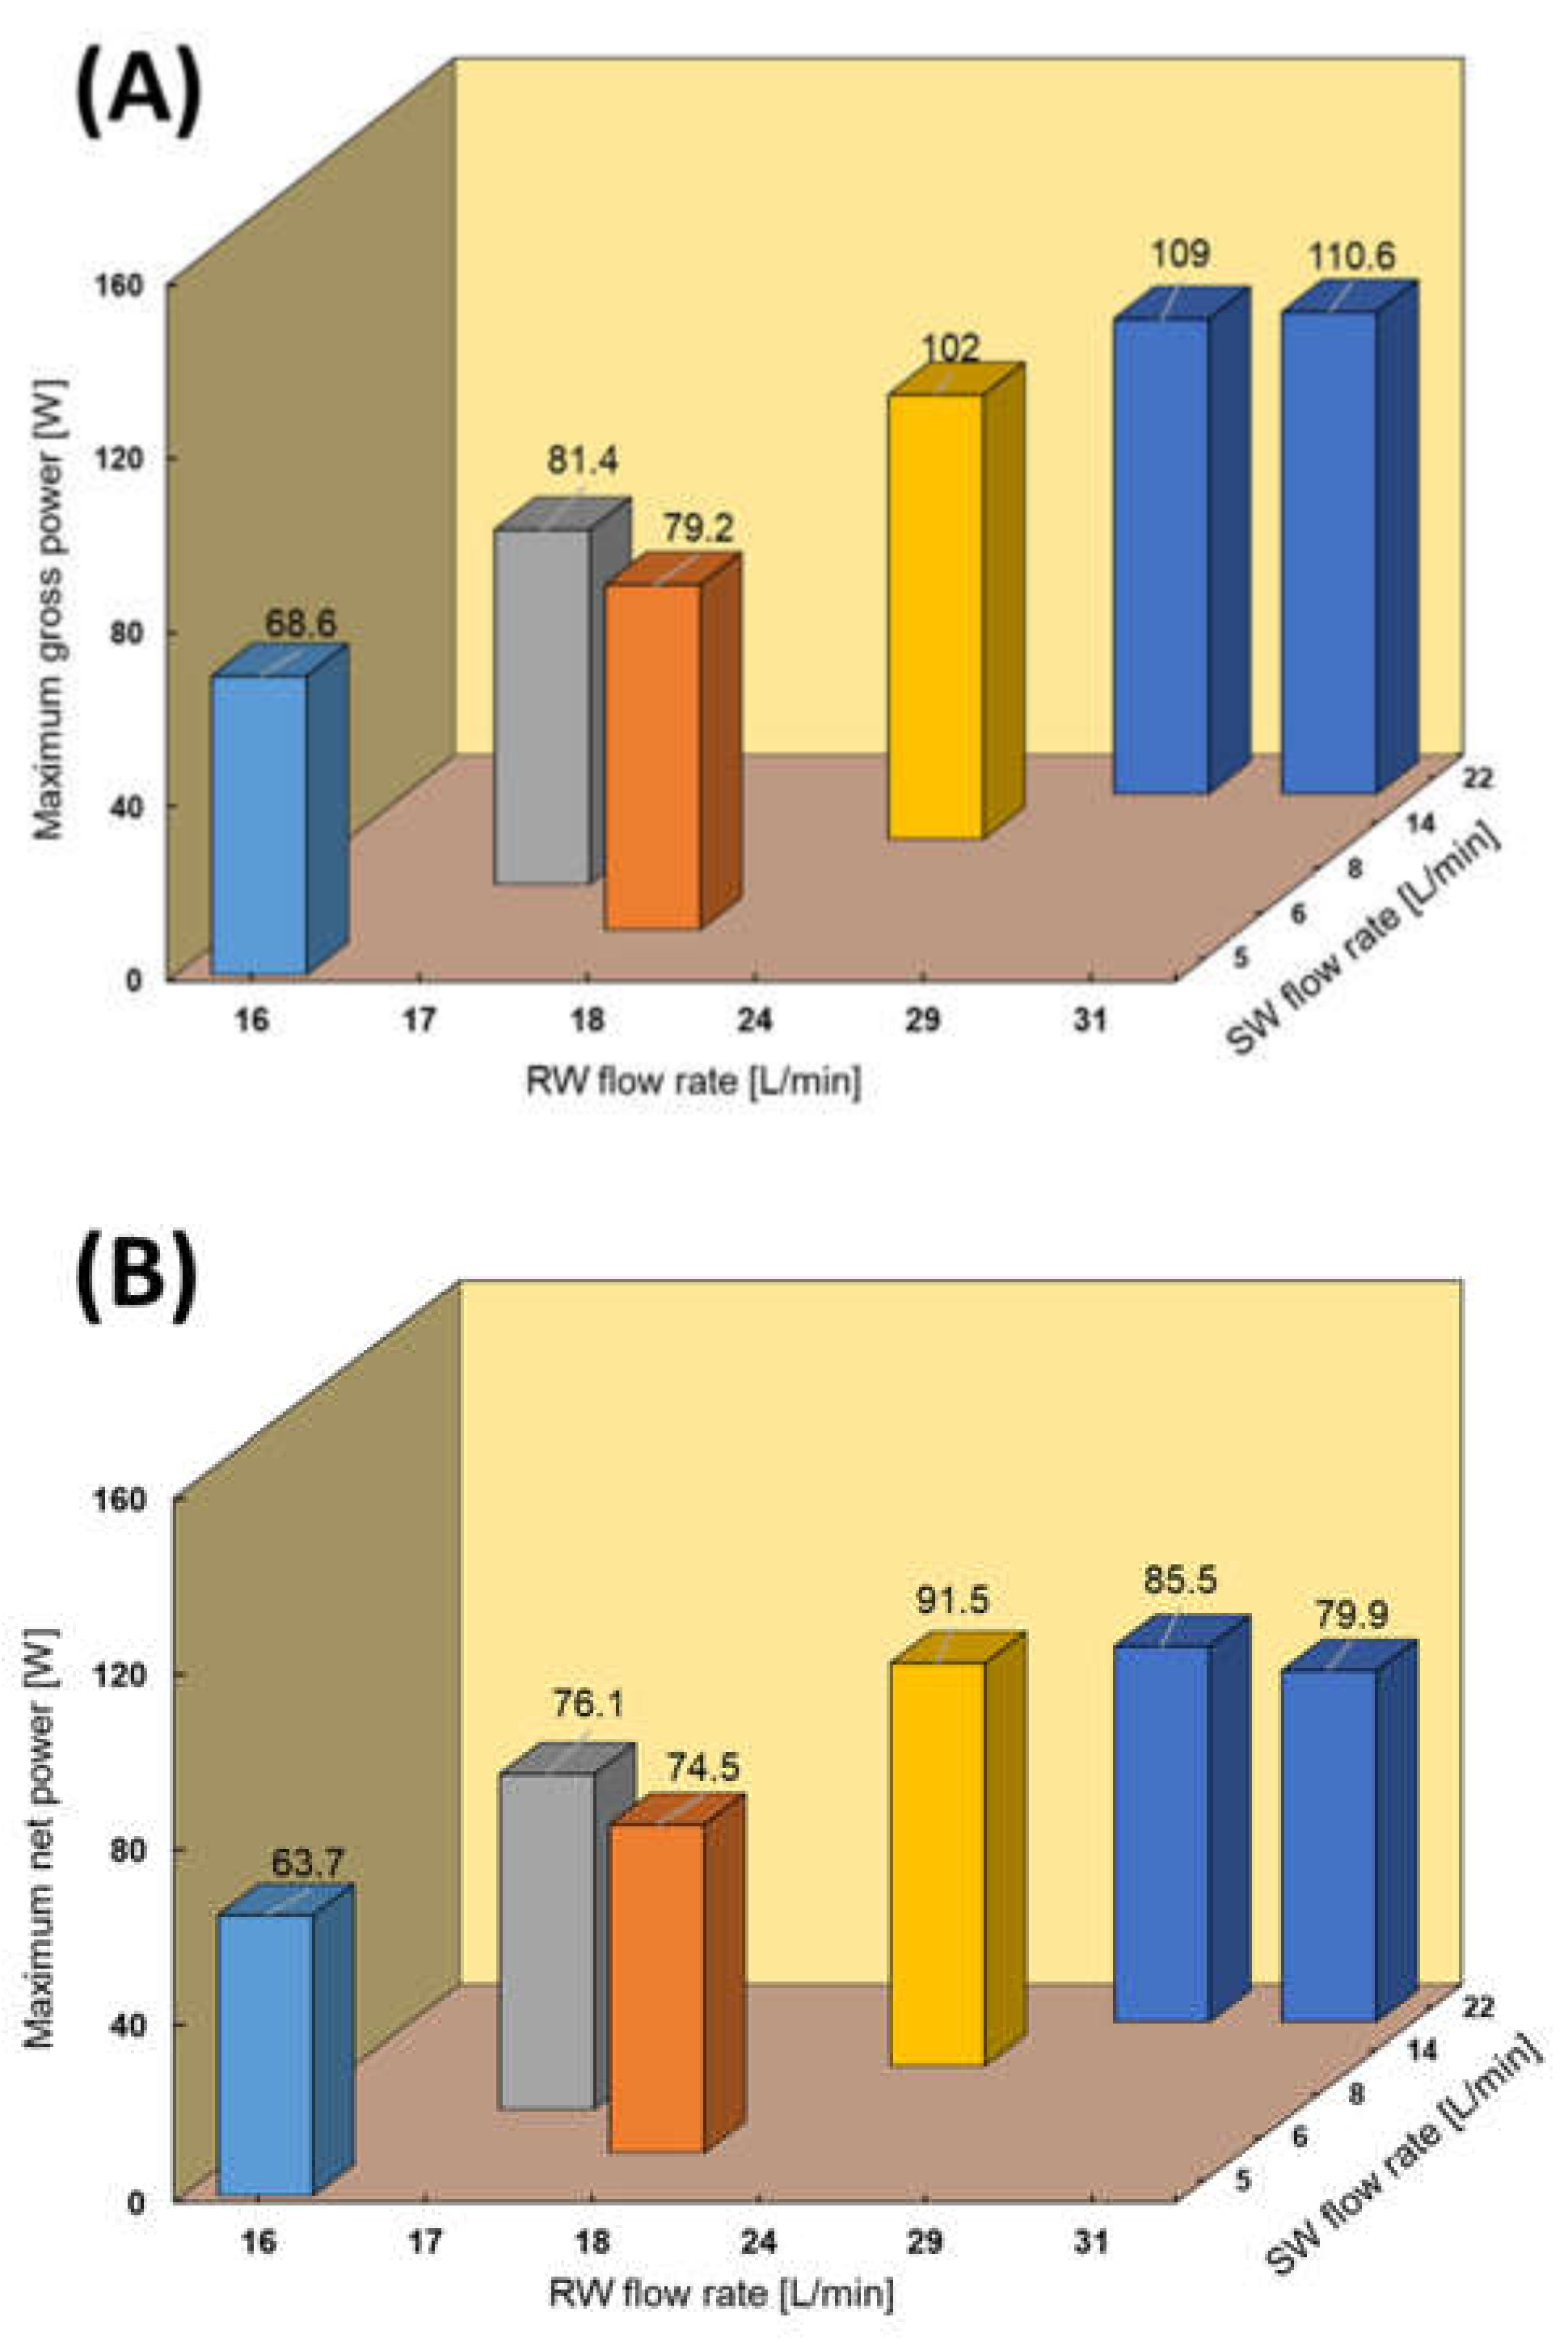
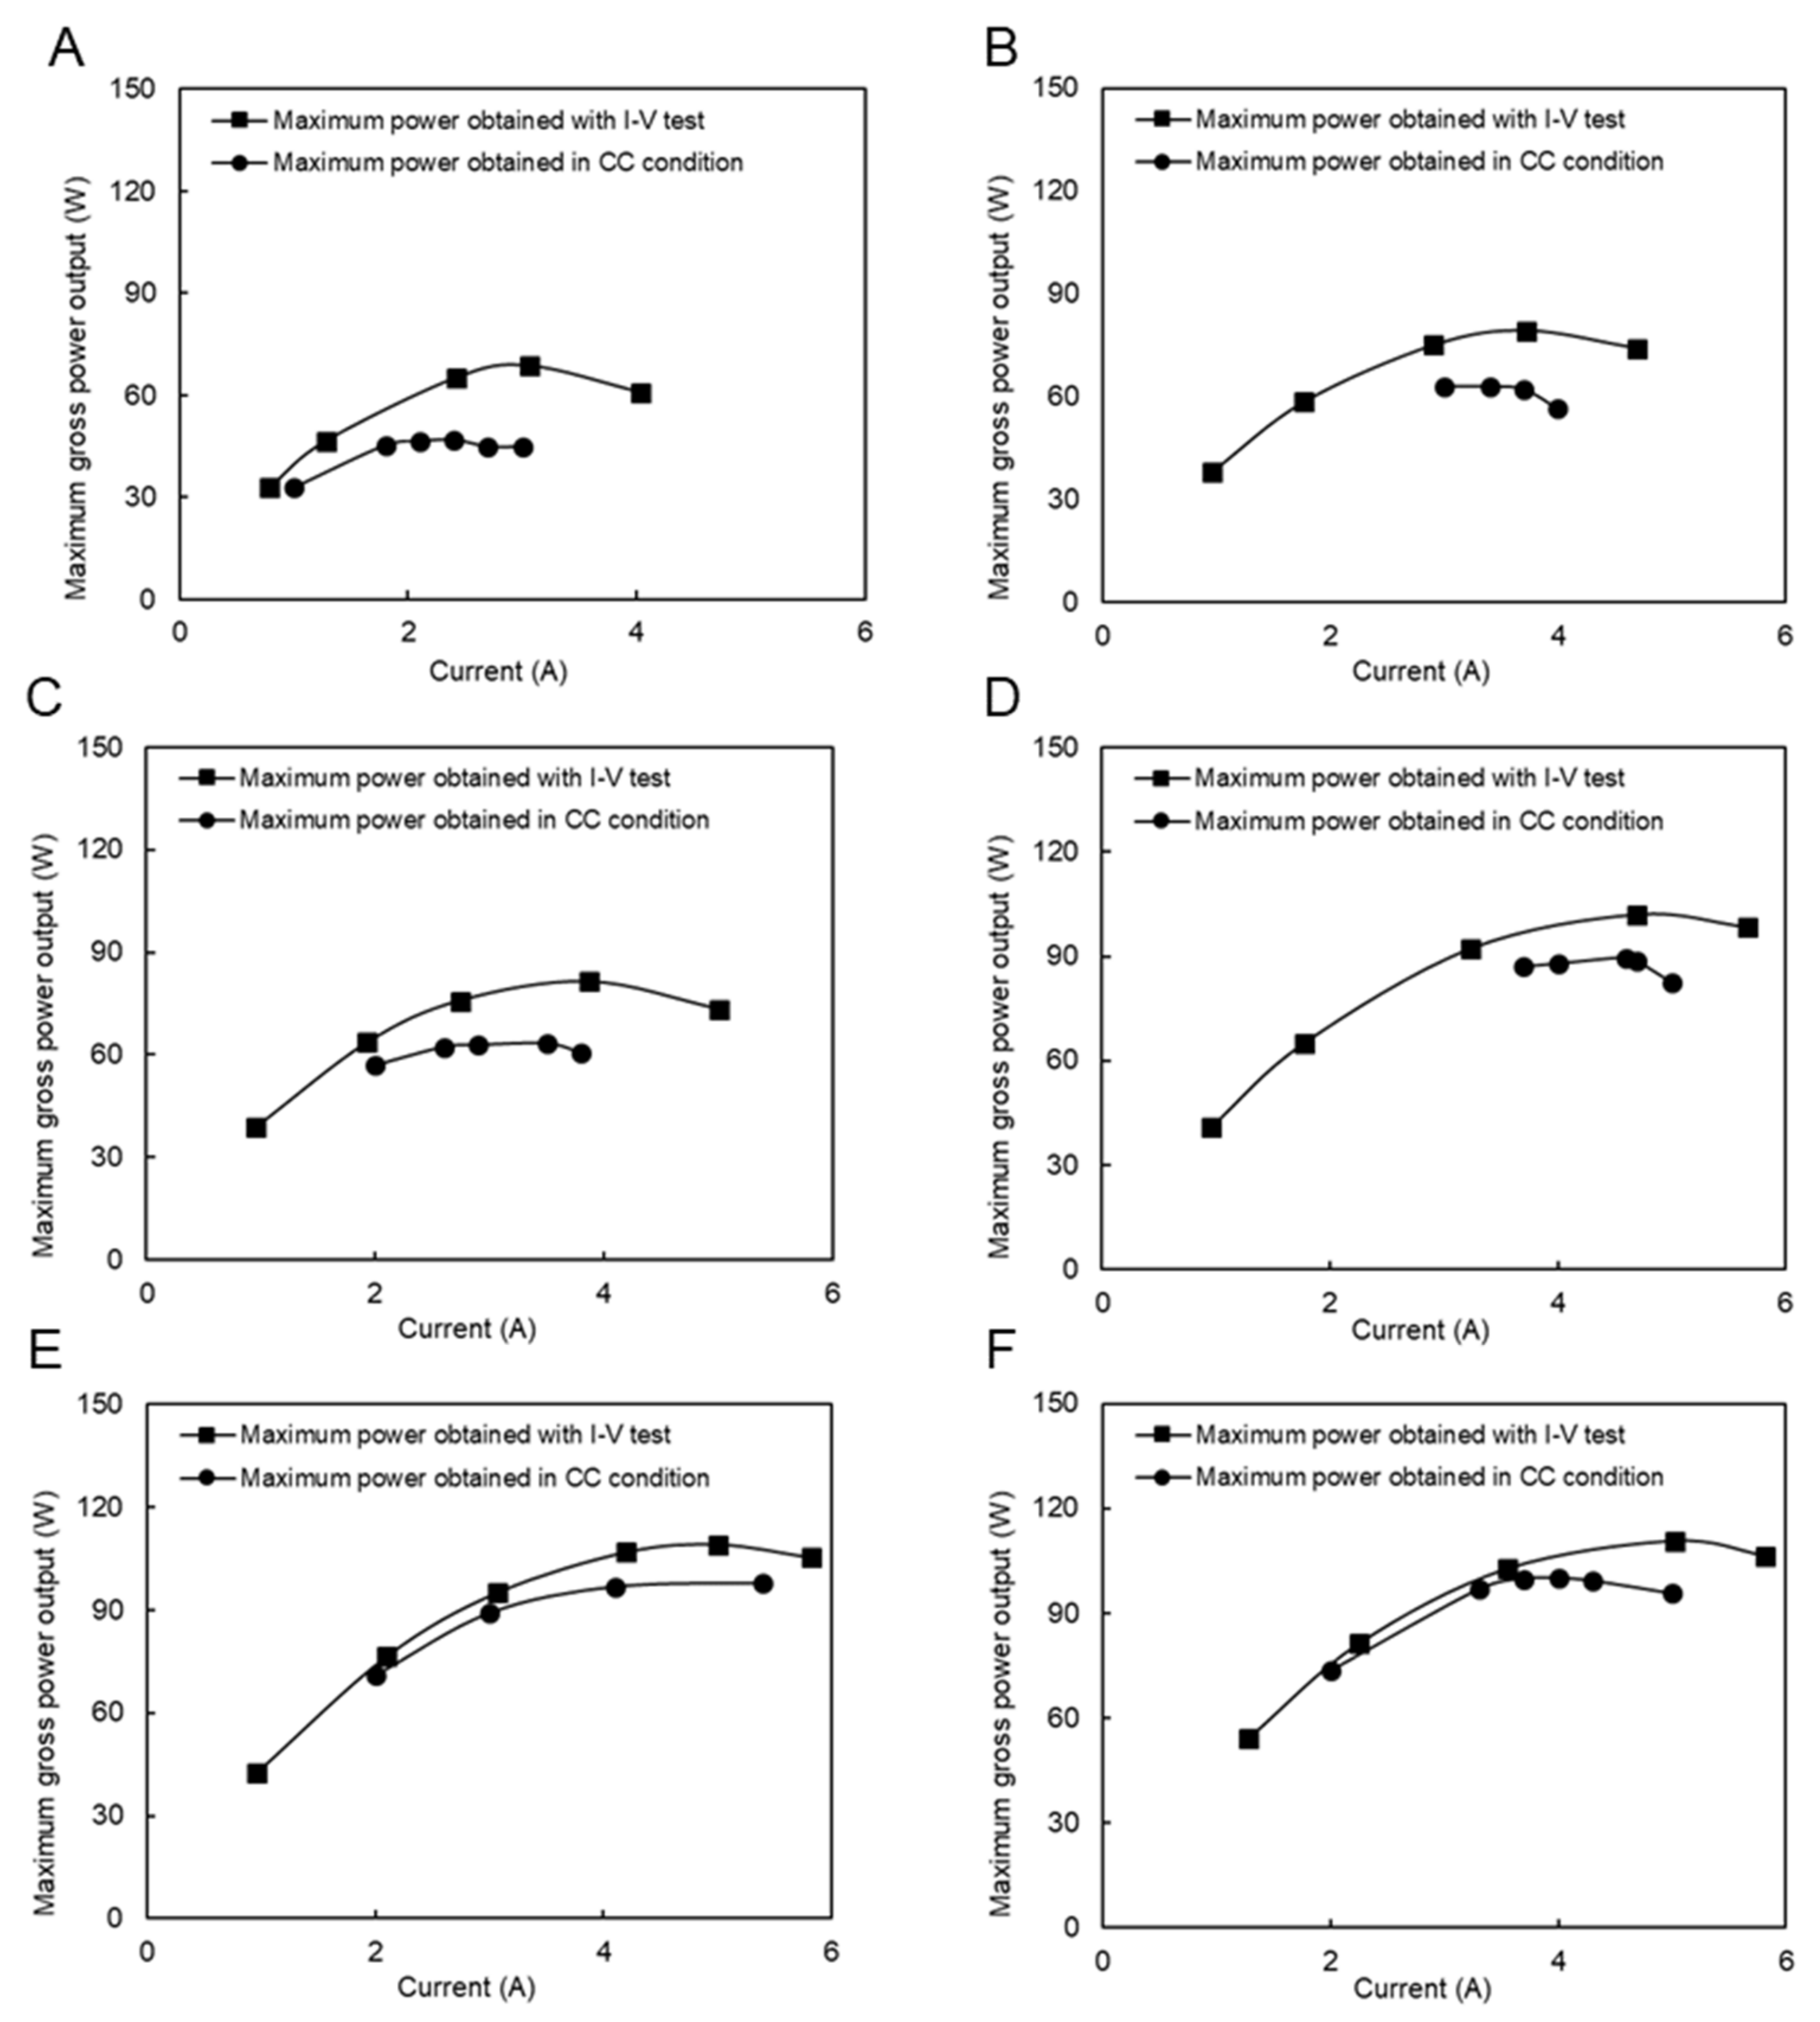
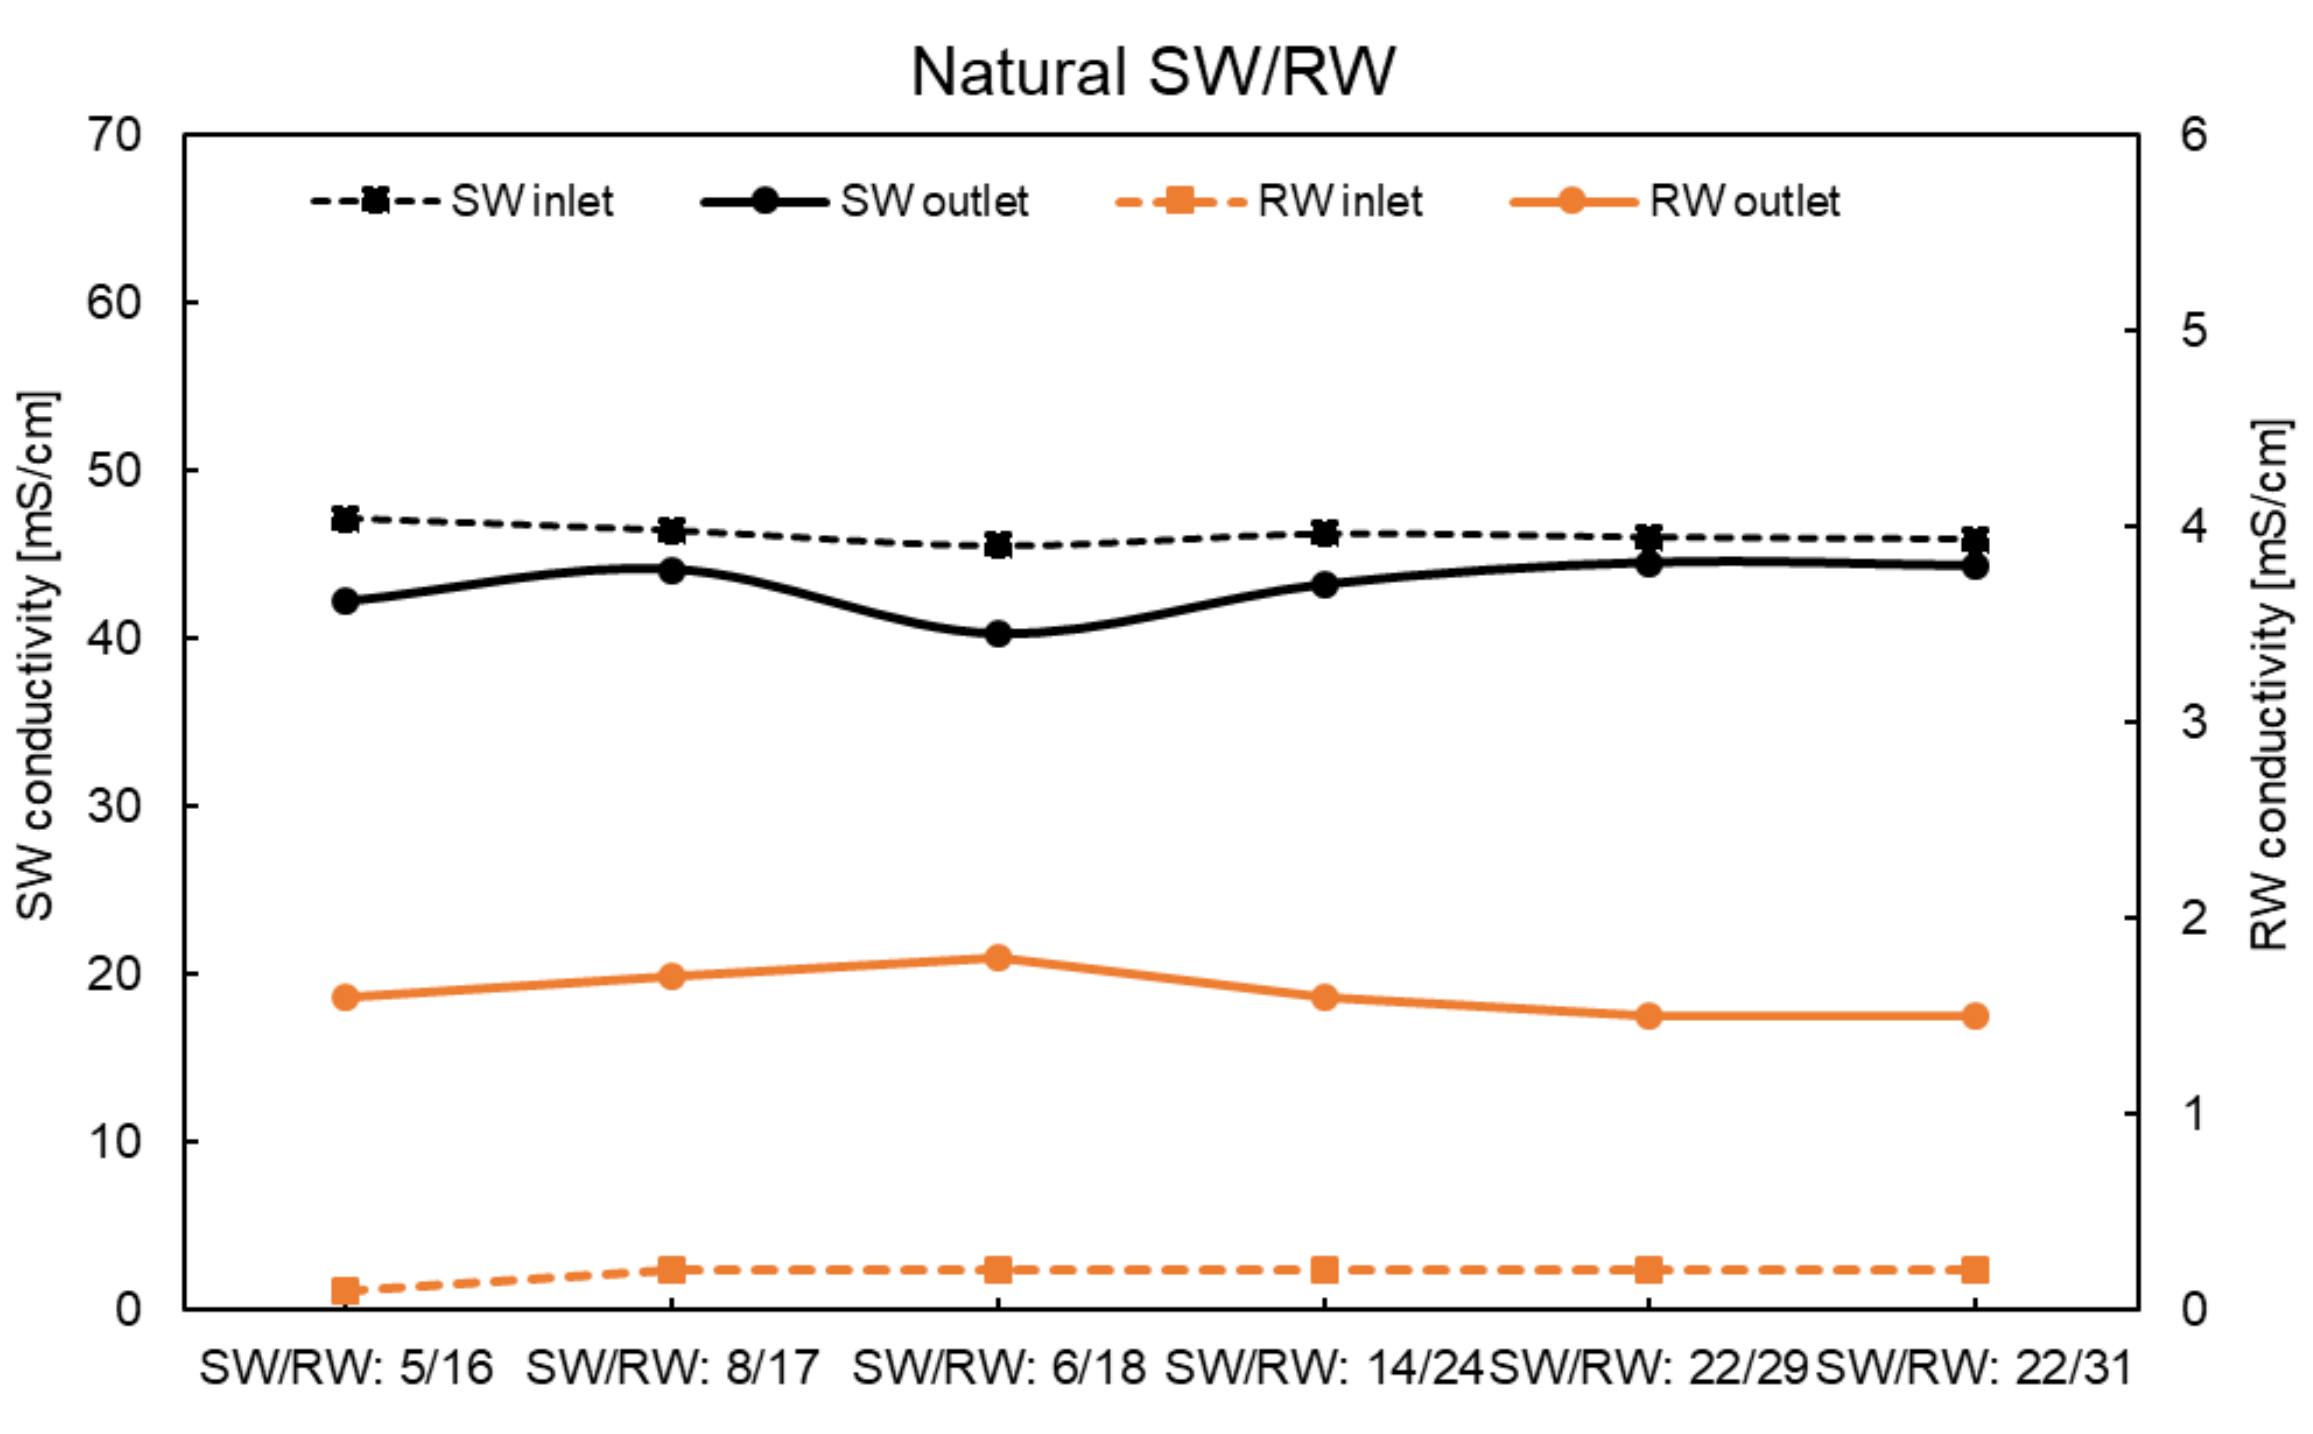
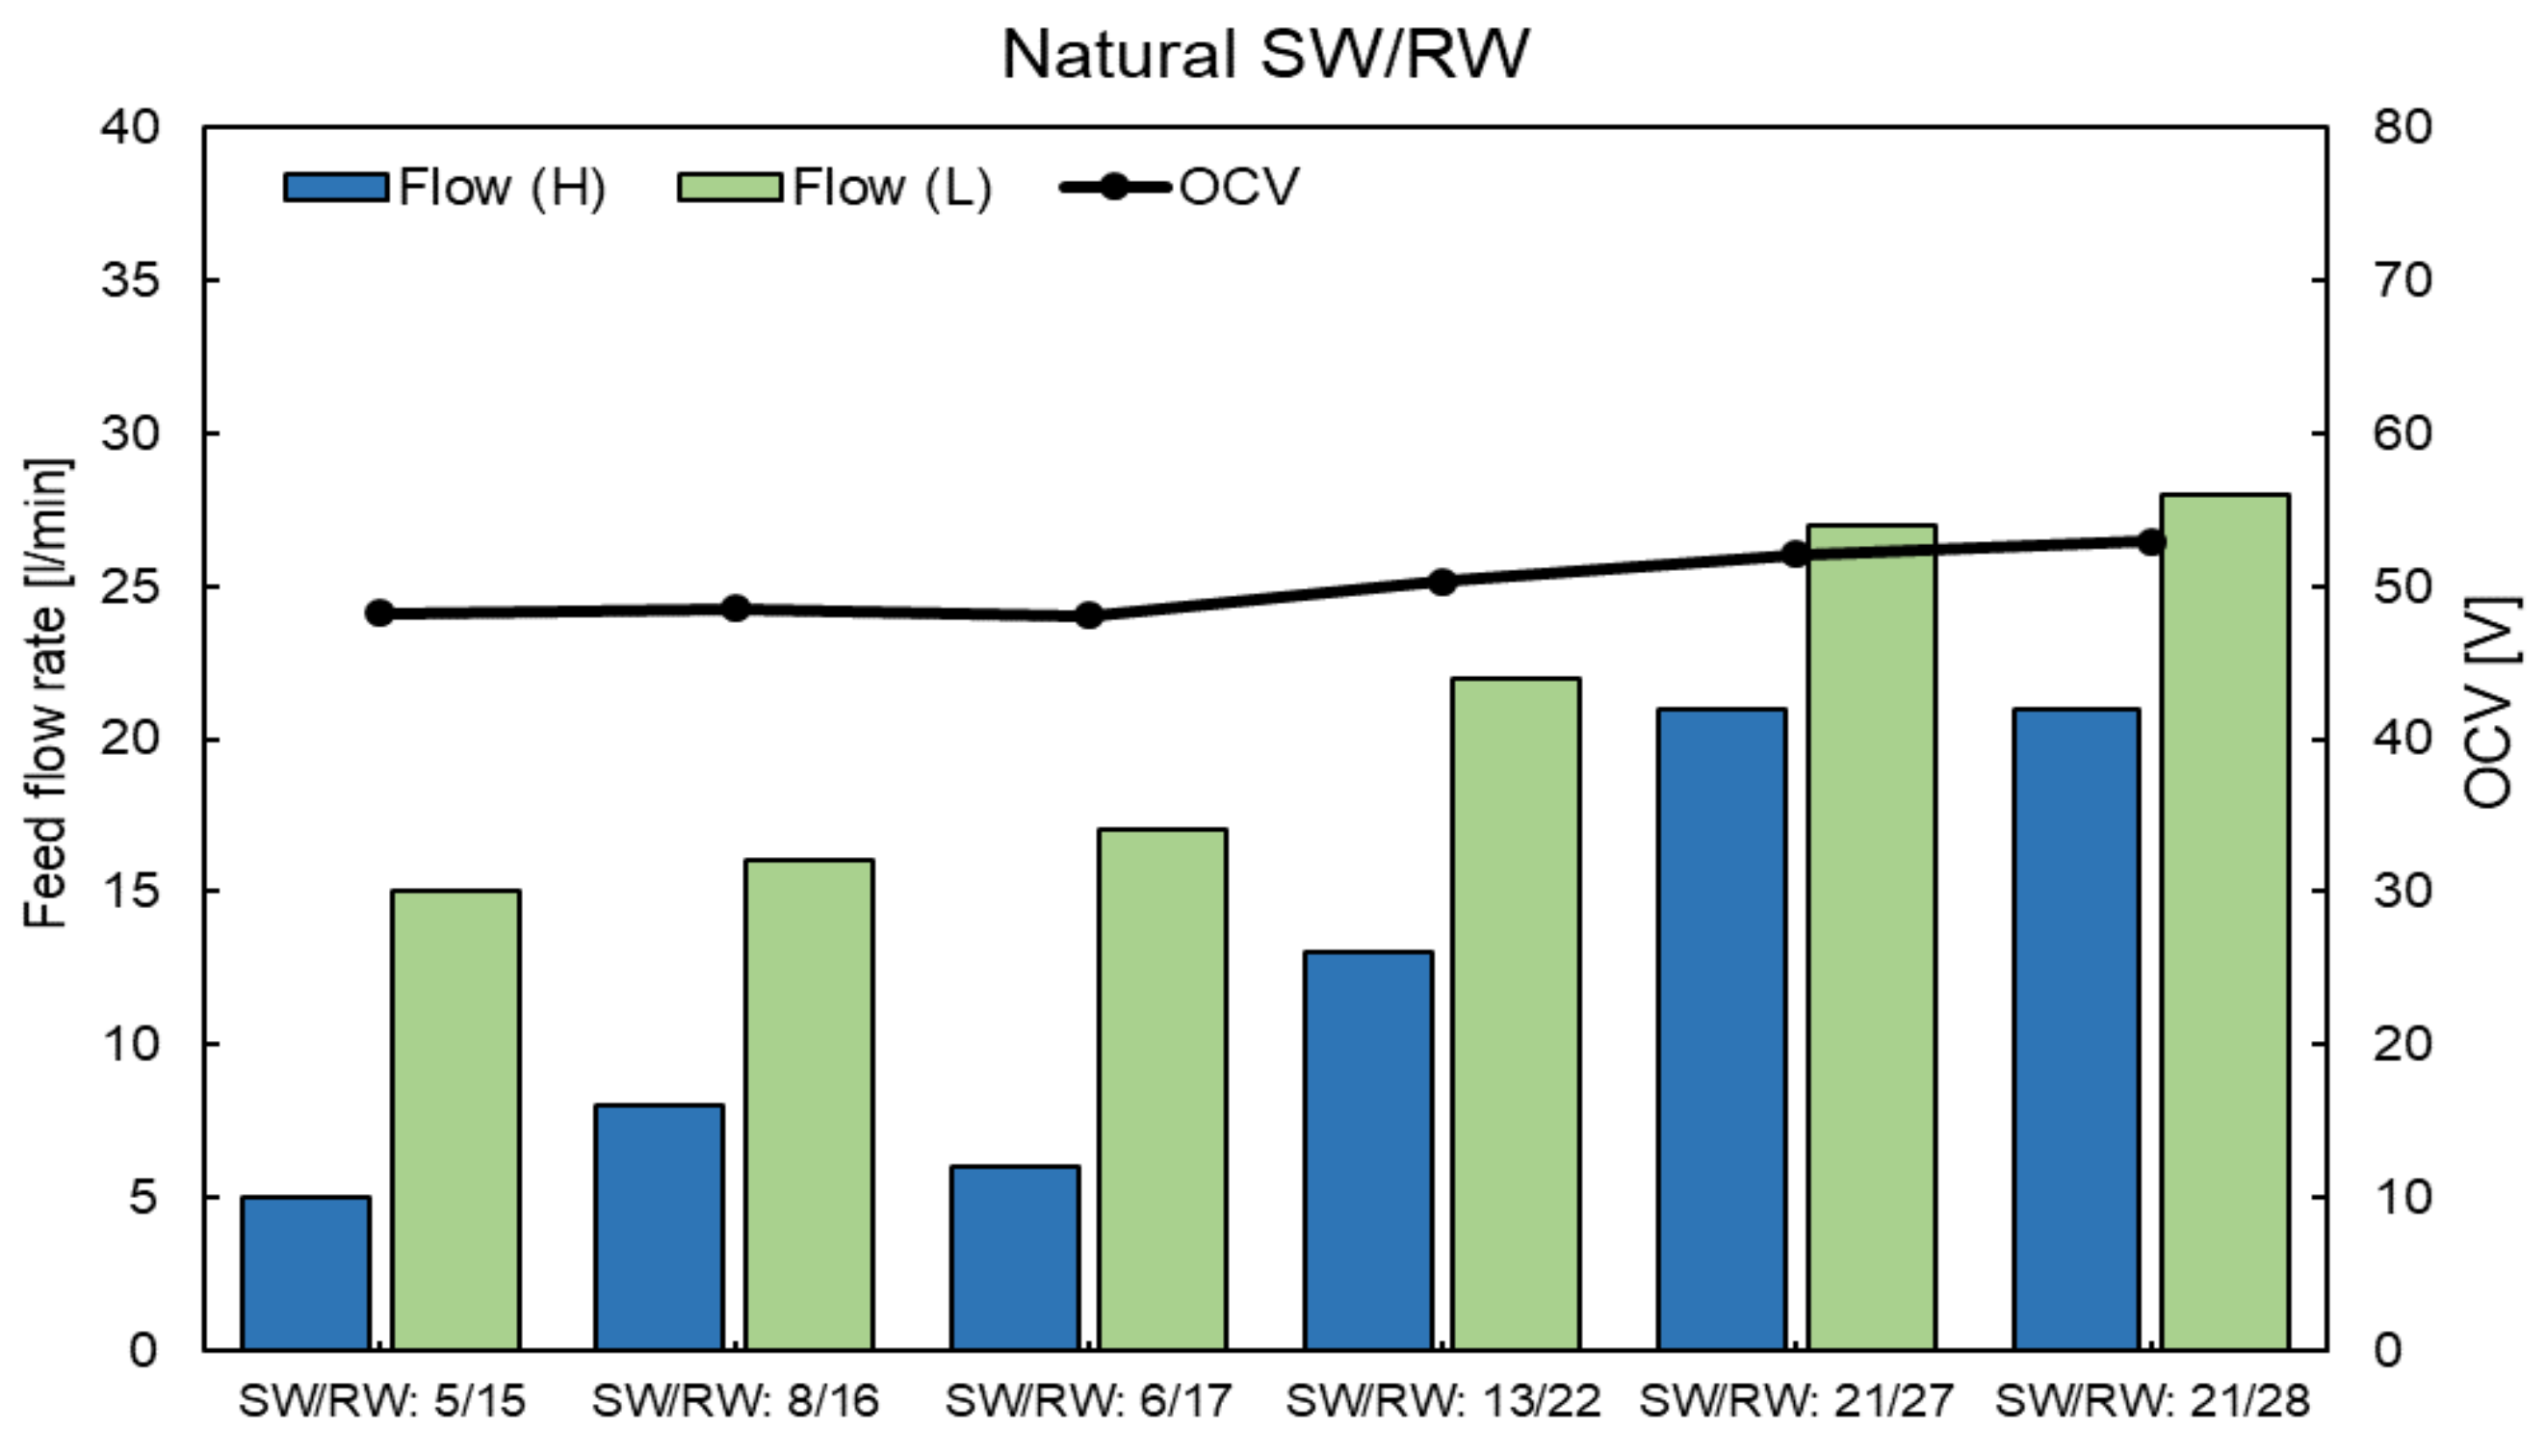
4.5. RED Performance with Natural SW and RW
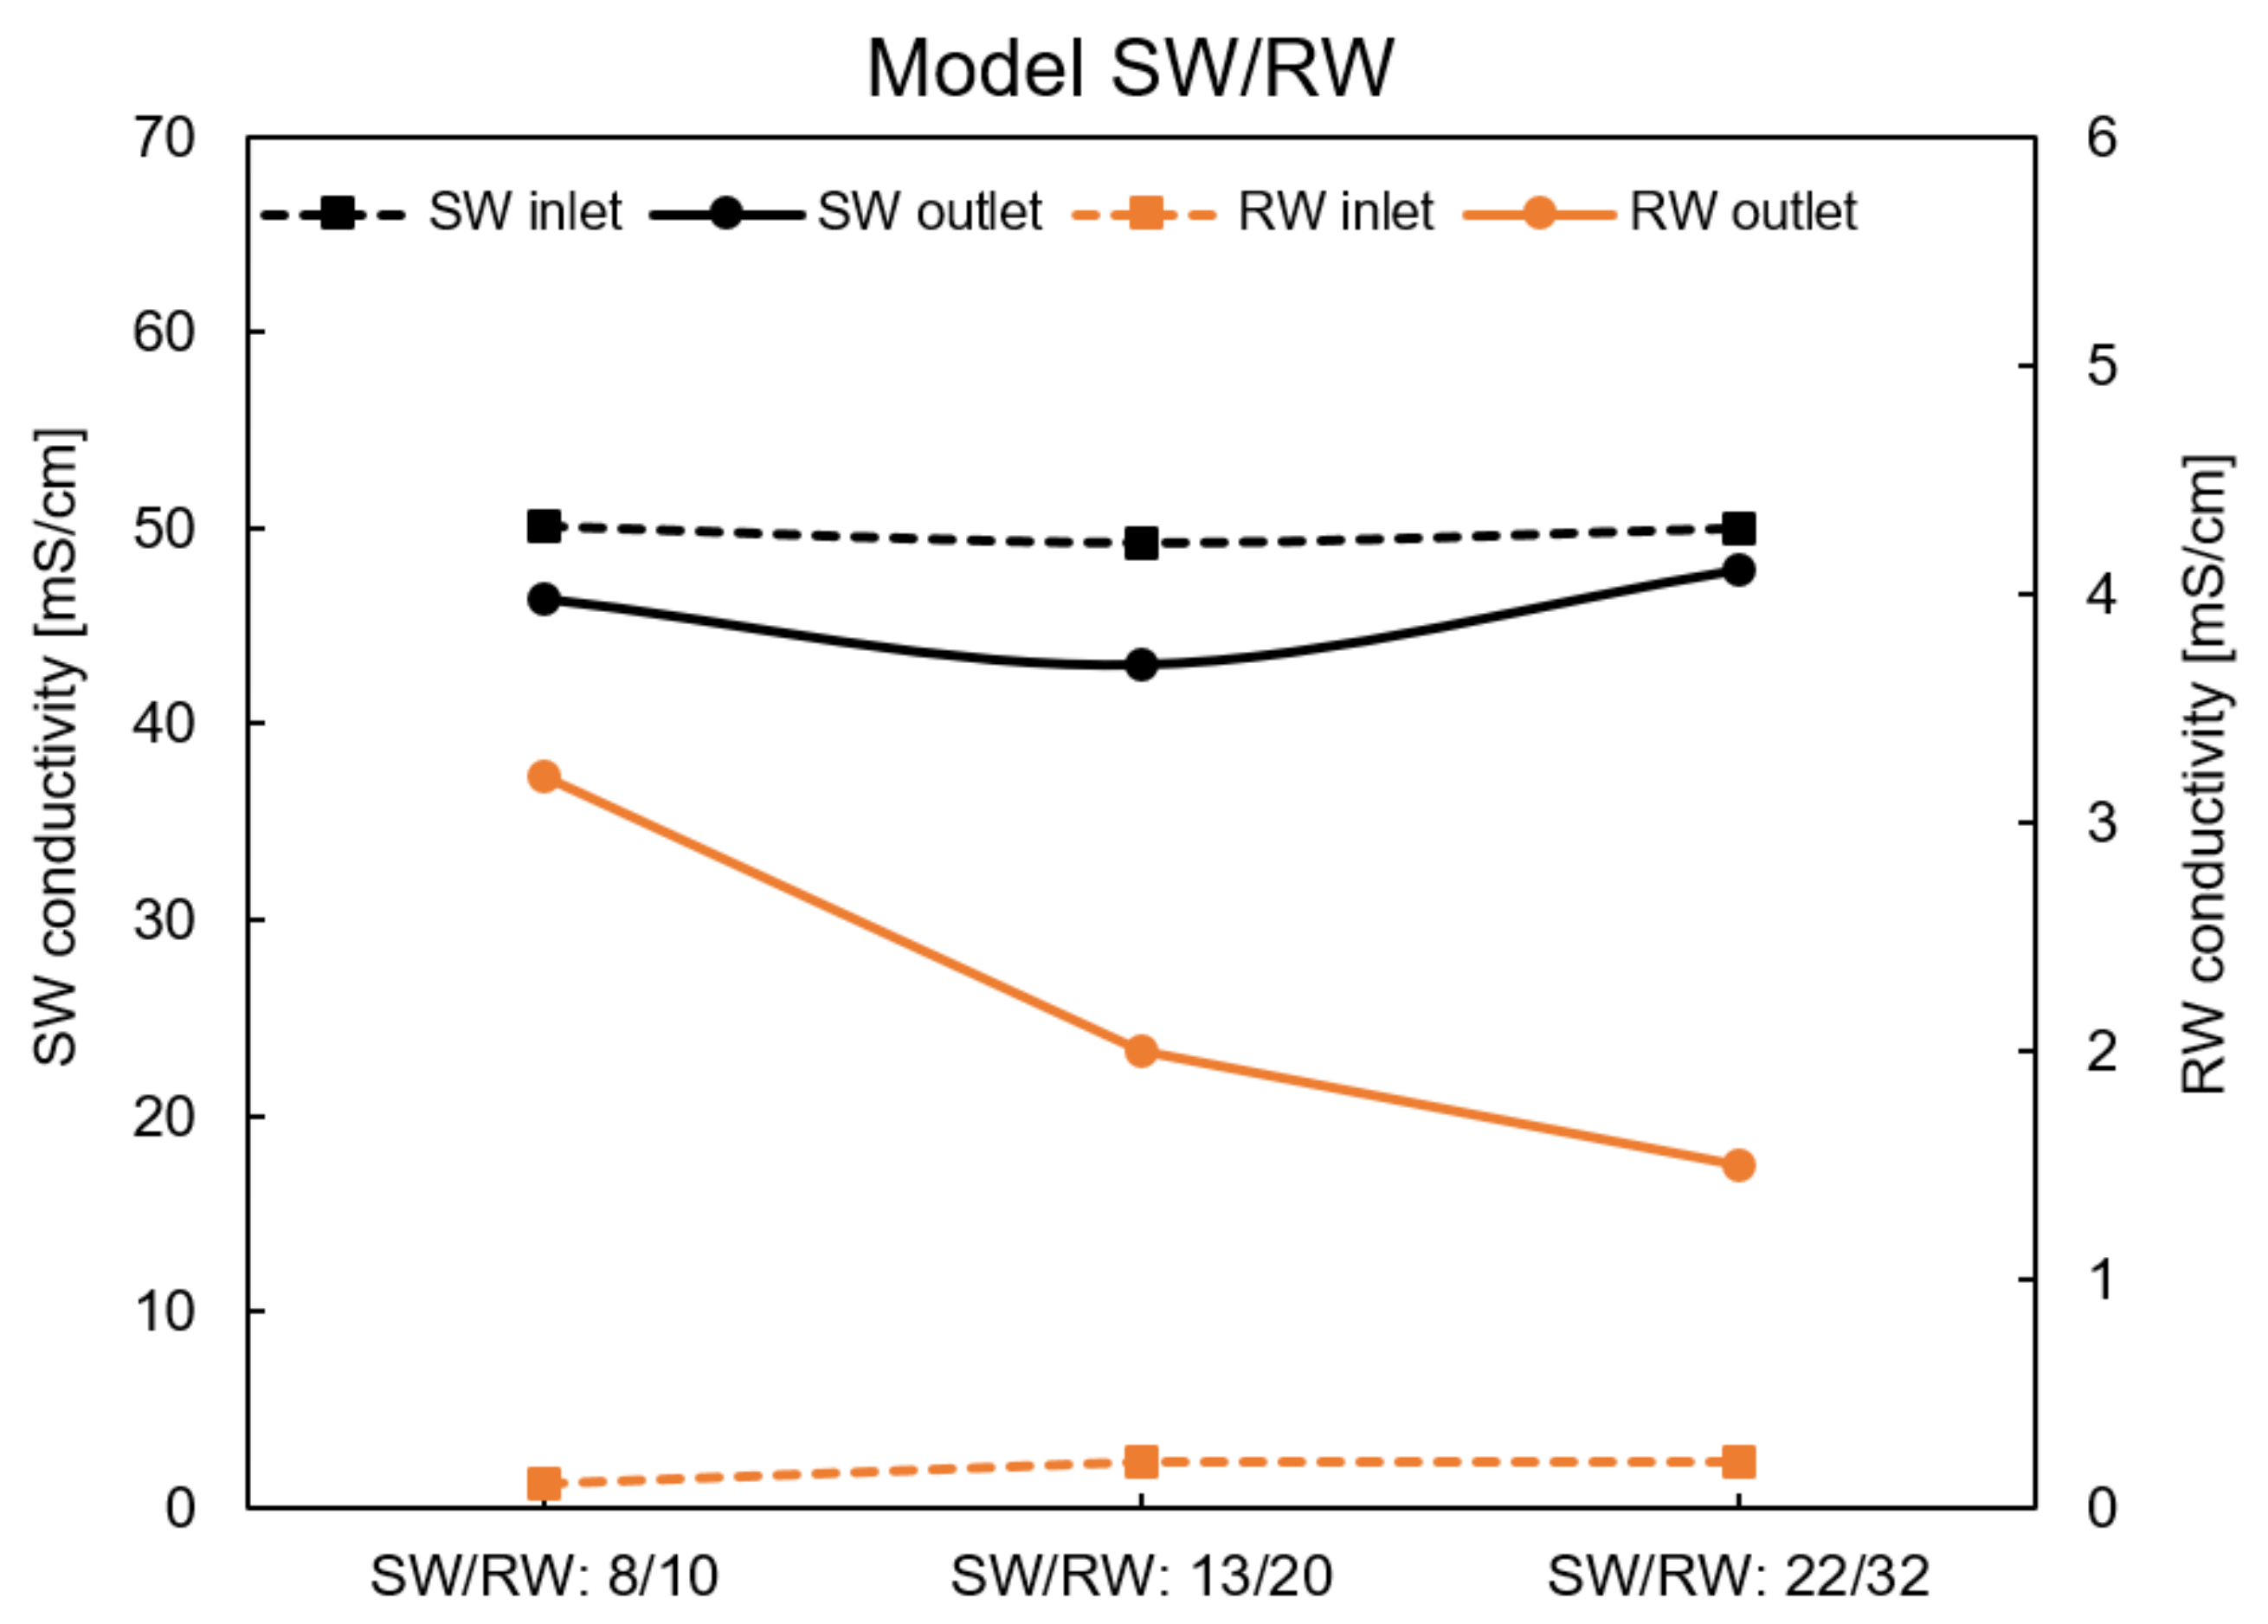
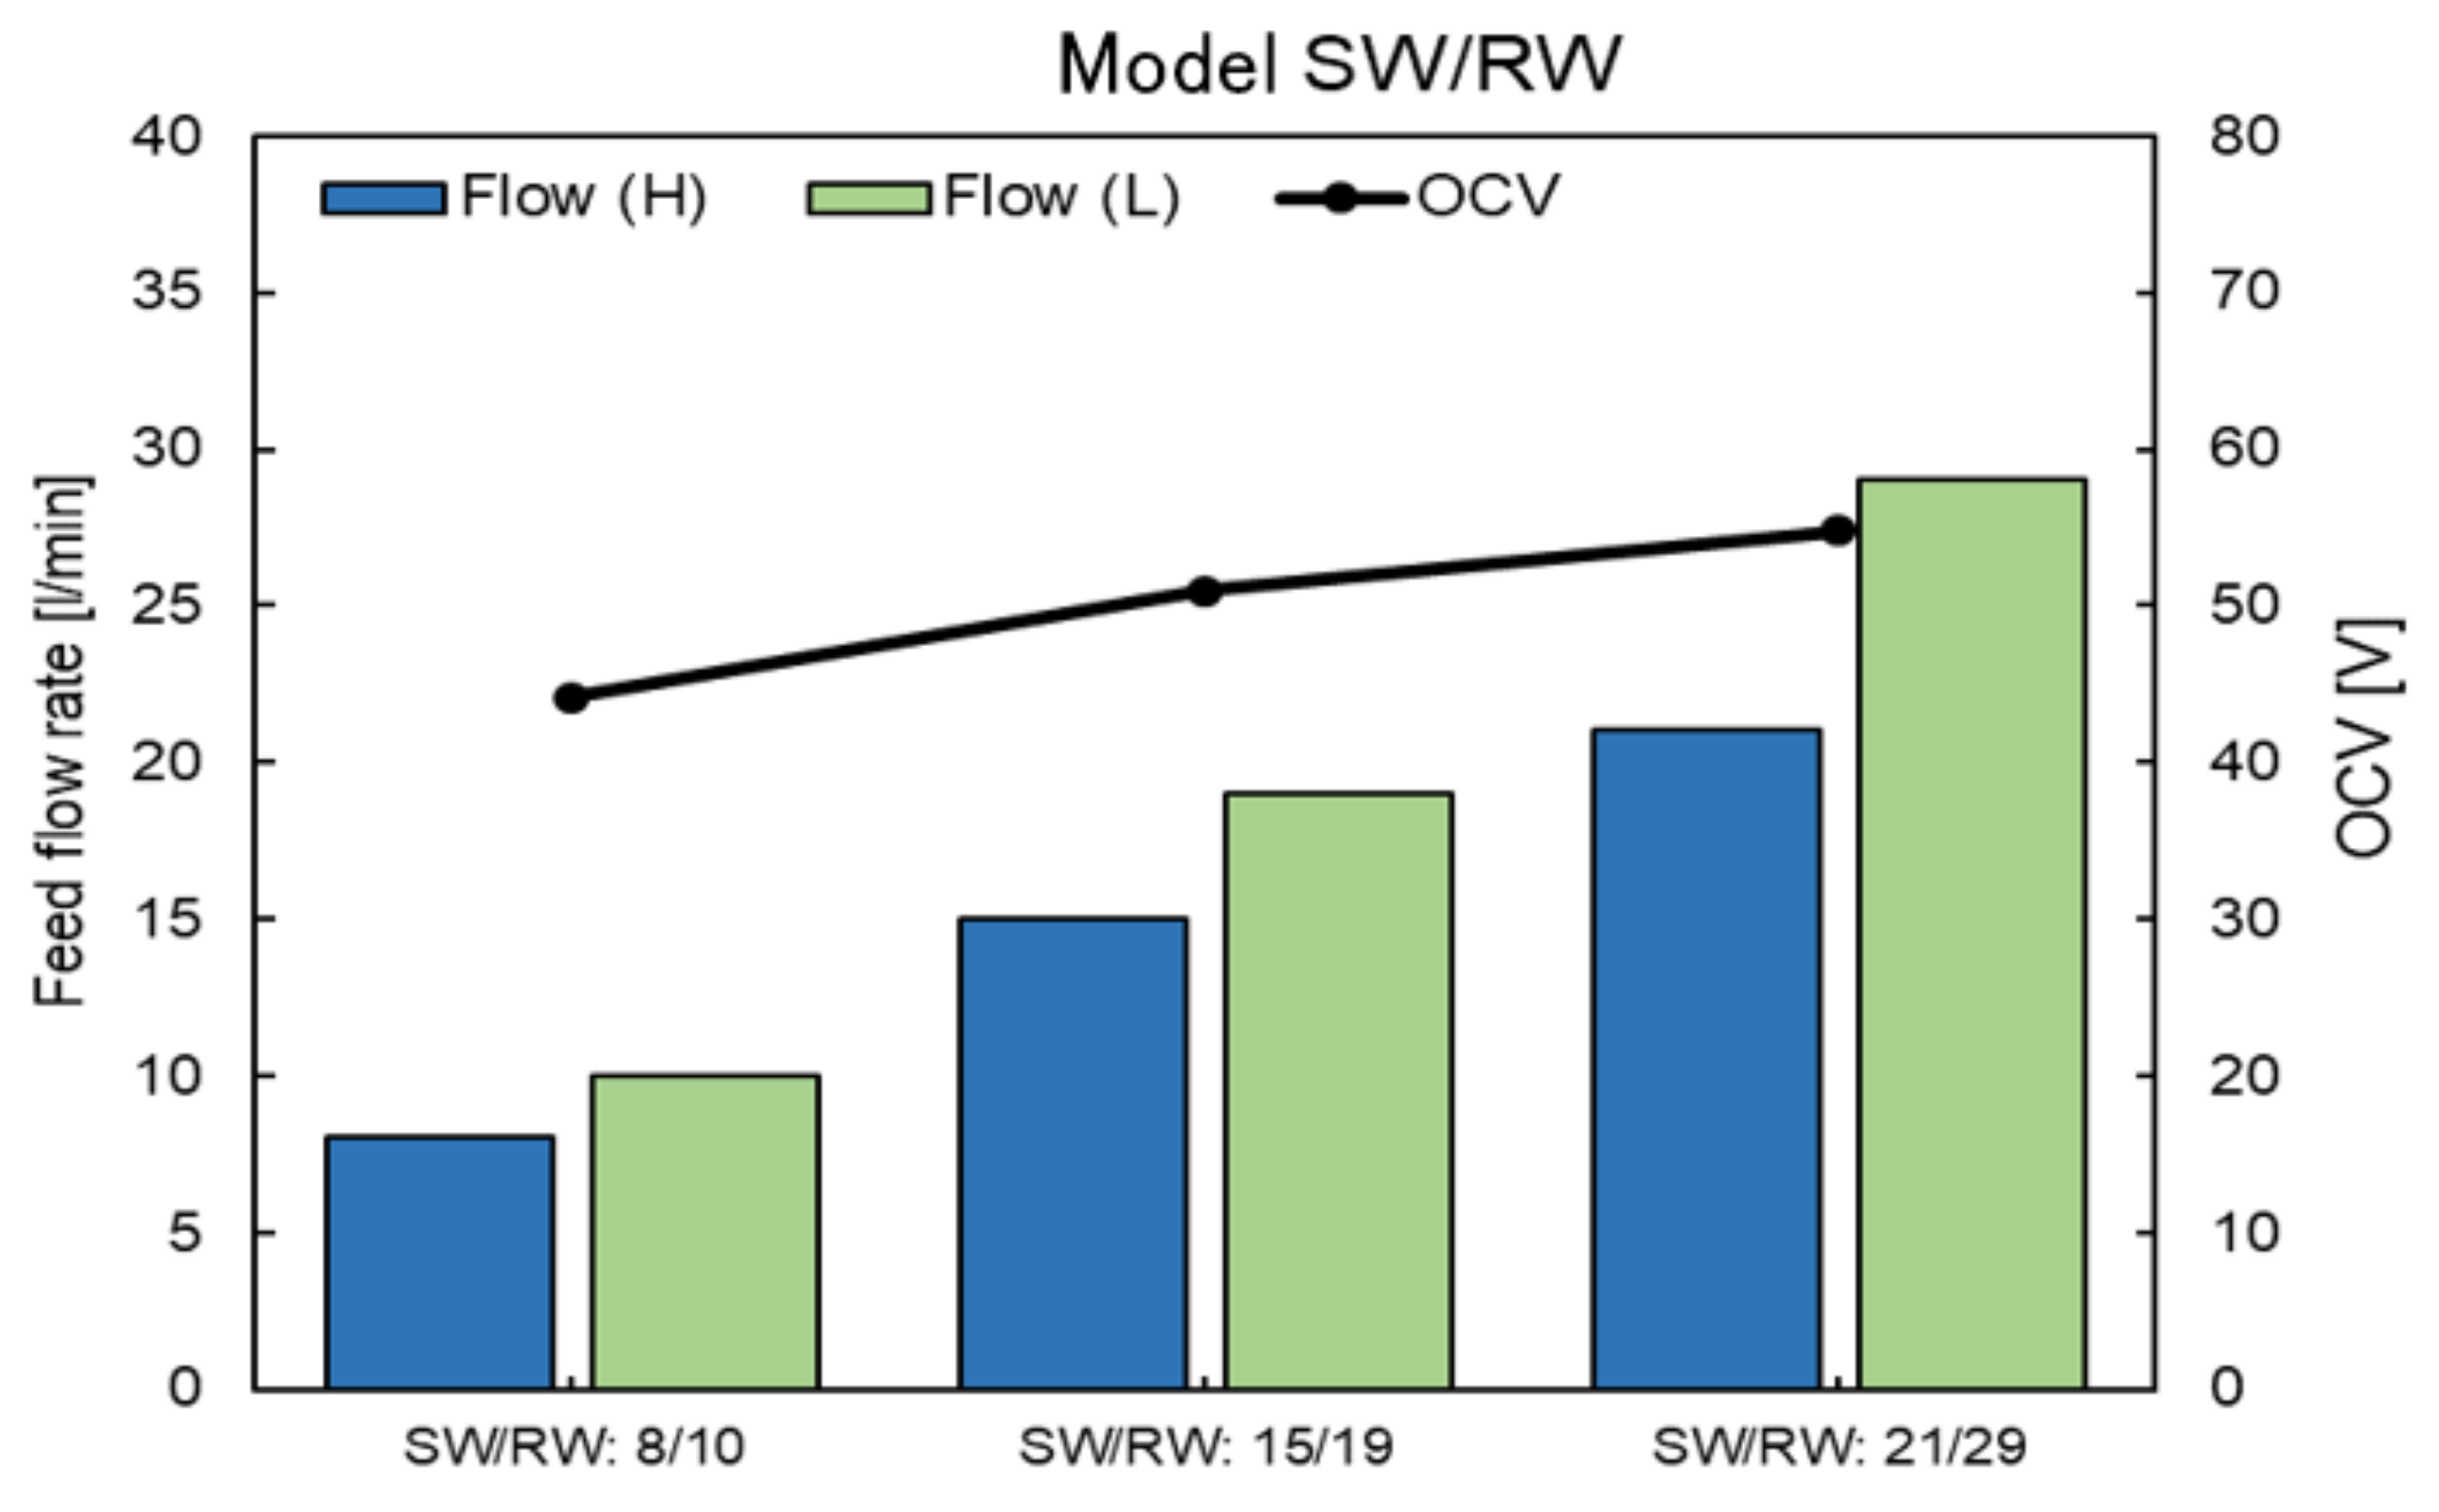
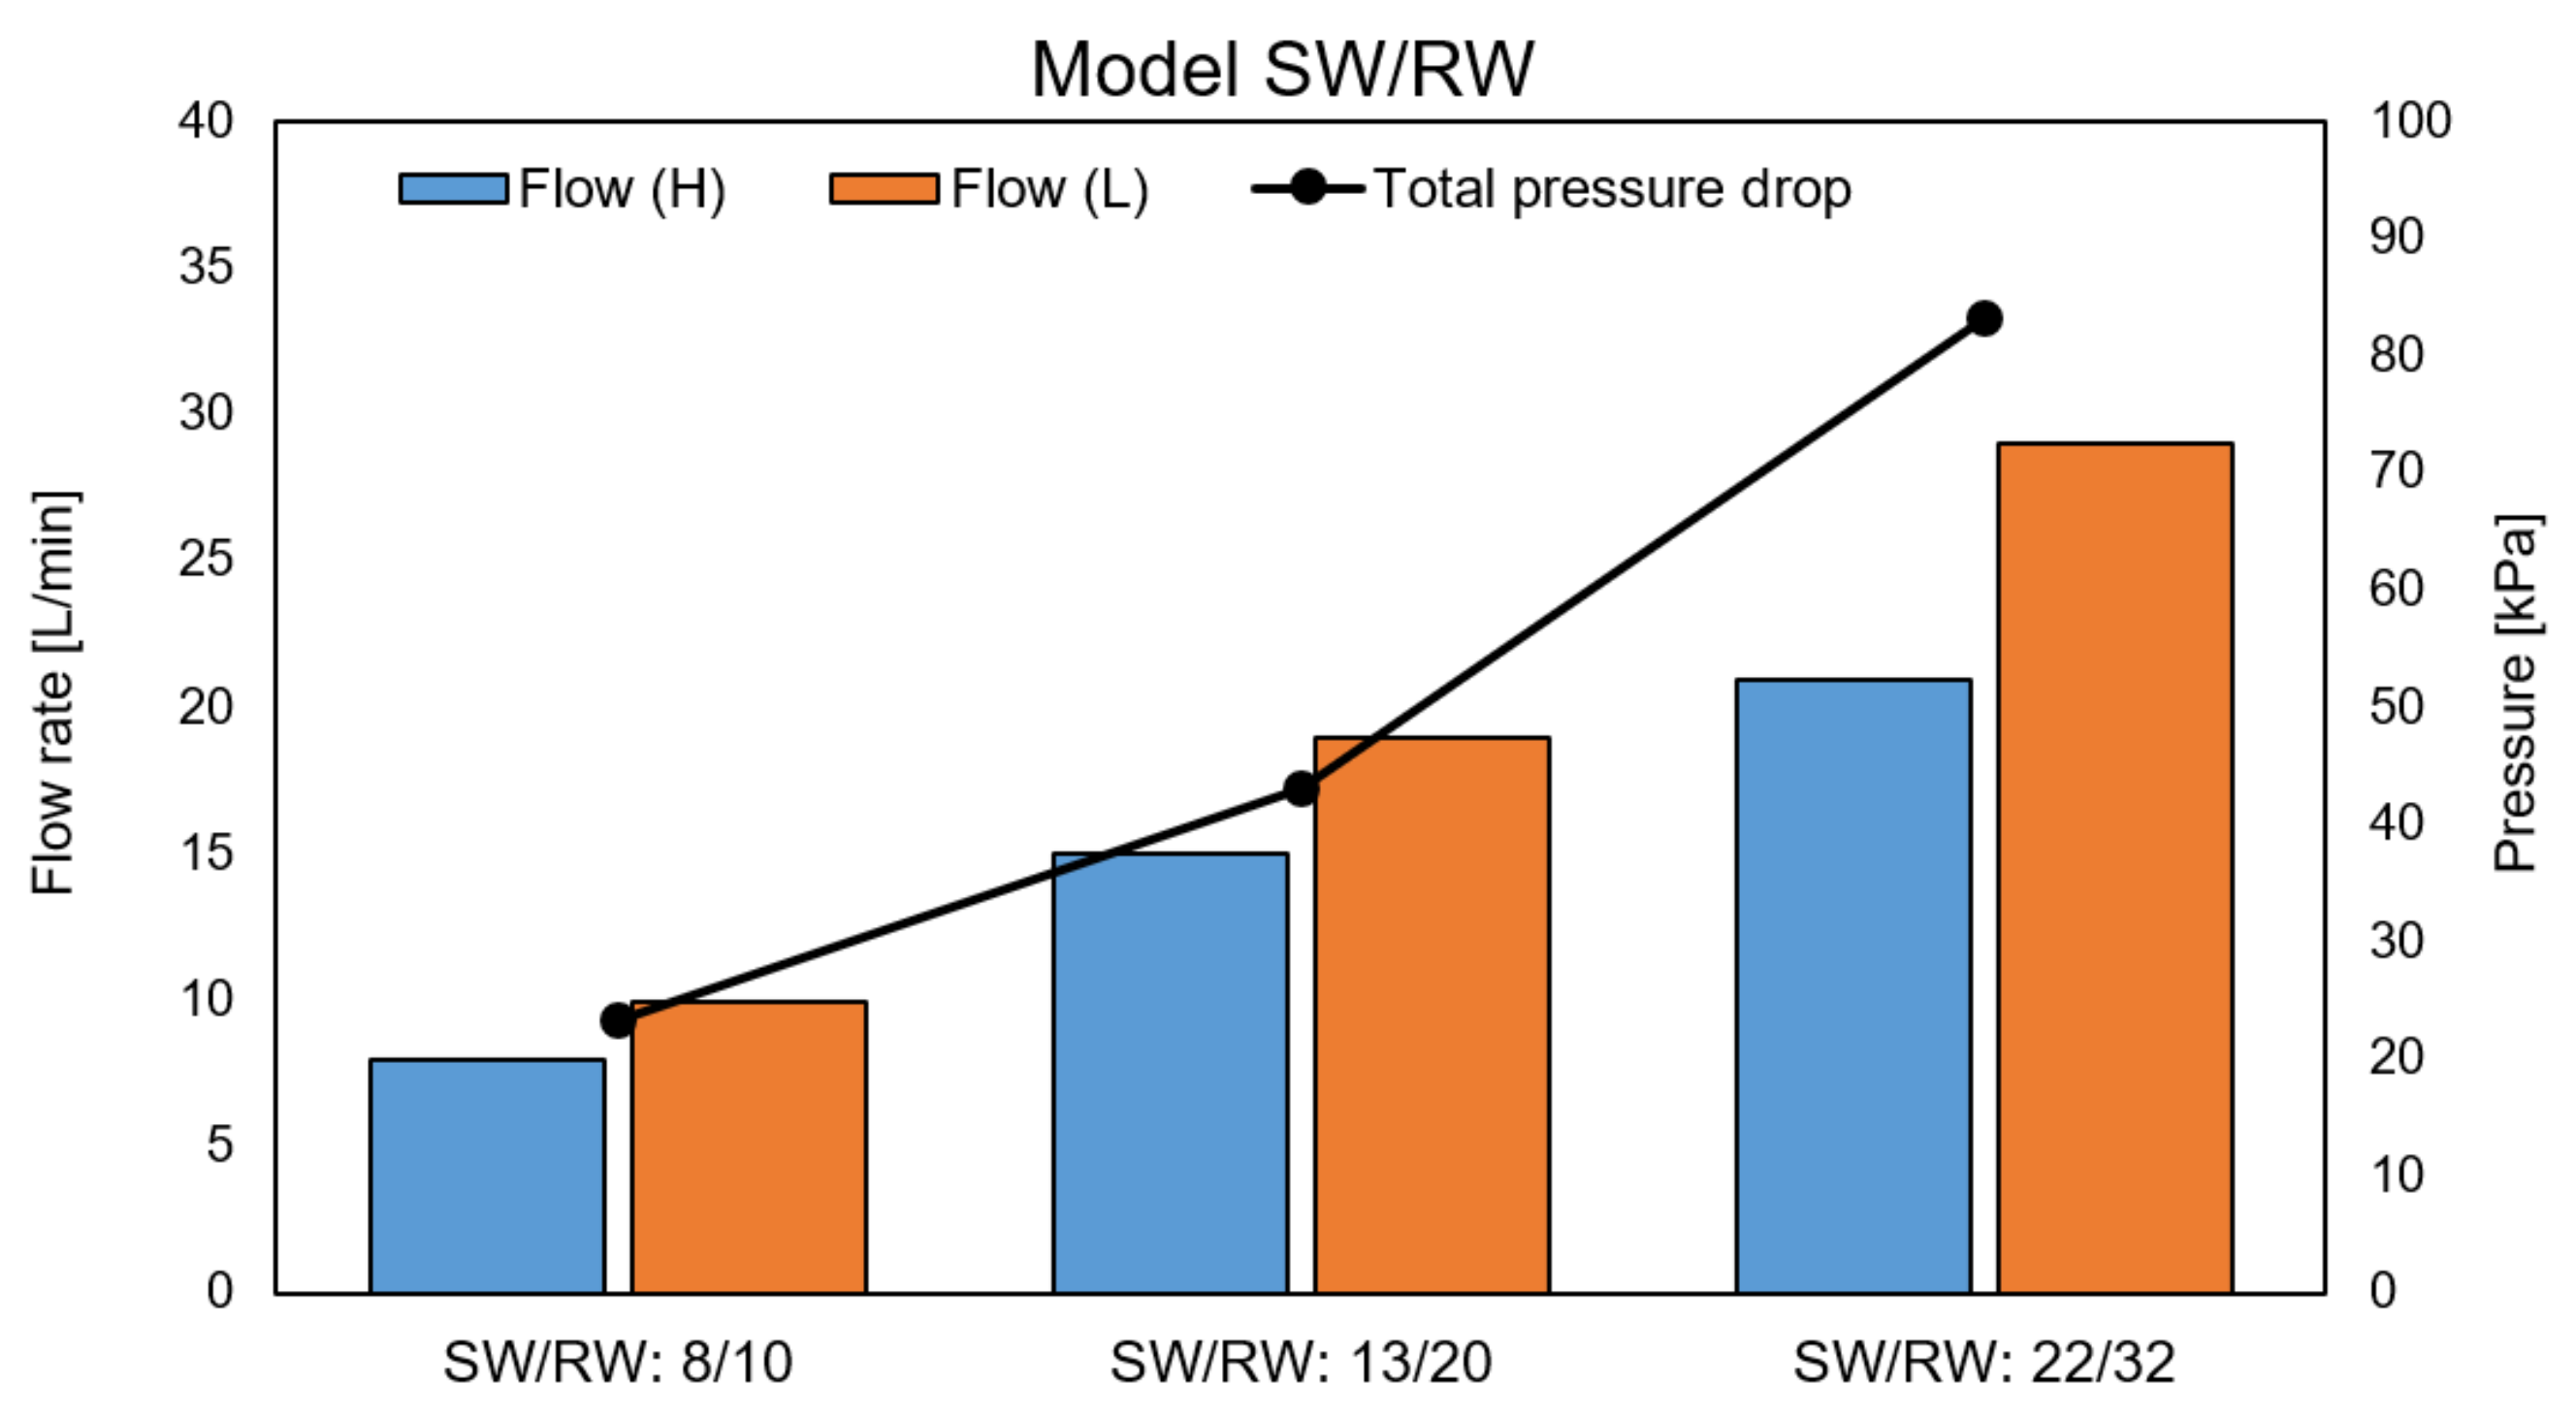
4.6. RED Performance with Model SW and RW
4.7. Available Energy in Okinawa Water Desalination Plant
5. Conclusions
Author Contributions
Funding
Institutional Review Board Statement
Informed Consent Statement
Data Availability Statement
Conflicts of Interest
Appendix A
Appendix A.1. Ion Exchange Capacity (IEC) and Water Content
Appendix A.2. Membrane Resistance (Ω)
Appendix B
- (i)
- 0.000 < CNaCl ≤ 0.024
- (ii)
- 0.0241 < CNaCl ≤ 0.190
- (iii)
- 0.190 < CNaCl
- (i)
- 0.000 < CNaCl ≤ 0.00856, 0 < k ≤ 1.029576
- (ii)
- 0.00856 < CNaCl ≤ 0.172844, 1.029576 < k ≤ 22.720034
- (iii)
- 0.190 < CNaCl, 22.720034 < k
Appendix C


Appendix D


References
- Güler, E.; Van Baak, W.; Saakes, M.; Nijmeijer, K. Monovalent-ion-selective membranes for reverse electrodialysis. J. Membr. Sci. 2014, 455, 254–270. [Google Scholar] [CrossRef]
- Post, J.W.; Hamelers, H.V.M.; Buisman, C.J.N. Energy recovery from controlled mixing salt and fresh water with a reverse electrodialysis system. Environ. Sci. Technol. 2008, 42, 5785–5790. [Google Scholar] [CrossRef] [PubMed]
- Long, R.; Li, B.; Liu, Z.; Liu, W. Performance analysis of reverse electrodialysis stacks: Channel geometry and flow rate optimization. Energy 2018, 158, 427–436. [Google Scholar] [CrossRef]
- Kim, H.; Kim, Y.-E.; Jeong, N.-J.; Hwang, K.-S.; Han, J.-H.; Nam, J.-Y.; Jwa, E.; Nam, S.-C.; Park, S.-Y.; Yoon, Y.-I.; et al. Innovative reverse-electrodialysis power generation system for carbon capture and utilization. J. CO2 Util. 2017, 20, 312–317. [Google Scholar] [CrossRef]
- Pattle, R.E. Production of electric power by mixing fresh and salt water in the hydroelectric pile. Nature 1954, 174, 660. [Google Scholar] [CrossRef]
- Zhang, B.; Gao, H.; Chen, Y. Enhanced ionic conductivity and power generation using ion-exchange resin beads in a reverse-electrodialysis stack. Environ. Sci. Technol. 2015, 49, 14717–14724. [Google Scholar] [CrossRef]
- Vermaas, D.A.; Saakes, M.; Nijmeijer, K. Doubled power density from salinity gradients at reduced intermembrane distance. Environ. Sci. Technol. 2011, 45, 7089–7095. [Google Scholar] [CrossRef]
- Mei, Y.; Tang, C.Y. Resent developments and future perspectives of reverse electrodialysis technology: A review. Desalination 2018, 425, 156–174. [Google Scholar] [CrossRef]
- Helfer, F.; Lemckert, C.; Anissimov, Y.G. Osmotic power with pressure retarded osmosis: Theory, performance and trends—A review. J. Membr. Sci. 2014, 453, 337–358. [Google Scholar] [CrossRef] [Green Version]
- Porada, S.; Zhao, R.; van der Wal, A.; Presser, V.; Biesheuvel, P.M. Review on the science and technology of water desalination by capacitive deionization. Prog. Mater. Sci. 2013, 58, 1388–1442. [Google Scholar] [CrossRef] [Green Version]
- Long, R.; Li, B.; Liu, Z.; Liu, W. Reverse electrodialysis: Modelling and performance analysis based on multi-objective optimization. Energy 2018, 151, 1–10. [Google Scholar] [CrossRef]
- Kwon, K.; Han, J.; Park, B.H.; Shin, Y.; Kim, D. Brine recovery using reverse electrodialysis in membrane-based desalination processes. Desalination 2015, 362, 1–10. [Google Scholar] [CrossRef]
- Mehdizadeh, S.; Yasukawa, M.; Abo, T.; Kakihana, Y.; Higa, M. Effect of spacer geometry on membrane and solution compartment resistances in reverse electrodialysis. J. Membr. Sci. 2019, 572, 271–280. [Google Scholar] [CrossRef]
- Pawlowski, S.; Crespo, J.G.; Velizarov, S. Pressure drop in reverse electrodialysis: Experimental and modeling studies for stacks with variable number of cell pairs. J. Membr. Sci. 2014, 462, 96–111. [Google Scholar] [CrossRef]
- Tong, X.; Zhang, B.; Chen, Y. Fouling resistant nanocomposite cation exchange membrane with enhanced power generation for reverse electrodialysis. J. Membr. Sci. 2016, 516, 162–171. [Google Scholar] [CrossRef] [Green Version]
- Zhu, X.; He, W.; Logan, B.E. Influence of solution concentration and salt types on the performance of reverse electrodialysis cells. J. Membr. Sci. 2015, 494, 154–160. [Google Scholar] [CrossRef] [Green Version]
- Tedesco, M.; Brauns, E.; Cipollina, A.; Micale, G.; Modica, P.; Russo, G.; Helsen, J. Reverse electrodialysis with saline waters and concentrated brines: A laboratory investigation towards technology scale-up. J. Membr. Sci. 2015, 492, 9–20. [Google Scholar] [CrossRef] [Green Version]
- Veerman, J.; Saakes, M.; Metz, S.J.; Harmsen, G.J. Reverse electrodialysis: Performance of a stack with 50 cells on the mixing of sea and river water. J. Membr. Sci. 2009, 327, 136–144. [Google Scholar] [CrossRef] [Green Version]
- Turek, M.; Bandura, B.; Dydo, P. Power production from coal-mine brine utilizing reversed electrodialysis. Desalination 2008, 221, 462–466. [Google Scholar] [CrossRef]
- Avci, A.H.; Sarkar, P.; Tufa, R.A.; Messana, D.; Argurio, P.; Fontananova, E.; Di Profio, G.; Curcio, E. Effect of Mg2+ ions on energy generation by Reverse Electrodialysis. J. Membr. Sci. 2016, 520, 499–506. [Google Scholar] [CrossRef]
- Daniilidis, A.; Vermaas, D.A.; Herber, A.; Nijmeijer, K. Experimentally obtainable energy from mixing river water, seawater or brines with reverse electrodialysis. Renew. Energ. 2014, 64, 123–131. [Google Scholar] [CrossRef]
- Kingsbury, R.S.; Liu, F.; Zhu, S.; Boggs, C.; Armstrong, M.D.; Call, D.F.; Coronell, O. Impact of natural organic matter and inorganic solutes on energy recovery from five real salinity gradients using reverse electrodialysis. J. Membr. Sci. 2017, 541, 621–632. [Google Scholar] [CrossRef]
- Moreno, J.; Diez, V.; Saakes, M.; Nijmeijer, K. Mitigation of the effects of multivalent ion transport in reverse electrodialysis. J. Membr. Sci. 2018, 550, 155–162. [Google Scholar] [CrossRef]
- Guo, Z.-Y.; Ji, Z.-Y.; Zhang, Y.-G.; Yang, F.-J.; Liu, J.; Zhao, Y.-Y.; Yuan, J.-S. Effect of ions (K+, Mg2+, Ca2+ and SO42−) and temperature on energy generation performance of reverse electrodialysis stack. Electrochim. Acta 2018, 290, 282–290. [Google Scholar] [CrossRef]
- Vermaas, D.A.; Veerman, J.; Saakes, M.; Nijmeijer, K. Influence of multivalent ions on renewable energy generation in reverse electrodialysis. Energy Environ. Sci. 2014, 7, 1434–1445. [Google Scholar] [CrossRef] [Green Version]
- Post, J.W.; Hamelers, H.V.M.; Buisman, C.J.N. Influence of multivalent ions on power production from mixing salt and fresh water with a reverse electrodialysis system. J. Membr. Sci. 2009, 330, 65–72. [Google Scholar] [CrossRef]
- Higa, M.; Tanioka, A.; Miyasaka, K. A study of ion permeation across a charged membrane in multicomponent ion systems as a function of membrane charge density. J. Membr. Sci. 1990, 49, 145–169. [Google Scholar] [CrossRef]
- Rijnaarts, T.; Huerta, E.; Van Baak, W.W.; Nijmeijer, K. Effect of divalent cations on RED performance and cation exchange membrane selection to enhance power densities. Environ. Sci. Technol. 2017, 51, 13028–13035. [Google Scholar] [CrossRef]
- Tedesco, M.; Scalici, C.; Vaccari, D.; Cipollina, A.; Tamburini, A.; Micale, G. Performance of the first reverse electrodialysis pilot plant for power production from saline waters and concentrated brines. J. Membr. Sci. 2016, 500, 33–45. [Google Scholar] [CrossRef] [Green Version]
- Tedesco, M.; Cipollina, A.; Tamburini, A.; Micale, G. Towards 1 kW power production in a reverse electrodialysis pilot plant with saline waters and concentrated brines. J. Membr. Sci. 2017, 522, 226–236. [Google Scholar] [CrossRef] [Green Version]
- Yasukawa, M.; Mehdizadeh, S.; Sakurada, T.; Abo, T.; Kuno, M.; Higa, M. Power generation performance of a bench-scale reverse electrodialysis stack using wastewater discharged from sewage treatment and seawater reverse osmosis. Desalination 2020, 491, 114449. [Google Scholar] [CrossRef]
- Mei, Y.; Tang, C.Y. Co-locating reverse electrodialysis with reverse osmosis desalination: Synergies and implications. J. Membr. Sci. 2017, 539, 305–312. [Google Scholar] [CrossRef]
- Seawater Desalination Plant. Enterprise Bureau Okinawa Prefecture. Issued by 2004. Available online: https://www.eb.pref.okinawa.jp/sp/userfiles/files/page/opeb/961/201610_kaitan_english.pdf (accessed on 20 December 2020).
- Tufa, R.A.; Curcio, E.; Van Baak, W.; Veerman, J.; Grasman, S.; Fontananova, E.; Di Profio, G. Potential of brackish water and brine for energy generation by salinity gradient power-reverse electrodialysis (SGP-RE). RSC Adv. 2014, 4, 42617–42623. [Google Scholar] [CrossRef] [Green Version]
- Nam, J.-Y.; Hwang, K.-S.; Kim, H.-C.; Jeong, H.; Kim, H.; Jwa, E.; Yang, S.C.; Choi, J.; Kim, C.-S.; Han, J.-H.; et al. Assessing the behavior of the feed-water constituents of a pilot-scale 1000-cell-pair reverse electrodialysis with seawater and municipal wastewater effluent. Water Res. 2019, 148, 261–271. [Google Scholar] [CrossRef] [PubMed]
- Yip, N.Y.; Elimelech, M. Thermodynamic and energy efficiency analysis of power gneration from natural salinity gradients by pressure retarded osmosis. Environ. Sci. Technol. 2012, 46, 5230–5239. [Google Scholar] [CrossRef] [PubMed]


| Solution | Conductivity [mS/cm] | Na+ | K+ | Mg2+ | Ca2+ | Cl− | SO42− |
|---|---|---|---|---|---|---|---|
| RW [mmol/dm3] | 0.34 ± 0.05 | 0.89 | 0.20 | 0.19 | 0.93 | 1.00 | 0.20 |
| SW [mmol/dm3] | 51.9 ± 1 | 469 | 33.0 | 61.0 | 12.0 | 489 | 25.0 |
| RO brine [mmol/dm3] | 81.9 ± 1 | 778 | 12.0 | 87.0 | 20.0 | 990 | 44.0 |
| Membrane | Type | IEC * [meq/g] | Water Content [-] | Resistance [Ω·cm2] | Thickness [µm] |
|---|---|---|---|---|---|
| CIMS | One side cation monovalent selective | 2.3 | 0.30 | 2.49 | 150 |
| ACS-8T | One side anion monovalent selective | 1.9 | 0.39 | 2.41 | 150 |
Publisher’s Note: MDPI stays neutral with regard to jurisdictional claims in published maps and institutional affiliations. |
© 2021 by the authors. Licensee MDPI, Basel, Switzerland. This article is an open access article distributed under the terms and conditions of the Creative Commons Attribution (CC BY) license (http://creativecommons.org/licenses/by/4.0/).
Share and Cite
Mehdizadeh, S.; Kakihana, Y.; Abo, T.; Yuan, Q.; Higa, M. Power Generation Performance of a Pilot-Scale Reverse Electrodialysis Using Monovalent Selective Ion-Exchange Membranes. Membranes 2021, 11, 27. https://doi.org/10.3390/membranes11010027
Mehdizadeh S, Kakihana Y, Abo T, Yuan Q, Higa M. Power Generation Performance of a Pilot-Scale Reverse Electrodialysis Using Monovalent Selective Ion-Exchange Membranes. Membranes. 2021; 11(1):27. https://doi.org/10.3390/membranes11010027
Chicago/Turabian StyleMehdizadeh, Soroush, Yuriko Kakihana, Takakazu Abo, Qingchun Yuan, and Mitsuru Higa. 2021. "Power Generation Performance of a Pilot-Scale Reverse Electrodialysis Using Monovalent Selective Ion-Exchange Membranes" Membranes 11, no. 1: 27. https://doi.org/10.3390/membranes11010027