Article

Immunogenicity and Protection against Mycobacterium caprae Challenge in Goats Vaccinated with BCG and Revaccinated after One Year

1
IRTA, Centre de Recerca en Sanitat Animal (CReSA, IRTA-UAB), Campus UAB, 08193 Bellaterra, Spain
2
Departament de Medicina i Cirurgia Animals, Universitat Autònoma de Barcelona (UAB), 08193 Bellaterra, Spain
3
Lionex Diagnostics and Therapeutics GmbH, D-38126 Braunschweig, Germany
4
Animal and Plant Health Agency (APHA), Addlestone KT15 3NB, UK
5
Department of Biological, Environmental and Rural Sciences, University of Aberystwyth, Aberystwyth SY23 3DA, UK
6
Departament de Sanitat i Anatomia Animals, Universitat Autònoma de Barcelona (UAB), 08193 Bellaterra, Spain
*
Author to whom correspondence should be addressed.
Vaccines 2020, 8(4), 751; https://doi.org/10.3390/vaccines8040751
Submission received: 18 November 2020 / Revised: 5 December 2020 / Accepted: 7 December 2020 / Published: 10 December 2020
(This article belongs to the Special Issue Development of Vaccines against Tuberculosis: One Health Approach)

Abstract

:
Vaccination has been proposed as a supplementary tool for the control of tuberculosis in livestock. The long-term immunogenicity elicited by bacillus Calmette–Guerin (BCG) and the efficacy of revaccination were investigated in thirty goat kids distributed into three groups: unvaccinated controls, BCG (vaccinated at week 0) and BCG-BCG (vaccinated at weeks 0 and 56). Sixty-four weeks after the first vaccination, all animals were challenged with Mycobacterium caprae and examined post-mortem (pathology and bacterial load) at week 73. Antigen-specific interferon-gamma (IFN-γ) release was measured throughout the experiment. At week 59, peripheral blood mononuclear cells were stained for CD4, CD45RO and IFN-γ to determine the presence of antigen-specific cells secreting IFN-γ. The BCG-BCG group showed reductions in rectal temperatures, M. caprae DNA load in pulmonary lymph nodes (LN), the volume of lesions in pulmonary LN, mineralization in lungs, and higher weight gains compared to unvaccinated controls. IFN-γ responses were undetectable from 32 weeks after primary vaccination until revaccination, when the BCG-BCG group showed detectable IFN-γ production and a greater percentage of antigen-specific CD4+CD45RO+IFNγ+ and CD4CD45RO+IFNγ+ cells compared to the BCG and control groups, which may be an indicator of the mechanisms of protection. Thus, re-vaccination of goats with BCG appears to prolong protection against infection with M. caprae.

1. Introduction

The control of animal tuberculosis (TB) due to Mycobacterium bovis and Mycobacterium caprae, both members of the Mycobacterium tuberculosis complex (MTBC), remains a major challenge not only for animal but also for public health. The WHO estimated that zoonotic TB due to M. bovis caused more than 140,000 new human infections and more than 12,000 deaths worldwide in 2018 [1]. In particular, TB-infected goats pose a risk of transmission for people in close contact with animals, such as farmers, veterinarians, or slaughterhouse personnel [2], and have been shown to be a source of infection for other livestock animals [3,4]. In Spain, the EU country with the second highest number of goat heads (2.7 million) and the eighth largest producer of goat milk worldwide (more than 450,000 tons) (data extracted from FAOSTAT on 30/04/2020), caprine TB also causes significant economic losses for animal holdings due to production losses and commercial restrictions imposed on infected herds. The M. bovis bacillus Calmette–Guerin (BCG), an attenuated strain of M. bovis, is the only licensed vaccine against human TB, and no vaccines against TB are currently registered for livestock. However, over the past two decades, there has been a renewed interest in the use of vaccines to prevent TB in livestock, and several TB vaccination trials have been undertaken in cattle [5]. However, although experimental vaccination trials in cattle have provided encouraging results, cattle field trials have been more variable (reviewed in [5,6]). Our research group and others have undertaken vaccination trials in goats and demonstrated that BCG conferred a degree of protection against M. caprae in experimental and natural settings [7,8].
The induction of protective immunity and its duration are key points for vaccine development. Antigen-specific immune responses to mycobacteria are generally measured through the evaluation of the in vitro secretion of Interferon-gamma (IFN-γ) by lymphocytes cultured with MTBC antigens. A requisite for a successful vaccine is the induction and differentiation of T-cells into IFN-γ secreting antigen-specific memory cells that may rapidly reach the site of the infection [9,10]. In addition, the durability of this vaccine-induced immunity is thought to be critical for the development of effective vaccination strategies against TB, enabling the host to respond more quickly and effectively after re-exposure to MTBC antigens. It has been shown that protection conferred by BCG in cattle wanes with time [11]; and that BCG revaccination prolonged the duration of protection conferred against M. bovis infection by the primary vaccination [12].
Finally, the major constraint for the use of BCG either in cattle or goats is the interference of vaccination with the tuberculin skin test and IFN-γ release assay (IGRA), which are the approved tests for the diagnosis of TB in livestock. In this sense, the suitability of other MTBC-specific antigens as potential diagnostic test targets for differentiating infected from vaccinated animals (DIVA tests) is another focus of interest on animal TB research [13].
In the present study, we evaluated: (1) the efficacy of BCG revaccination against M. caprae challenge in goats; (2) the duration of the immunity induced by BCG vaccination in goats and characterize the immunity induced after revaccination; and (3) the long-term BCG-induced interferences on TB immunodiagnosis.

2. Materials and Methods

2.1. Animals, Vaccination Schedule and Experimental Infection

Thirty Murciano-granadina female goat kids, aged 6 to 7 weeks, were sourced from the experimental farm of the Universitat Autònoma de Barcelona (Catalonia, Spain). Experimental animals were negative to the IGRA as performed using a commercial kit (ID screen® Ruminant IFN-γ, ID.vet, Grabels, France). Goats were randomly assigned to three experimental groups of 10 animals each: Unvaccinated control, BCG, and BCG-BCG. Animals from BCG and BCG-BCG groups were subcutaneously inoculated (right axilla) with 0.5 mL (5 × 10⁵ Colony Forming Units/animal) of M. bovis BCG Danish 1331 strain (ATCC, Ref. 35733TM) at week 0. BCG-BCG animals were re-vaccinated 56 weeks later. The BCG vaccine stock was generated as described previously [14] and diluted in sterile phosphate buffered saline (PBS) to reach a suspension of 1 × 10⁶ Colony Forming Units (CFU)/mL before use, and 0.5 mL were inoculated into each animal. Blood samples from all animals were taken every 8 weeks from week 0 to week 56, and at week 59 (3 weeks after re-vaccination).
At week 63, all animals from the three experimental groups (unvaccinated control, BCG, and BCG-BCG) were transferred from the experimental farm to the Biosafety Level 3 (BLS3) facilities of IRTA-CReSA. Animals were housed in groups of 10 with three or four animals from each group. One week later, goats were sedated intramuscularly (with Equipromacina® at 0.05 mg/kg and Torbugesic® at 0.2 mg/kg). Subsequently, goats were anaesthetized intraveonusly (with Propofol Lipuro® at 4–5 mg/kg), and then endobronchially challenged with M. caprae (~3 × 10³ CFU), as previously described [3]. The inoculum stock of M. caprae strain SB0416 (www.Mbovis.org) was prepared as described previously [3]. After the challenge, animals were monitored daily for clinical signs of TB, weighed and bled every two weeks, and rectal temperature was measured every week. Animals were euthanized at week 72 (9 weeks after challenge).
Animals were fed with hay and food supplements as necessary and maintained with water ad libitum throughout the experiment.

2.2. Ethics Statement

All experimental animal procedures were approved by the Animal Research Ethics Commission of the Generalitat de Catalunya (procedure number 8697/2015), according to current European legislation for the protection of experimental animals (86/609/EEC, 91/628/EEC, 92/65/EEC and 90/425/EEC).

2.3. In Vitro IFN-γ Release Assay (IGRA)

Whole Blood samples from all experimental goats were collected from the jugular vein in 10 mL heparinized tubes at weeks 0 (prior to vaccination), 8, 16, 24, 32, 40, 48, 56 (before revaccination), 59, 64 (prior to challenge), 66, 68, 70 and 72 of the experiment. Whole blood samples were stimulated in 96-deep well cell culture plates (Eppendorf Ibérica, Madrid, Spain) with M. bovis (PPD-B) and with M. avium (PPD-A) tuberculins (CZ Veterinaria, Porriño, Galicia, Spain), and a cocktail of the recombinant proteins ESAT-6 and CFP-10 (EC) [15], at a final concentration for all three reagents of 20 µg/mL. PBS was used as a negative control for the stimulation of blood samples from each animal. Samples were incubated at 37 °C in a 5% CO2, 95% humidity atmosphere. After 16–20 h of incubation, plasma supernatants were harvested by centrifugation at 18× g for 10 min and analyzed immediately by sandwich ELISA for bovine IFN-γ (ID.vet) or stored at −20 °C for subsequent analysis. The IGRA was performed following the manufacturer instructions. The results of IGRA based on tuberculins were interpreted using the cut-off point of sample to positive ratios (S/P) recommended by the manufacturer: ((Optical density (OD) of PPD-B − OD of PPD-A)/(OD mean kit positive control (CP) − OD mean kit negative control (CN))) × 100. A sample was considered positive if S/P ≥ 16%. The results of IGRA based on EC, were calculated as follows: S/P = ((OD of EC − OD of PBS)/(OD CP − OD CN)) × 100. A sample was considered positive if the sample S/P ≥ 16%.

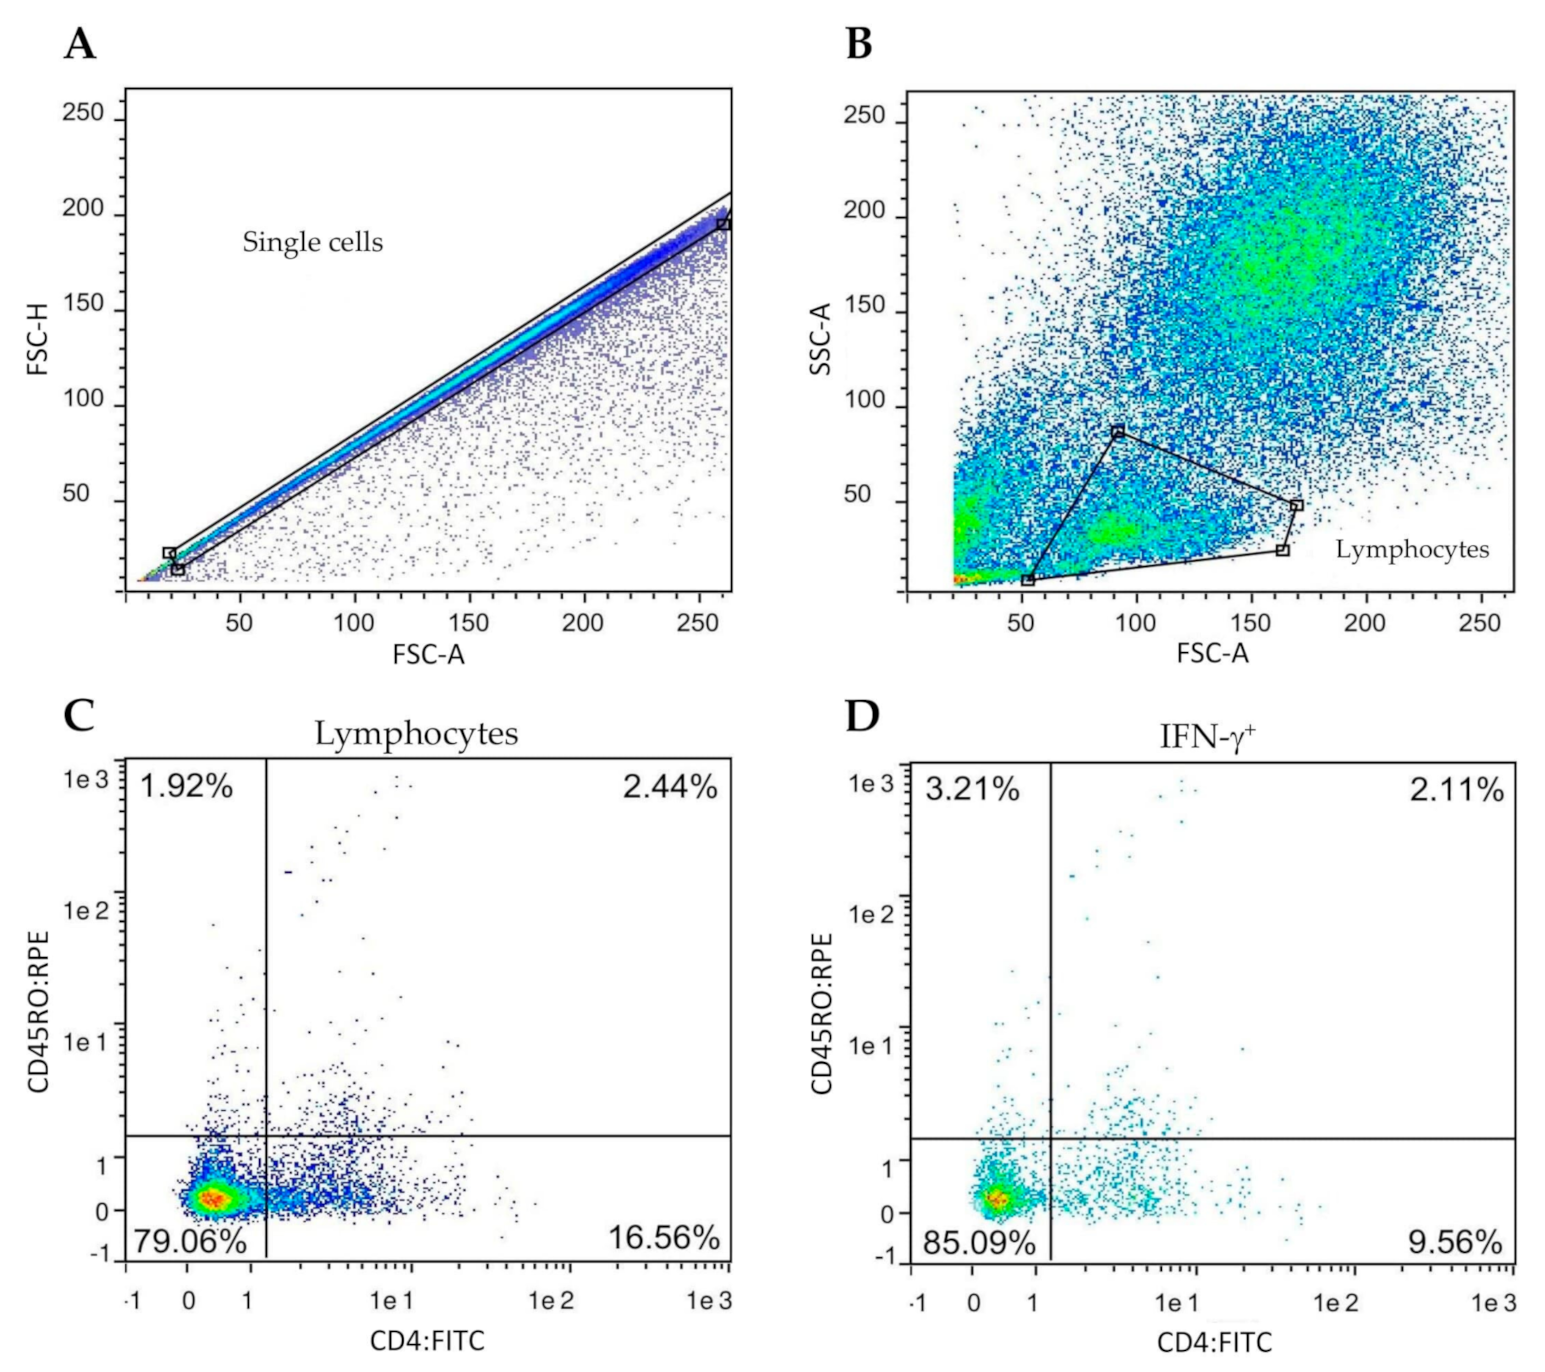
2.4. Flow Cytometry and Intracellular IFN-γ Staining

Flow cytometry analysis was performed at week 59 (3 weeks after revaccination), and in order to evaluate IFN-γ+ T-cell memory subsets expanded after revaccination and one year after vaccination. Firstly, the blood from the 30 goats was collected using the BD vacutainer CPT with sodium citrate (BD, Franklin Lakes, NJ, USA). Peripheral blood mononuclear cells (PBMC) were then isolated from blood samples following the BD vacutainer CPT instructions. Isolated PBMC were stimulated in 24-well plates (2 × 10⁶ cells/well) with PPD-B at a final concentration of 10 μg/mL in RPMI 1640 cell culture medium (Sigma-Aldrich, St. Louis, MO, USA) supplemented with 10% foetal calf serum (Sigma-Aldrich), non-essential amino-acids (Sigma-Aldrich), 5 × 10⁻⁵ M 2-mercaptoethanol, 100 U/mL penicillin and 100 μg/mL streptomycin sulphate. Cells were incubated at 37 °C with 5% CO2, 95% humidity for 6 h. Then, brefeldin A (Sigma-Aldrich, Steinheim, Germany) was added at a final concentration of 10 μg/mL, and cells were incubated for a further 16 h.
Stimulated PBMC were counted, and 3 × 10⁵ cells/well were dispensed in 96-well plates. Cells were stained with mouse monoclonal antibodies (mAb) CC8 (IgG2A, conjugated to FITC), which recognizes bovine CD4, and mAb IL-A116 (IgG3, conjugated to RPE), which recognizes bovine CD45RO (both from Bio-Rad Laboratories Inc., Hercules, CA, USA). CD4 and CD45RO stained cells were then fixed and permeabilized with LeucopermTM (Bio-Rad), according to the manufacturer’s instructions, and incubated with mAb CC302 (IgG1, conjugated to Alexa Fluor® 647, Bio-Rad), which recognizes bovine IFN-γ, for 30 min at room temperature. Finally, cells were re-suspended in 200 µL PBS with 1% paraformaldehyde, stored at 4 °C in the dark, and analyzed within 24 h.
Stained cells were analyzed by flow cytometry in a MACSQuantify™ instrument (Miltenyi Biotec, Bergisch Gladbach, Germany). The gating strategy is shown in Figure 1.

2.5. Skin Tests

In order to evaluate the effect of vaccination on the skin test, tuberculin-based and DIVA skin tests were carried out in all experimental goats from each group. Skin tests were carried out 59 weeks after vaccination for the BCG group and 3 weeks after revaccination for the BCG-BCG group. First, the proximal zone of both sides of the neck was shaved, and basal skinfold thickness (BST) was measured with a caliper. Then, the single intradermal cervical tuberculin test (SIT) was performed by inoculating 100 µL of PPD-B (CZ Veterinaria, 25,000 IU/mL) at the right side of the neck using a Dermojet® syringe. At the left side of the neck, 100 µL of a tetravalent fusion recombinant protein (TFP, Lionex) was intradermically inoculated to all animals (100 µg/mL). The TFP contained four MTBC-specific antigens (Rv3615c, Rv3020c, ESAT-6, and CFP-10), and was used as DIVA skin test reagent. Finally, 72 h after inoculation, skinfold thickness was measured and compared to BST. An animal was considered as positive if the difference between the BST and the 72 h post-inoculation skinfold thickness was ≥4 mm or clinical signs were seen (i.e., swelling, oedema, exudation, or necrosis), as a doubtful if this difference was ≥2 mm and <4 mm, and negative if the difference was <2 mm.

2.6. Post-Mortem Examination

In order to assess the efficacy of BCG revaccination against M. caprae challenge, a complete necropsy was carried out at week 72 (week 9 post-challenge). First, goats were euthanized by intravenous injection of an overdose of sodium pentobarbital. Then, pulmonary lymph nodes (LN), i.e., cranial and caudal mediastinal LN and tracheobronchial LN, were carefully removed, avoiding piercing of the pleura. Pulmonary LN were sliced at 3-mm intervals, and diameters of TB lesions were measured for further calculation of the approximate volume of gross lesions. The volume of lesions in the LN was calculated by using the formula of the most similar geometrical morphology of each lesion (sphere, cylinder, cone or prism). Afterwards, whole pulmonary LN were stored at −20 °C for further MTBC DNA burden assessment.
Whole lungs were carefully removed and filled with 10% buffered formalin [16], and analyzed 30 days later by computed tomography following procedures previously described [14]. Briefly, whole lungs were scanned using a 16-slice multi-detector CT scanner (Brivo CT-385, General Electric Healthcare, Madrid, Spain). The volume of lungs and total volume of TB lesions were then calculated employing the volume rendering, using different density patterns (mineralized, solid and cavitary lesions), and multi-planar 2-D and 3-D reconstructions. The volume of mineralized lesions was calculated using 100–300 Hounsfield units.
Other viscera with gross TB-like lesions were collected and fixed in formalin for histopathological confirmation by Hematoxylin/Eosin staining.

2.7. M. caprae DNA Burden Assessment by qPCR

Mediastinal and tracheobronchial LN were thawed and sliced with sterile scissors and subsequently homogenized in 10 mL of sterile distilled water using a homogenizer (Masticator®, IUL Instruments, Barcelona, Catalonia, Spain). Homogenates of LN for each goat were pooled, and an aliquot of 200 μL was inactivated at 75 °C for 1 h. In parallel, an aliquot of M. caprae strain at 108 CFU/mL, the same used for the challenge inoculum preparation, was also inactivated and then serially diluted ten-fold in order to establish titered standards. Afterwards, DNA from homogenates and the standards was extracted using the DNA EXTRACT VK kit (Vacunek, Derio, Spain) and amplified using a commercial MTBC-specific qPCR kit (TBC-VK kit, Vacunek), both steps according to the manufacturer’s procedures. Amplification was performed in a 7500 fast real-time PCR system (Applied Biosystems, Foster City, CA, USA). A standard curve was established using Ct values of standards (ten-fold dilutions of already titered M. caprae inoculum strain), and M. caprae CFU genomic equivalents were calculated by the extrapolation of Ct value obtained for each DNA sample.

2.8. Data Analysis

A randomized block design was used for data analyses conducted after M. caprae challenge (blocking was used to remove the eventual box effects). Differences in the volume of TB lesions in the lungs among groups were assessed by two-way ANOVA followed by a one-tailed post-hoc Tukey test. The volume of lesions in LN and volume of mineralized lesions in lungs were Box-Cox transformed to meet a normal distribution of data, and comparisons among groups were also analyzed by two-way ANOVA followed by a post-hoc Tukey test. Comparisons among treatment groups of bacterial loads inferred by qPCR (previously adjusted to consider the blocking factor by obtaining residuals from box effect with a linear regression model), IFN-γ levels obtained by IGRAs prior to challenge, and frequency of cell subsets obtained by flow cytometry were performed by non-parametric Kruskal–Wallis test followed by a post-hoc Wilcoxon rank-sum test. Mean rectal temperatures, mean body weight changes, and IFN-γ levels against PPD-B and EC after challenge were analyzed by a linear mixed-effect model (LMER), with the box factor as a random effect, in order to take into account missing data from two euthanized animals at week 72 of the experiment. Pairwise comparisons among groups were performed with the function “pairs” from the package “emmeans” from R. A t-test was used to compare IFN-γ levels of revaccinated animals 8 weeks after the first vaccination and 8 weeks after revaccination. In addition, Spearman and Pearson correlations were used to evaluating the association between different populations of memory or effector T-cells and post-mortem parameters (i.e., bacterial load measured by qPCR, the volume of lesions in LN, and total volume of lesions) and the association of post-mortem parameters with IFN-γ levels at weeks 68, 70 and 72, the body weight changes at weeks 3, 4 and 5 post-challenge, and rectal temperatures at weeks 3, 4 and 5 post-challenge.
The analysis was carried out using RStudio Team (2019). RStudio: Integrated Development for R. (RStudio, Inc., Boston, MA, USA).

3. Results

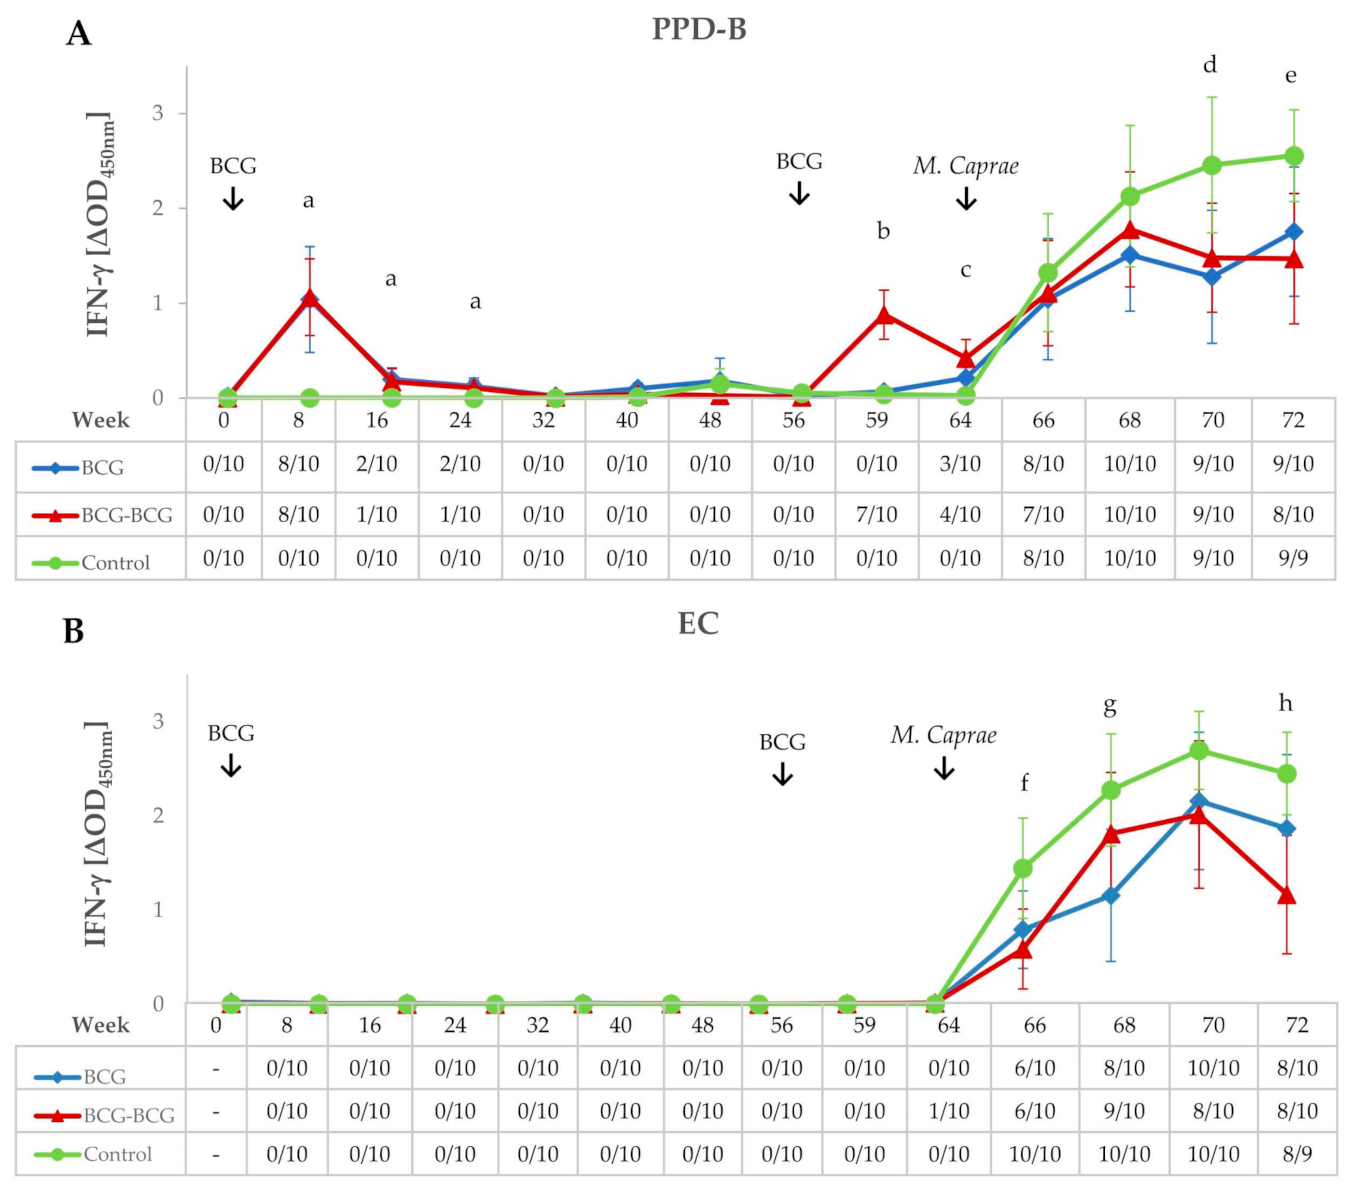
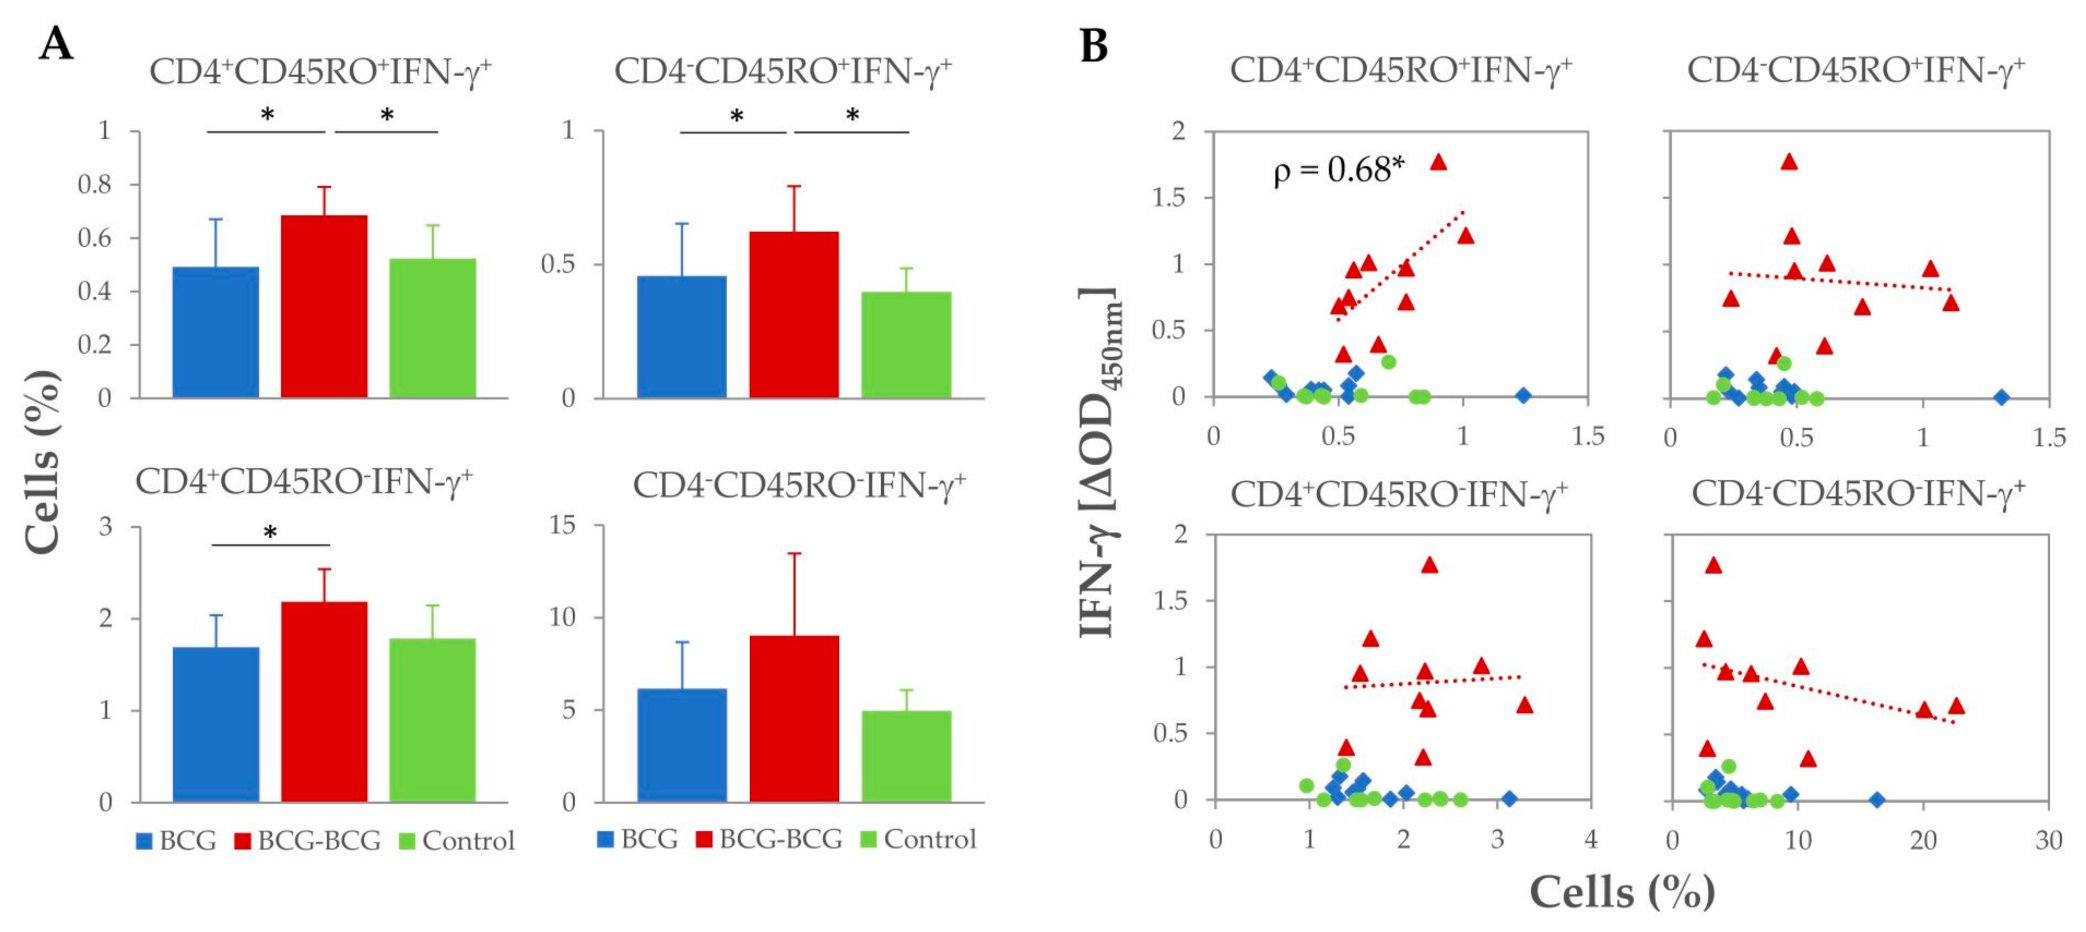
3.1. Immunological Responses after Vaccination and Revaccination

IFN-γ release after ex vivo stimulation of whole blood with PPD-B and EC antigenic cocktail was measured throughout the experiment (Figure 2A,B, respectively). Both vaccinated groups showed higher secretion of IFN-γ in response to PPD-B at eight weeks post-vaccination (wpv) compared to the control group (p < 0.01), and responses decreased appreciably at 16 wpv. At week 32, responses returned to pre-vaccination levels, with all animals remaining negative to IGRA until 56 wpv. Animals in the BCG-BCG group were inoculated at week 56 with BCG as indicated in Materials and Methods. Whole blood IFN-γ responses to PPD-B in the BCG-BCG group increased three weeks after revaccination (59 wpv); these IFN-γ responses were significantly higher compared to non-revaccinated animals (BCG and control groups) (p < 0.001). Eight weeks after revaccination (64 wpv), antigen-specific secretion of IFN-γ in the BCG-BCG group was significantly lower than that detected at eight weeks after primary vaccination (mean ΔOD: 0.422, 95% CI: 0.226–0.618; and mean ΔOD: 1.065, 95% CI: 0.660–1.470, respectively, p < 0.01, Figure 2A), whereas no animals positive for EC-IGRA were found after vaccination and/or revaccination (Figure 2B).
Analysis of T-cell subsets and potential secretion of IFN-γ was performed by flow cytometry at 59 wpv (three weeks after revaccination). Revaccination of goats resulted in an expansion of all IFN-γ+ T-cell subsets after stimulation of PBMC with PPD-B (Figure 3A). Higher frequencies of CD4+CD45RO+IFN-γ+and CD4CD45RO+IFN-γ+ T-cell subsets (hypothetical IFN-γ-producing memory T-cells) were observed in the BCG-BCG group compared to BCG and control groups (p < 0.05), and the proportion of CD4+CD45RO IFN-γ+ T-cells was also higher compared to the BCG group (p < 0.05). Within revaccinated goats, whole blood PPD-B-specific IFN-γ release at 59 wpv correlated directly with the frequency of CD4+CD45RO+IFN-γ+ populations (Spearman ρ = 0.68, p < 0.05), whereas no association between the frequency of the other IFN-γ+ cell populations and the levels of IFN-γ released were found (Figure 3B).
Delayed-type hypersensitivity (DTH), after PPD-B and TFP intradermal inoculations, was also measured in all goats at three weeks post-revaccination (59 wpv). Individual skin thickness increase and qualitative results of SIT and TFP-skin test are shown in Figure 4. Five out of ten and four out of ten single-dose BCG-vaccinated animals were positive and doubtful to SIT, respectively, while 2/10 animals were doubtful to the TFP-skin test. All revaccinated animals were positive to SIT, and 4/10 were positive and 2/10 were doubtful to TFP-skin test. One animal from the control group was positive to both skin tests, and three other animals were doubtful for SIT or TFP-skin tests.

3.2. IFN-γ Responses After M. caprae Challenge

Goats were challenged at 64 wpv and remained infected for nine weeks (from 64 to 72 wpv). After the challenge, in vitro whole blood PPD-B-specific IFN-γ responses increased in all groups and reached a plateau in both vaccinated groups from four weeks post-challenge (68 wpv) onwards, while responses remained high in the control group until the end of the experiment, being statistically higher when compared to BCG and BCG-BCG groups (p < 0.05) at seven and nine weeks post-challenge (wpc), respectively (Figure 2A). Similar kinetics were observed for EC-specific IFN-γ responses, however a remarkable decrease in the BCG group and even more in the BCG-BCG group were found at 9 wpc. The increase in EC-specific IFN-γ levels (Figure 2B) in the control group was statistically significant (p < 0.05) compared to the BCG group at 5 wpc and the BCG-BCG group at 3 and 9 wpc (p < 0.05 and p < 0.01, respectively).

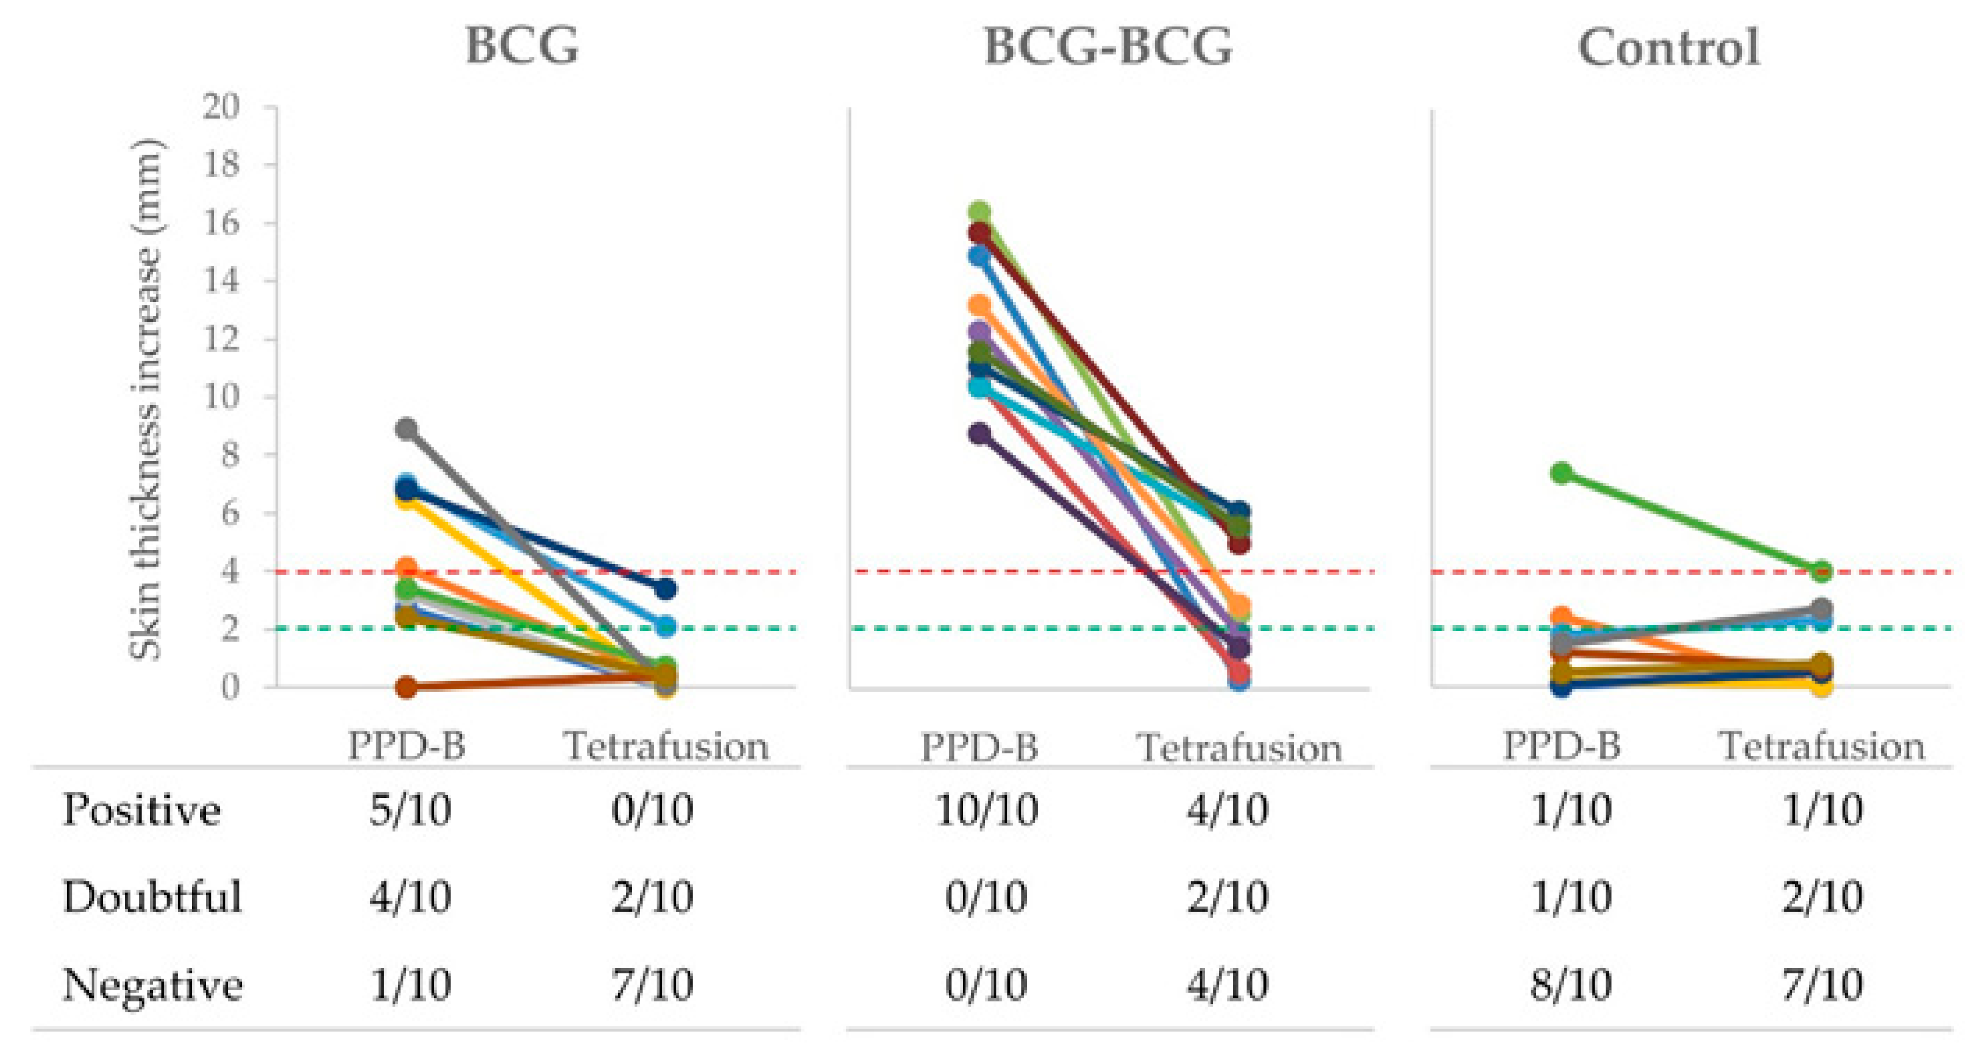
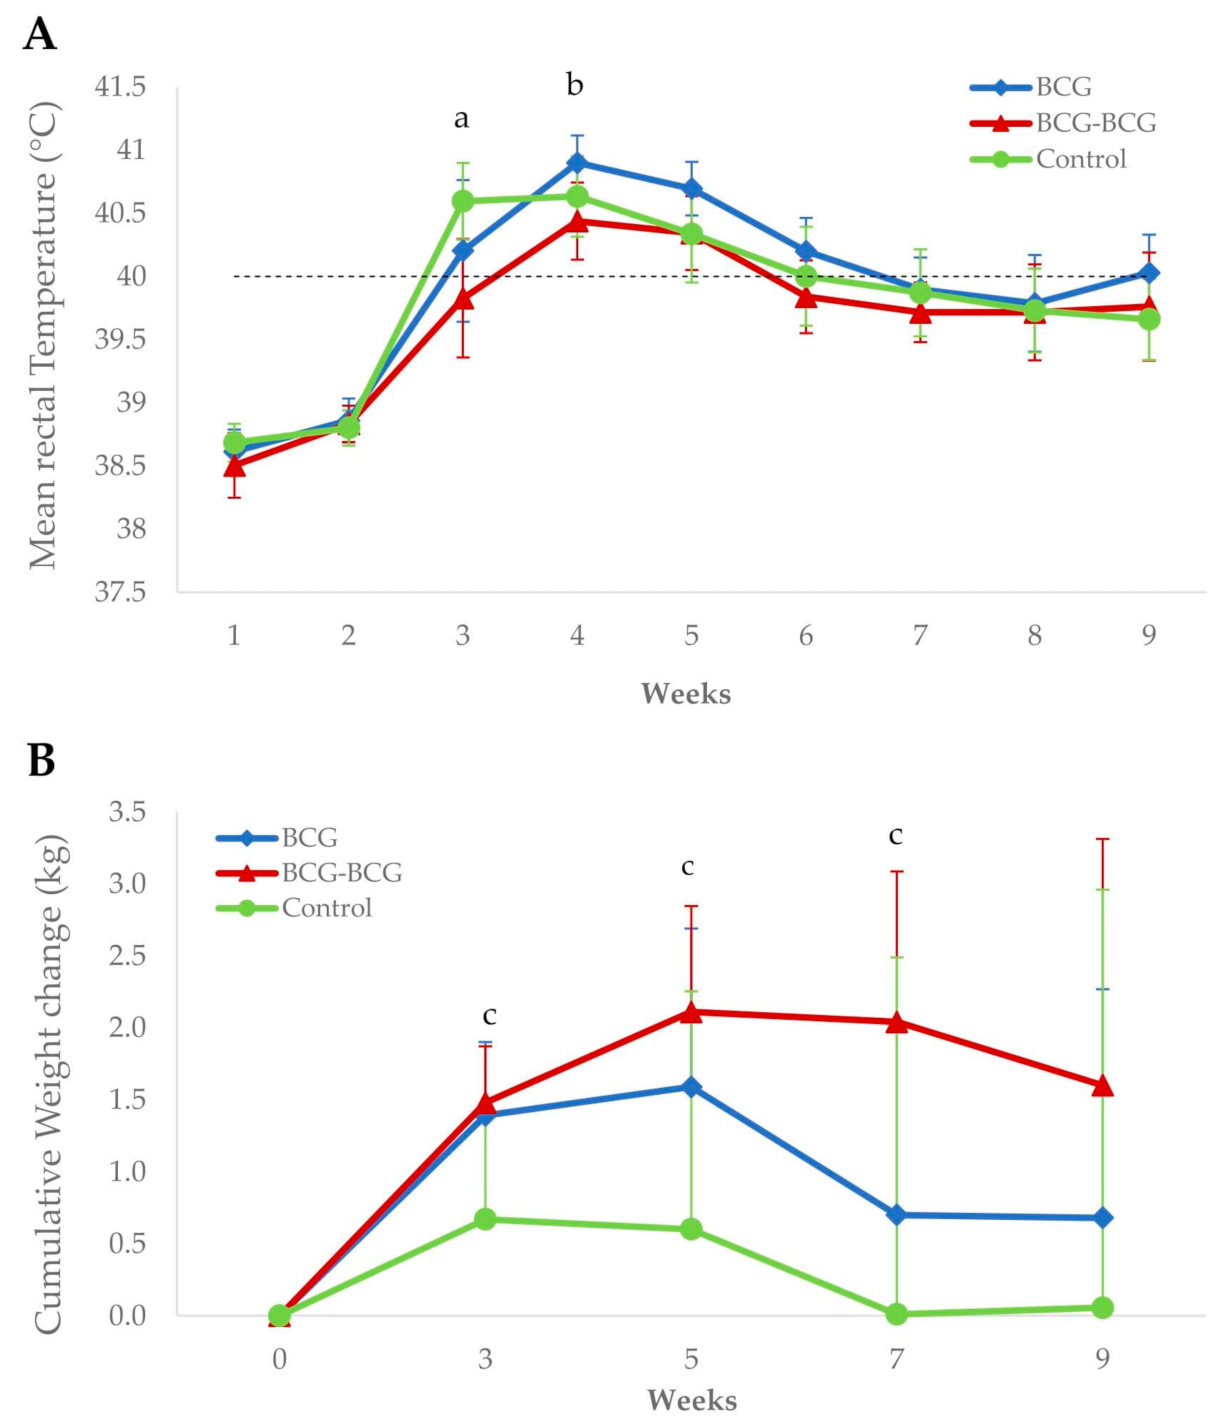
3.3. Clinical Signs and Body Condition Post-Challenge

Goats were monitored for clinical signs of TB after the challenge. Twenty-six, out of 30 animals, showed a sporadic or persistent cough from 4 wpc until the end of the experiment. By the end of the experiment (72 wpv, 9 wpc), severe clinical signs (i.e., dyspnoea, lethargy or anorexia) were observed in 5/10, 5/10, and 5/9 goats in the BCG, BCG-BCG, and control groups, respectively. Dyspnoea and apathy were first observed at 5 wpc in one animal of the control group, which was euthanized one week before the end of the experiment due to ethical endpoint criteria.
Revaccinated animals showed a significantly lower mean rectal temperature (p < 0.05) compared to control and BCG groups at 3 and 4 wpc, respectively (Figure 5A). Additionally, the BCG-BCG group showed significant mean body weight gains at 3, 5 and 7 wpc compared to the control group (p < 0.05). Mean body weight changes were also higher in the BCG group than in the control group, but were not statistically significant (Figure 5B).

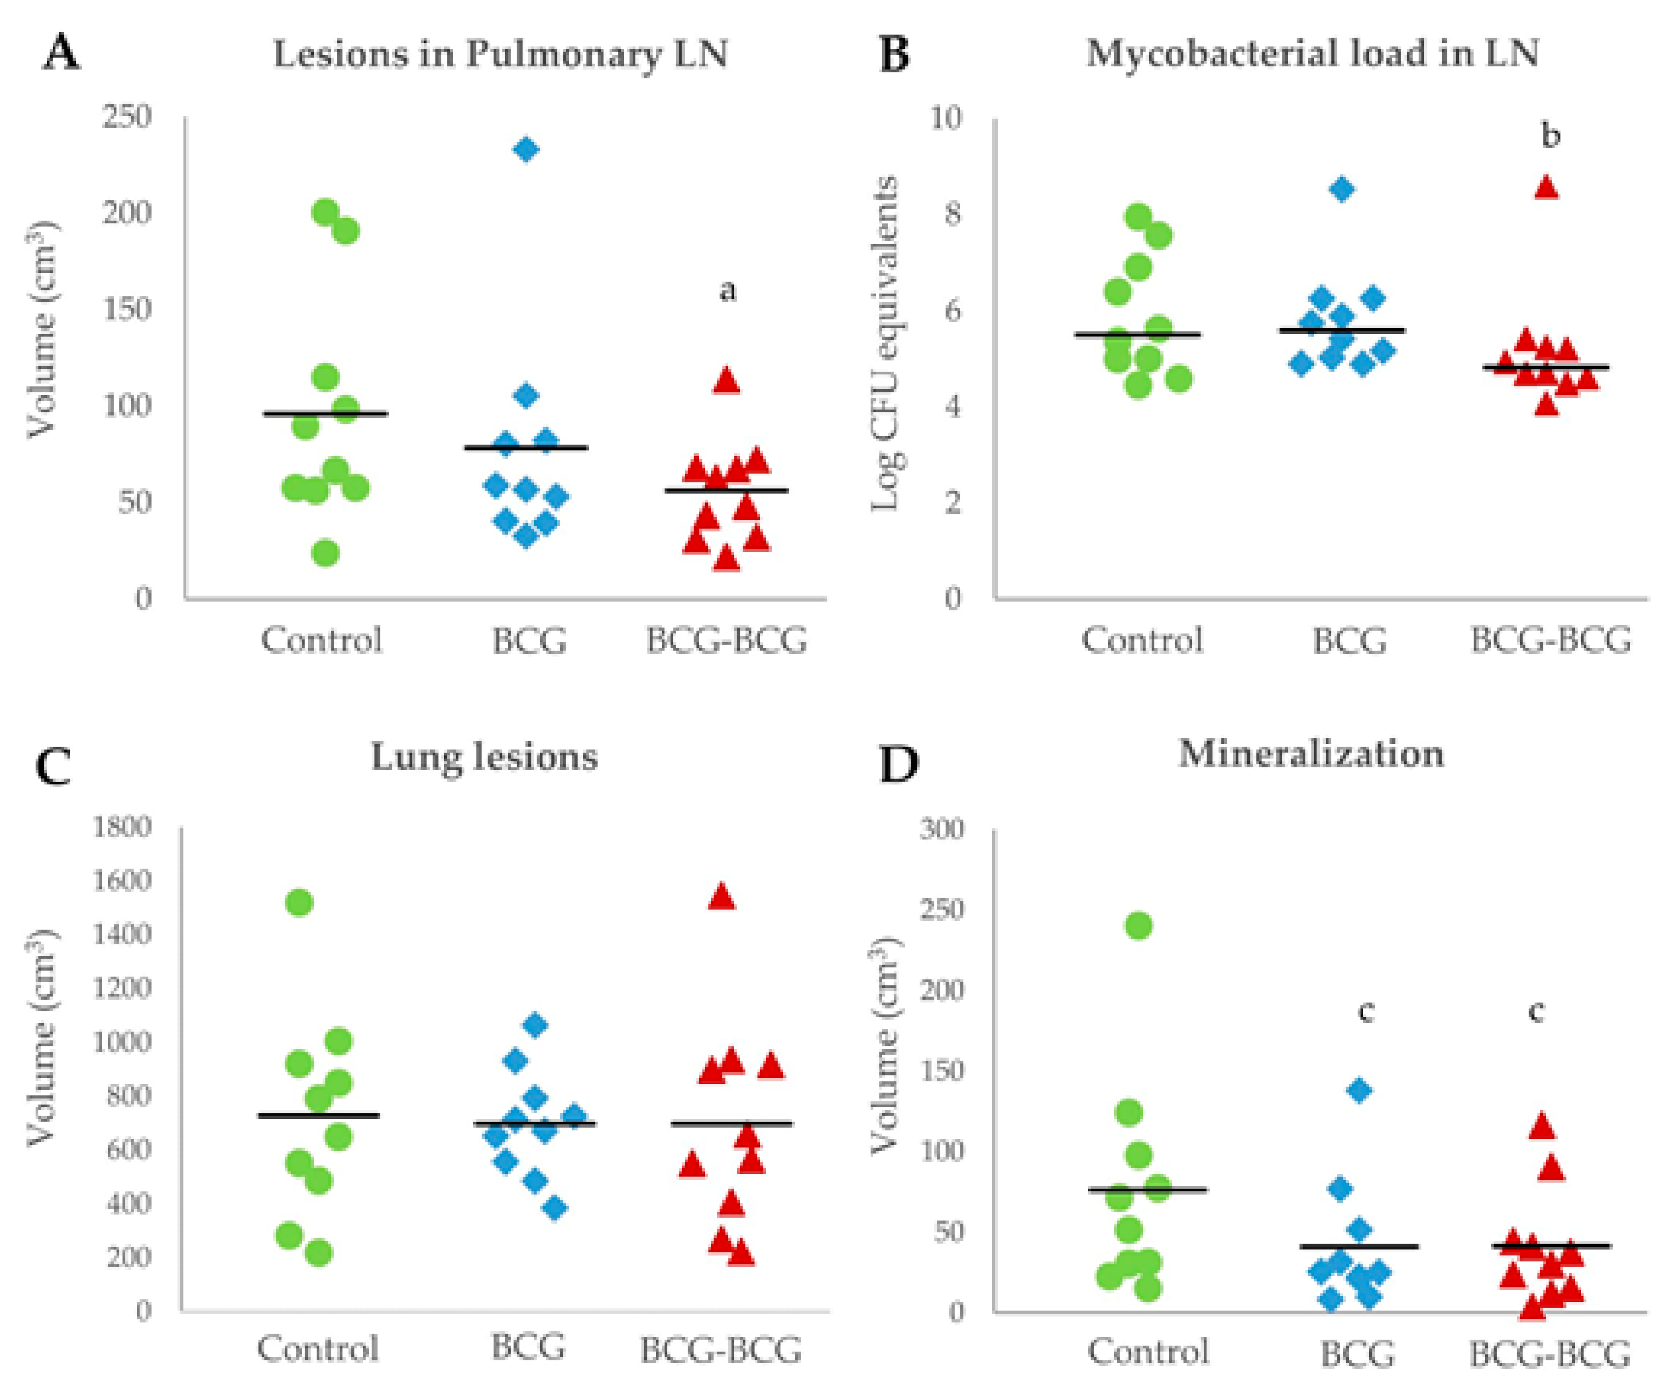
3.4. Post-Mortem Findings

Animals in the revaccinated group showed a lower mean volume of TB lesions in pulmonary LN, compared to the control (p < 0.05, Figure 6A). Bacterial burden, as measured by log CFU genome equivalents, was also lower in the BCG-BCG group compared to unvaccinated controls (p < 0.05, after adjustment by box effect, see supplementary data, Figure 6B). However, the mean volume of TB lesions in the lungs was slightly lower in BCG (698 cm3, 95% CI: 573–823) and BCG-BCG (698 cm3, CI: 453–943) compared to the control group (728 cm3, CI: 490–966), but this difference was not statistically significant (Figure 6C). Vaccinated groups also showed a lower mean volume of mineralization in TB lung lesions (BCG: 41 cm3, 95%CI: 16–65; BCG-BCG: 41 cm3, 95% CI: 19–64) compared to the control group (76 cm3, 95%CI: 34–118, p < 0.1, Figure 6D). Remarkably, the total volume of lung lesions was not correlated with the volume of mineralization in the lungs (r = −0.019).
The volume of lesions and bacterial DNA load in LN were directly correlated with increased rectal temperature from 3 to 5 wpc (range in which the fever peak was detected) and inversely correlated with body weight increase after challenge (Table 1). Neither post-mortem nor clinical parameters were individually associated with IFN-γ-producing cell frequencies measured before challenge (see Supplementary Materials).
Extra-pulmonary lesions were identified in spleen, liver, kidney, and mesenteric lymph nodes in seven BCG and BCG-BCG goats, and in 9 unvaccinated controls (Table 2).

4. Discussion

This study was focused on the effects of BCG revaccination and the duration of immunity afforded by a single-dose vaccination in goats. The results showed that T-cell effector and memory immunity induced by BCG was undetectable one year later, but revaccination with a second dose of BCG one year after primary vaccination, induced cell-mediated responses again at a similar magnitude to that detected at eight weeks after the first immunization and elicited detectable T-cell memory immunity. Moreover, protection after M. caprae challenge in re-vaccinated animals was greater than in animals that were not re-vaccinated, as determined by pulmonary lymph node pathology and bacterial DNA load, degree of lung mineralization, fever, and body weight measurements. This is similar to what has been observed in calves vaccinated with BCG at two to four weeks of age, and revaccinated at two years of age, and then challenged with M. bovis six months after the second vaccination, whereas single-dose vaccinated animals were not protected [12]. Besides, a field trial in BCG-vaccinated goats has shown an increase in TB incidence one year after vaccination [17], suggesting a loss of protective immunity of BCG after this period of time and the need for a revaccination strategy.
The reduction in bacterial load in pulmonary LN without a reduction in the volume of lung lesions in vaccinated animals is consistent with the findings of a previous study in BCG-vaccinated and M. caprae-challenged goats eight weeks later [3]. However, in the present study, the M. caprae load in pulmonary LN was approached by measuring DNA equivalents instead of bacterial culture to avoid the negative impact on bacterial counts of viability losses after the congelation and thawing of samples [18]. In addition, quantification by qPCR avoids miscounting due to mycobacterial aggregation and allows the inclusion of known dilutions of the same M. caprae strain used for the challenge as a DNA standard, ensuring an accurate equivalent for bacterial counts [19].
Interestingly, vaccinated goats showed a greater reduction in lung mineralized lesions, and this parameter was not directly correlated with the total volume of lung lesions, as observed in a previous study conducted in BCG-vaccinated and M. caprae-challenged goats [3]. Hence, despite an extensive lung inflammatory response, BCG vaccination could contain the progress of granulomatous lesions to advanced developmental stages, characterized by necrosis and mineralization [20]. Indeed, the lower proportion of necrotized and mineralized granulomas were previously found in BCG-vaccinated and revaccinated cattle [12]
However, in the present study, 70% of animals in the BCG and BCG-BCG groups showed extra-pulmonary lesions, most of them in the spleen and/or liver, indicating hematogenous dissemination of the infection, whereas in previous experiments, lesions in BCG-vaccinated goats were mainly restricted to respiratory tissues [3,8,18]. In the experiments described above, animals were young and were exposed to M. caprae at 0 to 2 months after vaccination; in contrast, in the present study, animals reached adulthood by the time of challenge (approx. 70 weeks old). Thus, the differences in the capacity of BCG to contain the extrapulmonary dissemination of the infection might be explained by sensitization of vaccinated animals with other mycobacteria when the immunity of the primary vaccination waned. Indeed, BCG protection was reduced in cattle naturally pre-sensitized to environmental mycobacteria (EM) [21]. In this regard, it has been suggested that pre-exposure to EM either masks or blocks the effect of BCG vaccination [22]. The fact that four unvaccinated control goats reacted positively to the skin test performed before the challenge, could indicate an exposure of experimental goats to EM during the year that they remained in the experimental farm.
Clinical markers could also be used as indicators of vaccination outcomes. The results in the present study are in concordance with significant reductions in rectal temperatures and body weight increases observed in BCG-vaccinated goats after challenge with M. caprae compared to non-vaccinated goats and sheep [3,14].
Understanding of the underlying mechanisms which confer protection is an essential pre-requisite for the development of markers of protection and evaluations of vaccine efficacy. As previously observed in cattle [12], BCG revaccination induced similar levels of PPD-B-specific IFN-γ secreted in peripheral blood compared to those induced by primary vaccination, rather than inducing a classical secondary immune response. Moreover, the significant reduction in IFN-γ after eight weeks of revaccination compared to the IFN-γ levels after eight weeks from the first immunization could be due to the contact with animals with EM. Indeed, in mice orally pre-sensitized with different strains of Mycobacterium avium, the IFN-γ responses after BCG vaccination were significantly reduced [23]. On the other hand, a reduction in IFN-γ responses after revaccination could be expected because the goats were adults by the time of revaccination. In fact, it has been demonstrated that specific IFN-γ responses against BCG rapidly decrease with age [24]. However, the strong antigen-specific IFN-γ responses induced by revaccination were not associated with an appropriated protective response, as observed in cattle revaccinated with BCG six weeks after neonatal vaccination [25].
It has been previously reported that the presence of different subsets of memory T-cells elicited by vaccination provided long-term protection in mice and humans [26,27]. In cattle, the presence of CD4+CD45RO+IFN-γ+ and CD8+CD45RO+IFN-γ+ T-cells has been associated with a reduction in the mycobacterial load [28]. Similarly, in the present study, PPD-B-specific IFN-γ-producing memory T-cells, CD4+CD45RO+IFN-γ+ and CD4CD45RO+IFN-γ+, were highly proliferative in revaccinated goats.
Remarkably, ex vivo antigen-specific production of IFN-γ determined by IGRA was only significantly correlated with the proportion of CD4+CD45RO+ IFN-γ-producing T-cells in revaccinated goats. Similar findings were observed in BCG-vaccinated and M. bovis-infected cattle [29]. The recirculation of antigen-specific IFN-γ-producing memory T-cells has been associated with the containment of mycobacterial replication and/or sterilization of the lesion in the site of the infection [9].
The durability of the antigen-specific memory T-cell response is also required for the development of effective prophylactic strategies against TB. In this study, BCG-induced immunity waned at 59 wpv because no expansion of antigen-specific IFN-γ-producing memory T-cells were observed in goats that received a single dose of BCG. Besides, IFN-γ secreted ex vivo was undetectable from 32 wpv onwards. The persistence of BCG is necessary to induce protective immune responses [30]. In this sense, a previous study in BCG-vaccinated goats demonstrated the complete removal of viable BCG bacilli in the injection site before 24 wpv. It was associated with a decrease in antigen-specific IFN-γ responses [15]. Long-term studies conducted in cattle showed variable whole blood PPD-B-specific IFN-γ detectable responses ranging from less than 50 to over 90 weeks after BCG vaccination [11,12]. Nonetheless, in the latter case, the authors observed a significant decrease in PPD-B-specific IFN-γ-secreting central memory T-cells at 24 months post vaccination (p.v.) compared to 12 months p.v. These results were associated with a decrease in protection against M. bovis challenge [11].
To the best of our knowledge, the present study is the first evaluating the duration of the immunity of BCG vaccination in goats. In the light of the results obtained, it is possible that immune protection of BCG in goats waned before one year, as it occurs for other diseases, i.e., clostridial diseases, in which protective immunity decays before then in sheep or cattle, and thus, two or three vaccinations per year are recommended [31,32]. Therefore, revaccination after six months of the first BCG immunization or other schedules needs to be further evaluated in goats. However, it is important to take in account that BCG is not a fully protective vaccine and, as observed with the Mycobacterium avium sbsp paratuberculosis vaccine, vaccination might be considered as part of the measures for control of the disease in farms [33].
Although single-dose BCG-vaccinated goats showed negative results to IGRA from 32 wpv to the challenge time point, DTH was detected in 50% or 90% of single-dose vaccinated goats at 59 wpv by SIT using the conservative or stringent criteria, respectively. Therefore, BCG did not cause interferences on TB diagnosis by DIVA-based IGRA, as previously demonstrated in goats [3,15], neither in tuberculin-based IGRA seven months after vaccination but compromised the SIT for a minimum of one year. In addition, 20% and 60% of BCG and BCG-BCG-vaccinated goats reacted positively to TFP-ST using the stringent criteria, and cross-reactive responses were also detected in unvaccinated controls. A cocktail including peptides of the four antigens included in TFP was proven highly specific in BCG-vaccinated goat kids [34], but showed divergent sensitivity results in M. bovis-infected cattle [35,36]. The lack of specificity found herein does not support the suitability of TFP as a skin test DIVA reagent. In fact, either Rv3615c or Rv3020c are not absent in BCG genome, but the first one cannot be expressed due to the deletion of Esx1 system in BCG [37]. Probably, the presence of Rv3020c in TFP is the causative factor of diagnostic interferences in vaccinated goats. Thus, this antigen could be removed from diagnostic reagents. Additionally, a newly defined skin test containing ESAT-6, CFP-10 and Rv3615c peptide cocktail improved the skin test for the diagnosis of TB in cattle and showed DIVA capability [38].
Finally, during the present study, the main limitation encountered was that the animals, despite being housed in a controlled TB free experimental farm, maintained in the same pen without grazing, and with regular health checking, contact with environmental mycobacteria could not be avoided. Moreover, we cannot rule out the effects of underexposure to sunlight (i.e., deficiency in vitamin D) or other key factors that may have had an effect in mounting an appropriate immune response. Thus, even if the dose for M. caprae challenge was similar to that used for previous challenges, the model of adult goats that developed a large volume of lesions in the lungs and vaccinated goats could not properly contain the infection as observed in extrapulmonary lesions. Therefore, future experimental studies in adult goats might better control the aspects mentioned above or use lower doses for the challenge.

5. Conclusions

BCG vaccination of goat kids did not provide significant levels of protection against M. caprae challenge 64 weeks later, and lifespan for immunity elicited by vaccination was lower than 59 weeks. Moreover, BCG-vaccinated goats showed negative results to the tuberculin-based whole blood IGRA from 32 weeks after vaccination. In contrast, BCG revaccination 56 weeks after primary vaccination was shown to induce an increase in the proportion of antigen-specific IFN-γ-producing memory T-cell phenotypes. BCG re-vaccination was also shown to afford a higher degree of protection against TB in terms of reduced pathology, bacterial DNA load and clinical signs after M. caprae infection. Further studies will establish the most suitable moment for BCG revaccination and will determine the durability of revaccination-induced immunity.

Supplementary Materials

The raw data used in the present study are available online at https://www.mdpi.com/2076-393X/8/4/751/s1.

Author Contributions

Conceptualization and methodology B.P.d.V. and M.D.; validation, B.P.d.V.; formal analysis, C.A.-V. and B.P.d.V.; investigation, C.A.-V., E.V., J.V., X.M., Y.E., M.M., M.D. and B.P.d.V.; resources, M.S.; data curation, C.A.-V., E.V., M.M., J.V. and Y.E.; writing—original draft preparation, C.A.-V. and B.P.d.V.; writing—review and editing, B.V.-R., M.D., M.S. and E.V.; supervision, project administration and funding acquisition, B.P.d.V. All authors have read and agreed to the published version of the manuscript.

Funding

This work was funded by a grant from Instituto Nacional de Investigación y Tecnología Agraria y Alimentaria (INIA), reference number RTA2015-00043-C02-01 (FEDER co-funded). IRTA is supported by CERCA Programme/Generalitat de Catalunya. Claudia Arrieta-Villegas is the recipient of a predoctoral fellowship from INIA (INIA-FPI, grant No. CPD2016-0109).

Acknowledgments

We are grateful to Zoraida Cervera, Samanta E. Giler, the personnel of the Servei de Granges i Camps Experimentals of the Universitat Autònoma de Barcelona (UAB) and the IRTA-CReSA BSL3 Unit staff for technical assistance.

Conflicts of Interest

The authors declare no conflict of interest.

References

  1. World Health Organization. Global Tuberculosis Report 2019; World Health Organization: Geneva, Switzerland, 2019; Licence: CC BY-NC-SA 3.0 IGO; ISBN 9789241565714. [Google Scholar]
  2. Olea-Popelka, F.; Muwonge, A.; Perera, A.; Dean, A.S.; Mumford, E.; Erlacher-Vindel, E.; Forcella, S.; Silk, B.J.; Ditiu, L.; El Idrissi, A.; et al. Zoonotic tuberculosis in human beings caused by Mycobacterium bovis—A call for action. Lancet Infect. Dis. 2017, 17, e21–e25. [Google Scholar] [CrossRef] [Green Version]
  3. Arrieta-Villegas, C.; Perálvarez, T.; Vidal, E.; Puighibet, Z.; Moll, X.; Canturri, A.; Sevilla, I.A.; Espada, Y.; Juste, R.A.; Domingo, M.; et al. Efficacy of parenteral vaccination against tuberculosis with heat-inactivated Mycobacterium bovis in experimentally challenged goats. PLoS ONE 2018, 13, e0196948. [Google Scholar] [CrossRef] [PubMed]
  4. Cano-Terriza, D.; Risalde, M.A.; Rodríguez-Hernández, P.; Napp, S.; Fernández-Morente, M.; Moreno, I.; Bezos, J.; Fernández-Molera, V.; Sáez, J.L.; García-Bocanegra, I. Epidemiological surveillance of Mycobacterium tuberculosis complex in extensively raised pigs in the south of Spain. Prev. Vet. Med. 2018, 159, 87–91. [Google Scholar] [CrossRef] [PubMed]
  5. Buddle, B.M.; Vordermeier, H.M.; Chambers, M.A.; de Klerk-Lorist, L.M. Efficacy and safety of BCG vaccine for control of tuberculosis in domestic livestock and wildlife. Front. Vet. Sci. 2018, 5, 259. [Google Scholar] [CrossRef] [PubMed] [Green Version]
  6. Waters, W.R.; Palmer, M.V.; Buddle, B.M.; Vordermeier, H.M. Bovine tuberculosis vaccine research: Historical perspectives and recent advances. Vaccine 2012, 30, 2611–2622. [Google Scholar] [CrossRef]
  7. Pérez De Val, B.; Vidal, E.; Villarreal-Ramos, B.; Gilbert, S.C.; Andaluz, A.; Moll, X.; Martín, M.; Nofrarías, M.; McShane, H.; Vordermeier, H.M.; et al. A multi-antigenic adenoviral-vectored vaccine improves BCG-induced protection of goats against pulmonary tuberculosis infection and prevents disease progression. PLoS ONE 2013, 8, e81317. [Google Scholar] [CrossRef]
  8. Roy, A.; Tomé, I.; Romero, B.; Lorente-Leal, V.; Infantes-Lorenzo, J.A.; Domínguez, M.; Martín, C.; Aguiló, N.; Puentes, E.; Rodríguez, E.; et al. Evaluation of the immunogenicity and efficacy of BCG and MTBVAC vaccines using a natural transmission model of tuberculosis. Vet. Res. 2019, 50, 82. [Google Scholar] [CrossRef] [Green Version]
  9. Kipnis, A.; Irwin, S.; Izzo, A.A.; Basaraba, R.J.; Orme, I.M. Memory T Lymphocytes Generated by Mycobacterium bovis BCG Vaccination Reside within a CD4 CD44lo CD62 Ligandhi Population. Infect. Immun. 2005, 73, 7759–7764. [Google Scholar] [CrossRef] [Green Version]
  10. Orme, I.M.; Henao-Tamayo, M.I. Trying to see the forest through the trees: Deciphering the nature of memory immunity to Mycobacterium tuberculosis. Front. Immunol. 2018, 9, 461. [Google Scholar] [CrossRef] [Green Version]
  11. Thom, M.L.; McAulay, M.; Vordermeier, H.M.; Clifford, D.; Hewinson, R.G.; Villarreal-Ramos, B.; Hope, J.C. Duration of Immunity against Mycobacterium bovis following Neonatal Vaccination with Bacillus Calmette-Guérin Danish: Significant Protection against Infection at 12, but Not 24, Months. Clin. Vaccine Immunol. 2012, 19, 1254–1260. [Google Scholar] [CrossRef] [Green Version]
  12. Parlane, N.A.; Shu, D.; Subharat, S.; Wedlock, D.N.; Rehm, B.H.A.; De Lisle, G.W.; Buddle, B.M. Revaccination of cattle with bacille Calmette-Guérin two years after first vaccination when immunity has waned, boosted protection against challenge with Mycobacterium bovis. PLoS ONE 2014, 9, e106519. [Google Scholar] [CrossRef] [Green Version]
  13. Vordermeier, H.M.; Jones, G.J.; Buddle, B.M.; Hewinson, R.G. Development of immune-diagnostic reagents to diagnose bovine tuberculosis in cattle. Vet. Immunol. Immunopathol. 2016, 181, 10–14. [Google Scholar] [CrossRef] [PubMed]
  14. Balseiro, A.; Altuzarra, R.; Vidal, E.; Moll, X.; Espada, Y.; Sevilla, I.A.; Domingo, M.; Garrido, J.M.; Juste, R.A.; Prieto, M.; et al. Assessment of BCG and inactivated Mycobacterium bovis vaccines in an experimental tuberculosis infection model in sheep. PLoS ONE 2017, 12, e0180546. [Google Scholar] [CrossRef] [PubMed] [Green Version]
  15. Pérez de Val, B.; Vidal, E.; López-Soria, S.; Marco, A.; Cervera, Z.; Martín, M.; Mercader, I.; Singh, M.; Raeber, A.; Domingo, M. Assessment of safety and interferon gamma responses of Mycobacterium bovis BCG vaccine in goat kids and milking goats. Vaccine 2016, 34, 881–886. [Google Scholar] [CrossRef] [PubMed] [Green Version]
  16. Pérez De Val, B.; López-Soria, S.; Nofrarías, M.; Martín, M.; Vordermeier, H.M.; Villarreal-Ramos, B.; Romera, N.; Escobar, M.; Solanes, D.; Cardona, P.J.; et al. Experimental model of tuberculosis in the domestic goat after endobronchial infection with Mycobacterium caprae. Clin. Vaccine Immunol. 2011, 18, 1872–1881. [Google Scholar] [CrossRef] [PubMed] [Green Version]
  17. Arrieta-Villegas, C.; Allepuz, A.; Grasa, M.; Martín, M.; Cervera, Z.; Mercader, I.; López-Soria, S.; Domingo, M.; Pérez de Val, B. Long-term efficacy of BCG vaccination in goat herds with a high prevalence of tuberculosis. Sci. Rep. 2020, 10, 20369. [Google Scholar] [CrossRef] [PubMed]
  18. Vidal, E.; Arrieta-Villegas, C.; Grasa, M.; Mercader, I.; Domingo, M.; Pérez de Val, B. Field evaluation of the efficacy of Mycobacterium bovis BCG vaccine against tuberculosis in goats. BMC Vet. Res. 2017, 13, 252. [Google Scholar] [CrossRef] [Green Version]
  19. Pathak, S.; Awuh, J.A.; Leversen, N.A.; Flo, T.H.; Åsjø, B. Counting mycobacteria in infected human cells and mouse tissue: A comparison between qPCR and CFU. PLoS ONE 2012, 7, e34931. [Google Scholar] [CrossRef] [Green Version]
  20. Wangoo, A.; Johnson, L.; Gough, J.; Ackbar, R.; Inglut, S.; Hicks, D.; Spencer, Y.; Hewinson, G.; Vordermeier, M. Advanced granulomatous lesions in Mycobacterium bovis-infected cattle are associated with increased expression of type I procollagen, gammadelta (WC1+) T cells and CD 68+ cells. J. Comp. Pathol. 2005, 133, 223–234. [Google Scholar] [CrossRef]
  21. Buddle, B.M.; Wards, B.J.; Aldwell, F.E.; Collins, D.M.; De Lisle, G.W. Influence of sensitisation to environmental mycobacteria on subsequent vaccination against bovine tuberculosis. Vaccine 2002, 20, 1126–1133. [Google Scholar] [CrossRef]
  22. Andersen, P.; Doherty, T.M. The success and failure of BCG—Implications for a novel tuberculosis vaccine. Nat. Rev. Microbiol. 2005, 3, 656–662. [Google Scholar] [CrossRef] [PubMed]
  23. Young, S.L.; Slobbe, L.; Wilson, R.; Buddle, B.M.; De Lisle, G.W.; Buchan, G.S. Environmental strains of Mycobacterium avium interfere with immune responses associated with Mycobacterium bovis BCG vaccination. Infect. Immun. 2007, 75, 2833–2840. [Google Scholar] [CrossRef] [PubMed] [Green Version]
  24. Whittaker, E.; Nicol, M.P.; Zar, H.J.; Tena-Coki, N.G.; Kampmann, B. Age-related waning of immune responses to BCG in healthy children supports the need for a booster dose of BCG in TB endemic countries. Sci. Rep. 2018, 8, 15309. [Google Scholar] [CrossRef]
  25. Buddle, B.M.; Wedlock, D.N.; Parlane, N.A.; Corner, L.A.L.; De Lisle, G.W.; Skinner, M.A. Revaccination of Neonatal Calves with Mycobacterium bovis BCG Reduces the Level of Protection against Bovine Tuberculosis Induced by a Single Vaccination. Infect. Immun. 2003, 71, 6411–6419. [Google Scholar] [CrossRef] [PubMed] [Green Version]
  26. Andersen, P.; Smedegaard, B. CD4+ T-cell subsets that mediate immunological memory to Mycobacterium tuberculosis infection in mice. Infect. Immun. 2000, 68, 621–629. [Google Scholar] [CrossRef] [PubMed] [Green Version]
  27. Sallusto, F.; Lenig, D.; Förster, R.; Lipp, M.; Lanzavecchia, A. Two subsets of memory T lymphocytes with distinct homing potentials and effector functions. Nature 1999, 401, 708–712. [Google Scholar] [CrossRef] [PubMed]
  28. Maggioli, M.F.; Palmer, M.V.; Thacker, T.C.; Vordermeier, H.M.; Waters, W.R. Characterization of effector and memory T cell subsets in the immune response to bovine tuberculosis in cattle. PLoS ONE 2015, 10, e0122571. [Google Scholar] [CrossRef] [Green Version]
  29. Blunt, L.; Hogarth, P.J.; Kaveh, D.A.; Webb, P.; Villarreal-Ramos, B.; Vordermeier, H.M. Phenotypic characterization of bovine memory cells responding to mycobacteria in IFNγ enzyme linked immunospot assays. Vaccine 2015, 33, 7276–7282. [Google Scholar] [CrossRef] [Green Version]
  30. Weir, R.E.; Gorak-Stolinska, P.; Floyd, S.; Lalor, M.K.; Stenson, S.; Branson, K.; Blitz, R.; Ben-Smith, A.; Fine, P.E.M.; Dockrell, H.M. Persistence of the immune response induced by BCG vaccination. BMC Infect. Dis. 2008, 8, 9. [Google Scholar] [CrossRef] [Green Version]
  31. Uzal, F.A.; Bodero, D.A.V.; Kelly, W.R.; Nielsen, K. Variability of serum antibody responses of goat kids to a commercial Clostridium perfringens epsilon toxoid vaccine. Vet. Rec. 1998. [Google Scholar] [CrossRef]
  32. Tizard, I.R. Chapter 17—Sheep and Goat Vaccines. In Vaccines for Veterinarians; Elsevier: Amsterdam, The Netherlands, 2020; pp. 215–224.e1. [Google Scholar] [CrossRef]
  33. Lacasta, D.; Ferrer, L.M.; Ramos, J.J.; González, J.M.; Ortín, A.; Fthenakis, G.C. Vaccination schedules in small ruminant farms. Vet. Microbiol. 2015, 181, 34–46. [Google Scholar] [CrossRef] [PubMed]
  34. Bezos, J.; Casal, C.; Puentes, E.; Díez-Guerrier, A.; Romero, B.; Aguiló, N.; de Juan, L.; Martín, C.; Domínguez, L. Evaluation of the immunogenicity and diagnostic interference caused by M. tuberculosis SO2 vaccination against tuberculosis in goats. Res. Vet. Sci. 2015, 103, 73–79. [Google Scholar] [CrossRef]
  35. van der Heijden, E.M.D.L.V.; Chileshe, J.; Vernooij, J.C.M.; Gortazar, C.; Juste, R.A.; Sevilla, I.; Crafford, J.E.; Rutten, V.P.M.G.; Michel, A.L. Immune response profiles of calves following vaccination with live BCG and inactivated Mycobacterium bovis vaccine candidates. PLoS ONE 2017, 12, e0188448. [Google Scholar] [CrossRef] [PubMed] [Green Version]
  36. Jones, G.J.; Whelan, A.; Clifford, D.; Coad, M.; Vordermeier, H.M. Improved skin test for differential diagnosis of bovine tuberculosis by the addition of Rv3020c-derived peptides. Clin. Vaccine Immunol. 2012, 19, 620–622. [Google Scholar] [CrossRef] [PubMed]
  37. Millington, K.A.; Fortune, S.M.; Low, J.; Garces, A.; Hingley-Wilson, S.M.; Wickremasinghe, M.; Kon, O.M.; Lalvani, A. Rv3615c is a highly immunodominant RD1 (Region of difference 1)-dependent secreted antigen specific for Mycobacterium tuberculosis infection. Proc. Natl. Acad. Sci. USA 2011, 108, 5730–5735. [Google Scholar] [CrossRef] [PubMed] [Green Version]
  38. Srinivasan, S.; Jones, G.; Veerasami, M.; Steinbach, S.; Holder, T.; Zewude, A.; Fromsa, A.; Ameni, G.; Easterling, L.; Bakker, D.; et al. A defined antigen skin test for the diagnosis of bovine tuberculosis. Sci. Adv. 2019, 5. [Google Scholar] [CrossRef] [PubMed] [Green Version]
Figure 1. Gating strategy for the determination of frequency of the IFN-γ positive lymphocyte subsets. Peripheral blood mononuclear cells (PBMC) from all goats were cultured in the presence of M. bovis tuberculin (PPD-B). (A,B) Singlet lymphocytes were identified based on the degree of cellular differentiation determined by forward scatter (FSC) and side scatter (SCC). (C) Representative frequencies of the CD4/CD45RO cell populations. (D) Representative frequencies of intracellular IFN-γ staining of cells gated from prelabelled CD4+CD45RO+.
Vaccines 08 00751 g001
Figure 2. IFN-γ responses after bacillus Calmette–Guerin (BCG) vaccination, revaccination, and M. caprae challenge. (A,B) Mean IFN-γ levels released after stimulation whole blood with M. bovis tuberculin (PPD-B) and ESAT-6/CFP-10 (EC) DIVA reagent, respectively. Tables on horizontal axes show IFN-γ release assay (IGRA) qualitative results for each time point. BCG (blue): single BCG-vaccinated group, BCG-BCG (red): BCG revaccinated group, Control (green): unvaccinated group. Kruskal–Wallis test with post-hoc Wilcoxon test: (a) BCG and BCG-BCG compared to Control, p < 0.01; (b) BCG-BCG compared to BCG and Control, p < 0.001; (c) BCG and BCG-BCG compared to Control, p < 0.001; LMER with pairwise comparisons; (d) BCG and BCG-BCG compared to Control, p < 0.05; (e) BCG and BCG-BCG compared to Control, p < 0.05 and p < 0.01, respectively; (f) BCG-BCG compared to Control, p < 0.05; (g) BCG compared to Control, p < 0.05, (h) BCG-BCG compared to Control, p < 0.01.
Vaccines 08 00751 g002
Figure 3. Proportion of M. bovis tuberculin (PPD-B)-specific IFN-γ+ T-cell subsets isolated from peripheral blood at week 59 (3 weeks after revaccination). (A) Frequency (%) of IFN-γ+ lymphocyte subsets. * p < 0.05, Kruskal–Wallis test with post-hoc Wilcoxon test. (B) Correlation of IFN-γ+ lymphocyte subsets frequencies with IFN-γ released after whole blood stimulation with PPD-B at week 59. * p < 0.05 (Spearman ρ = 0.680).
Vaccines 08 00751 g003
Figure 4. Skin tests. Individual skinfold thickness using M. bovis tuberculin (PPD-B) and a Tetrafusion protein (ESAT-6/CFP-10/RV3615c/Rv3020). BCG (single BCG-vaccinated group), skin tested one year after vaccination; BCG-BCG (revaccinated group after one year of first vaccination), skin tested three weeks after revaccination; Control: unvaccinated group. Red dashed line: threshold for positive results in the skin test. Green dashed line: threshold for doubtful results in the skin test. In the table, qualitative results of skin tests are presented per group.
Vaccines 08 00751 g004
Figure 5. Clinical signs after M. caprae challenge. (A) Mean rectal temperatures per group. BCG (blue): single BCG-vaccinated group, BCG-BCG (red): BCG revaccinated group, Control (green): Unvaccinated group. Dashed line: fever threshold (40 °C). (a) BCG-BCG compared to Control, p < 0.05; (b) BCG-BCG compared to BCG, p < 0.05. (B) Mean cumulative weight changes per group. (c) BCG-BCG compared to Control, p < 0.05; LMER with pairwise comparisons.
Vaccines 08 00751 g005
Figure 6. Postmortem analyses. (A) Volume of tuberculous lesions in pulmonary lymph nodes (LN). BCG (blue): single BCG-vaccinated group, BCG-BCG (red): BCG revaccinated group, Control (green): unvaccinated group. (a) BCG-BCG compared to Control, p < 0.05 (two-way ANOVA with post-hoc Tukey test). (B) Mycobacterial load in LN measured by qPCR. (b) BCG-BCG compared to Control, p < 0.05, Kruskal–Wallis test with Wilcoxon post-hoc test. (C) Volume of TB lesions in lungs. (D) Volume of mineralization in lung lesions. (c) BCG and BCG-BCG compared to Control, p < 0.1, two-way ANOVA with post-hoc Tukey test.
Vaccines 08 00751 g006
Table 1. Individual association between clinical and post-mortem parameters.
Post-Mortem ParameterBody Weight ChangeRectal Temperature
W 3W 5W 7W 9W 3W 4W 5
M. caprae CFU equivalents−0.061−0.221−0.234−0.30350.2340.270.336
Vol Lesions in LN−0.414 *−0.511 **−0.576 ***−0.542 **0.444 *0.428 *0.435 *
Vol Lung Lesions−0.319−0.482 **−0.587 ***−0.692 ***0.2770.456 *0.548 **
Values are Pearson correlation coefficients (r). W: week. CFU: Colony forming units, LN: Pulmonary lymph nodes * p < 0.05, ** p < 0.01, *** p < 0.001.
Table 2. Extrapulmonary lesions.
Animals with Extrapulmonary LesionsLocalization of Lesions
SpleenLiverLn Ms 1KidneyLn RF 2
BCG7/1052420
BCG-BCG7/1062414
Control9/1084841
1 Mesenteric lymph node. 2 Retropharyngeal lymph nodes.
Publisher’s Note: MDPI stays neutral with regard to jurisdictional claims in published maps and institutional affiliations.

