
Spatial Analysis of Determinants of COVID-19 Vaccine Hesitancy in Portugal
 ,
,  , , and
Abstract
:1. Introduction
2. Materials and Methods
2.1. Data Sources and Study Design
2.2. Outcome
2.3. Portuguese Version of the European Deprivation Index
2.4. Data on Migrants
2.5. Statistical Analysis
2.5.1. Spatial Clusters
2.5.2. Vaccine Hesitancy Risk Model
3. Results
3.1. Description of the Dataset and Study Population
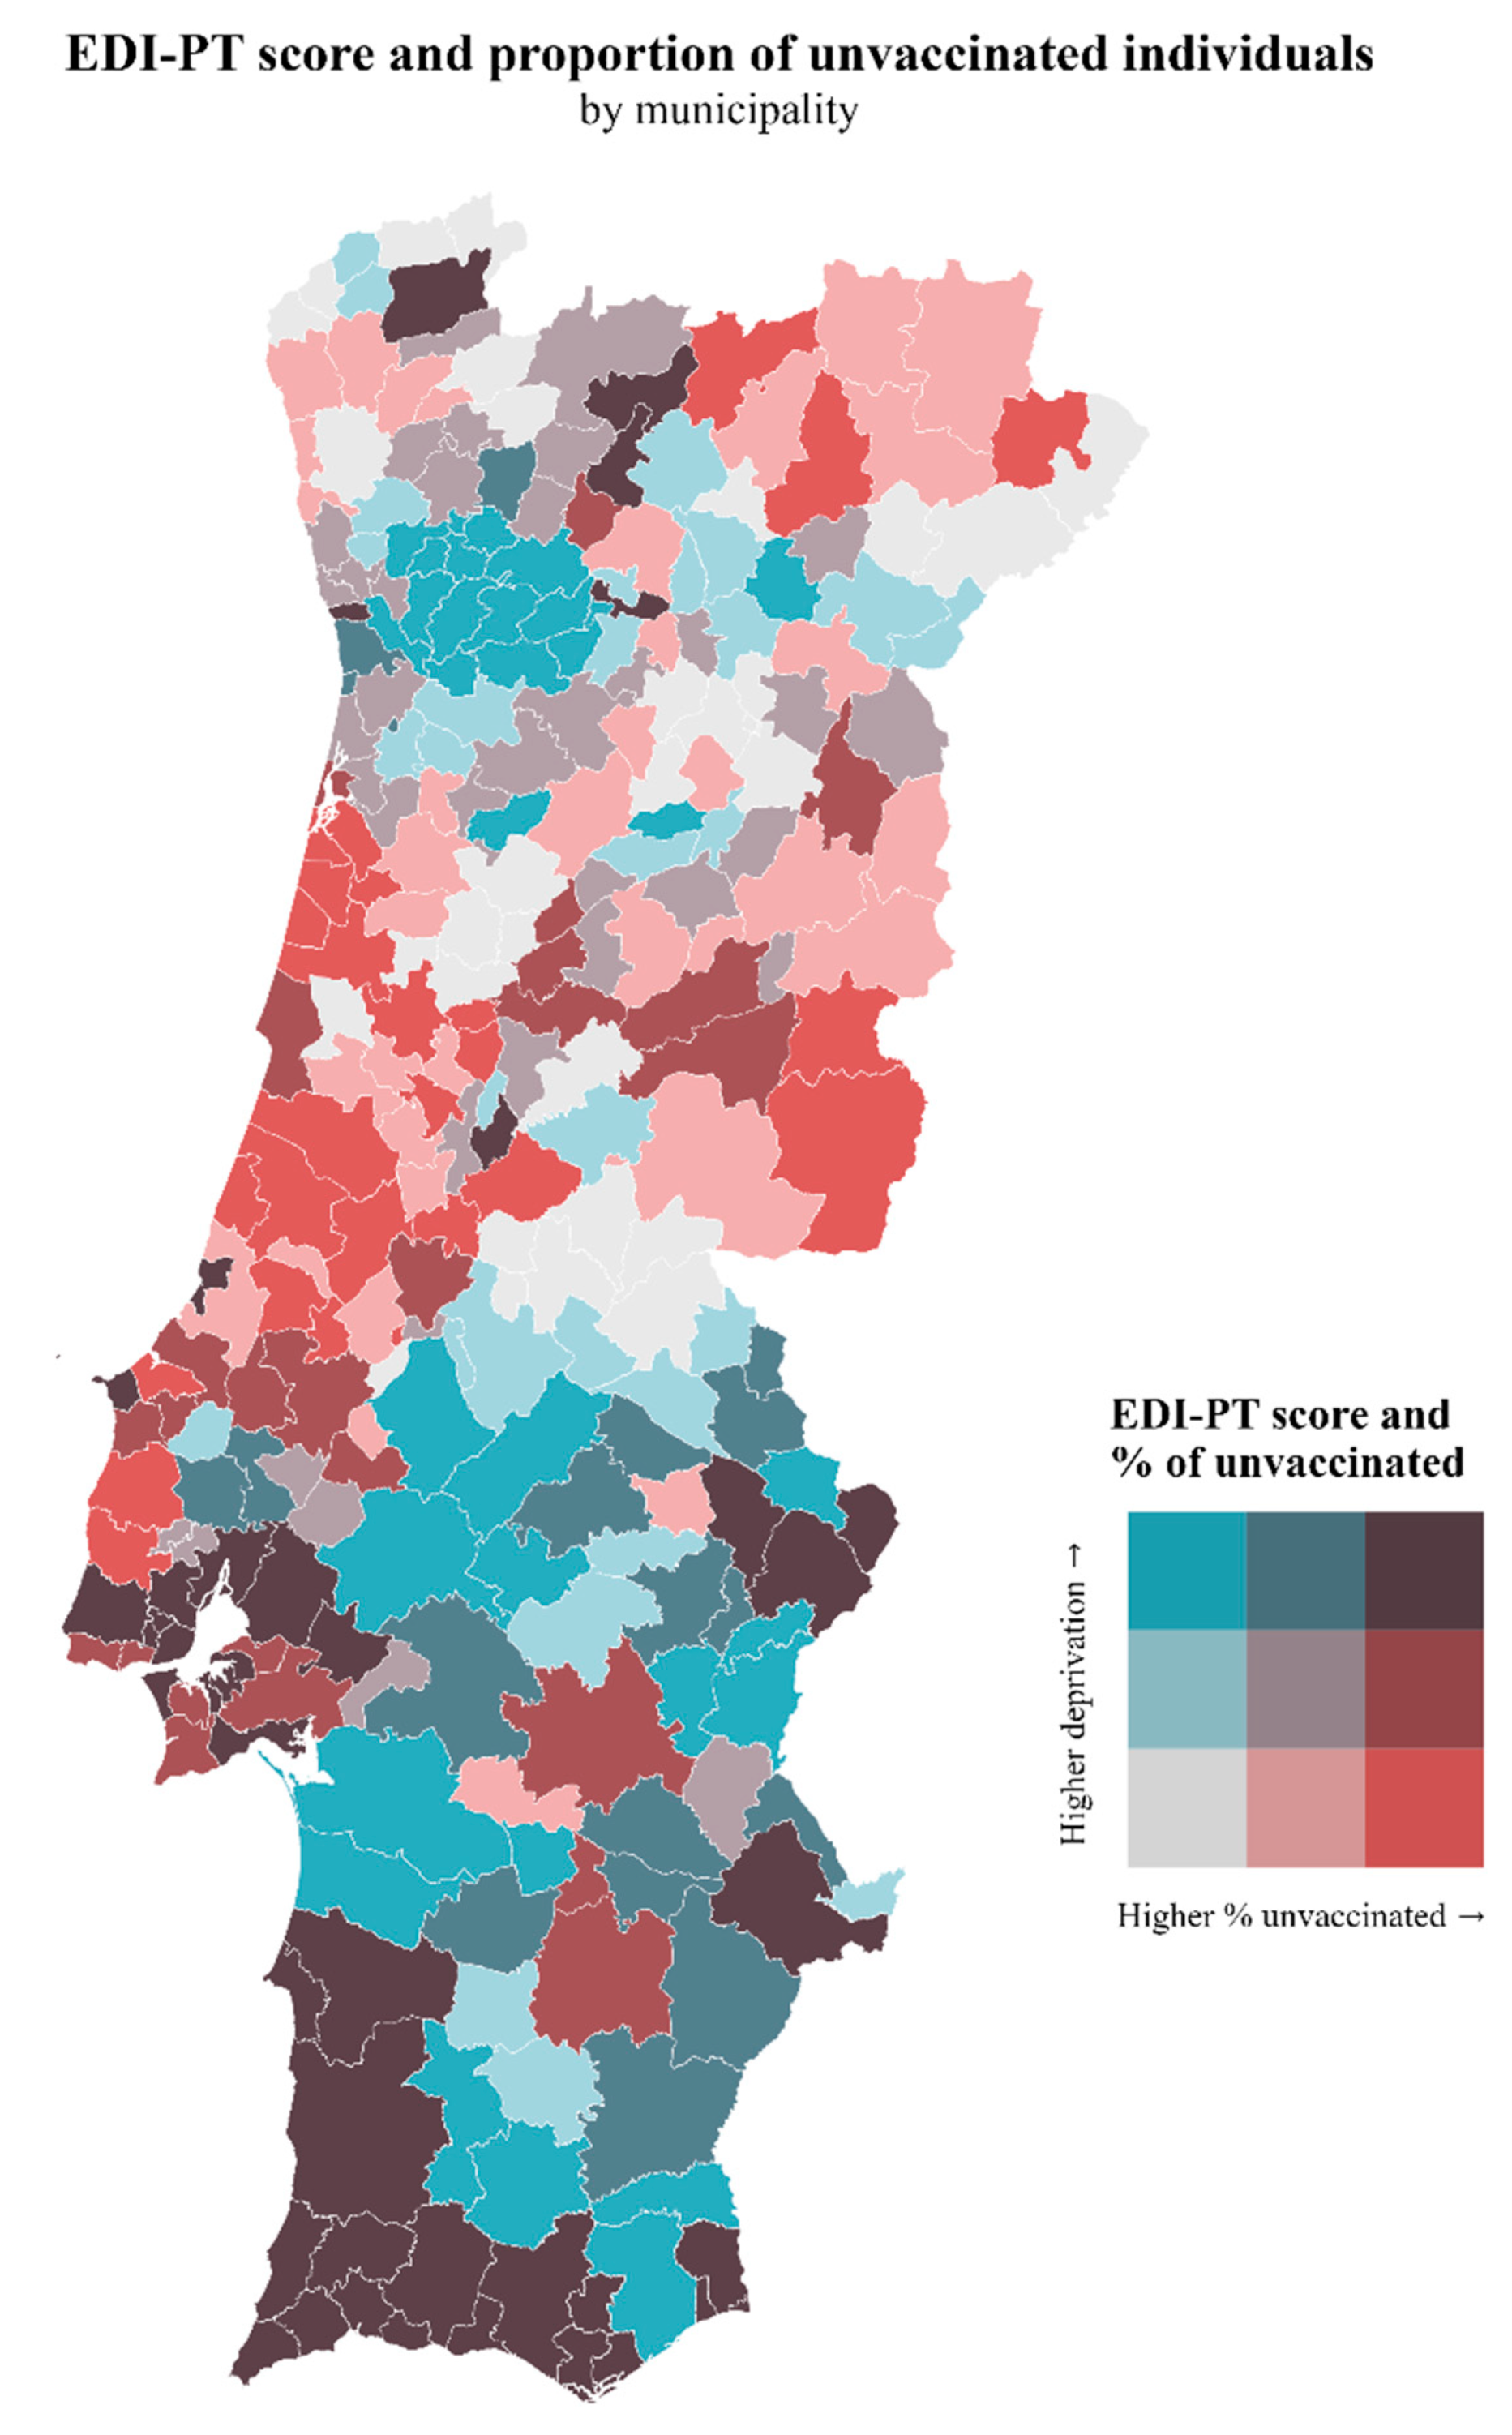
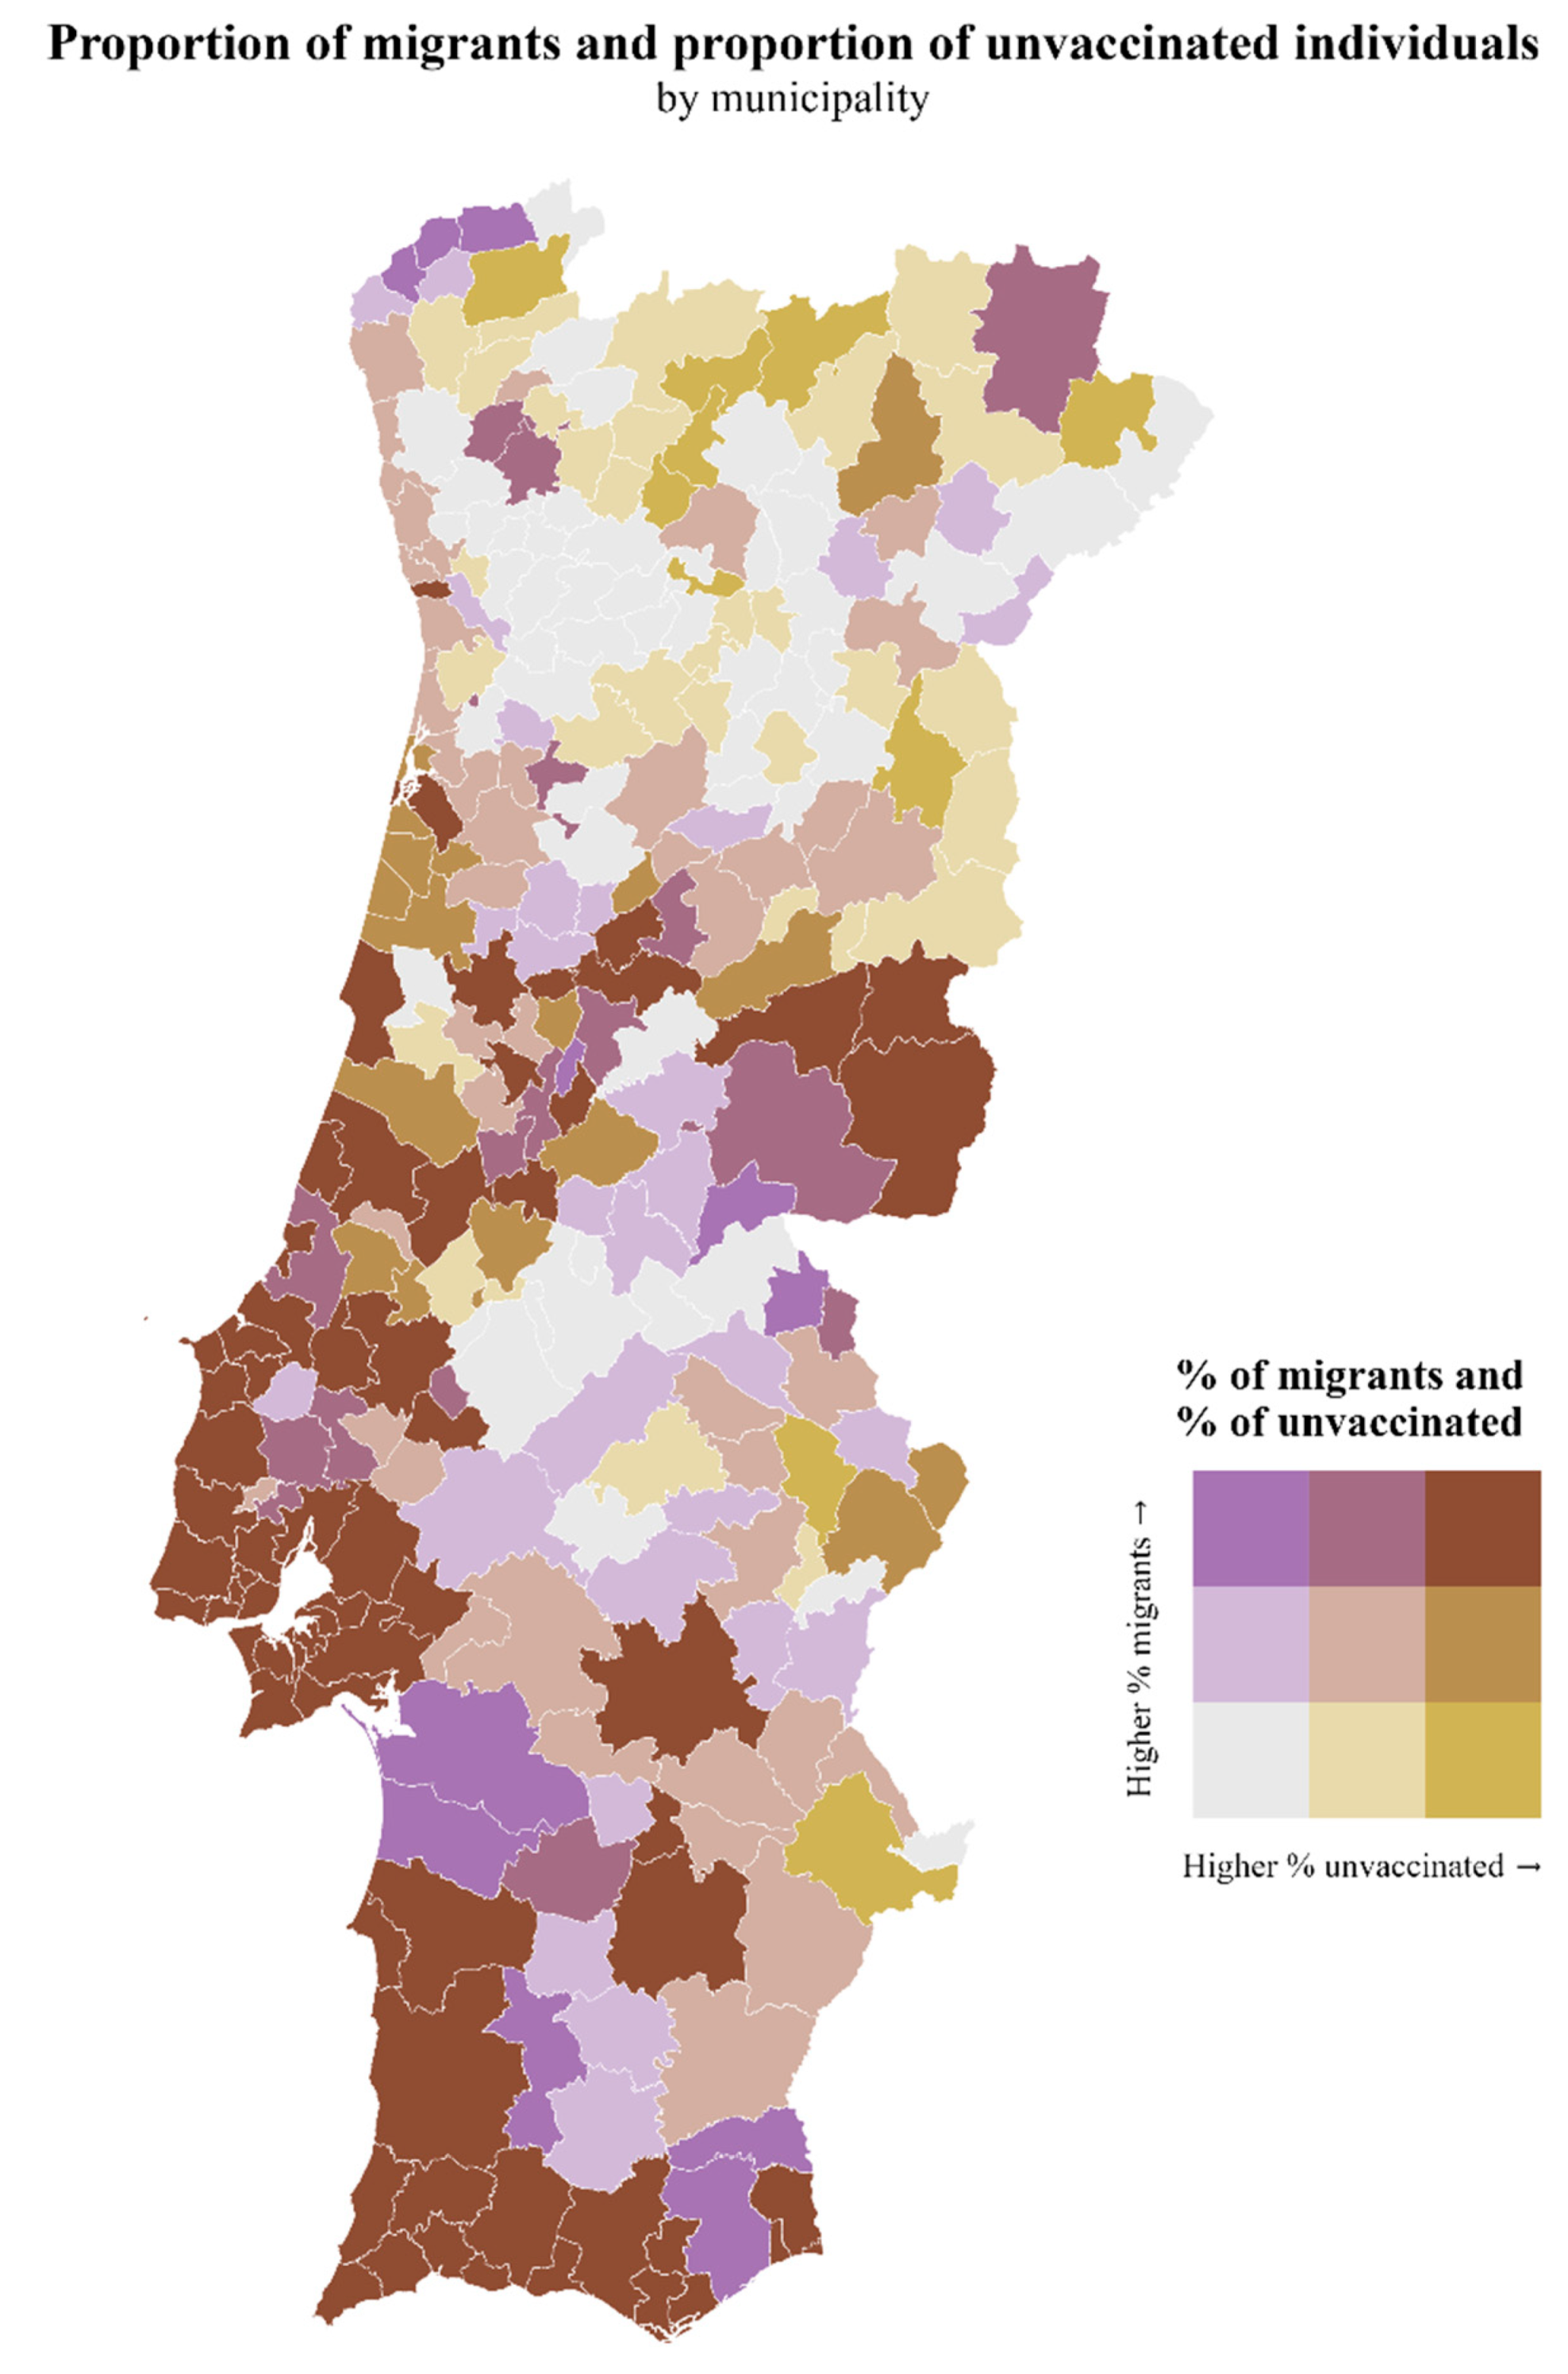
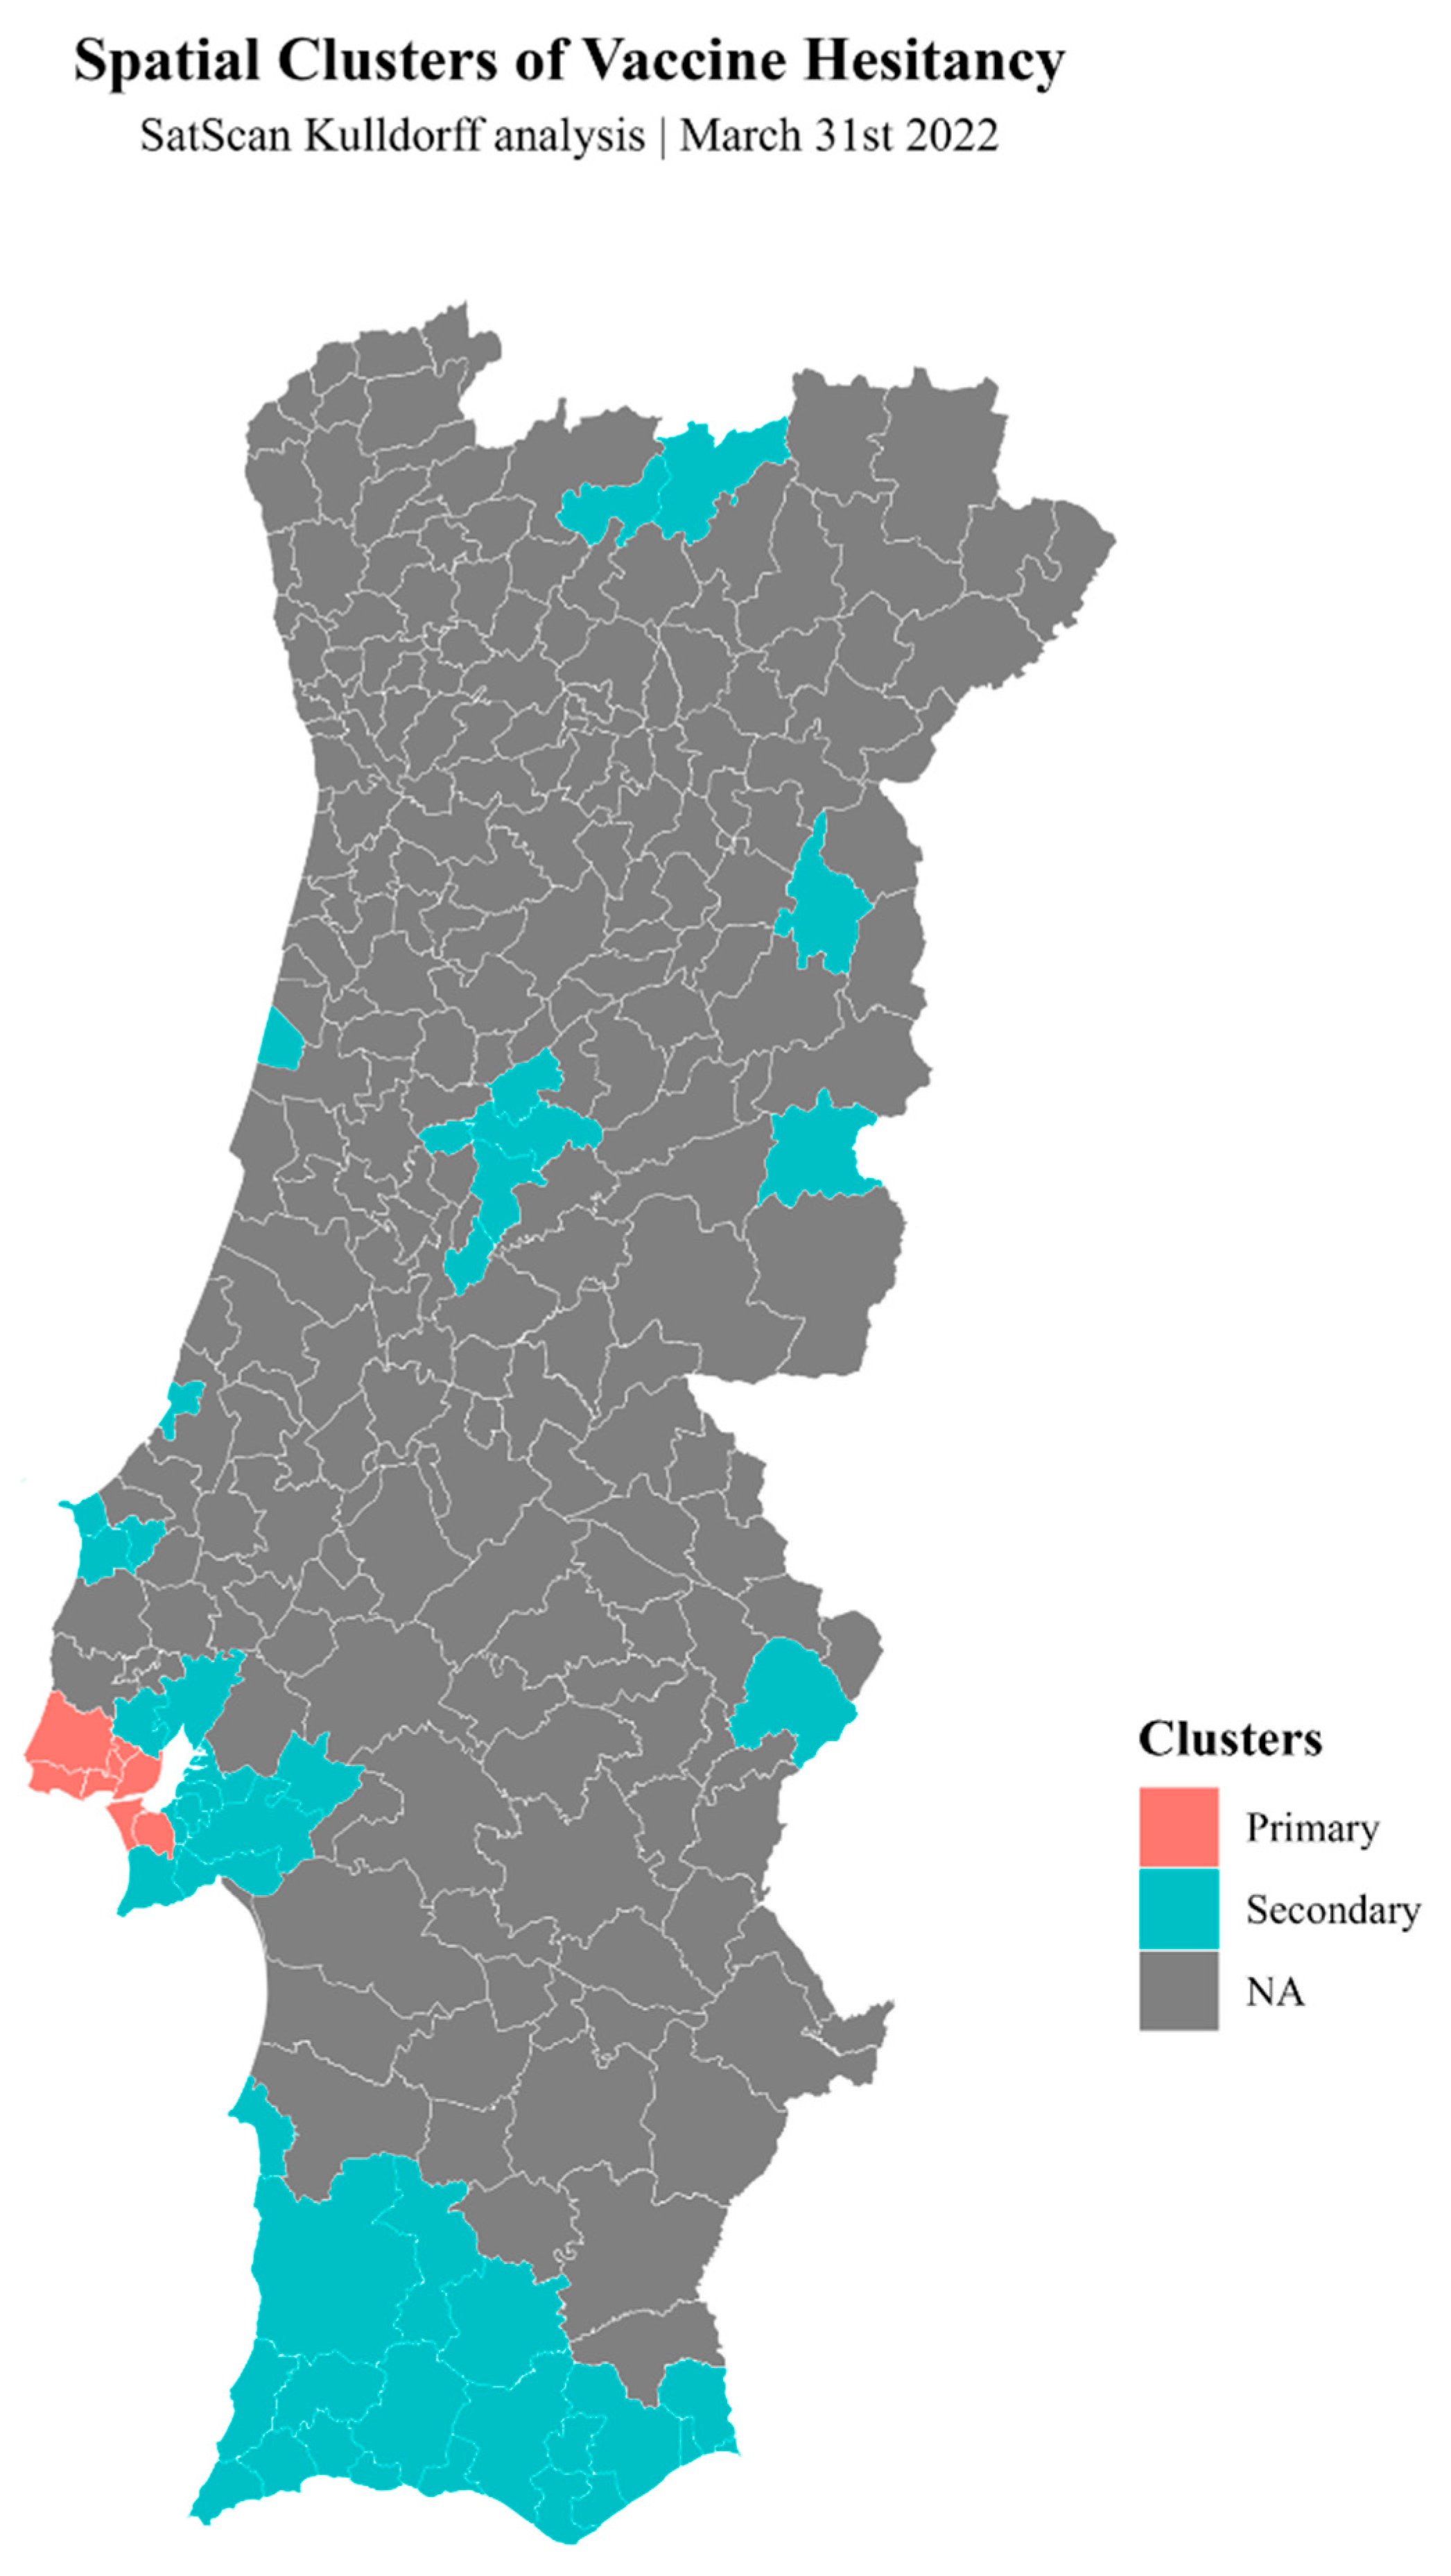
3.2. Spatial Analysis
3.2.1. SaTScan Analysis
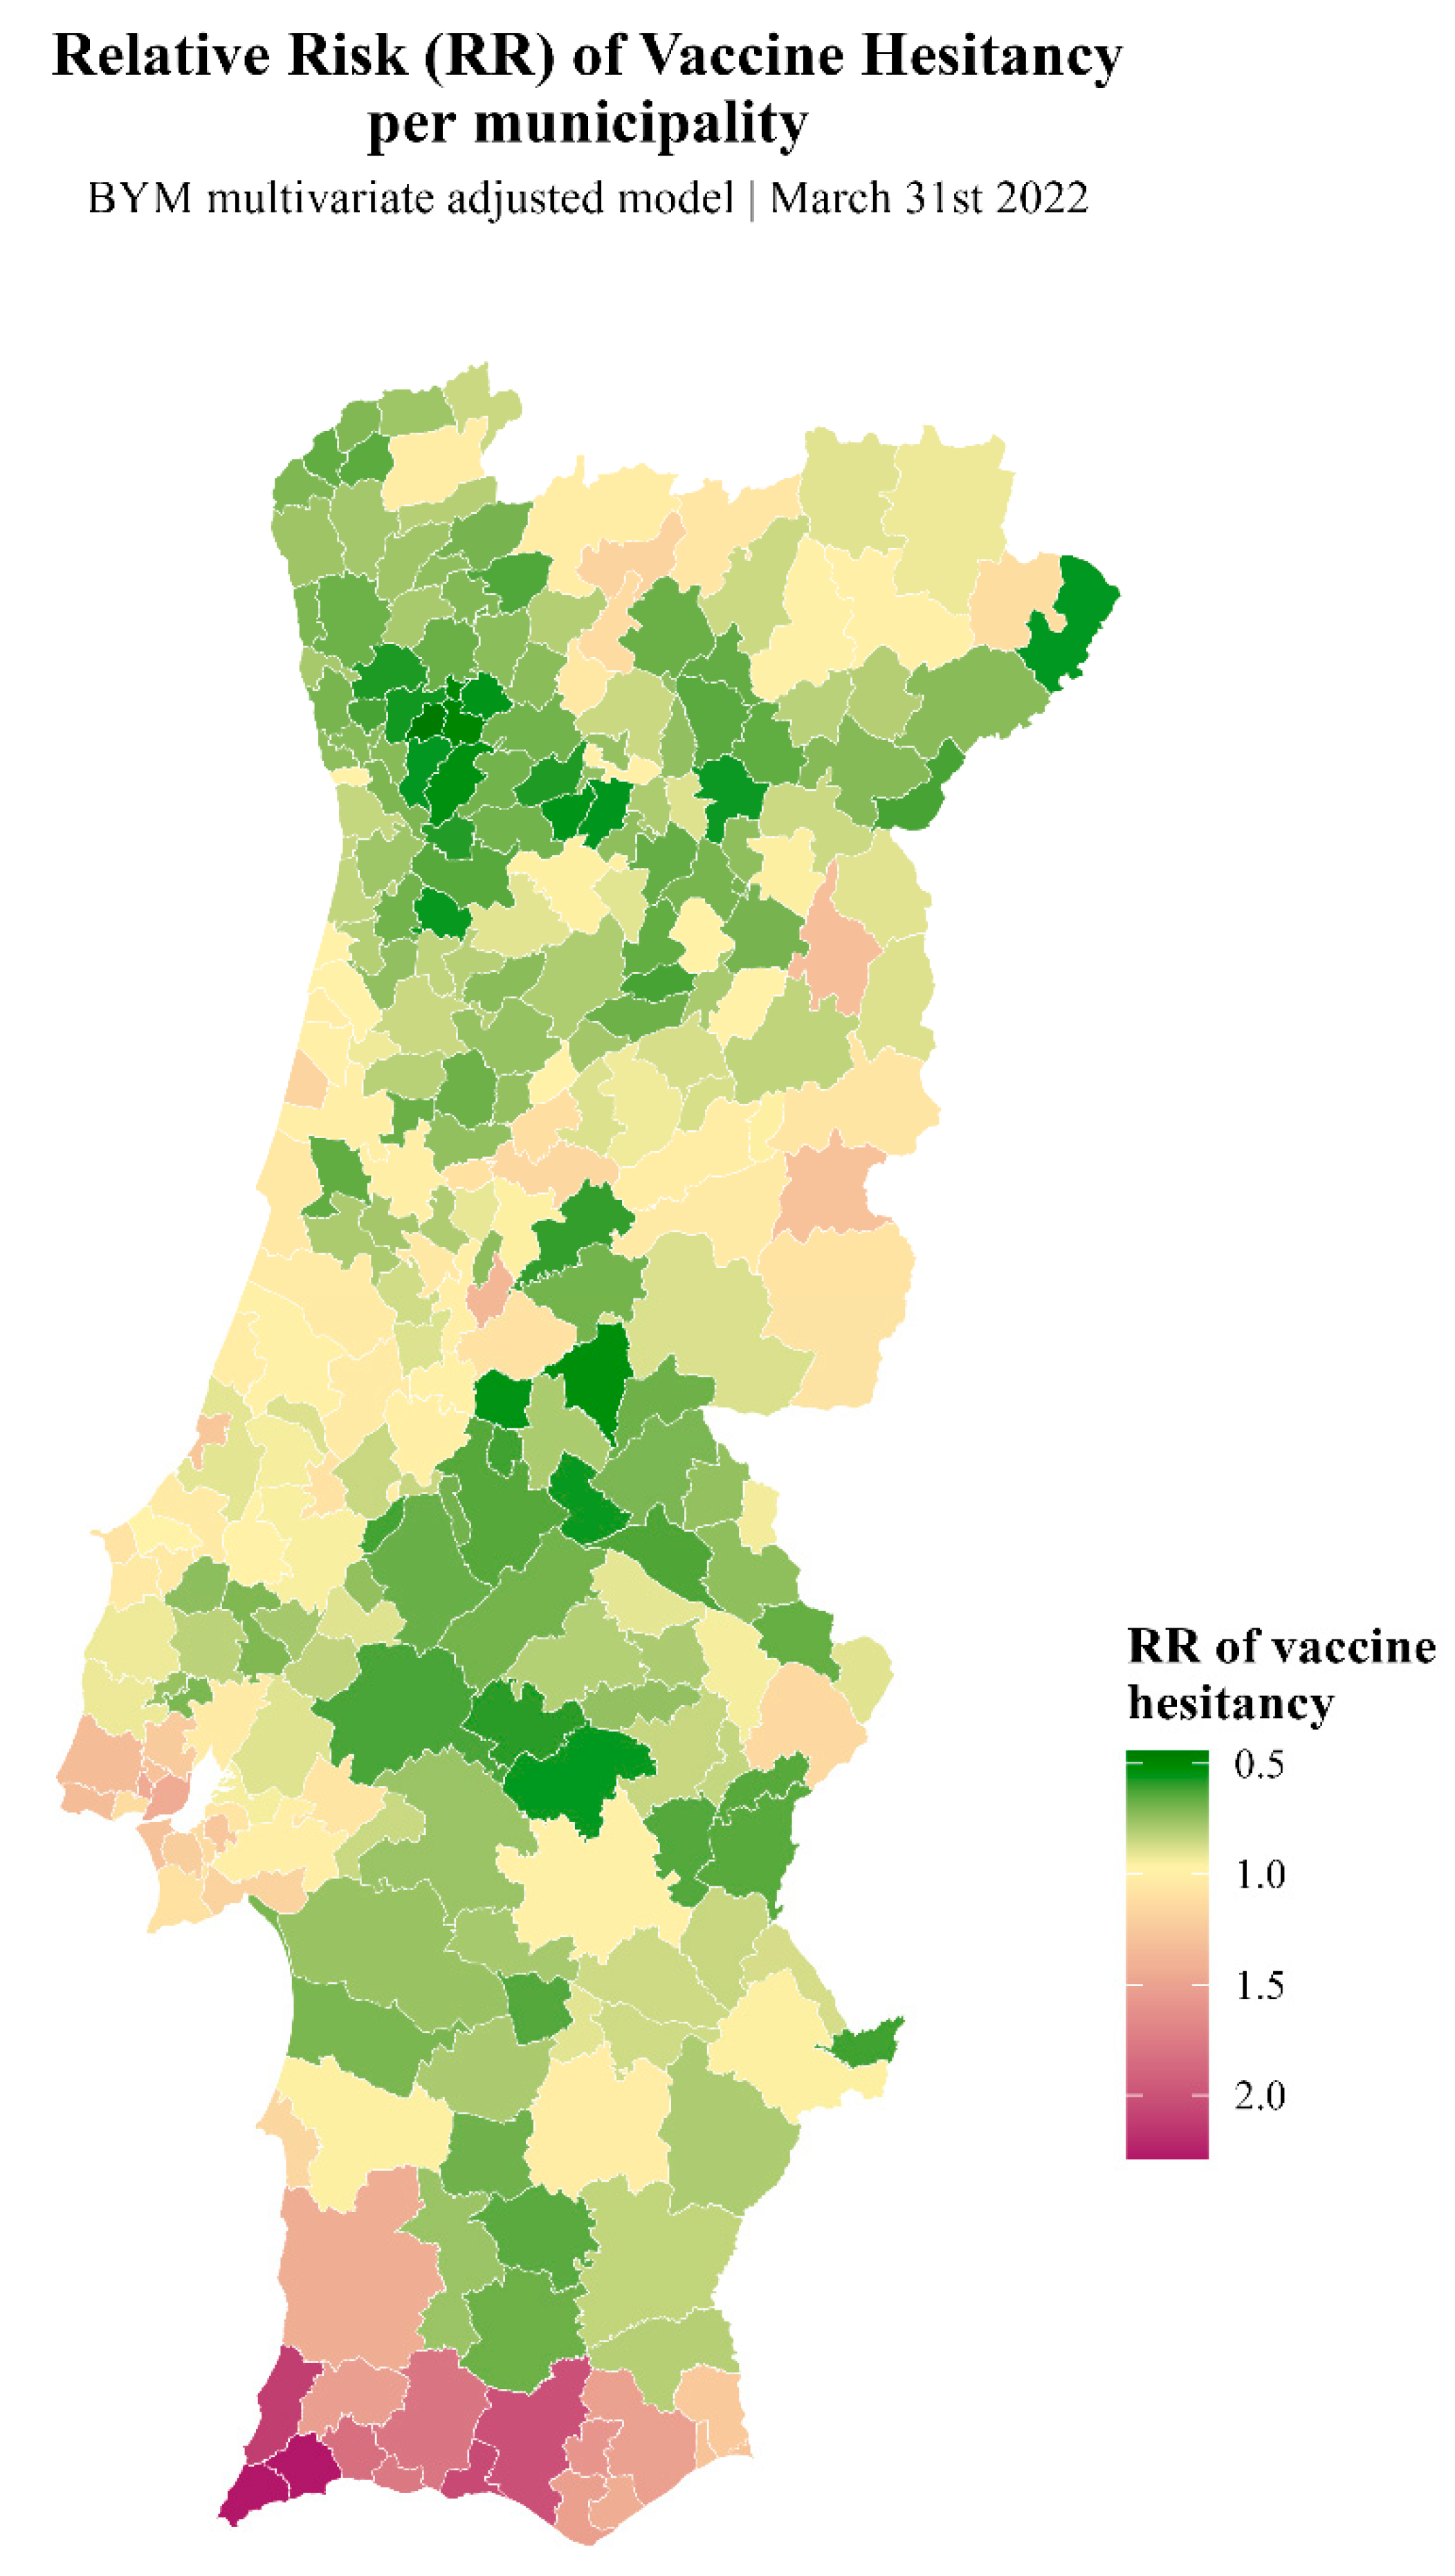
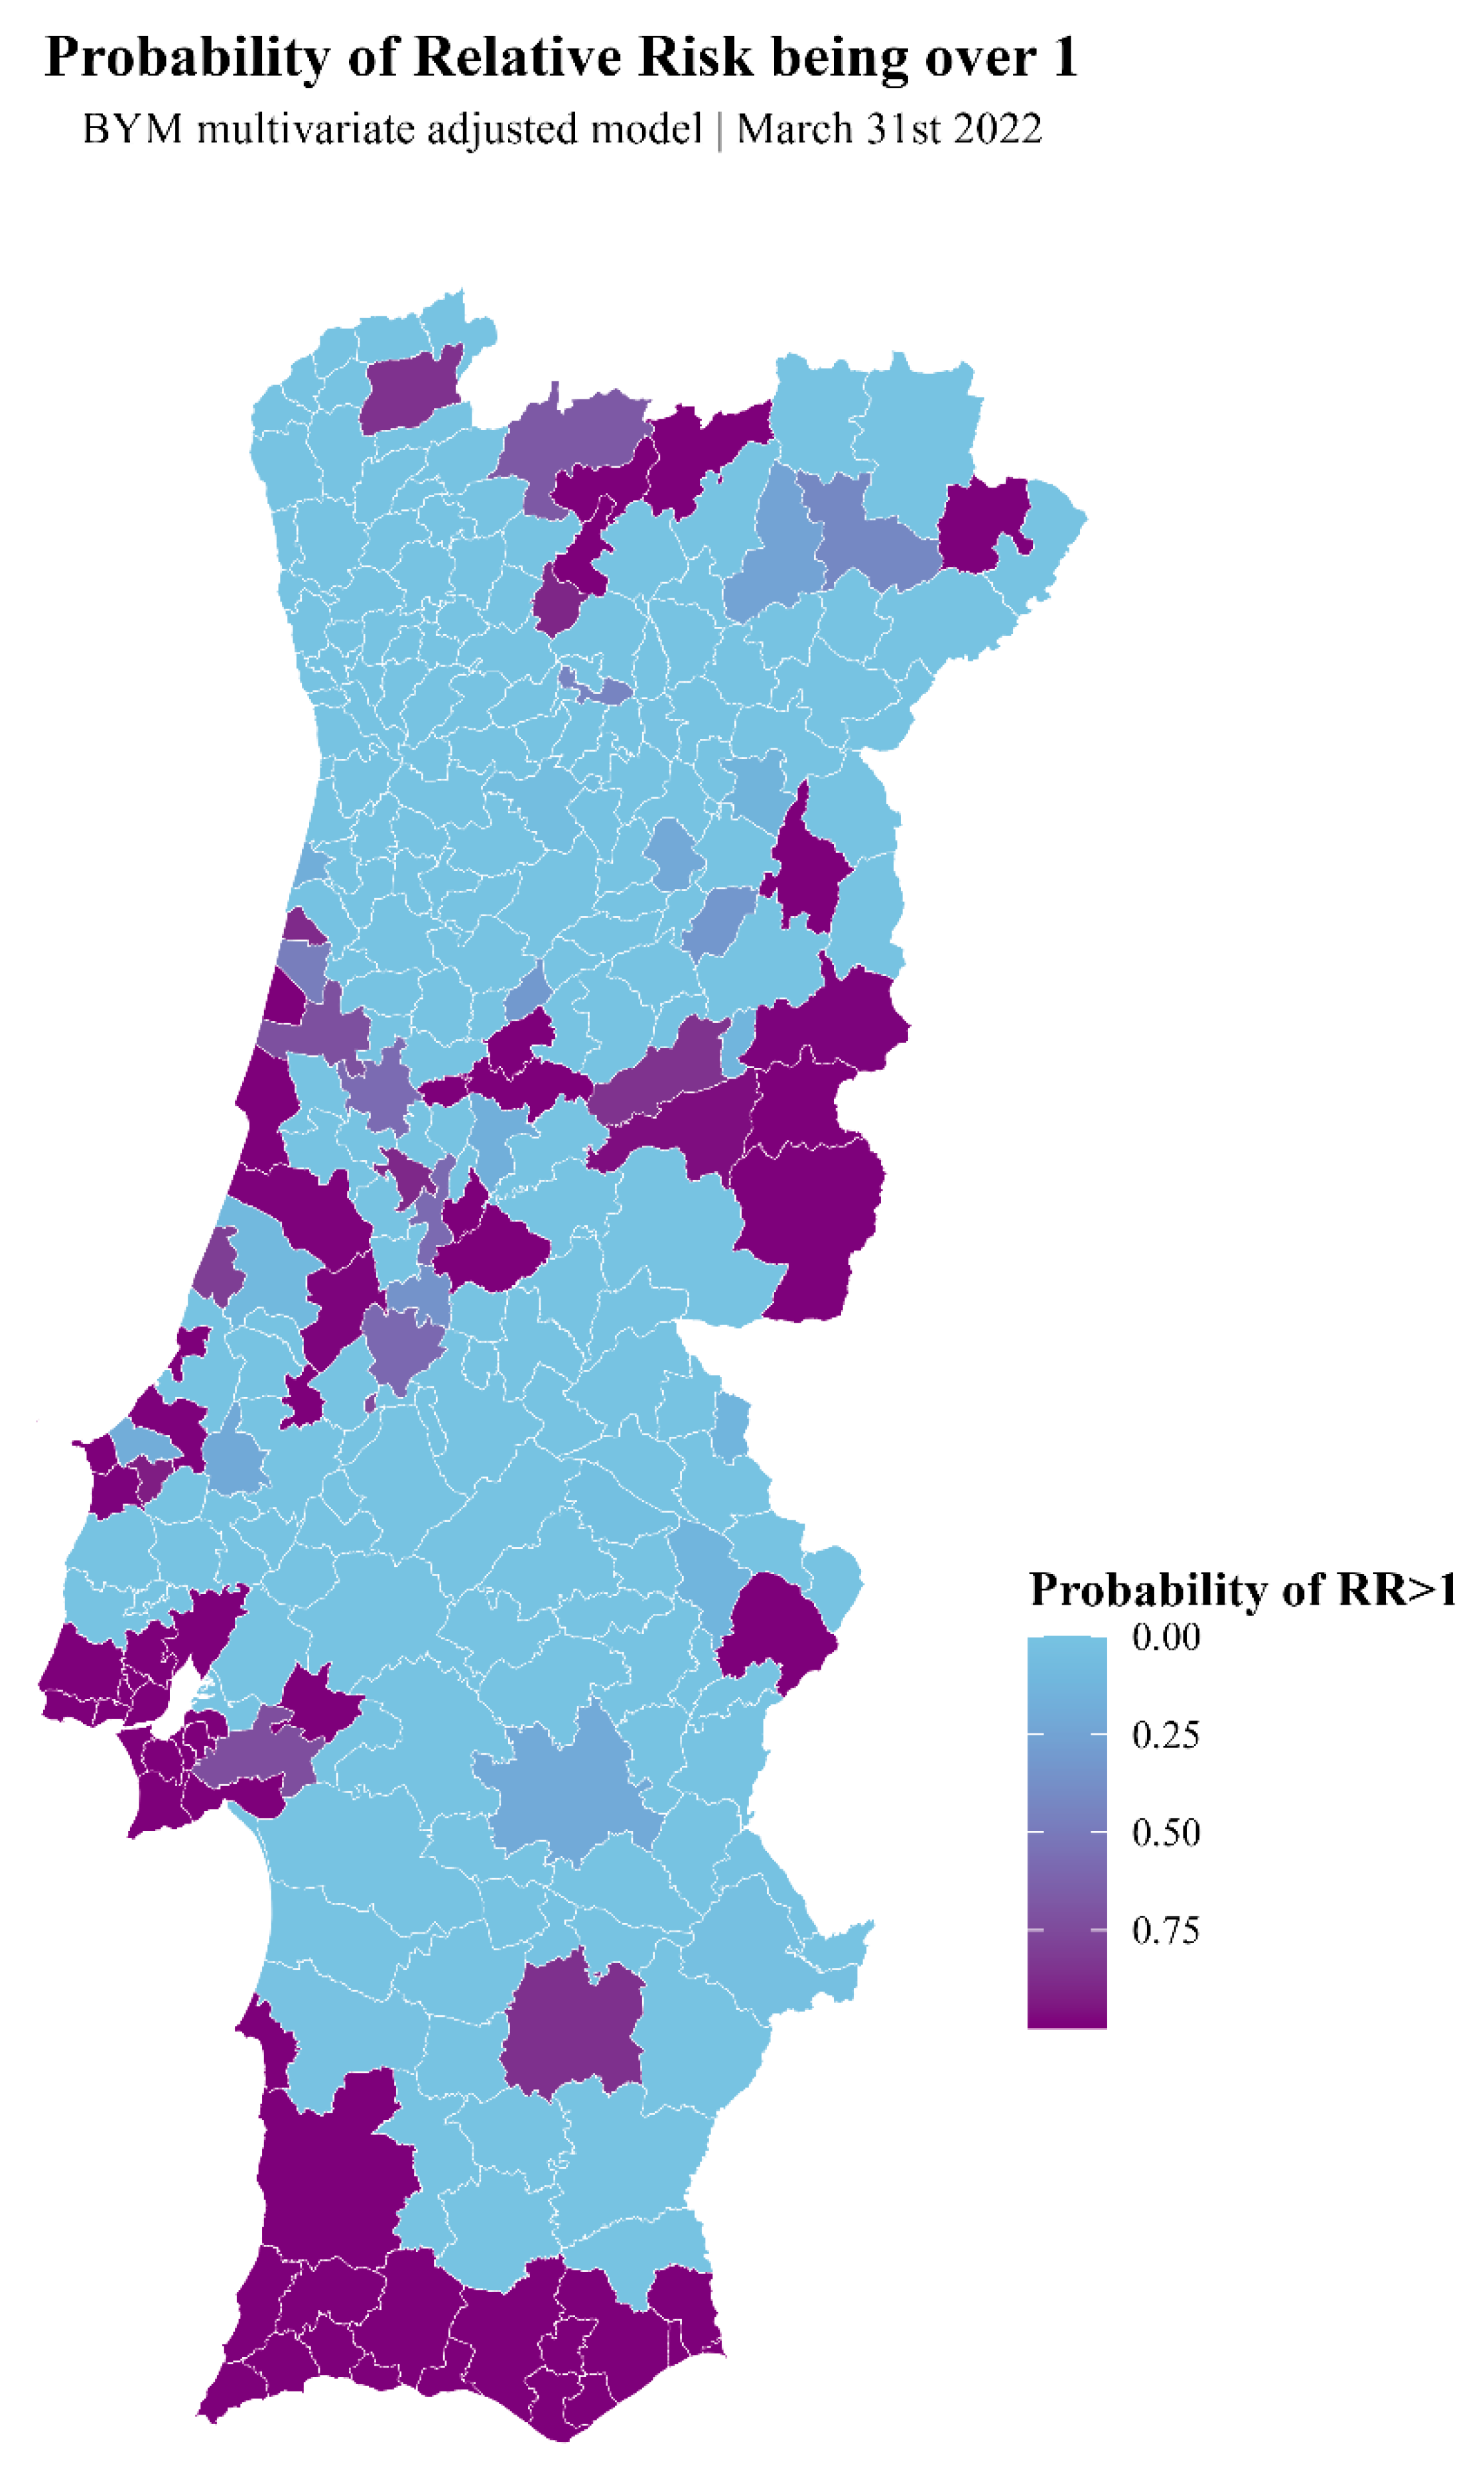
3.2.2. Bayesian Inference Model with Integrated Nested Laplace Approximation (INLA)
- (1)
- EDI-PT score
- (2)
- EDI-PT quintiles
- (3)
- Gender
- (4)
- Age groups
- (5)
- Proportion of migrants
- (6)
- Multivariate model
4. Discussion
5. Conclusions
Supplementary Materials
Author Contributions
Funding
Institutional Review Board Statement
Informed Consent Statement
Data Availability Statement
Conflicts of Interest
References
- Ruiz, J.B.; Bell, R.A. Predictors of Intention to Vaccinate against COVID-19: Results of a Nationwide Survey. Vaccine 2021, 39, 1080–1086. [Google Scholar] [CrossRef]
- Dubé, E.; MacDonald, N.E. How Can a Global Pandemic Affect Vaccine Hesitancy? Expert Rev. Vaccines 2020, 19, 899–901. [Google Scholar] [CrossRef] [PubMed]
- Sallam, M. COVID-19 Vaccine Hesitancy Worldwide: A Concise Systematic Review of Vaccine Acceptance Rates. Vaccines 2021, 9, 160. [Google Scholar] [CrossRef] [PubMed]
- Greer, S.L.; King, E.J.; da Fonseca, E.M.; Peralta-Santos, A. The Comparative Politics of COVID-19: The Need to Understand Government Responses. Glob. Public Health 2020, 15, 1413–1416. [Google Scholar] [CrossRef] [PubMed]
- Pires, C. Global Predictors of COVID-19 Vaccine Hesitancy: A Systematic Review. Vaccines 2022, 10, 1349. [Google Scholar] [CrossRef] [PubMed]
- Jafar, A.; Mapa, M.T.; Sakke, N.; Dollah, R.; Joko, E.P.; Atang, C.; Ahmad, S.A.; Hung, C.V.; Geogre, F. Vaccine Hesitancy in East Malaysia (Sabah): A Survey of the National COVID-19 Immunisation Programme. Geospat. Health 2022, 17. [Google Scholar] [CrossRef] [PubMed]
- Razai, M.S.; Osama, T.; McKechnie, D.G.J.; Majeed, A. Covid-19 Vaccine Hesitancy among Ethnic Minority Groups. BMJ 2021, 372, n513. [Google Scholar] [CrossRef]
- Solís Arce, J.S.; Warren, S.S.; Meriggi, N.F.; Scacco, A.; McMurry, N.; Voors, M.; Syunyaev, G.; Malik, A.A.; Aboutajdine, S.; Adeojo, O.; et al. COVID-19 Vaccine Acceptance and Hesitancy in Low- and Middle-Income Countries. Nat. Med. 2021, 27, 1385–1394. [Google Scholar] [CrossRef]
- Omer, S.B.; Benjamin, R.M.; Brewer, N.T.; Buttenheim, A.M.; Callaghan, T.; Caplan, A.; Carpiano, R.M.; Clinton, C.; DiResta, R.; Elharake, J.A.; et al. Promoting COVID-19 Vaccine Acceptance: Recommendations from the Lancet Commission on Vaccine Refusal, Acceptance, and Demand in the USA. Lancet 2021, 398, 2186–2192. [Google Scholar] [CrossRef]
- Neumann-Böhme, S.; Varghese, N.E.; Sabat, I.; Barros, P.P.; Brouwer, W.; van Exel, J.; Schreyögg, J.; Stargardt, T. Once We Have It, Will We Use It? A European Survey on Willingness to Be Vaccinated against COVID-19. Eur. J. Health Econ. 2020, 21, 977–982. [Google Scholar] [CrossRef]
- Dror, A.A.; Eisenbach, N.; Taiber, S.; Morozov, N.G.; Mizrachi, M.; Zigron, A.; Srouji, S.; Sela, E. Vaccine Hesitancy: The next Challenge in the Fight against COVID-19. Eur. J. Epidemiol. 2020, 35, 775–779. [Google Scholar] [CrossRef] [PubMed]
- Gual-Gonzalez, L.; McCarter, M.S.J.; Dye-Braumuller, K.; Self, S.; Ross, C.H.; Rodriguez-Ramos, C.; Daguise, V.G.; Nolan, M.S. Determinants of COVID-19 Vaccinations among a State-Wide Year-Long Surveillance Initiative in a Conservative Southern State. Vaccines 2022, 10, 412. [Google Scholar] [CrossRef] [PubMed]
- MacDonald, N.E. SAGE Working Group on Vaccine Hesitancy Vaccine Hesitancy: Definition, Scope and Determinants. Vaccine 2015, 33, 4161–4164. [Google Scholar] [CrossRef] [PubMed]
- SAGE Working Group on Vaccine Hesitancy. Report of the SAGE Working Group on Vaccine Hesitancy; World Health Organization: Geneva, Switzerland, 2014; p. 64. [Google Scholar]
- Dubé, E.; Gagnon, D.; Nickels, E.; Jeram, S.; Schuster, M. Mapping Vaccine Hesitancy--Country-Specific Characteristics of a Global Phenomenon. Vaccine 2014, 32, 6649–6654. [Google Scholar] [CrossRef]
- Larson, H.J.; Jarrett, C.; Eckersberger, E.; Smith, D.M.D.; Paterson, P. Understanding Vaccine Hesitancy around Vaccines and Vaccination from a Global Perspective: A Systematic Review of Published Literature, 2007–2012. Vaccine 2014, 32, 2150–2159. [Google Scholar] [CrossRef]
- Dubé, È.; Ward, J.K.; Verger, P.; MacDonald, N.E. Vaccine Hesitancy, Acceptance, and Anti-Vaccination: Trends and Future Prospects for Public Health. Annu. Rev. Public Health 2021, 42, 175–191. [Google Scholar] [CrossRef] [PubMed]
- Dubé, E.; Vivion, M.; MacDonald, N.E. Vaccine Hesitancy, Vaccine Refusal and the Anti-Vaccine Movement: Influence, Impact and Implications. Expert Rev. Vaccines 2015, 14, 99–117. [Google Scholar] [CrossRef] [PubMed]
- Betsch, C.; Schmid, P.; Heinemeier, D.; Korn, L.; Holtmann, C.; Böhm, R. Beyond Confidence: Development of a Measure Assessing the 5C Psychological Antecedents of Vaccination. PLoS ONE 2018, 13, e0208601. [Google Scholar] [CrossRef]
- Machingaidze, S.; Wiysonge, C.S. Understanding COVID-19 Vaccine Hesitancy. Nat. Med. 2021, 27, 1338–1339. [Google Scholar] [CrossRef]
- Europeans’ Attitudes towards Vaccination; Special Eurobarometer; European Commission: Brussels, Belgium, 2019.
- Boletim Do Programa Nacional de Vacinação 2021; Direção-Geral da Saúde: Lisbon, Portugal, 2021.
- Overview of the Implementation of COVID-19 Vaccination Strategies and Deployment Plans in the EU/EEA; European Centre for Disease Prevention and Control: Stockholm, Sweden, 2021.
- State of the European Union Survey 2021; Flash Eurobarometer; European Parliament: Strasbourg, France, 2021.
- Relatórios de Vacinação COVID-19. Available online: https://covid19.min-saude.pt/relatorio-vacinacao/ (accessed on 3 December 2021).
- Meltzer, G.Y.; Harris, J.; Hefner, M.; Lanternier, P.; Gershon, R.R.M.; Vlahov, D.; Merdjanoff, A.A. Associations Between COVID-19 Vaccine Hesitancy and Socio-Spatial Factors in NYC Transit Workers 50 Years and Older. Int. J. Aging Hum. Dev. 2023, 96, 76–90. [Google Scholar] [CrossRef]
- Barómetro COVID-19—Hesitação na Vacinação em Portugal. Available online: https://barometro-covid-19.ensp.unl.pt/hesitacao-na-vacinacao-em-portugal/ (accessed on 26 November 2021).
- Lane, S.; MacDonald, N.E.; Marti, M.; Dumolard, L. Vaccine Hesitancy around the Globe: Analysis of Three Years of WHO/UNICEF Joint Reporting Form Data-2015–2017. Vaccine 2018, 36, 3861–3867. [Google Scholar] [CrossRef] [PubMed]
- Salmon, D.A.; Dudley, M.Z.; Glanz, J.M.; Omer, S.B. Vaccine Hesitancy: Causes, Consequences, and a Call to Action. Vaccine 2015, 33 (Suppl. S4), D66–D71. [Google Scholar] [CrossRef] [PubMed]
- Direção-Geral da Saúde Norma 002/2021—Campanha de Vacinação Contra a COVID-19 2022. Available online: https://www.dgs.pt/normas-orientacoes-e-informacoes/normas-e-circulares-normativas/norma-n-0022021-de-30012021-pdf.aspx (accessed on 29 February 2022).
- Portaria n.° 248/2017, de 4 de Agosto; Ministério da Saúde: Lisboa, Portugal, 2017; pp. 4502–4506.
- Ribeiro, A.I.; Launay, L.; Guillaume, E.; Launoy, G.; Barros, H. Portuguese Version of the European Deprivation Index (Version 2011). 2020. Available online: https://figshare.com/articles/Portuguese_version_of_the_European_Deprivation_Index_version_2011_/7188554 (accessed on 6 December 2021).
- População Estrangeira Com Estatuto Legal de Residente (N.°) Por Local de Residência (NUTS—2013), Sexo e Nacionalidade (Grupos de Países); Anual. Available online: https://www.ine.pt/xportal/xmain?xpid=INE&xpgid=ine_indicadores&indOcorrCod=0009107&contexto=bd&selTab=tab2 (accessed on 15 January 2022).
- População Estrangeira Que Solicitou Estatuto de Residente (N.°) Por Local de Residência (NUTS—2013), Sexo e Nacionalidade (Grupos de Países); Anual. Available online: https://www.ine.pt/xportal/xmain?xpid=INE&xpgid=ine_indicadores&indOcorrCod=0009108&contexto=bd&selTab=tab2 (accessed on 15 January 2022).
- População Residente Por Local de Residência, Sexo e Grupo Etário. 2020. Available online: https://www.ine.pt/xportal/xmain?xpid=INE&xpgid=ine_indicadores&indOcorrCod=0008273&contexto=bd&selTab=tab2 (accessed on 5 March 2022).
- Direção-Geral da Saúde Plano de Vacinação COVID-19; Direção-Geral da Saúde: Lisbon, Portugal, 2020.
- COVID-19: Divulgadas Datas para a Vacinação de Crianças a Partir dos 5 Anos. Available online: https://eportugal.gov.pt/pt/noticias/covid-19-divulgadas-datas-para-a-vacinacao-de-criancas-a-partir-dos-5-anos (accessed on 10 August 2022).
- Vacinação das Crianças Entre 5 e 11 Anos Decorre de 18 de Dezembro a 13 de Março. Available online: https://www.portugal.gov.pt/pt/gc22/comunicacao/noticia?i=vacinacao-das-criancas-entre-5-e-11-anos-decorre-de-18-de-dezembro-a-13-de-marco (accessed on 10 August 2022).
- Ribeiro, A.I.; Mayer, A.; Miranda, A.; De Pina, M.d.F. The Portuguese Version of the European Deprivation Index: An Instrument to Study Health Inequalities. Acta Médica Port. 2017, 30, 17. [Google Scholar] [CrossRef] [PubMed]
- Ribeiro, A.I.; Launay, L.; Guillaume, E.; Launoy, G.; Barros, H. The Portuguese Version of the European Deprivation Index: Development and Association with All-Cause Mortality. PLoS ONE 2018, 13, e0208320. [Google Scholar] [CrossRef] [PubMed]
- Besag, J.; York, J.; Mollié, A. Bayesian Image Restoration, with Two Applications in Spatial Statistics. Ann. Inst. Stat. Math. 1991, 43, 1–20. [Google Scholar] [CrossRef]
- Kulldorff, M.; Nagarwalla, N. Spatial Disease Clusters: Detection and Inference. Stat. Med. 1995, 14, 799–810. [Google Scholar] [CrossRef]
- Chen, C.; Kim, A.Y.; Ross, M.; Wakefield, J.; Moise, M. SpatialEpi: Methods and Data for Spatial Epidemiology, version 1.2.8; CRAN: Vienna, Austria, 2021. [Google Scholar]
- Fong, Y.; Rue, H.; Wakefield, J. Bayesian Inference for Generalized Linear Mixed Models. Biostat. Oxf. Engl. 2010, 11, 397–412. [Google Scholar] [CrossRef]
- Zuur, A.F.; Ieno, E.N.; Saveliev, A.A. Beginner’s Guide to Spatial, Temporal, and Spatial-Temporal Ecological Data Analysis with R-INLA; Beginner’s Guide Book Series; Highland Statistics Ltd.: Newburgh, UK, 2017; ISBN 978-0-9571741-9-1. [Google Scholar]
- Bakka, H.; Rue, H.; Fuglstad, G.-A.; Riebler, A.; Bolin, D.; Illian, J.; Krainski, E.; Simpson, D.; Lindgren, F. Spatial Modeling with R-INLA: A Review. WIREs Comput. Stat. 2018, 10, e1443. [Google Scholar] [CrossRef]
- Rue, H.; Martino, S.; Chopin, N. Approximate Bayesian Inference for Latent Gaussian Models by Using Integrated Nested Laplace Approximations. J. R. Stat. Soc. Ser. B Stat. Methodol. 2009, 71, 319–392. [Google Scholar] [CrossRef]
- Mathieu, E.; Ritchie, H.; Rodés-Guirao, L.; Appel, C.; Giattino, C.; Hasell, J.; Macdonald, B.; Dattani, S.; Beltekian, D.; Ortiz-Ospina, E.; et al. Coronavirus Pandemic (COVID-19)—Share of People Vaccinated against COVID-19. Our World Data. 2020. Available online: https://ourworldindata.org/covid-vaccinations (accessed on 19 October 2023).
- Curtis, H.J.; Inglesby, P.; MacKenna, B.; Croker, R.; Hulme, W.J.; Rentsch, C.T.; Bhaskaran, K.; Mathur, R.; Morton, C.E.; Bacon, S.C.; et al. Recording of ’COVID-19 Vaccine Declined‘: A Cohort Study on 57.9 Million National Health Service Patients’ Records in Situ Using OpenSAFELY, England, 8 December 2020 to 25 May 2021. Eurosurveillance 2022, 27, 2100885. [Google Scholar] [CrossRef]
- Soares, P.; Rocha, J.V.; Moniz, M.; Gama, A.; Laires, P.A.; Pedro, A.R.; Dias, S.; Leite, A.; Nunes, C. Factors Associated with COVID-19 Vaccine Hesitancy. Vaccines 2021, 9, 300. [Google Scholar] [CrossRef] [PubMed]


| Variable | Total | Lowest Deprivation (1st Quintile) | Low Deprivation (2nd Quintile) | Medium Deprivation (3rd Quintile) | High Deprivation (4th Quintile) | Highest Deprivation (5th Quintile) |
|---|---|---|---|---|---|---|
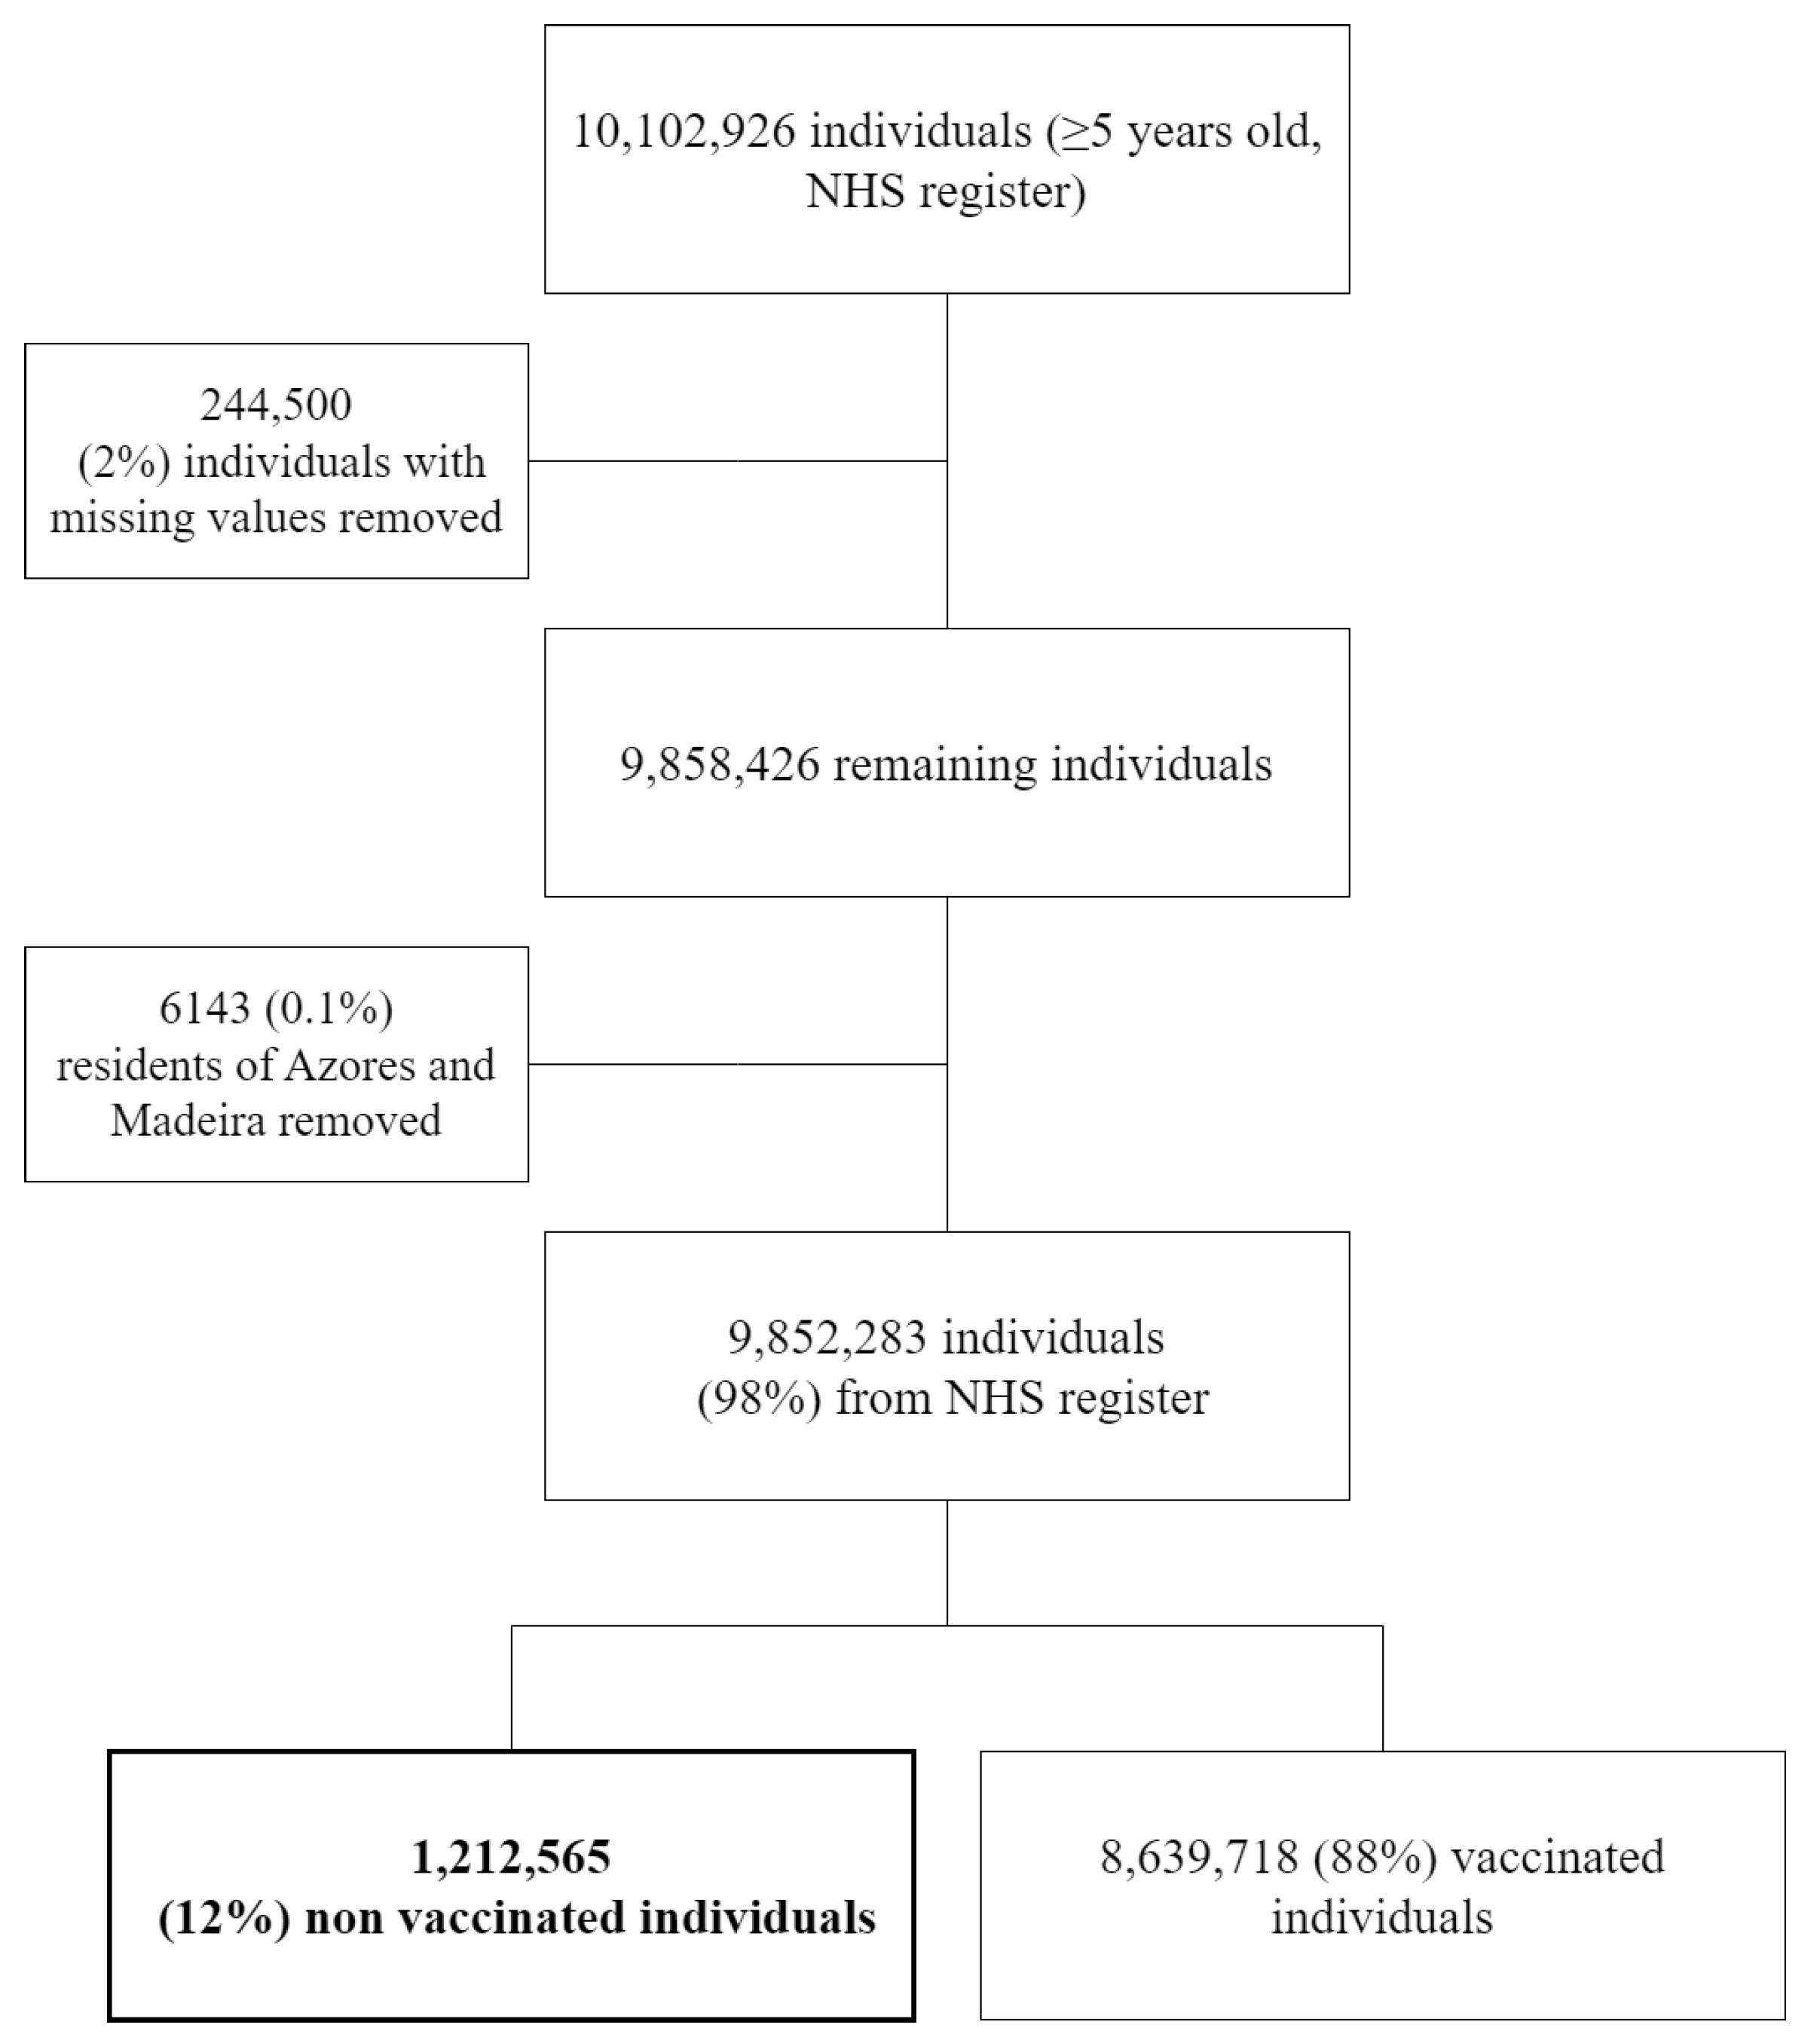
| Eligible individuals | 9,852,283 | 1,363,060 | 1,450,749 | 1,415,586 | 2,877,267 | 2,745,621 |
| Unvaccinated | 1,212,565 (12.3%) | 142,041 (10.4%) | 156,799 (10.8%) | 139,471 (9.9%) | 352,285 (12.2%) | 421,969 (15.4%) |
| Gender | ||||||
| Female | 584,862 (11.3%) | 67,154 (9.4%) | 75,109 (9.8%) | 65,730 (8.9%) | 170,558 (11.2%) | 206,311 (14.2%) |
| Male | 627,703 (13.5%) | 74,887 (11.6%) | 81,690 (11.9%) | 73,741 (10.9%) | 181,727 (13.4%) | 215,658 (16.6%) |
| Age group (years) | ||||||
| 5–14 | 357,402 (39.1%) | 39,211 (34.4%) | 47,831 (35.9%) | 41,085 (32.8%) | 104,326 (38.5%) | 124,949 (45.9%) |
| 15–19 | 49,734 (9.7%) | 4904 (7.4%) | 6156 (8.0%) | 5245 (7.2%) | 14,453 (9.6%) | 18,976 (13.1%) |
| 20–39 | 348,315 (14.9%) | 40,025 (13.2%) | 42,507 (12.7%) | 36,345 (11.4%) | 103,513 (14.8%) | 125,925 (18.4%) |
| 40–64 | 322,613 (8.8%) | 39,934 (7.9%) | 42,067 (7.7%) | 38,978 (7.2%) | 93,128 (8.7%) | 108,506 (10.8%) |
| 65–79 | 88,060 (5.2%) | 11,371 (4.5%) | 11,600 (4.6%) | 11,285 (4.5%) | 24,010 (5.0%) | 29,794 (6.5%) |
| 80+ | 46,441 (6.5%) | 6596 (5.5%) | 6638 (6.0%) | 6533 (6.1%) | 12,855 (6.4%) | 13,819 (7.6%) |
| Prop. of migrants (by municipality) | ||||||
| Mean % (SD) | 5.4% (7.4) | 3.3% (2.1) | 3.6% (2.6) | 3.5% (2.5) | 4.2% (4.9) | 11.8% (13.1) |
| RR | Low CI | High CI | |
|---|---|---|---|
| Intercept | 0.67 | 0.53 | 0.84 |
| 20–39 yrs | 1.01 | 0.99 | 1.02 |
| EDI-PT quintile 2 | 1.00 | 0.94 | 1.07 |
| EDI-PT quintile 3 | 1.04 | 0.97 | 1.11 |
| EDI-PT quintile 4 | 1.04 | 0.96 | 1.13 |
| EDI-PT quintile 5 | 1.03 | 0.94 | 1.13 |
| Prop. migrants | 8.01 | 4.59 | 14.00 |
Disclaimer/Publisher’s Note: The statements, opinions and data contained in all publications are solely those of the individual author(s) and contributor(s) and not of MDPI and/or the editor(s). MDPI and/or the editor(s) disclaim responsibility for any injury to people or property resulting from any ideas, methods, instructions or products referred to in the content. |
© 2024 by the authors. Licensee MDPI, Basel, Switzerland. This article is an open access article distributed under the terms and conditions of the Creative Commons Attribution (CC BY) license (https://creativecommons.org/licenses/by/4.0/).
Share and Cite
Pinto de Carvalho, C.; Ribeiro, M.; Godinho Simões, D.; Pita Ferreira, P.; Azevedo, L.; Gonçalves-Sá, J.; Mesquita, S.; Gonçalves, L.; Pinto Leite, P.; Peralta-Santos, A. Spatial Analysis of Determinants of COVID-19 Vaccine Hesitancy in Portugal. Vaccines 2024, 12, 119. https://doi.org/10.3390/vaccines12020119
Pinto de Carvalho C, Ribeiro M, Godinho Simões D, Pita Ferreira P, Azevedo L, Gonçalves-Sá J, Mesquita S, Gonçalves L, Pinto Leite P, Peralta-Santos A. Spatial Analysis of Determinants of COVID-19 Vaccine Hesitancy in Portugal. Vaccines. 2024; 12(2):119. https://doi.org/10.3390/vaccines12020119
Chicago/Turabian StylePinto de Carvalho, Constança, Manuel Ribeiro, Diogo Godinho Simões, Patrícia Pita Ferreira, Leonardo Azevedo, Joana Gonçalves-Sá, Sara Mesquita, Licínio Gonçalves, Pedro Pinto Leite, and André Peralta-Santos. 2024. "Spatial Analysis of Determinants of COVID-19 Vaccine Hesitancy in Portugal" Vaccines 12, no. 2: 119. https://doi.org/10.3390/vaccines12020119