Article

Impact of DNA Prime/Protein Boost Vaccination against Campylobacter jejuni on Immune Responses and Gut Microbiota in Chickens

1
GVB–Viral Genetics and Biosafety Unit, French Agency for Food, Environmental and Occupational Health and Safety (ANSES), 22440 Ploufragan, France
2
HQPAP–Unit of Hygiene and Quality of Poultry and Pork Products, French Agency for Food, Environmental and Occupational Health and Safety (ANSES), 22440 Ploufragan, France
3
UFR of Life Sciences Environment, University of Rennes 1, 35700 Rennes, France
4
SELEAC–Avian Breeding and Experimental Department, French Agency for Food, Environmental and Occupational Health and Safety (ANSES), 22440 Ploufragan, France
*
Author to whom correspondence should be addressed.
Vaccines 2022, 10(6), 981; https://doi.org/10.3390/vaccines10060981
Submission received: 3 May 2022 / Revised: 13 June 2022 / Accepted: 14 June 2022 / Published: 20 June 2022
(This article belongs to the Special Issue Feature Papers of DNA and mRNA Vaccines)

Abstract

:
Campylobacteriosis is reported to be the leading zoonosis in Europe, and poultry is the main reservoir of Campylobacter. Despite all the efforts made, there is still no efficient vaccine to fight this bacterium directly in poultry. Recent studies have reported interactions between the chicken immune system and gut microbiota in response to Campylobacter colonisation. The present study was designed to analyse in more depth the immune responses and caecal microbiota following vaccination with a DNA prime/protein boost flagellin-based vaccine that induces some protection in specific-pathogen-free White Leghorn chickens, as shown previously. These data may help to improve future vaccination protocols against Campylobacter in poultry. Here a vaccinated and a placebo group were challenged by C. jejuni at the age of 19 days. A partial reduction in Campylobacter loads was observed in the vaccinated group. This was accompanied by the production of specific systemic and mucosal antibodies. Transient relatively higher levels of Interleukin-10 and antimicrobial peptide avian β-defensin 10 gene expressions were observed in the vaccinated and placebo groups respectively. The analysis of caecal microbiota revealed the vaccination’s impact on its structure and composition. Specifically, levels of operational taxonomic units classified as Ruminococcaceae and Bacillaceae increased on day 40.

1. Introduction

Campylobacteriosis is the most frequently reported zoonosis in the European Union, with 220,682 human cases in 2019 [1]. The causative agent is Campylobacter, a microaerophilic gram-negative bacterium. Campylobacter jejuni is the most frequently reported species. Campylobacter is generally responsible for an acute gastrointestinal illness [2] and is also associated with extra-gastrointestinal infections like bacteraemia, meningitis and urinary infections. It is also considered to be a major trigger for a severe demyelinating neuropathy known as Guillain–Barré syndrome [3]. Poultry is the main reservoir, and the majority of infections are attributed to the consumption and handling of poultry meat products contaminated with C. jejuni [1]. The predominant site of C. jejuni colonisation in the chicken gut is the caecum, which can generally contain about 8 log10 colony-forming units (CFU)/g), a high colonisation level correlated with contamination during slaughter and carcass processing [4,5]. As Campylobacteriosis is a major public health issue with important economic consequences, increased surveillance and control measures at primary production level are needed to reduce the risk to consumers. It is estimated that a reduction by 2 log10 or 3 log10 CFU/g of Campylobacter levels in broiler caeca would reduce the relative risk of human Campylobacteriosis by 42% or 58% respectively [6]. Consequently, the European Union implemented a microbiological criteria plan for broiler chicken carcasses with a limit of 3 log10 CFU/g on neck skin [7]. Vaccinating poultry is considered to be one of the potential measures to reduce Campylobacter carriage in chickens [8,9,10,11,12]. However, no effective vaccine is currently available on the market despite the many publications on the subject. Furthermore, studies seeking to depict the mechanism behind Campylobacter colonisation in poultry demonstrate the involvement of (1) maternally-derived immunity; (2) innate immune responses with the involvement of Toll-like receptors and β-defensins which are antimicrobial peptides (AMPs); (3) adaptive immune responses with the production of antibodies or cytokines/chemokines; as well as changes in (4) gut microbiota structure and composition [13,14,15,16,17,18,19,20]. The immune system detects infection of the gastrointestinal tract by pathogens and responds by several interconnected pathways involving the innate and adaptive immune systems and allows a cooperation and a retroaction between these two systems. The gut microbiota plays an important role through their effects on nutrient exchange, gut morphology, regulation of mucin production, modulation of immune system, detoxification, protection against pathogens and health, growth and performance of chickens [21]. The caecum constitutes the organ with the highest taxonomic abundance and diversity mainly, because feed circulates in the caeca for the longest period (from 12 to 20 h) in the chicken digestive tract [22]. The chicken caecal microbiota, characterised by modern sequencing approaches, is constituted of three main bacterial phyla: Firmicutes, Bacteroidetes and Proteobacteria [23]. In the chicken gut Campylobacter interacts with other microorganisms and plays a role in structure and composition of the microbiota [19,24,25,26,27], despite this, the bacterium is cited as a commensal inhabitant of the gut microbiota in chicken [28]. Both the immune system and the microbiota should therefore be taken into consideration during anti-Campylobacter vaccine development studies.
In a previous study [10], it was shown that the inoculation of a flagellin-based DNA prime/protein boost vaccine regimen against Campylobacter resulted in a dramatic reduction in caecal Campylobacter loads in specific-pathogen-free (SPF) Leghorn chickens at slaughter (dropping from around 8 log10 CFU/g to below the detection limit of 2 log10 CFU/g). It is therefore a suitable model for evaluating the immune and microbiota parameters involved in protective immunity. These data may be very useful for identifying novel strategies to improve vaccine efficacy against Campylobacter. However, this first trial neither studied immune responses in depth nor evaluated the role of caecal microbiota.
The present work was therefore designed to study these parameters more closely through another in vivo trial with the same vaccine regimen and chicken breed. The following parameters were measured at different time points starting from the day of Campylobacter challenge (19-day-old chickens) to the end of rearing (40-day-old chickens): caecal Campylobacter loads, production of specific serum IgY and bile IgA antibodies reflecting, respectively, the systemic and mucosal humoral immune responses, a panel of key caecal cytokines, chemokines and antimicrobial peptide gene expressions and microbiota composition.
In this study, the flagellin-based DNA prime/protein boost vaccine regimen reduced Campylobacter loads (mean reduction of 1.3 log10 on day 40) in the caecum and stimulated the production of specific antibodies in sera (IgY) and bile (IgA) throughout the same period (D19-D40) as well as a transient gene over-expression of Interleukin-10 (IL-10) in the caecum on day 28. In the placebo group, there was a gene over-expression of antimicrobial peptide avian β-defensins 10 (AvBD10) on day 40. Moreover, vaccination was observed to induce changes in the microbiota’s structure and composition at different time points, including, in particular, an increase in Ruminococcaceae and Bacillaceae families in the vaccinated group at the age of 40 days.

2. Materials and Methods

2.1. Production of DNA Vaccine

The plasmid encoding C. jejuni flagellin (pcDNA3-flagellin A (FlaA)) and the placebo, pcDNA3, were produced and characterised as described previously [10].
For each chicken, 150 µg of pcDNA3-FlaA (or pcDNA3 for the placebo group) was mixed with 25 µg of unmethylated CpG ODN2007 (TCGTCGTTGTCGTTTTGTCGTT, with phosphorothioate backbone) (Sigma-Aldrich, Saint-Quentin-Fallavier, France) and then stored at −20 °C until vaccination.

2.2. Production of the Recombinant Flagellin (recFlaA) Protein Vaccine

Recombinant C. jejuni flagellin A (recFlaA) was produced previously [10]. For each chicken, 100 µg of recFlaA protein (or phosphate buffer saline (PBS) for the placebo group) was emulsified in MONTANIDETM ISA 71 VG (30/70, p/p) (Seppic, La Garenne-Colombes, France) the day before vaccination and stored at 4 °C.

2.3. Campylobacter Strain and Growth

The C. jejuni C97Anses640 strain, isolated from a poultry product and belonging to the ST−45 (sequence type) complex, was used for the in vivo oral challenge. Bacteria from frozen stock (−70 °C) were plated twice on selective modified charcoal cefoperazone deoxycholate agar (mCCDA) (Thermo Fisher Diagnostics, Dardilly, France) for 48 h at 41.5 °C under microaerobic conditions (85% N2, 10% CO2 and 5% O2), then inoculated twice in Brucella broth (Becton Dickinson, Le Pont-de-Claix, France) for 24 h under the same incubation conditions. The bacterial suspension was diluted to 5 log10 CFU/mL in tryptone salt broth (BioMérieux, Bruz, France) and the concentration of bacterial suspension was confirmed by plating the inoculum on mCCDA plates in 10-fold dilution series.

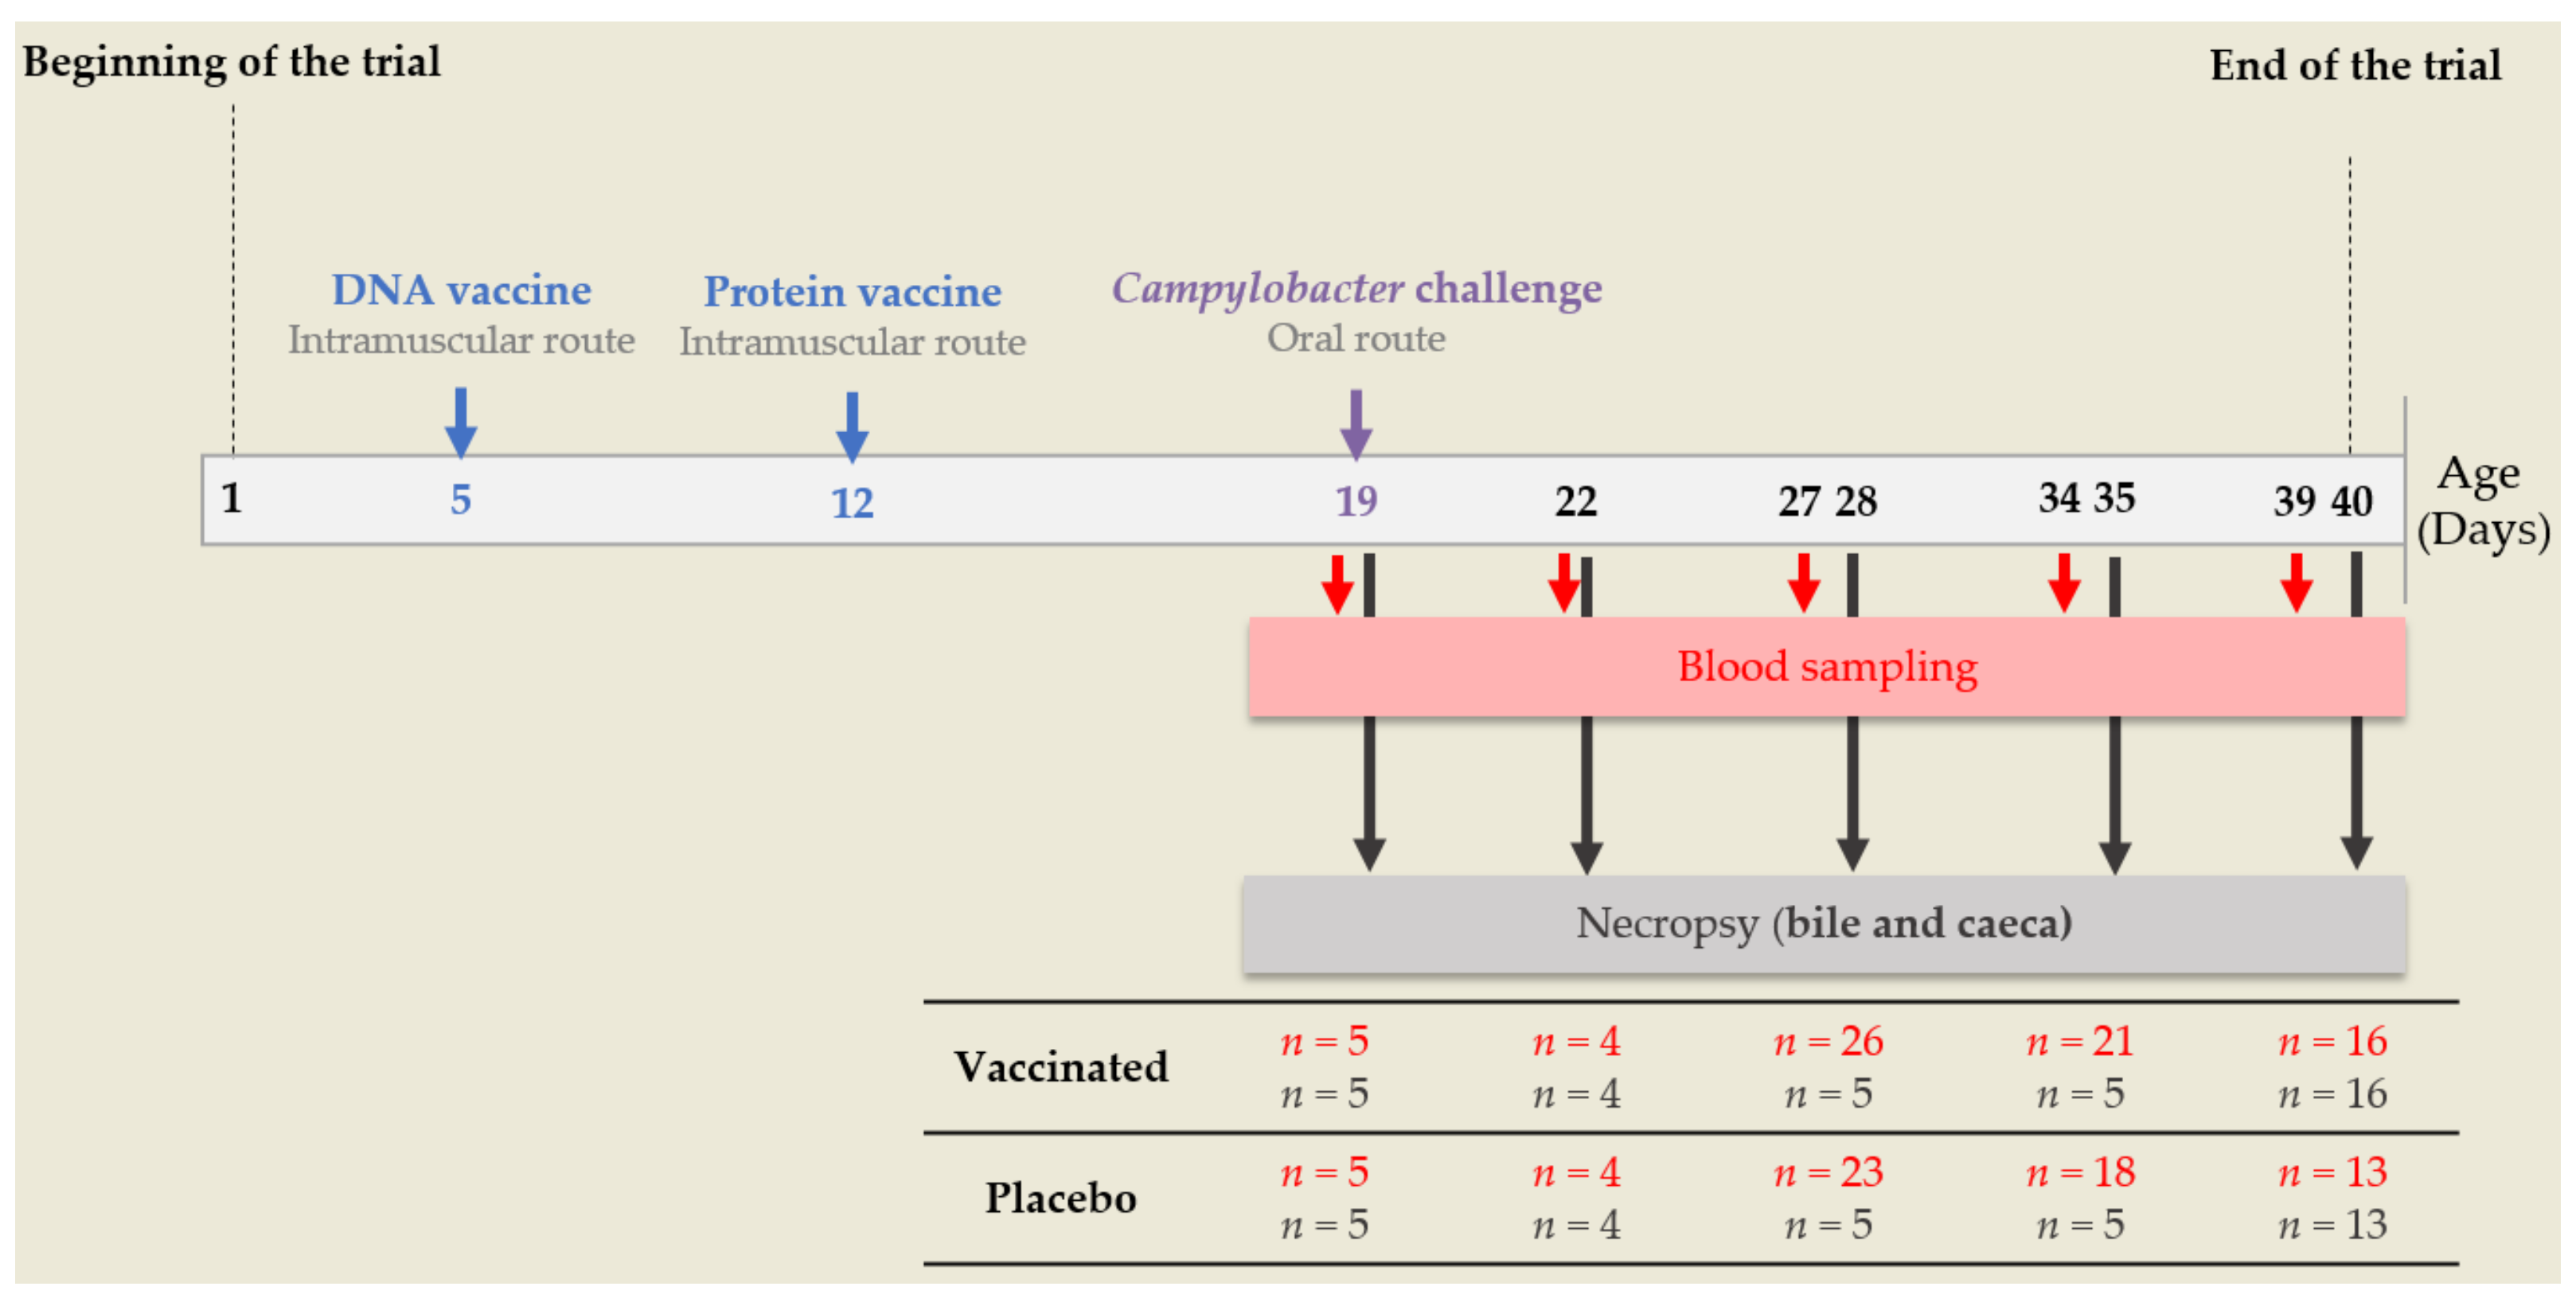
2.4. Avian Vaccine Experiment

A total of 72 day-of-hatch SPF White Leghorn layer chicks were provided by ANSES facilities (certification no. D-22–745-1). At the beginning of the experiment, the absence of Campylobacter spp. was confirmed in the experiment rooms (including the feeding and drinking systems) and in five chicks. The remaining birds were randomly divided into a vaccinated (n = 35) and a placebo (n = 32) group and were kept in floor pens (1.85 × 1.85 m2) in separate rooms.
The diets during the experiment were fairly standard diets for poultry, formulated and manufactured by a commercial feed meal company. The two groups received a starter-grower diet from days 1 to 19 then a grower-finisher diet until day 40 (D40).
DNA prime and protein boost vaccinations were performed on days 5 and 12 respectively using 26 G needles for intramuscular injections. On D19, all the chickens were orally challenged with 105 CFU of C. jejuni C97Anses640 isolated at the ANSES laboratory in Ploufragan from a poultry product, and already used in previous trials [9,29]. On D19, D22, D27, D34 and D39, blood samples were taken from the occipital sinus. The sera were recovered after coagulation and centrifugation (2000× g, 10 min, room temperature) and stored at −20 °C until determination of the systemic immune response. On D19, D22, D28, D35 and D40, 4 to 16 birds per group were euthanised (electronarcosis followed by bleeding). Bile samples were taken and stored at −20 °C until evaluation of the mucosal immune response. All caecal contents were collected for Campylobacter spp. enumeration and microbiota analysis. A portion (around 0.5 cm long) of caecal wall was immediately placed in 1 mL of RNAlaterTM (Invitrogen), incubated for one day at 4 °C then stored at −80 °C until gene expression assessment. On days 5, 19 and on each slaughter day, each bird was individually weighed. Birds were observed daily to ensure that no adverse reactions occurred. The main steps of the experimental design are summarised in Figure 1.

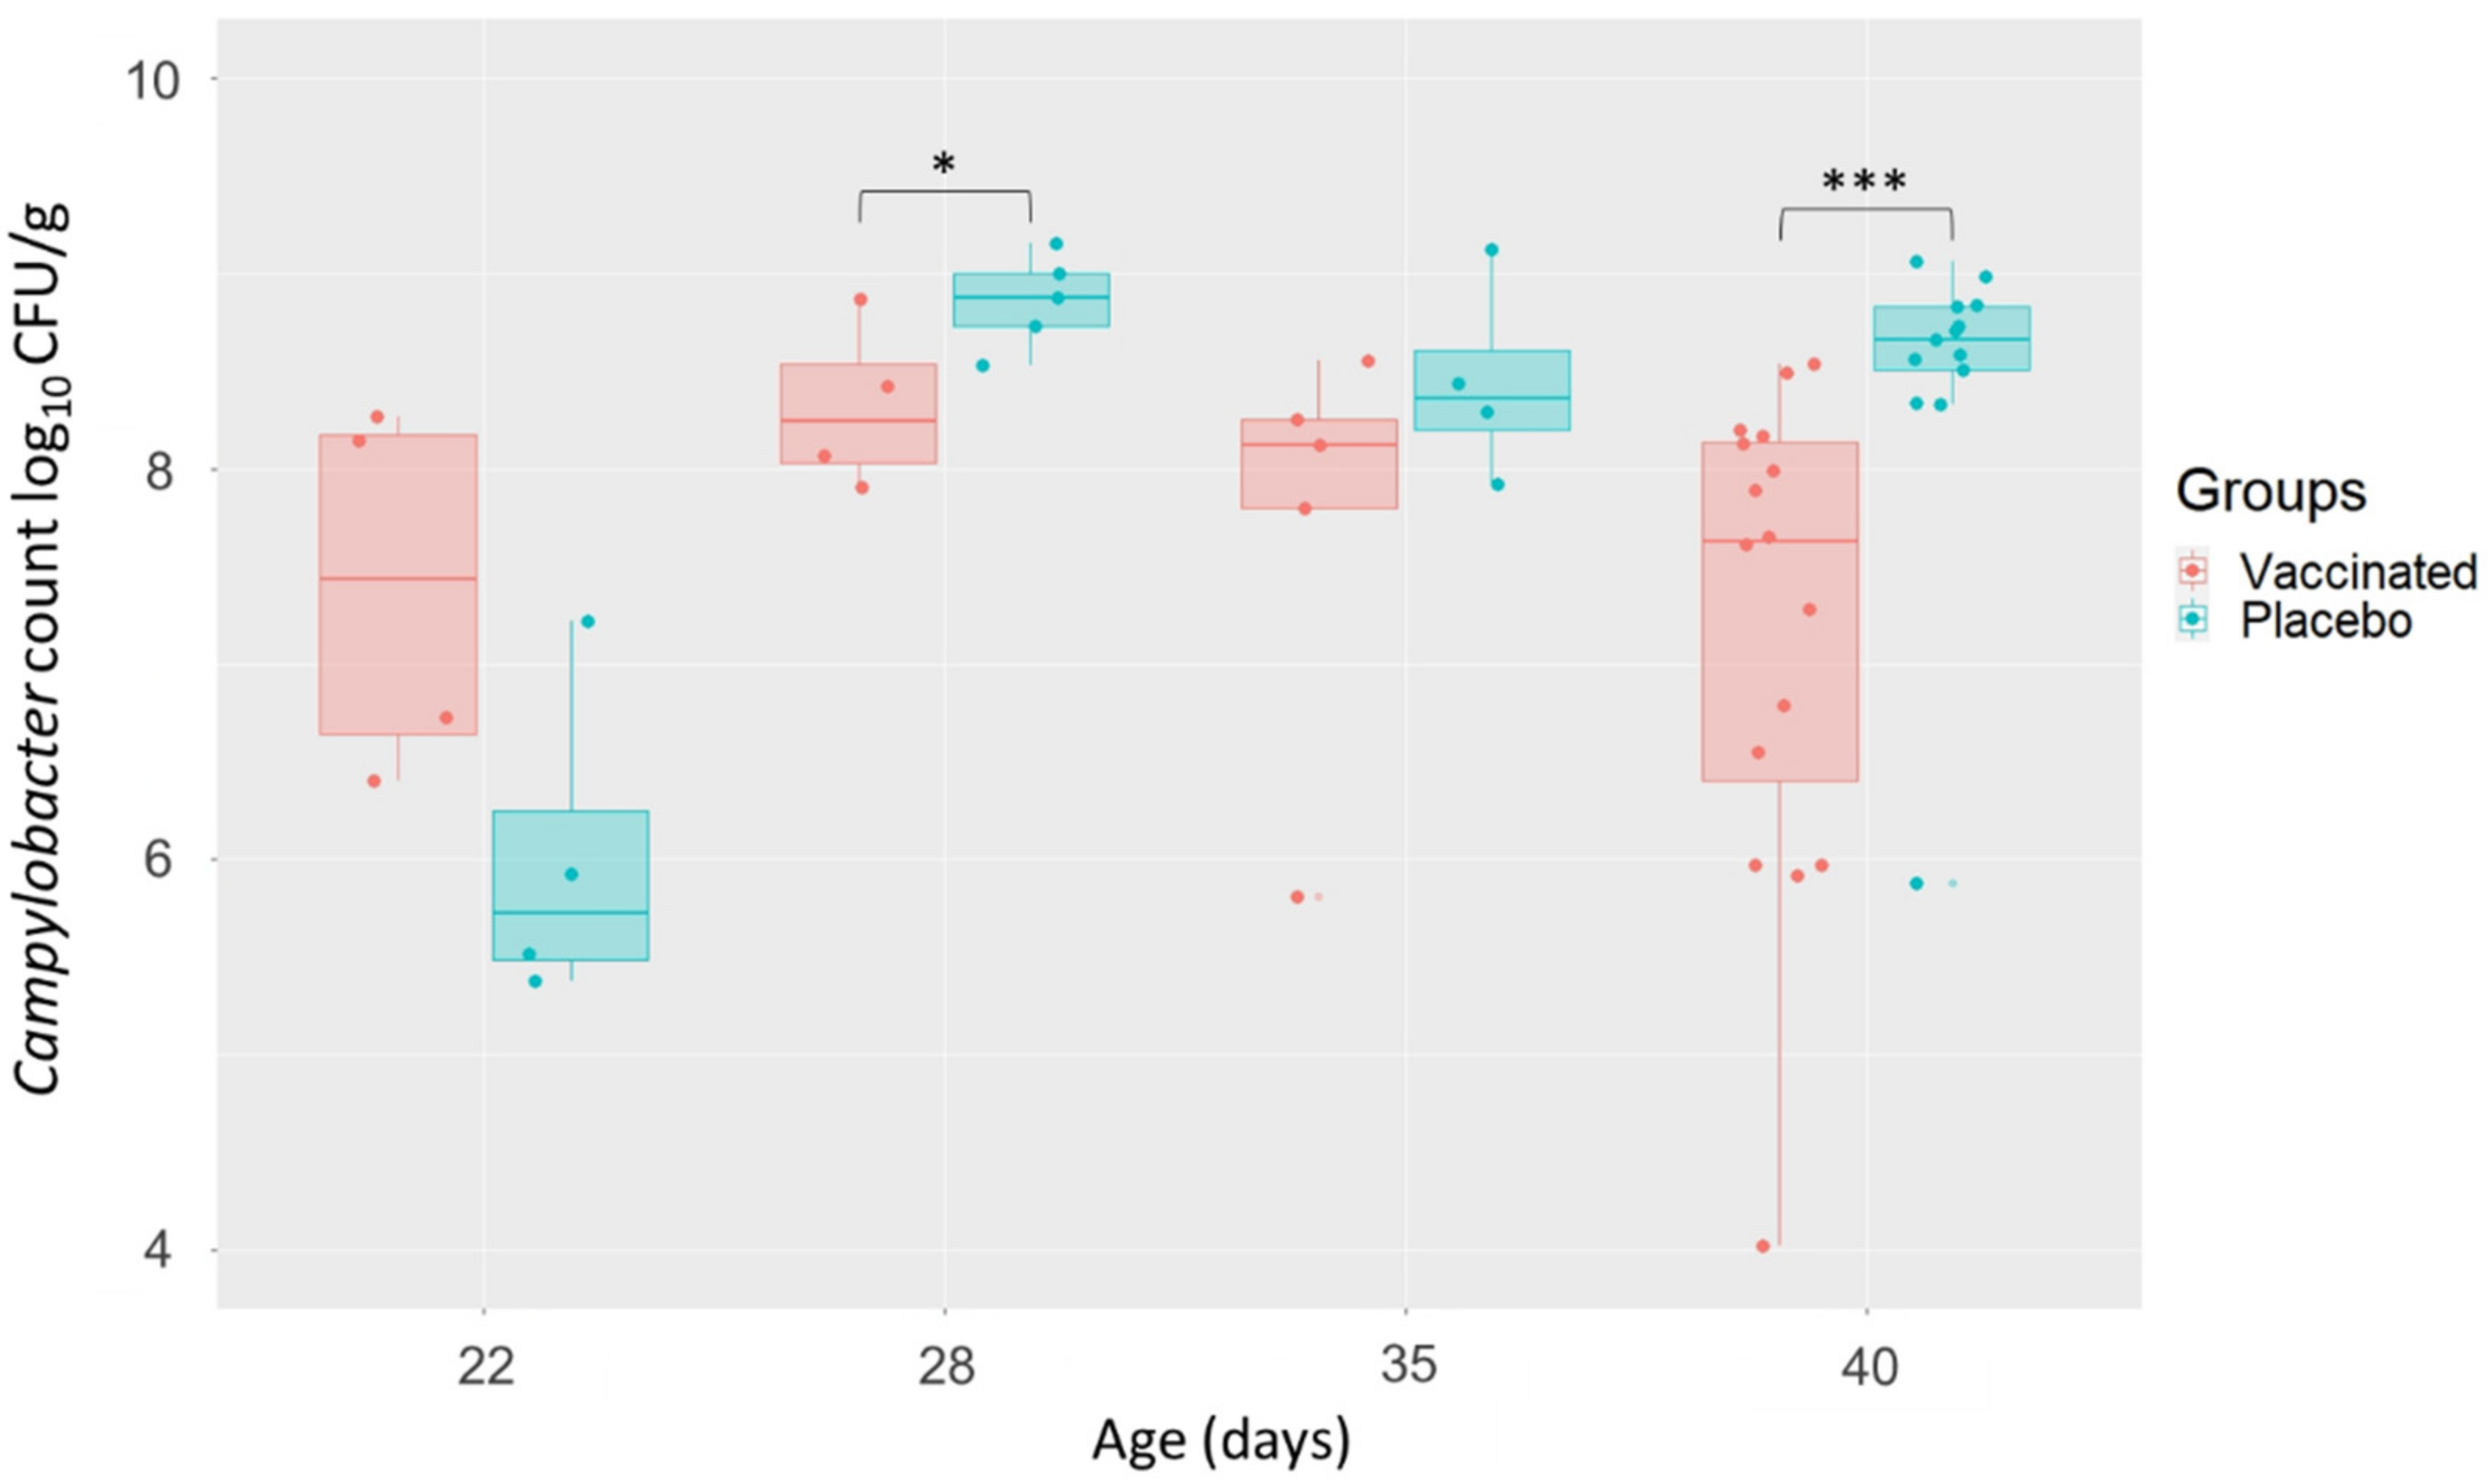
2.5. Campylobacter Caecal Enumeration

Campylobacter enumerations were assessed in caecal contents after direct plating according to the decimal dilution method. Caeca were homogenised then serially diluted 1:10 (w/v) up to dilution 10−6 in tryptone salt broth (Biomerieux, Craponne, France) and plated on mCCDA using an automatic easySpiral Dilute ® plater (Interscience, Saint-Nom-la-Bretèche, France). Typical Campylobacter colonies were enumerated on plates after incubation for 48 h at 41.5 °C under microaerophilic conditions (85% N2, 10% CO2 and 5% O2) and converted to log10 CFU/g. The detection limit for enumeration of Campylobacter was 2 log10 CFU/g. A sample of one mL of the first dilution (10−1) of caecal content was centrifuged (10,000× g, 10 min) and the pellet was stored at −70 °C until microbiota analysis.

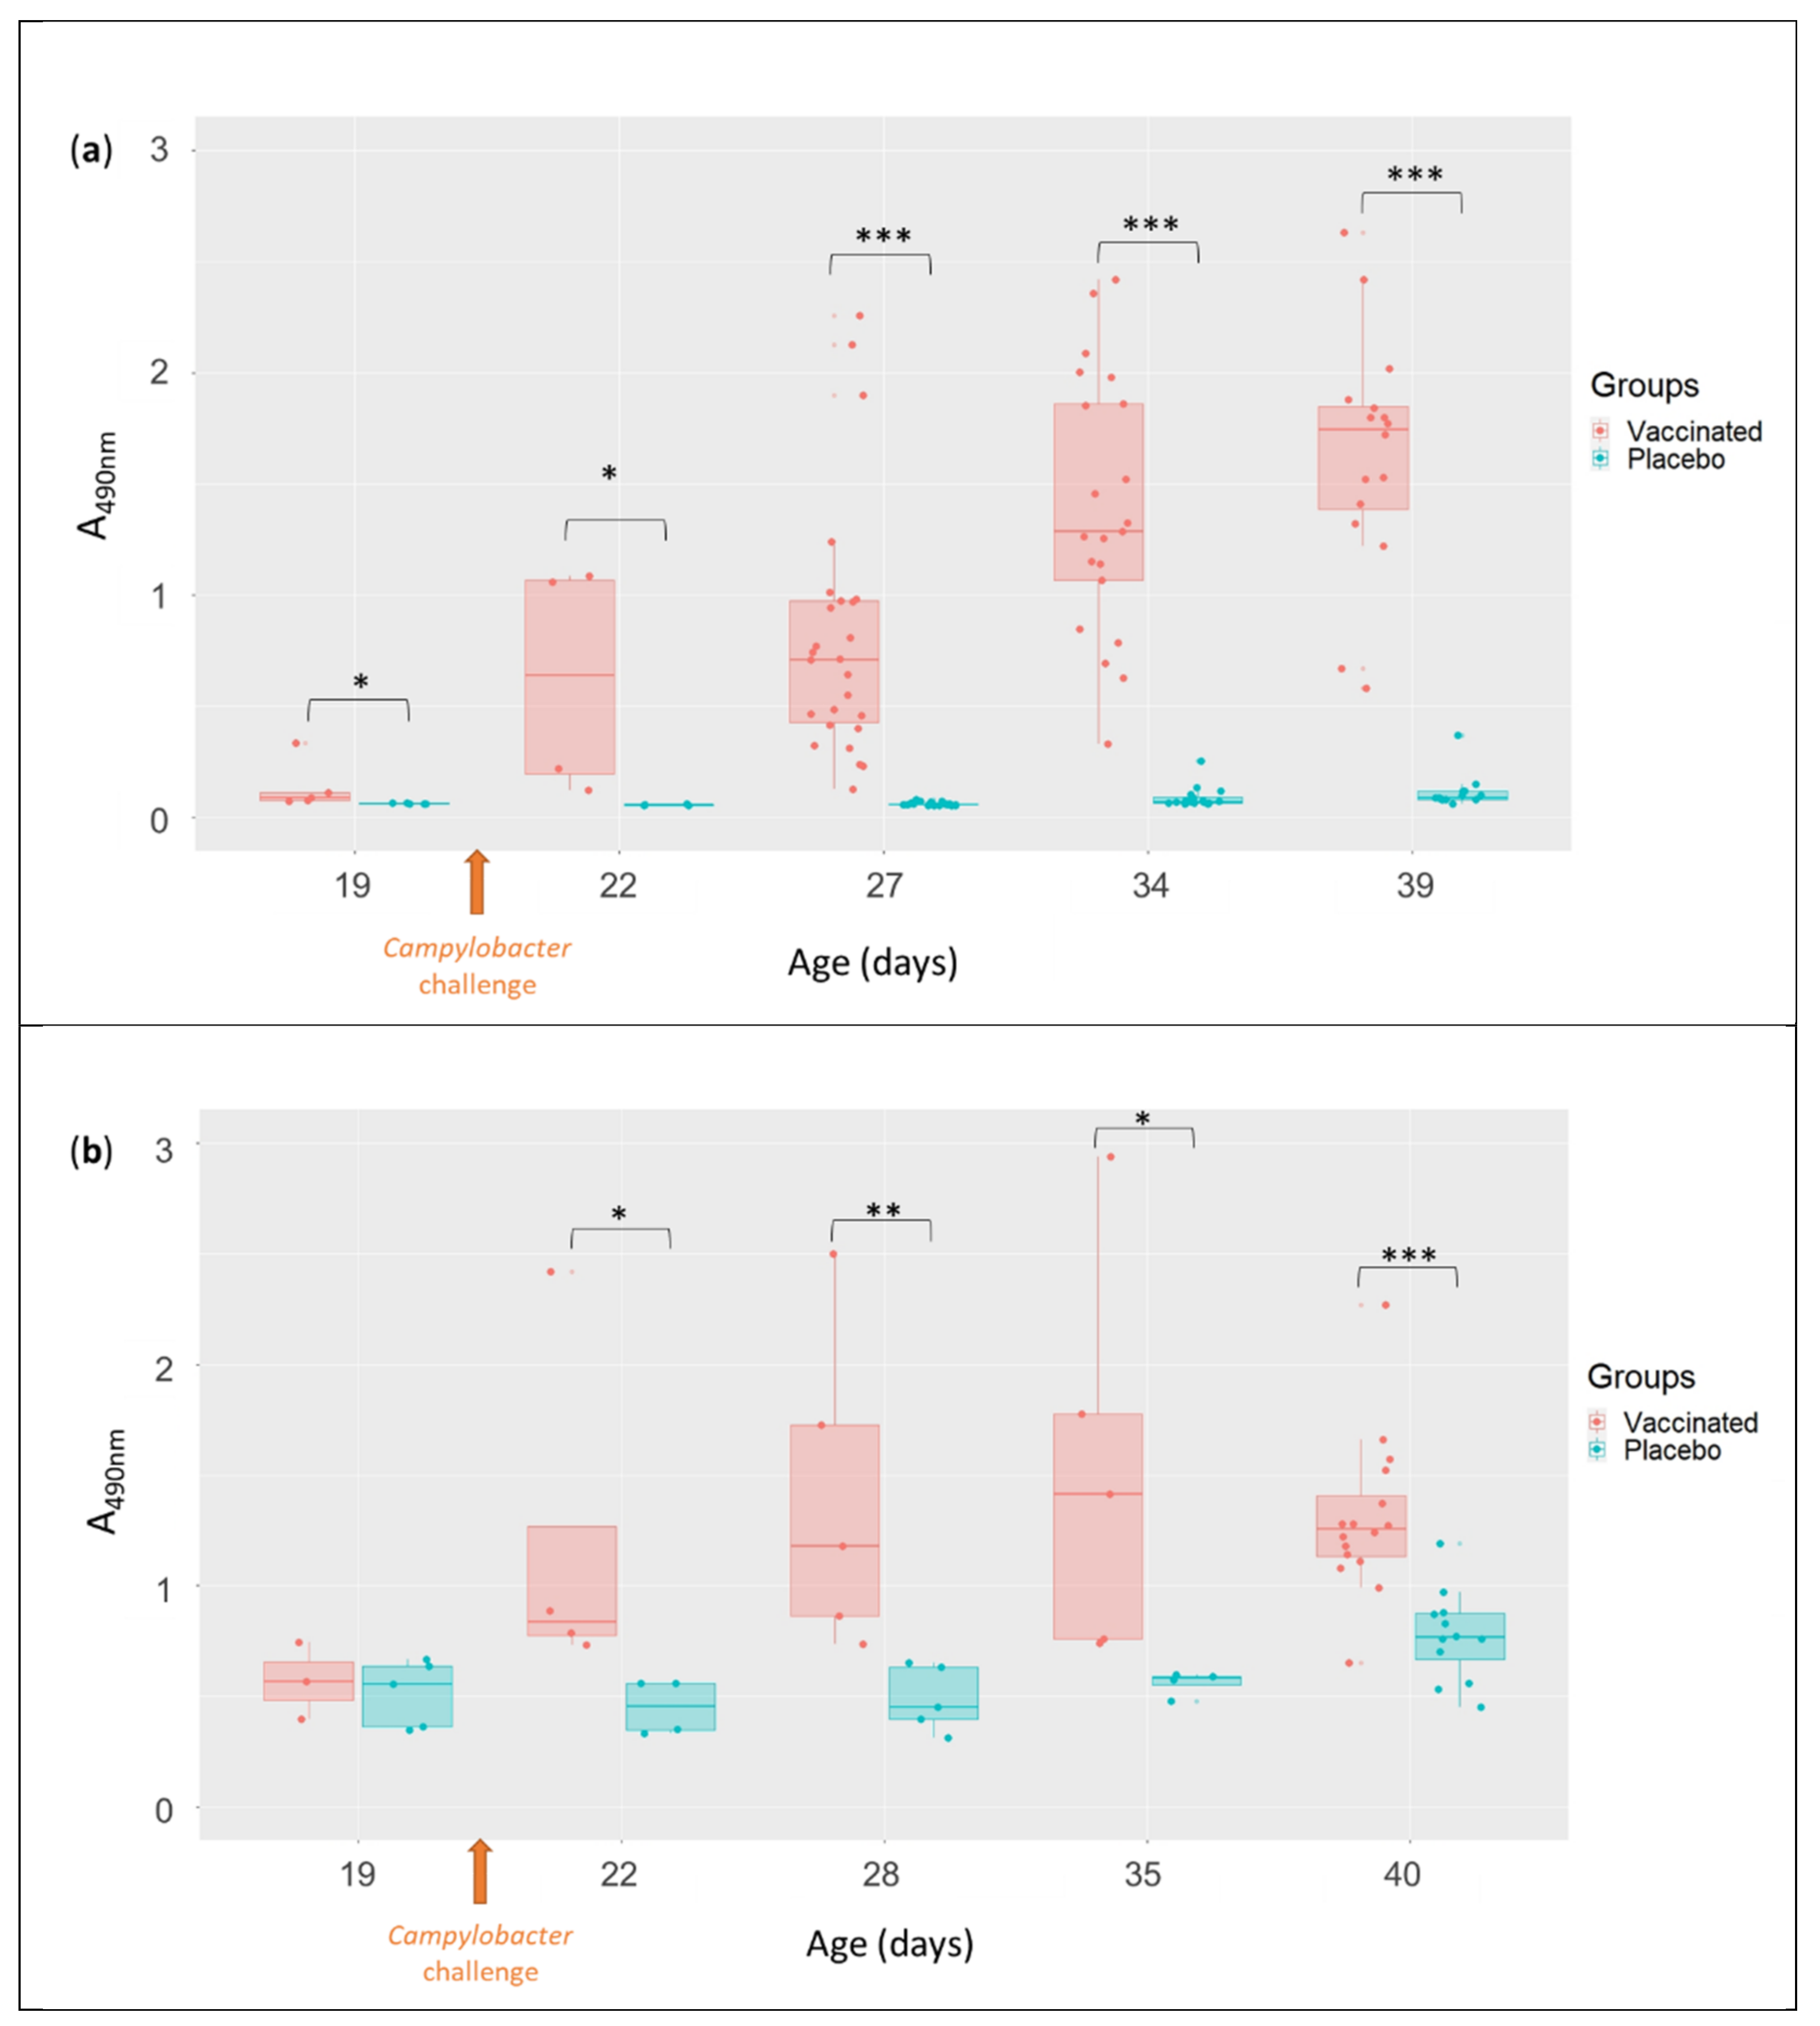
2.6. Serum (IgY) and Bile (IgA) Anti-Flagellin Antibodies by Specific ELISAs

The levels of antibodies against flagellin protein in serum and bile were measured by ELISA by adapting the method of [10], in which the plates were coated with the purified flagellin instead of Campylobacter soluble proteins. Briefly, 96-well Maxisorp® plates (Nunc) coated with 100 µL of 2 µg/mL of purified flagellin protein per well were successively incubated with 1:4800 diluted serum or 1:100 diluted bile, followed by 1:35,000 diluted goat anti-chicken IgY- horseradish peroxidase (HRP) antibodies (Abcam, Paris, France) or 1:5000 diluted goat anti-chicken IgA-HRP respectively. After incubation with o-phenylenediamine dihydrochloride substrate in citrate buffer containing hydrogen peroxide, the reaction was stopped by adding 1 M H2SO4. The optical densities (ODs) were measured at 490 nm using a spectrophotometer (Infinite 200 PRO Nanoquant, Tecan, Lyon, France). Each plate contained one serum internal control and one bile internal control to allow standardisation between experiments and each sample was measured in duplicate.

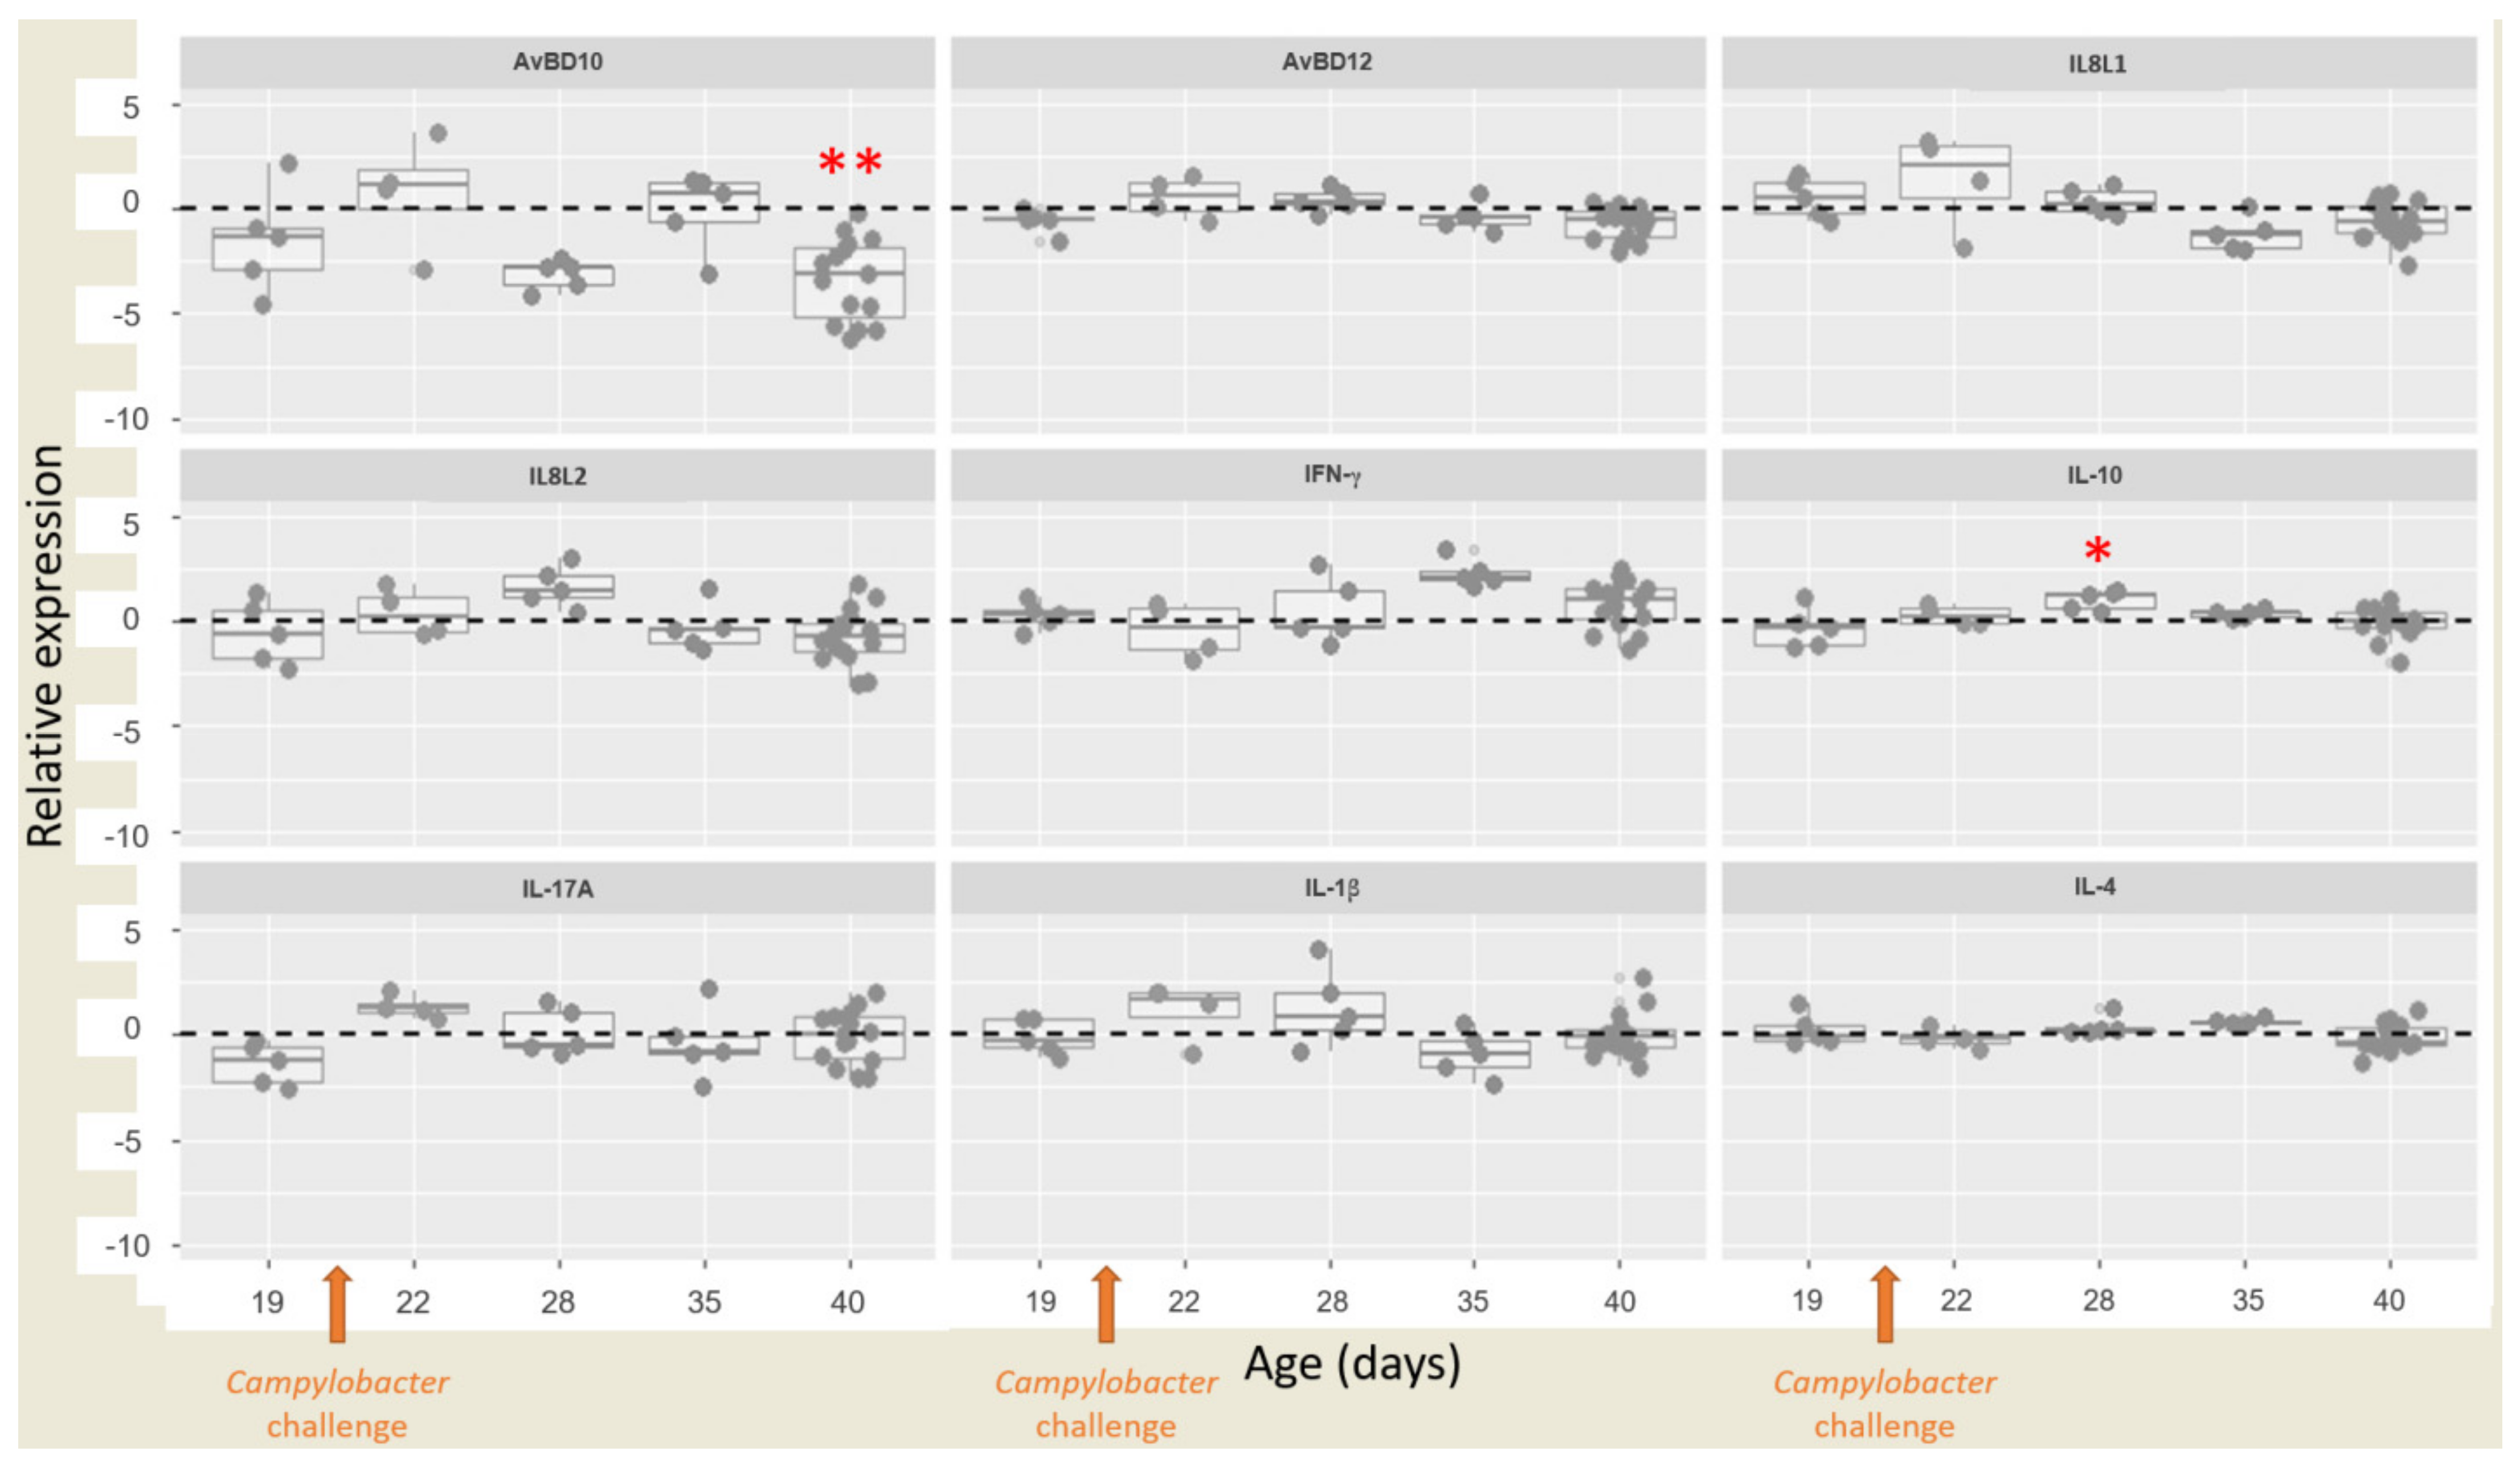
2.7. Relative Cytokine and Chemokine Expressions Determined by RT-qPCR

2.7.1. RNA Extraction

RNA was extracted from caecal tissues using Agencourt® RNAdvanceTM Tissue kit (Beckman coulter, Brea, CA, USA) with magnetic beads according to the manufacturer’s protocol with the following modifications. Tissue samples were homogenised in a lysis buffer with 2.8-mm ceramic beads (MO BIO Laboratories Inc., Carlsbad, CA, USA) using a ball mill (Retsch, Haan, Germany). The supernatant was collected (400 µL) after centrifugation at 4 °C for 10 min prior to subsequent purification as described in the manufacturer’s protocol. RNA was eluted in RNAse-free water then processed with the Turbo DNA-free™ kit (Thermofisher Scientific, Vilnius, Lithuania), quantified using the Qubit RNA high sensitivity assay kit (Life Technologies Corporation, Eugene, OR, USA) with a Qubit 2.0 fluorometer (Life Technologies, Saint-Aubin, France) and stored at −80 °C. Some samples were checked for total RNA quality and integrity by capillary electrophoresis using an Agilent fragment analyser system.

2.7.2. Reverse Transcription of Total RNA

The cDNAs were obtained from 320 ng of total RNAs using the High-capacity cDNA Reverse Transcription kit (Applied Biosystems, Villebon sur Yvette, France) according to the manufacturer’s instructions, then stored at −20 °C.

2.7.3. qPCR

The relative levels of cytokine, chemokine and AMP RNA were determined by qPCR using the 7500 real-time PCR system (Applied Biosystems, Villebon sur Yvette, France). A quantitative PCR reaction was performed with a cDNA template retrotranscribed from 4 ng of total RNA in duplicate using SYBR Green Master mix (Applied Biosystems, ThermoFisher Scientific, Villebon sur Yvette, France) and the following programme: 95 °C/10 min followed by 40 amplification cycles (95 °C/15 s, 60 °C/1 min). The primers used for a qPCR of β-actin, interferon (IFN)-γ, interleukin (IL)8-like (L)1, IL8L2, IL-1β, IL-4, IL-10, IL-17A, antimicrobial peptide avian β-defensins 10 (AvBD10) and AvBD12 are presented in Table 1. Specific primers for IL-10 were designed using Primer Express® (Applied Biosystems, Villebon sur Yvette, France) software. Each qPCR reaction performed in 20 µL of reaction mix consisted of 1X SYBR Green Master mix (Applied Biosystems, ThermoFisher Scientific, Villebon sur Yvette, France), 300 mM of each primer, RNAse-free water and the retrotranscribed cDNA. The absence of any genomic DNA contamination was checked by qPCR on the total RNA. The relative amount of target gene expression was determined by the 2−ΔΔCt method [30] with β-actin as the reference gene [31]. PCR efficiency, measured using the slope of a standard curve, ranged from 90 to 110%. Statistical tests were performed using duplicates of the 2−ΔCt data for each gene in the vaccine and placebo groups [19].

2.8. Statistical Analyses

R software (version 4.0.3) was used for statistical analysis. Student’s parametric test was used when the normality and homogeneity criteria of the variances were validated (checked by the Shapiro–Wilk normality test and Bartlett’s test respectively); otherwise, the non-parametric Mann–Whitney test was used. A p-value lower or equal to ≤0.05 (p ≤ 0.05) was considered statistically significant.

2.9. DNA Extraction and PCR Amplification of 16S rRNA Gene Sequences and Microbiota Diversity Analysis

2.9.1. DNA Extraction

Bacterial DNA was isolated from caecal pellets using the NucleoMag Tissue Kit (Macherey-Nagel, Hoerdt, France). Briefly, caecal pellets were resuspended in 500 µL of T1 lysis buffer and were mechanically lysed by adding one stainless-steel 5 mm bead (Qiagen, Courtaboeuf, France) and using the Star Beater (3 min–30 Hz) (VWR, Fontenay-sous-Bois, France). Chemical lysis was performed by incubation (30 min–70 °C) with 25 µL of Proteinase K (NucleoMagTissue kit, Hoerdt, France). After centrifugation (2 min–13,000× g), 225 µL of supernatant was transferred into a standard 96-well plate and the DNA was extracted with a KingFisher Duo Prime instrument (Thermofisher Scientific, Illkirch-Graffenstaden, France). DNA extraction of samples from the different groups was randomly performed and a negative extraction control was used for each plate. DNA concentrations were determined using the Qubit dsDNA High Sensitivity (HS) Assay Kit (Thermofisher Scientific, Illkirch-Graffenstaden, France) and a Qubit 2.0 Fluorometer (Life Technologies, Saint-Aubin, France) and were then stored at −20 °C until use.

2.9.2. Sequencing of the V3/V4 Variable Region of the 16S Ribosomal Genes

Genomic DNA from all samples was PCR-amplified using a primer set covering the V3-V4 variable regions of the 16S rDNA gene (forward primer: 5′-TCGTCGGCAGCGTCAGATGTGTATAAGAGACAG; reverse primer: 5′ GTCTCGTGGGCTCGGAGATGTGTATAAGAGACAG) and the expected amplicon size is approximately 460 bp (15044223 Rev B adapted). The 2 × 300 bp paired-end sequencing of the amplicons was performed using an Illumina MiSeq sequencer with the Illumina MiSeq reagent kit 600 version 3, according to the Illumina 16S metagenomic library preparation protocol (15044223 Rev B adapted) and MiSeq system denature and dilute libraries guide (15039740–3 December 2017 adapted).

2.9.3. Sequence Analyses

Sequences were processed using FROGS (Version 3.2.3 + galaxy2) [36], a galaxy-supported pipeline. Briefly, paired-end reads were merged using VSEARCH, and sequences were cleaned by removing those with ambiguous bases, those of an unexpected length (<380 or >500 nucleotides), or those without a primer sequence at both 3′- and 5′-ends (no mismatch allowed) before dereplication. After the sequences were clustered into operational taxonomic units (OTUs) using SWARM, and following FROGS guidelines, chimeras were removed using VSEARCH combined with a cross-sample validation step. The OTUs were then filtered according to their size (OTUs with an abundance below 5 × 10⁻⁵ were removed) and the BLAST algorithm was used for taxonomic assignment against the SILVA 16S database (version 132 filtered at a pintail score of 80).

2.9.4. Statistical Analyses

Descriptive statistical analyses on the diversity and structure of caecal microbiota were performed using the phyloseq R package implemented in FROGS. The richness of a sample is defined by the number of OTUs (observed richness). Chao1 richness index estimates total richness (observed richness and the unknown number of species present in the community but not observed). Shannon and InvSimpson are used to describe diversity in samples and take into account richness and evenness (Table S1). The effect of the vaccination on these indices was investigated using ANOVA. We also investigated the impact of vaccination on microbiota diversity and structure. A weighted UniFrac (wUniFrac) distance matrix, which takes into account the relative abundance of OTUs shared between samples was calculated after data rarefaction and plotted using multidimensional scaling (MDS) to investigate the structure of the bacterial community. An ADONIS pairwise test was used to check significance. To identify and visualise whether taxa with differential abundance were statistically different between vaccinated and placebo groups, the linear discriminant analysis (LDA) effect size (LEfSe) method was used, and only OTUs of family and genera with an LDA score over 2 were reported on D40. LEfSe analysis was performed with all taxonomic ranks but only genera and families are represented graphically.

3. Results

3.1. Body Weight

The in vivo trial was performed on SPF Leghorn chickens to assess the effect of vaccination with C. jejuni flagellin on caecal C. jejuni loads. Chickens were injected by a DNA prime/protein boost flagellin-based vaccine or a placebo at days 5 (DNA) and 12 (protein) as described above. The chickens were then orally challenged with Campylobacter on day 19.
Results showed that the vaccination did not affect chicken growth, as there was no difference in mean body weight between the placebo and vaccinated groups (p > 0.05) during the whole rearing period (Table 2). No adverse reaction was observed in either of the two groups.

3.2. Campylobacter Caecal Enumeration

Campylobacter enumerations were assessed from caecal contents at different time points post inoculation. The results are presented in Figure 2. On D22, three days after the challenge, Campylobacter colonisation was tested. Both the vaccinated and placebo groups were colonised by high levels of Campylobacter (from 5.4 to 8.3 log10 CFU/g) of caecal content. A significant reduction (p < 0.05) in caecal Campylobacter load was observed in the vaccinated group compared with the placebo group on D28 (mean). A significant reduction (p < 0.001) was also observed at the end of rearing on D40 with a mean difference of 1.3 log10 (7.2 log10 vs. 8.5 log10) between the two groups despite high inter-individual variability in the vaccinated group.

3.3. Serum (IgY) and Mucosal (IgA) Anti-Flagellin Antibody Levels

The levels of antibodies against flagellin protein in serum (IgY type), which reflect the systemic humoral immune response, and in bile (IgA type), which reflect the mucosal humoral immune response, were quantified by ELISA. The levels of IgY in serum were significantly higher in the vaccinated group than in the placebo group from D19 to D40 (Figure 3a). Similarly, the levels of IgA in bile from D22 to D40 were significantly higher in the vaccinated group (Figure 3b).
In both cases, increases in antibody levels and high inter-individual variabilities were observed over point in the vaccinated group (Figure 3a,b) but not in the placebo group. IgY levels were individually measured on the same animals at different time points from D27 to D39. This monitoring showed that the level of IgY increased from D27 to D39 or reached a plateau from D34 for most of the vaccinated animals (data not shown).

3.4. Relative Expressions of Cytokines/Chemokines and Antimicrobial Peptides

RT-qPCR was performed on caecal tissue from D19 to D40 to assess the relative expression of cytokines, chemokines and AMP genes that were previously shown to play a role in response to Campylobacter infection. AvBD10 and AvBD12 are AMPs involved in innate immune response [37]. As previously described, IFN-γ and IL-4 are markers of Th1 and Th2 pathways respectively. The Th17 pathway is represented by chemokines IL8L1 and IL8L2 and cytokines IL-1β and IL-17A whereas IL-10 is related to the Treg (regulatory T) cell pathway [38]. Relative gene expression between the vaccinated and placebo groups were calculated according to Connerton [19]. Out of the nine targets considered, only two differed in expression between the two groups (Figure 4). IL-10 characteristic of the anti-inflammatory Treg pathway was over-expressed on day 28 in the vaccinated group (p < 0.05). On the contrary, AvBD10 was under-expressed in vaccinated chickens on D40 compared with the placebo group (p< 0.01). Furthermore, after the Campylobacter challenge, a pro-inflammatory activity characterised by a slight over-expression of IL8L1, IL8L2, IL-17A and IL-1β from D22 to D28 and by IFN-γ from D22 to D35 appeared to be observed in the vaccinated group, but this relative over-expression was not significant p > 0.05) (Figure 4).

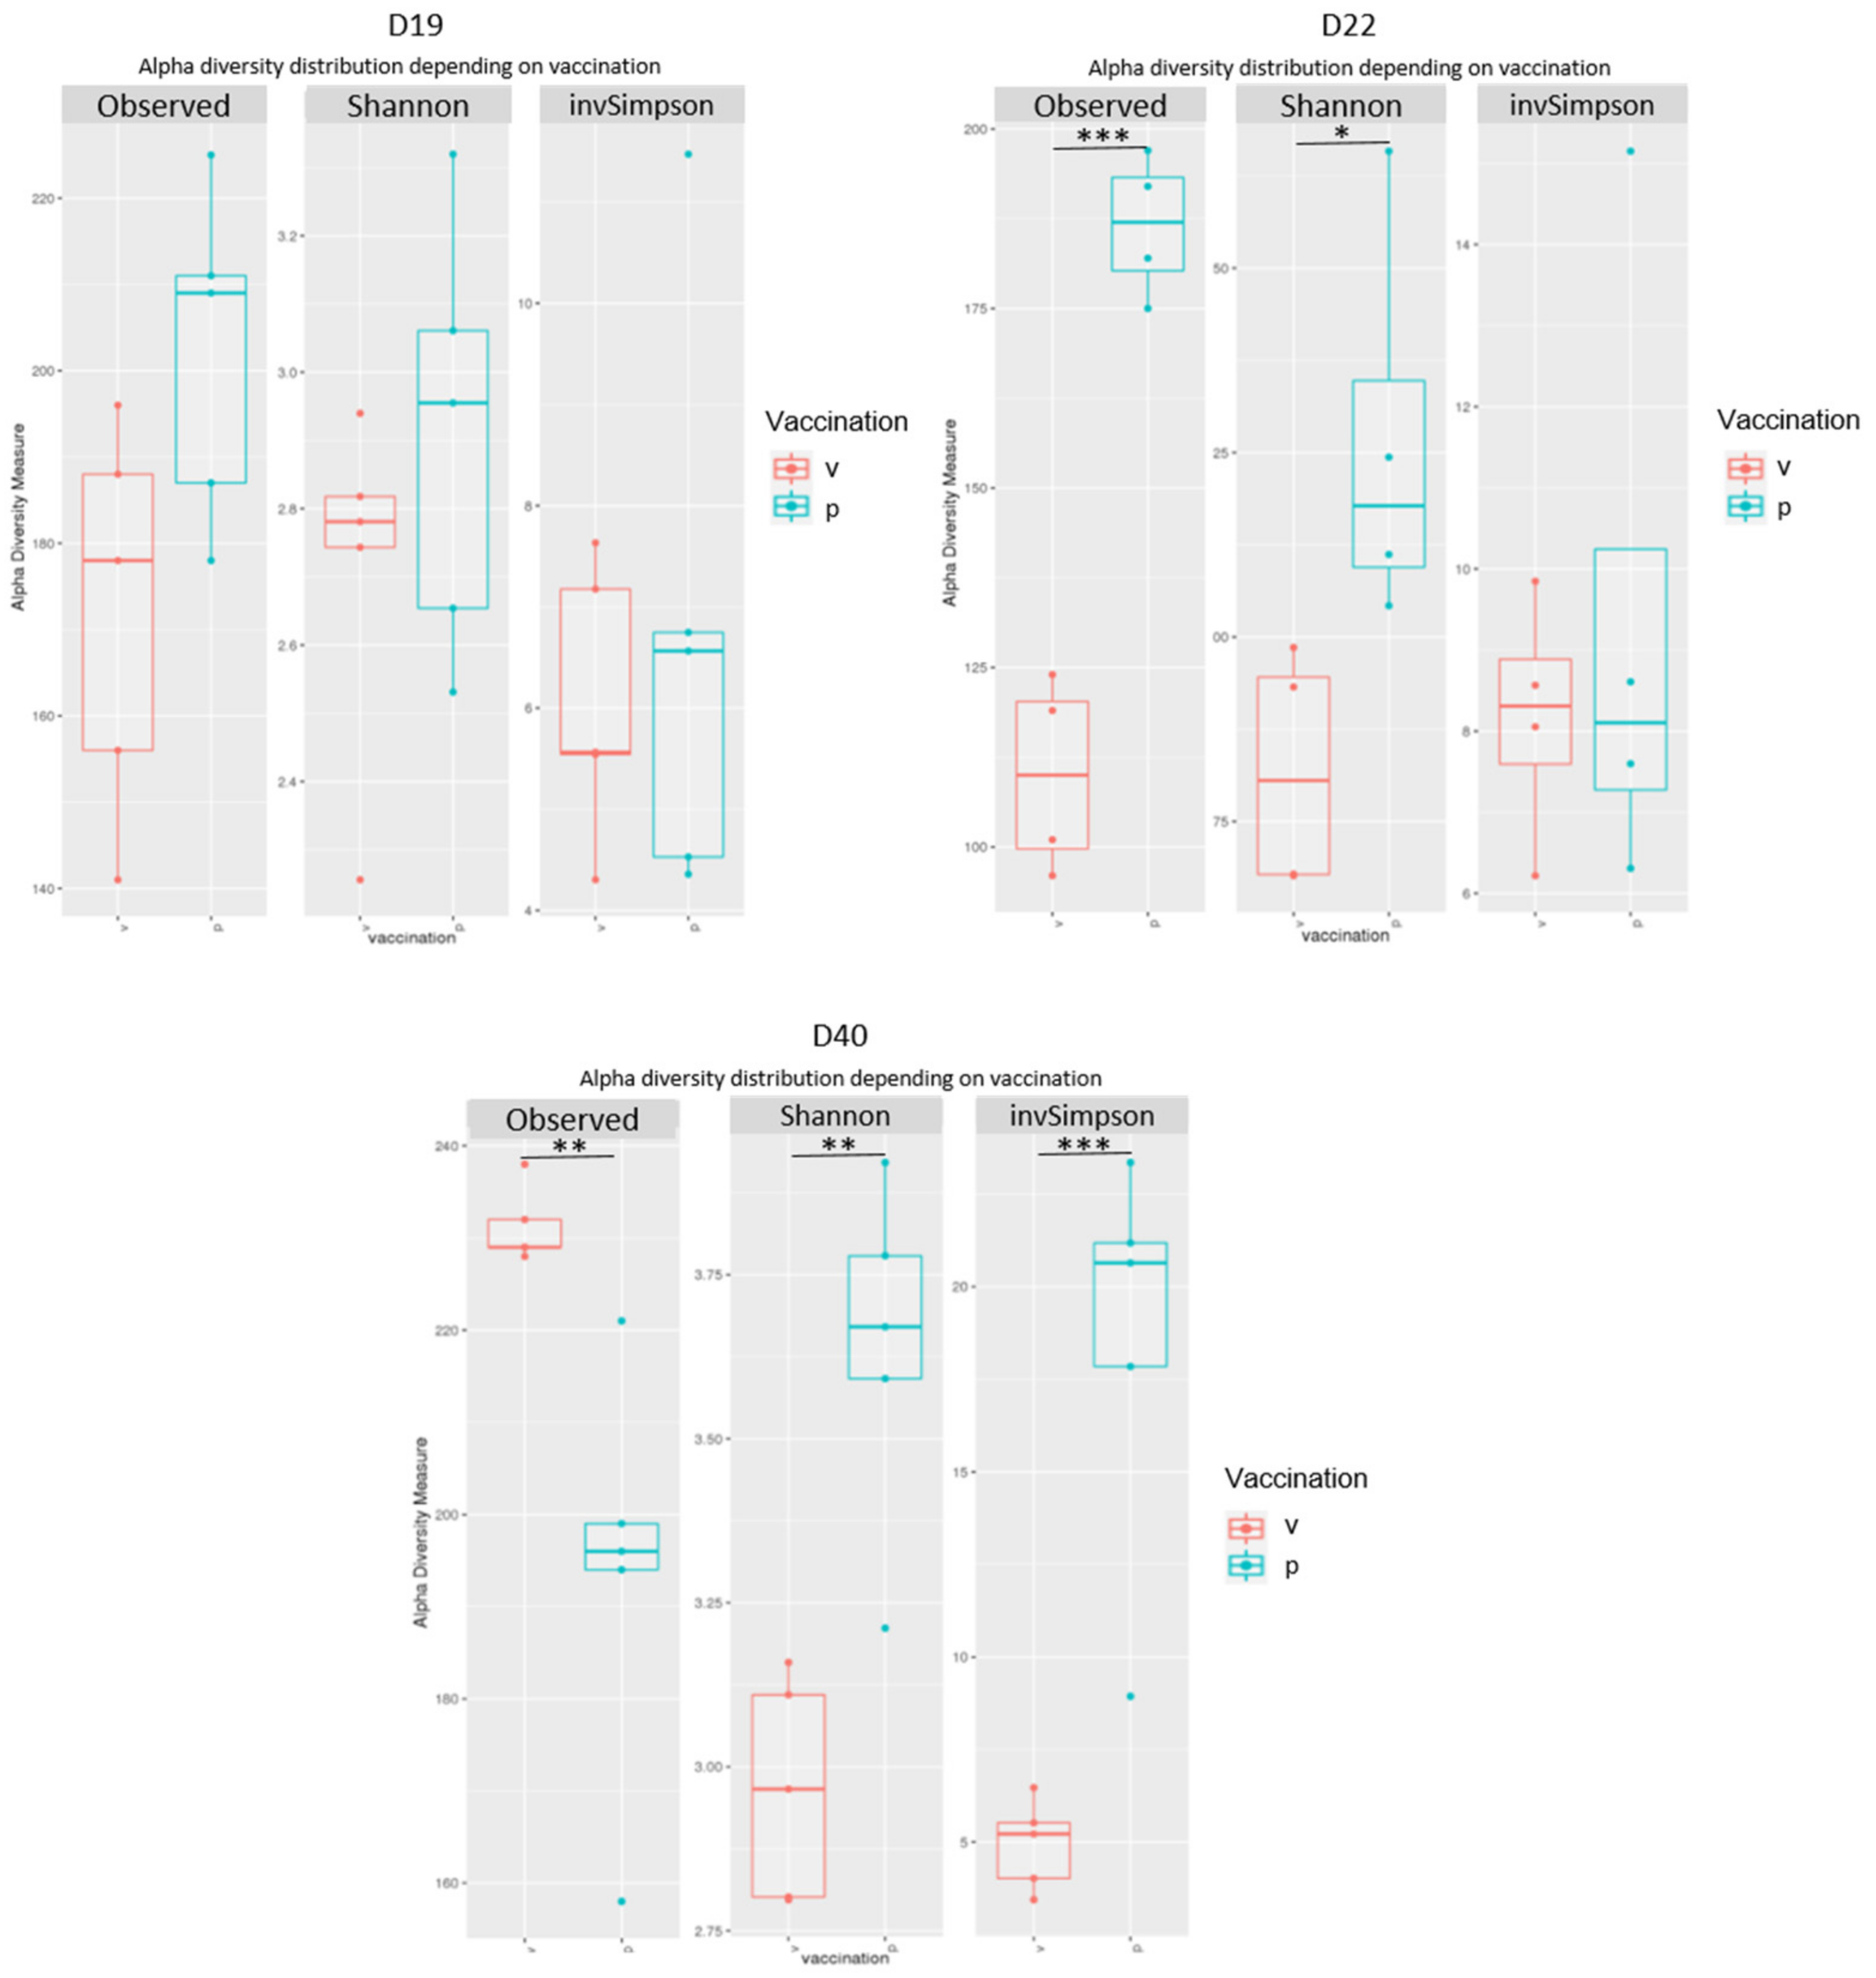
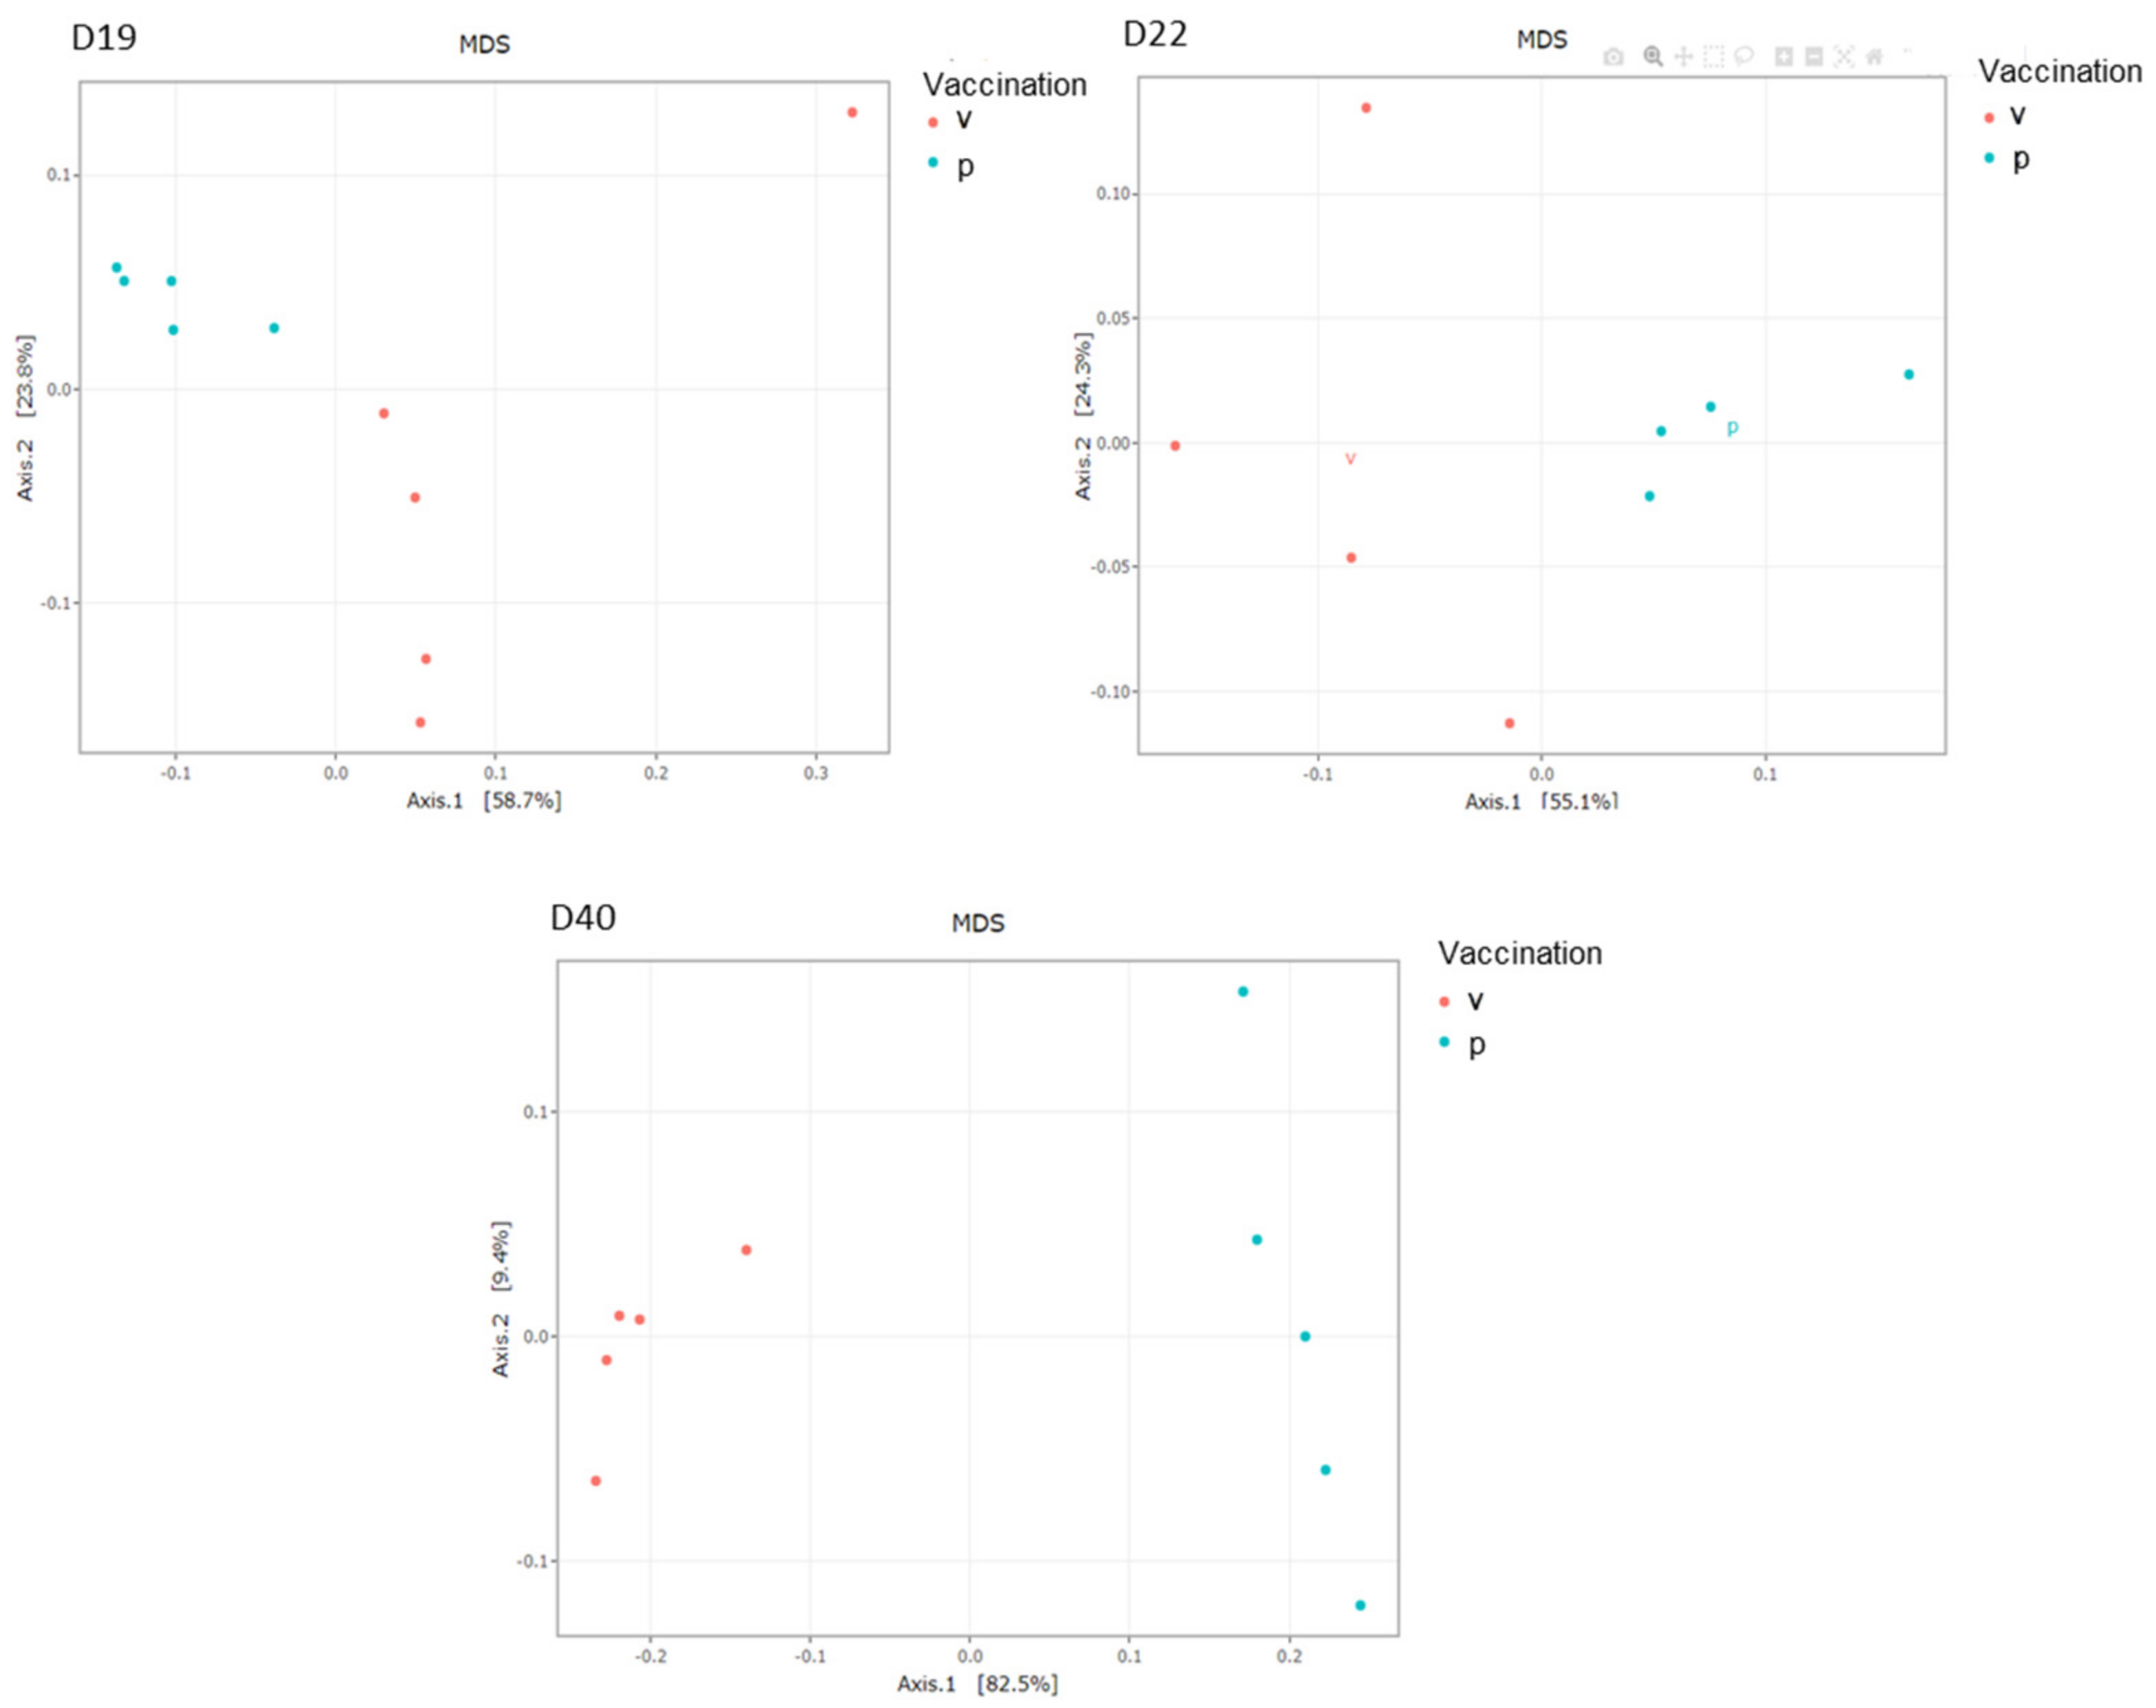
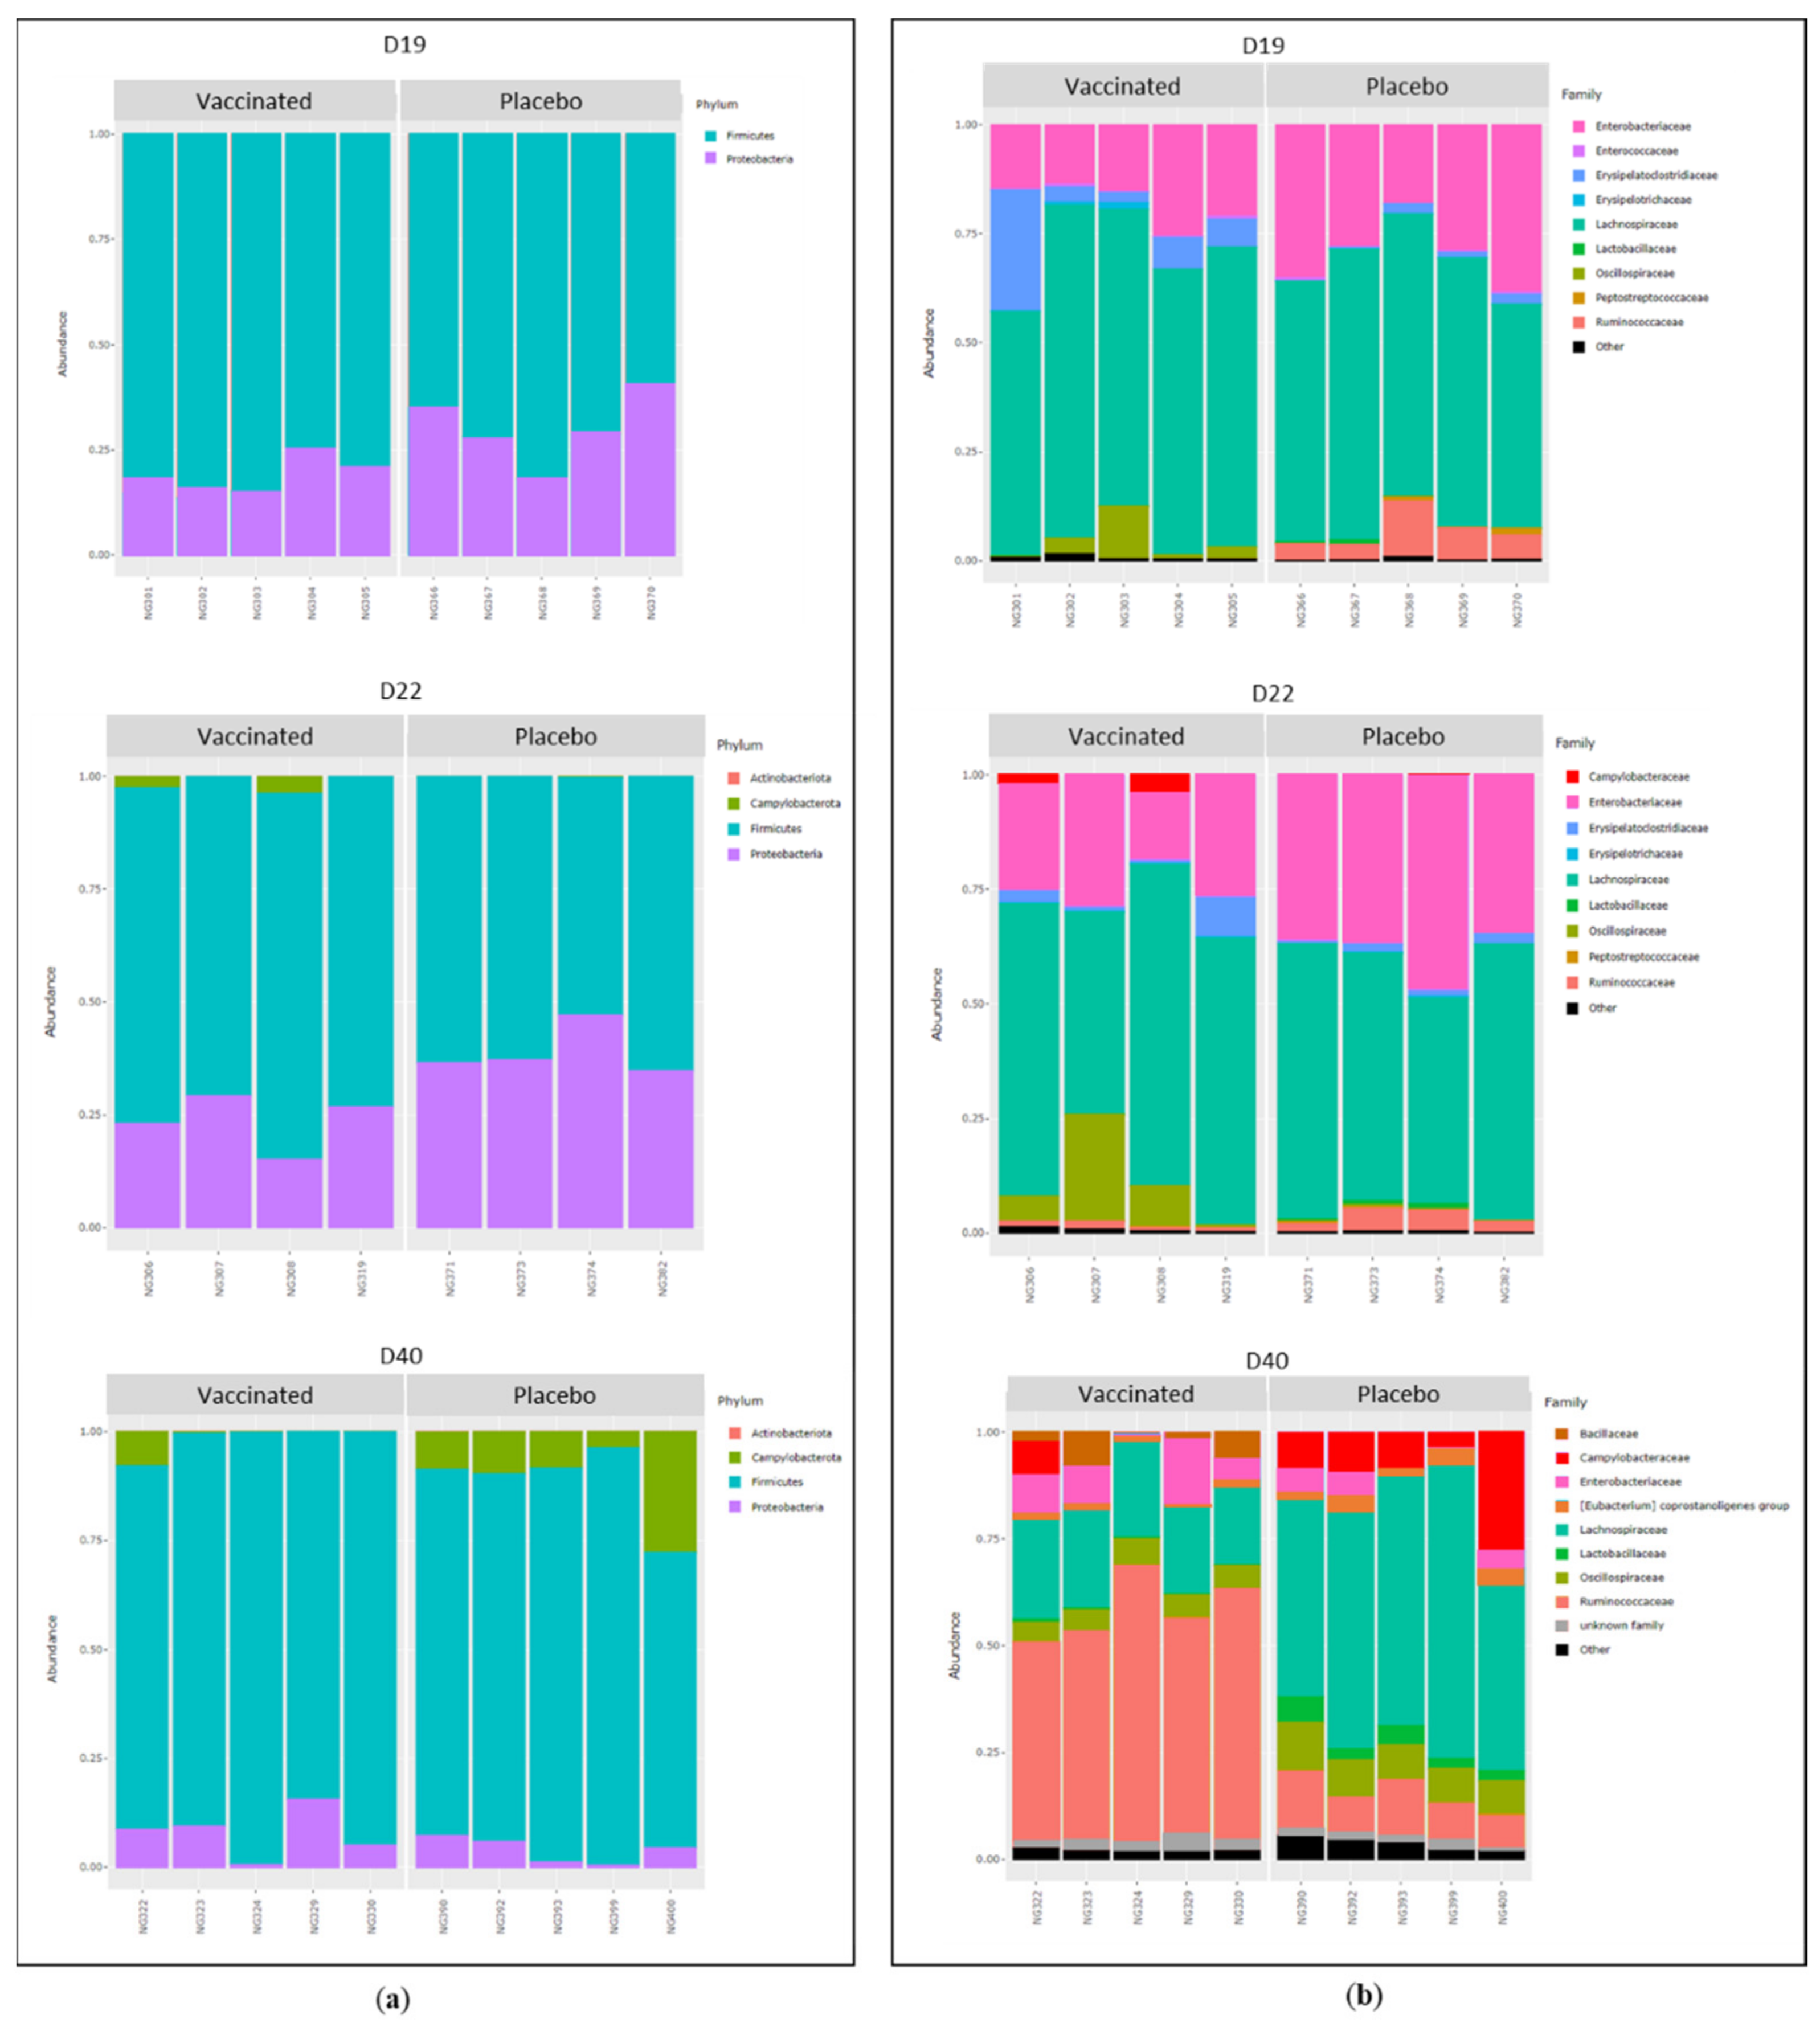
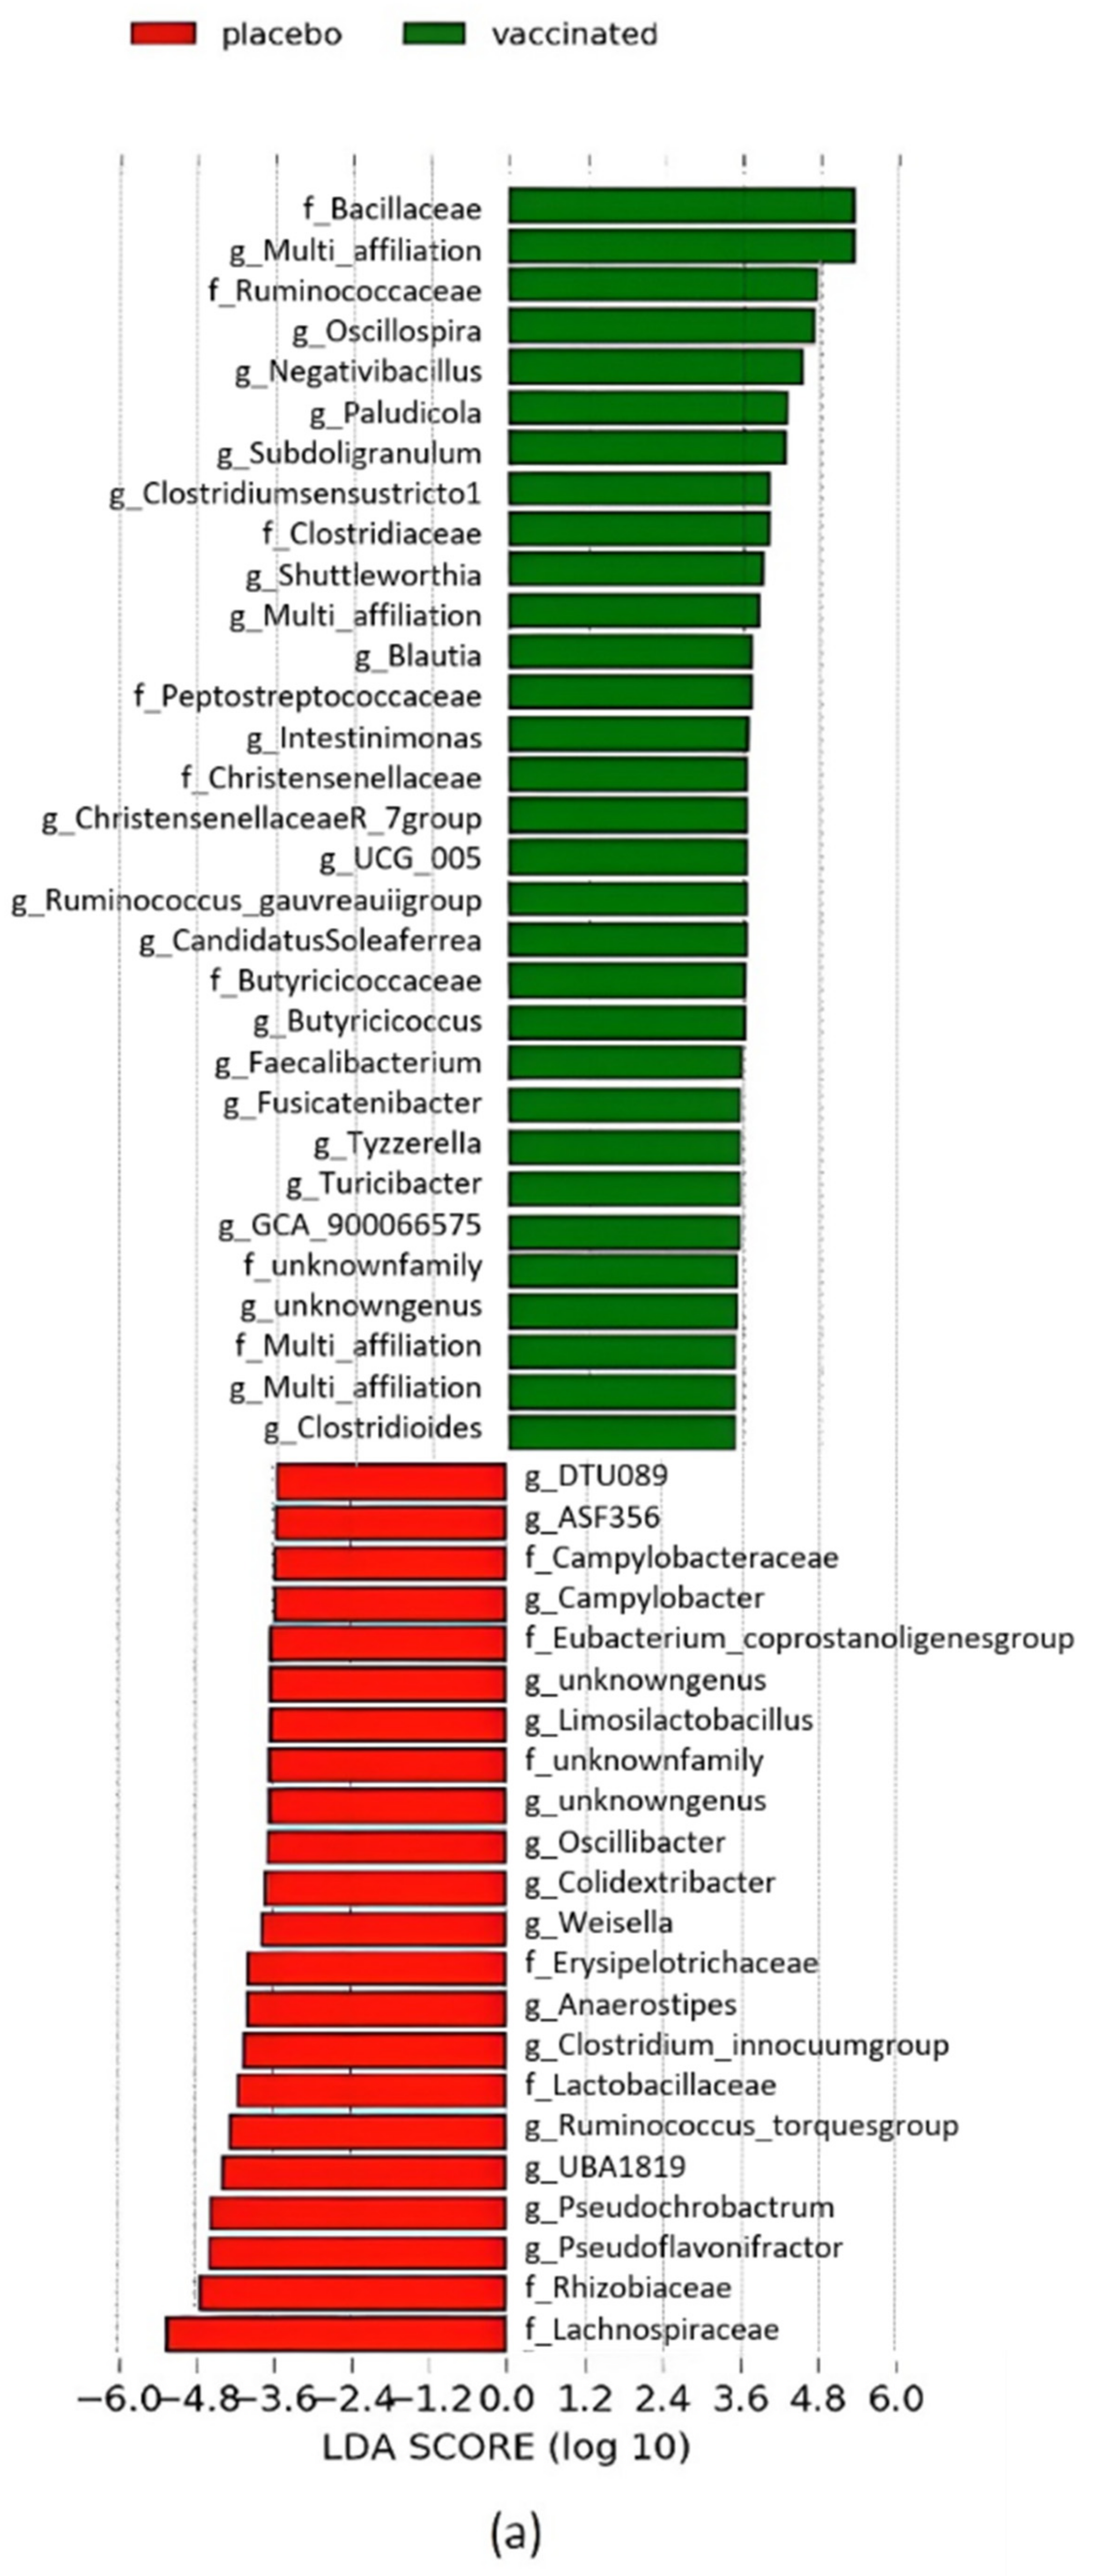
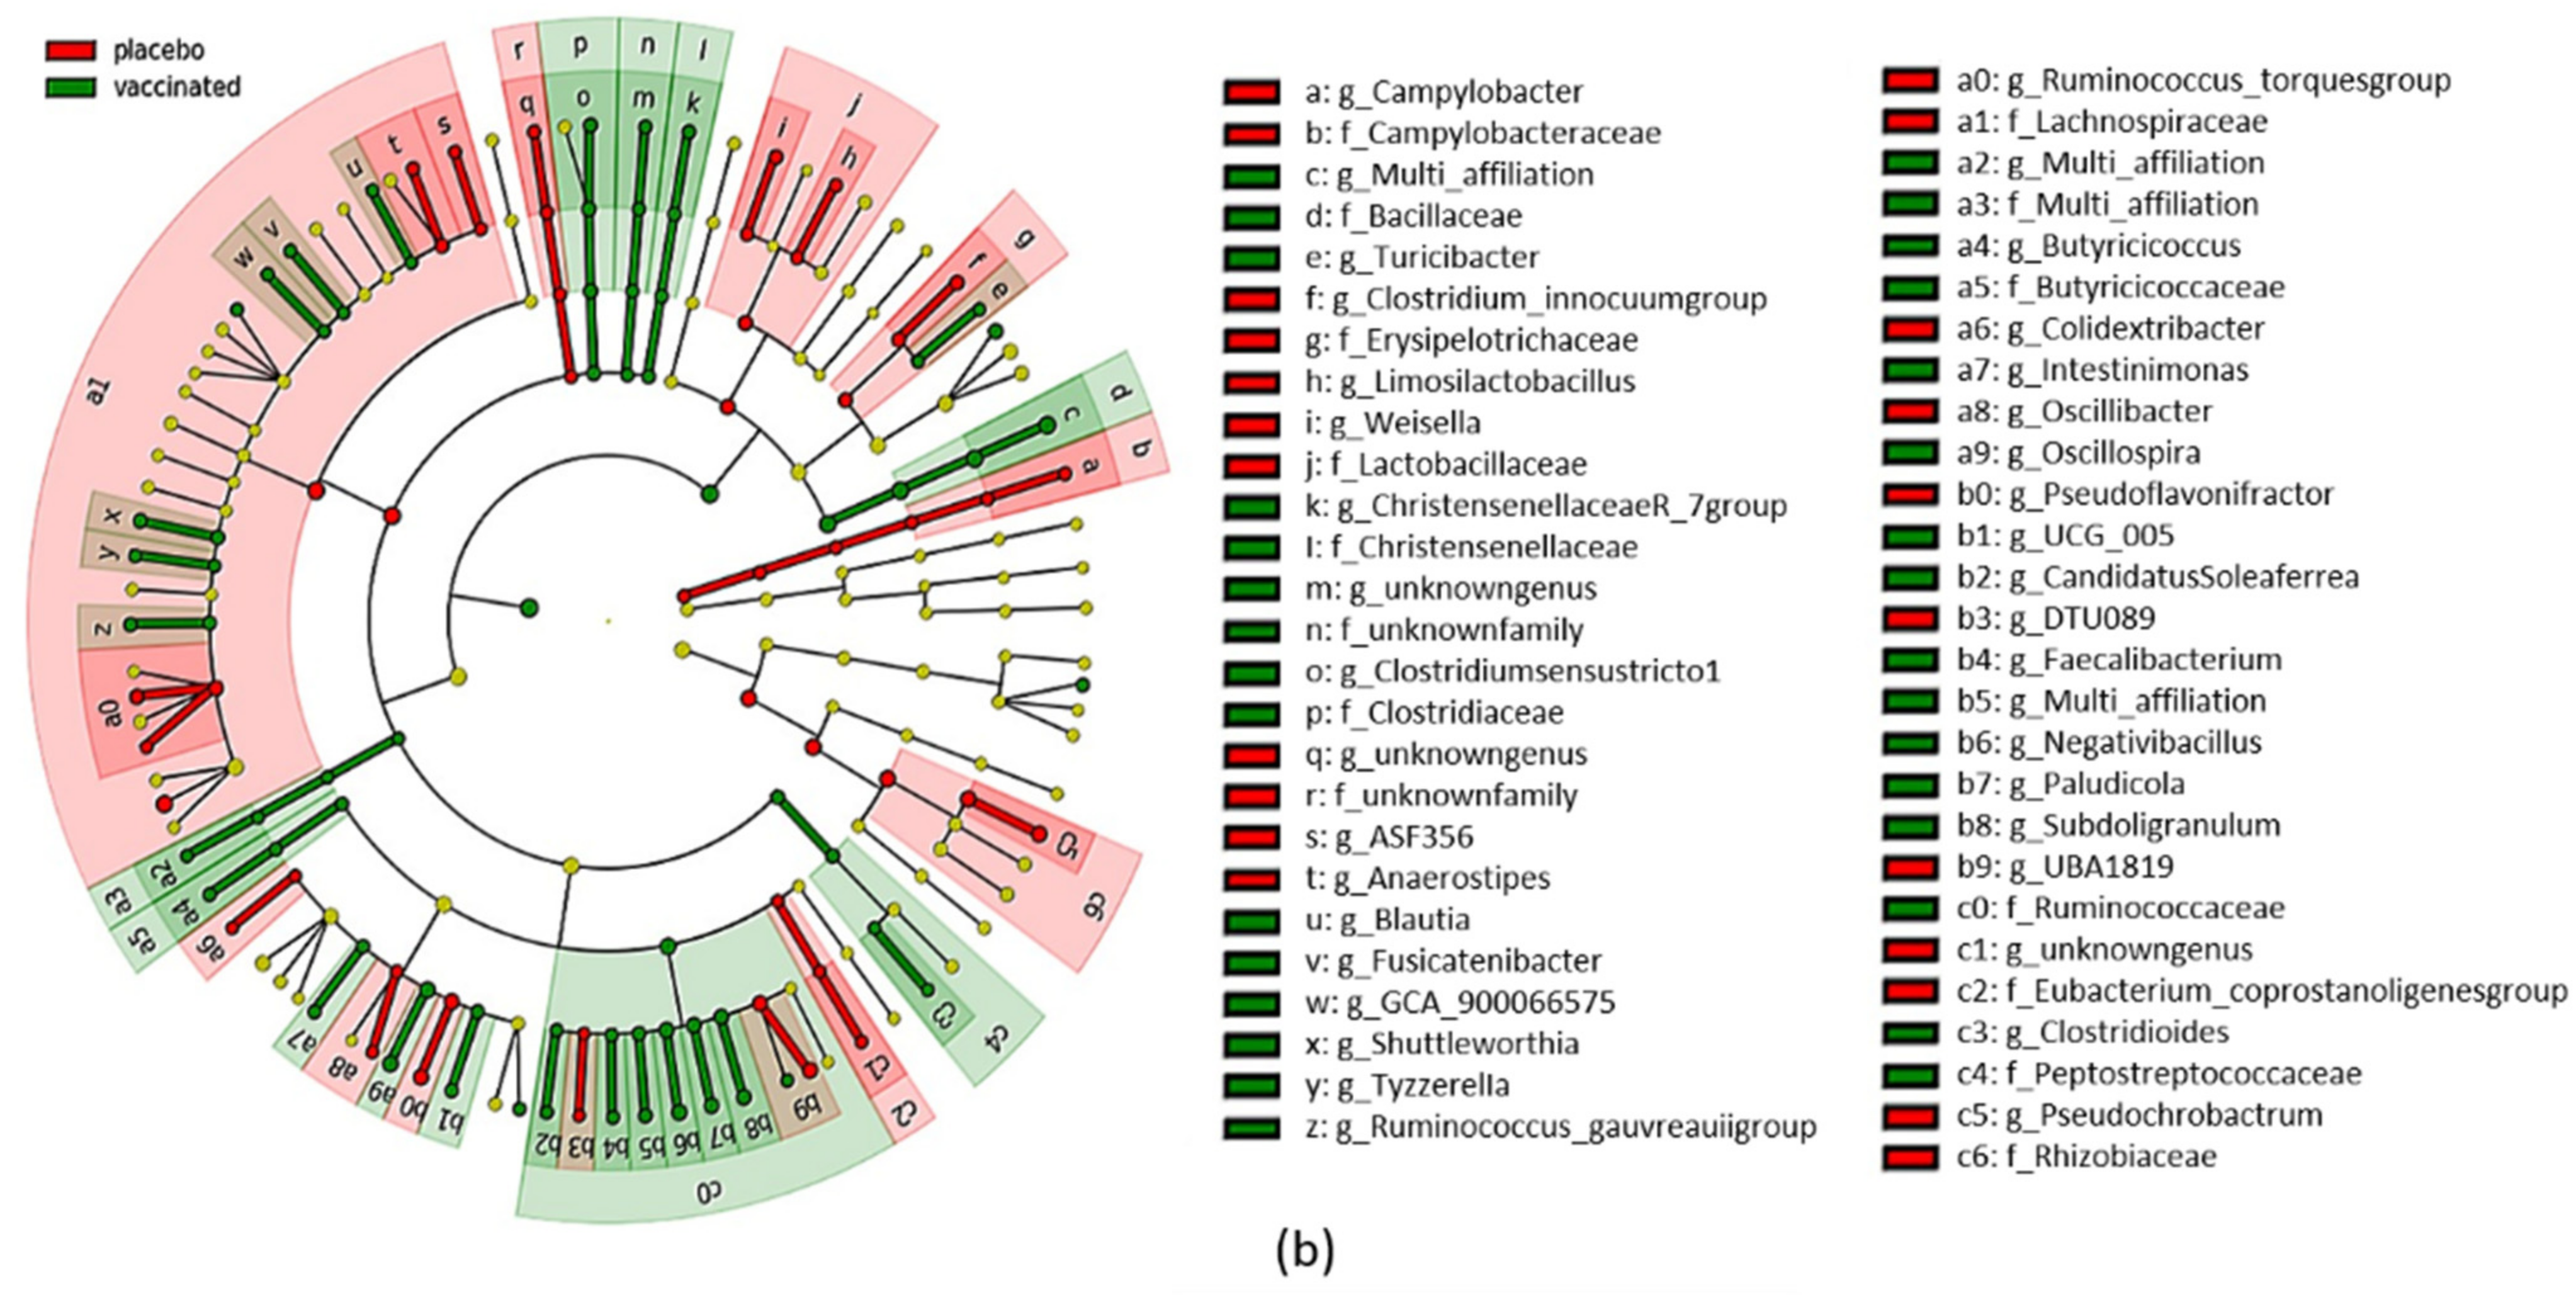
3.5. Caecal Microbiota Analyses

To assess the impact of vaccination on caecal microbiota, the caecal content of the chickens before the Campylobacter challenge on D19 (five chickens/group) and after colonisation on D22 (four chickens/group) and D40 (five randomly selected chickens/group) were analysed using 16S metabarcoding.
The number of sequences and OTUs obtained are indicated in Table 3.
Number of OTUs, inverse Simpson and Shannon indices were determined to analyse richness and alpha diversity within samples (Figure 5). No significant differences in richness and diversity (for either index) were observed between the vaccinated and placebo groups on D19 (p > 0.05) before the Campylobacter challenge. On day 22, the richness (number of observed OTUs) was significantly lower in the vaccinated group (p < 0.001) than in the placebo group, but a shift was observed on day 40 and richness was significantly higher in the vaccinated group (p < 0.01). On D40 lower Shannon and inverse Simpson indices were observed in the vaccinated group (p < 0.01 and p < 0.001 respectively) reflecting a lower diversity. These results suggest that on D40 the vaccinated group contained more species (higher richness) but these species were less evenly distributed. Consequently, it appears that communities are dominated by fewer abundant taxa in the vaccinated group than in the placebo group. Table S1 shows the alpha diversity index values for each caecal sample.
A multi-dimensional scaling (MDS) of weighted UniFrac (wUniFrac) distances was performed to reveal differences in microbial population structures among samples depending on vaccination (Figure 6). A multivariate ANOVA (performed with Adonis) revealed a significant difference in microbial population structure between vaccinated and placebo groups regarding vaccination on D19 (p < 0.01), D22 (p < 0.05) and D40 (p < 0.01). The vaccination explained about 43%, 42% and 80% of the total variance on D19, D22 and D40 respectively. The samples were increasingly segregated over time according to their experimental group from D19 to D40 (Figure 6). Moreover, segregation of the samples using the wUniFrac distance suggests that the most abundant OTUs in the vaccinated group are phylogenetically distant from the OTUs in the placebo group.
The taxonomic composition of the chicken caecal microbiota is represented in Figure 7.
The results revealed only the presence of the Firmicutes phylum followed by Proteobacteria on D19. On D22 and D40, four phyla were identified: Firmicutes and Proteobacteria were predominant, followed by Campylobacterota then Actinobacteriota (Figure 7a). On D19 and D22, two bacterial families—Lachnospiraceae and Enterobacteriaceae—predominated in the samples. On D40, a higher number of bacterial families were present in the samples and a marked effect according to experimental group was observed (Figure 7b). Indeed, Ruminococcaceae predominated in the bacterial populations of the vaccinated group, whereas Lachnospiraceae predominated in the placebo group. Furthermore, the relative abundance of the Bacillaceae family was higher in the vaccinated group whereas the relative abundance of the Lactobacillaecae family was higher in the placebo group. Moreover, the relative abundance of Campylobacteraceae was higher in most of the placebo group birds.
In the light of these results, a LEfSe analysis was performed to identify OTUs with a statistically different relative abundance between the vaccinated and placebo groups on D40 (Figure 8). Figure 8 presents only bacterial families and genera with an LDA score over two. The vaccinated group contained in particular (p < 0.05) Bacillaceae, Ruminococcaceae, Clostridiaceae, Peptostreptococcaceae, Christensenellaceae and Butyricicoccaceae families whereas the placebo group contained in particular (p < 0.05) Campylobacteraceae, Eubacterium_coprostanoligenesgroup, Erysipelotrichaceae, Lactobacillaceae, Rhizobiaceae, Lachnospiraceae and Campylobacteriaceae families on D40. Some genera, including Oscillospira, Negativibacillus, Blautia and Faecalibacterium, were significantly (p < 0.05) more abundant in the vaccinated group whereas others, including Pseudoflavonifractor, Ruminococcus_torquesgroup, Colidextribacter and Oscillobacter, were significantly (p < 0.05) more abundant in the placebo group on D40. Table S2 shows the complete taxonomic composition of caecal microbiota in each sample, including the relative abundance of OTUs.

4. Discussion

Despite numerous studies on vaccination against Campylobacter, there is currently no available vaccine against Campylobacter on the market, and most vaccinal approaches are still under development. In fact, the antigens used in such studies have not been effective or have not yielded reproducible results. Moreover, the mechanisms of protection against Campylobacter following vaccination are not fully elucidated. In a previous study using a DNA prime/protein boost flagellin-based vaccine, Campylobacter spp. was no longer detected (detection limit of the method: 2 log10 CFU/g) in 40-day-old SPF White Leghorn chickens challenged with Campylobacter. However, this first study did not include an in-depth analysis of the immune mechanism of caecal microbiota accompanying the protection observed [10]. The objective of the present work was to better characterise the immune responses and the microbiota following this flagellin-based vaccination in order to identify factors that could be taken into consideration to improve future vaccines against Campylobacter in chickens.
In this present work, and contrary to the previous study, only a partial mean reduction (1.3 log10 CFU/g) of Campylobacter in the caecal contents of chickens was observed. This different result could be due to the bacterial strain used. In the previous trial, the C. jejuni 81–176 strain isolated from humans was used, whereas in this work the C. jejuni C97Anses640 strain isolated from poultry was used. The two strains could have a different ability to colonise the chicken caeca, as already suggested [39]. Consequently, the response to flagellin vaccination may be influenced by the strain of Campylobacter used, which could explain the difference in protection. Thus, the strength of the immune response against flagellin could have been sufficient to more effectively reduce colonisation by the C. jejuni 81–176 strain than the C. jejuni C97Anses640 strain.
Moreover, the flagellin used as antigen has already been studied and variable results are suggested [10]. Some studies reported no reduction in Campylobacter in broilers [40,41] whereas others reported up to 2 and 3 log10 reduction in Leghorn and broilers respectively [42,43]; therefore the reduction of 1.3 log10 observed in our study is in agreement with other studies.
In this work, an ELISA was developed to measure the levels of systemic anti-flagellin IgY and mucosal anti-flagellin IgA antibodies. A higher production of systemic anti-flagellin IgY was observed in the vaccinated group than in the placebo group from D19 to D40, as was also previously observed [10] using an ELISA targeting total Campylobacter soluble protein (including flagellin). Here too, no correlation could be established between the IgY levels and the level of protection against Campylobacter. These observations are in agreement with those of other studies [44].
The production of specific mucosal anti-flagellin IgA antibodies was analysed on several days from D19 to D40, an approach not applied in the previous study (when these antibodies were only examined at slaughter on D42). Higher levels of IgA were observed from D22 to D40 in the vaccinated group than in the placebo one, whereas the opposite was found when measured on D42 in the previous study [10]. Several hypotheses could explain these reverse results: (1) due to the low level of Campylobacter in the caeca in the previous study, the mucosal immune response may not have been stimulated in the vaccinated group (2) or IgA could have been produced and consumed to fight Campylobacter [10]. Moreover, IgA have a short half-life [45], so they could not have been detected at the time of the day 42 analysis, when no Campylobacter were detected. Even though it has not been formally demonstrated, anti-Campylobacter IgA may be involved to a certain extent in the protection against Camplylobacter. However, as already suggested in the previous study [10], no correlation between the IgA levels and the level of protection against Campylobacter could be established. Thus, as already suggested, the protection observed may not be strictly antibody-mediated [44]. These results showed that vaccination primed the immune response but discrimination between the responses due to the vaccination alone or both vaccination and Campylobacter colonisation is not possible.
In response to Campylobacter colonisation, the relative expression of several chemokines, cytokines and AMPs reflecting the activation of different innate and specific immune pathways have been demonstrated. Antimicrobial peptides such as AvBD10 and AvBD12 involved in the innate immune pathways, were upregulated in the presence of Campylobacter [20,46]. Furthermore, activation of the Th1 pathway with the pro-inflammatory IFN-γ [16,47] and Th2 pathway with IL-4 [16] were upregulated in response to Campylobacter. Activation of the Th17 pathway against Campylobacter was also demonstrated with an upregulation of pro-inflammatory targets such as IL-1β, IL-17A, IL8L1 and IL8L2 that could play a role in protecting against Campylobacter [16,19,48]. Moreover, the anti-inflammatory IL-10 involved in the Treg pathway was upregulated in response to Campylobacter according to several studies, no doubt to decrease inflammatory damage [16,47].
To the best of our knowledge, the panel of targets used in the present study had not previously been evaluated in response to vaccination against Campylobacter. An increase in IL-10 relative expression was detected on D28 in the vaccinated group, compared with the placebo one. This cytokine is produced by regulatory T (Treg) cells, known to have an anti-inflammatory role to minimise tissue damage. IL-10-mediated B cell regulatory activity leads to a reduction in T cell functions [49]. However, no significant relative over-expression was measured for any of the other eight targets corresponding to cytokines and chemokines representing cellular immune responses and antimicrobial peptides. This suggests that such responses may not be stimulated by this vaccination, which resulted in only partial protection.
An over-expression of AvBD10 in the placebo group compared with the vaccinated group was shown on day 40. The upregulation of β-defensins has previously been described in response to Campylobacter colonisation, denoting the importance of the role of β-defensins as part of the local intestinal host response [20,46]. An upregulation of AvBD10, characterising an innate immune response, could be an attempt by the host to prevent or limit the bacteria’s colonisation. Future research should investigate cells producing cytokines and chemokines to bring new insights on their role in response to Campylobacter vaccination.
This study clearly demonstrated modifications to the composition and structure of chicken caecal microbiota due to the vaccination from D19, i.e., before the Campylobacter challenge, and more specifically, through to the end of the trial on D40 in the group receiving the flagellin-based vaccination, as the vaccination explained 80% of the total variance. Another study investigating the effects of a flagellin-like protein without a Campylobacter challenge also reported a modulated caecal microbiota among SPF Leghorn chickens in response to the protein [50]. A modulation of the caecal microbiota was also observed in response to oral vaccination against Campylobacter in commercial broilers [26]. On the contrary, another study showed that immunising SPF White Leghorn chickens with an enterobactin conjugate vaccine induced a strong level of systemic IgY and a significant reduction in C. jejuni colonisation of 3–4 log10 CFU/g of caecal content, but no significant difference was observed in the caecal microbiota [11].
In this work, the vaccinated group demonstrated a slight but significant reduction in Campylobacter counts in the caeca; this reduction was confirmed by an analysis of the microbiota, as the genus Campylobacter was differentially associated with the placebo group. A higher abundance of Firmicutes, Ruminococcaceae, Clostridiales, Blautia and Faecalibacterium was also observed in the vaccinated group. Previous works have tried to identify taxa that could be associated with the presence of Campylobacter in poultry, but the results are conflicting. For example, one study suggested that Faecalibacterium interacted with Campylobacter [25,26], but this result was not confirmed in another study [51]. Moreover, an increase in Blautia and Clostridiales was associated with Campylobacter [19] while another study reported a decrease in Blautia but an increase in Clostridiales [26]. In the light of such results, it is not possible to conclude whether the modifications observed in the vaccinated group may be associated with the reduction in Campylobacter. This work suggests that vaccination could impact microbiota, but chickens SPF have a limited resident gut microbiota unlike conventional chickens. For example, Bacteroidetes phylum is one of the major phyla in conventional chicken but was not identified in SPF chickens in this work. Effect of vaccination on broiler caecal microbiota could be further studied.
The microbiota and the immune system co-evolve in the chicken gut, and their balanced relationship is based on crosstalk throughout the chicken’s life [52]. Interactions between the immune system and the gut microbiota of chickens challenged with C. jejuni are starting to be described in the literature [17,19]. The present work demonstrated that IgY and IgA antibodies were produced, and the microbiota modified in response to vaccination, but only a slight reduction in Campylobacter was observed. Indeed, it was not possible to conclude whether these parameters could act individually or interact together to reduce Campylobacter colonisation or if they are not involved. Further studies are needed to better understand the role of these parameters on Campylobacter colonisation. However, it is important to mention that other issues need to be overcome in order to develop effective vaccines against Campylobacter. These include the short life span of broilers and consequently the young and immunologically naïve host chicken [18]. Moreover, Campylobacter is considered as non-pathogenic in the intestinal tract of poultry hosts [28]. Thus, chickens first react as if colonisation by C. jejuni is an attack until they reach a certain level of tolerance [53].

5. Conclusions

This study demonstrated that vaccination resulted in a slight reduction in the caecal Campylobacter load in chickens. This flagellin-based vaccine strongly stimulated the systemic and mucosal humoral pathway and affected the structure and composition of the caecal microbiota, but the link between these modifications and the Campylobacter reduction remains to be elucidated. These new data demonstrate that both immune responses and microbiota composition need to be explored in order to clarify their role against Campylobacter in poultry and thus improve future vaccination protocols.

Supplementary Materials

The following supporting information can be downloaded from https://www.mdpi.com/article/10.3390/vaccines10060981/s1, Table S1: Alpha diversity index values for all the chicken caecal samples; Table S2: Table showing relative abundance of OTUs and their taxonomic affiliation in chicken caecal samples on day 40.

Author Contributions

Conceptualization, N.G., D.D., M.C. and M.G.-N.; methodology, N.G., D.D., M.C. and M.G.-N.; validation, N.G., D.D. and M.G.-N.; formal analysis, N.G. and M.G.-N.; investigation, N.G., D.D., S.Q., V.B., T.P., A.K. and M.G.-N.; resources, D.D., A.K., M.C. and M.G.-N.; data curation, N.G. and M.G.-N.; writing—original draft preparation, N.G.; writing—review and editing, N.G., D.D. and M.G.-N.; visualization, N.G.; supervision, D.D. and M.G.-N.; project administration, D.D. and M.G.-N.; funding acquisition, D.D. and M.G.-N. All authors have read and agreed to the published version of the manuscript.

Funding

N.G. was the recipient of a thesis salary paid by ANSES, Saint Brieuc Armor Agglomération and Conseil Départemental 22. The experiments were self-funded by ANSES.

Institutional Review Board Statement

All experimental procedures were performed in accordance with the French national guidelines on the care and use of animals for research purposes, approved by the “ComEth ANSES/ENVA/UPEC” ethics committee and authorised by the French Ministry of Higher Education, Research and Innovation (referenced as APAFIS#24442-2020022816285714 v2).

Data Availability Statement

Not applicable.

Acknowledgments

The authors would like to thank SEPPIC for kindly supplying MontanideTM ISA71VG. We are also grateful to the Genomer platform, an EMBRC France partner core facility, for its technical support.

Conflicts of Interest

The authors declare no conflict of interest. The funders had no role in the design of the study; in the collection, analysis, or interpretation of data; in the writing of the manuscript, or in the decision to publish the results.

References

  1. EFSA and ECDC. The European Union One Health 2019 Zoonoses Report. EFSA J. 2021, 19, e06406. [Google Scholar] [CrossRef]
  2. Wassenaar, T.M.; Blaser, M.J. Pathophysiology of Campylobacter Jejuni Infections of Humans. Microbes Infect. 1999, 1, 1023–1033. [Google Scholar] [CrossRef]
  3. Nyati, K.K.; Nyati, R. Role of Campylobacter Jejuni Infection in the Pathogenesis of Guillain-Barré Syndrome: An Update. BioMed Res. Int. 2013, 2013, 852195. [Google Scholar] [CrossRef] [PubMed] [Green Version]
  4. Hansson, I.; Pudas, N.; Harbom, B.; Engvall, E.O. Within-Flock Variations of Campylobacter Loads in Caeca and on Carcasses from Broilers. Int. J. Food Microbiol. 2010, 141, 51–55. [Google Scholar] [CrossRef] [PubMed]
  5. Hue, O.; Allain, V.; Laisney, M.-J.; Le Bouquin, S.; Lalande, F.; Petetin, I.; Rouxel, S.; Quesne, S.; Gloaguen, P.-Y.; Picherot, M.; et al. Campylobacter Contamination of Broiler Caeca and Carcasses at the Slaughterhouse and Correlation with Salmonella Contamination. Food Microbiol. 2011, 28, 862–868. [Google Scholar] [CrossRef]
  6. EFSA Update and Review of Control Options for Campylobacter in Broilers at Primary Production. EFSA J. 2020, 18, e06090. [CrossRef]
  7. The European Commission. Commission Regulation (EU) 2017/1495 of 23 August 2017 Amending Regulation (EC) No 2073/2005 as Regards Campylobacter in Broiler Carcases. Off. J. Eur. Union 2017, L218, 1–6. Available online: https://eur-lex.europa.eu/legal-content/EN/TXT/?uri=CELEX:32017R1495 (accessed on 2 May 2022).
  8. Nothaft, H.; Davis, B.; Lock, Y.Y.; Perez-Munoz, M.E.; Vinogradov, E.; Walter, J.; Coros, C.; Szymanski, C.M. Engineering the Campylobacter Jejuni N-Glycan to Create an Effective Chicken Vaccine. Sci. Rep. 2016, 6, 26511. [Google Scholar] [CrossRef] [Green Version]
  9. Meunier, M.; Guyard-Nicodème, M.; Vigouroux, E.; Poezevara, T.; Beven, V.; Quesne, S.; Bigault, L.; Amelot, M.; Dory, D.; Chemaly, M. Promising New Vaccine Candidates against Campylobacter in Broilers. PLoS ONE 2017, 12, e0188472. [Google Scholar] [CrossRef] [Green Version]
  10. Meunier, M.; Guyard-Nicodème, M.; Vigouroux, E.; Poezevara, T.; Béven, V.; Quesne, S.; Amelot, M.; Parra, A.; Chemaly, M.; Dory, D. A DNA Prime/Protein Boost Vaccine Protocol Developed against Campylobacter Jejuni for Poultry. Vaccine 2018, 36, 2119–2125. [Google Scholar] [CrossRef]
  11. Cui, Y.; Guo, F.; Guo, J.; Cao, X.; Wang, H.; Yang, B.; Zhou, H.; Su, X.; Zeng, X.; Lin, J.; et al. Immunization of Chickens with the Enterobactin Conjugate Vaccine Reduced Campylobacter Jejuni Colonization in the Intestine. Vaccines 2020, 8, 747. [Google Scholar] [CrossRef]
  12. Vohra, P.; Chintoan-Uta, C.; Terra, V.S.; Bremner, A.; Cuccui, J.; Wren, B.W.; Vervelde, L.; Stevens, M.P. Evaluation of Glycosylated FlpA and SodB as Subunit Vaccines Against Campylobacter Jejuni Colonisation in Chickens. Vaccines 2020, 8, 520. [Google Scholar] [CrossRef]
  13. Sahin, O.; Luo, N.; Huang, S.; Zhang, Q. Effect of Campylobacter-Specific Maternal Antibodies on Campylobacter Jejuni Colonization in Young Chickens. Appl. Environ. Microbiol. 2003, 69, 5372–5379. [Google Scholar] [CrossRef] [Green Version]
  14. Shoaf-Sweeney, K.D.; Larson, C.L.; Tang, X.; Konkel, M.E. Identification of Campylobacter Jejuni Proteins Recognized by Maternal Antibodies of Chickens. Appl. Environ. Microbiol. 2008, 74, 6867–6875. [Google Scholar] [CrossRef] [Green Version]
  15. De Zoete, M.R.; Keestra, A.M.; Roszczenko, P.; van Putten, J.P.M. Activation of Human and Chicken Toll-Like Receptors by Campylobacter spp. Infect. Immun. 2010, 78, 1229–1238. [Google Scholar] [CrossRef] [Green Version]
  16. Reid, W.D.K.; Close, A.J.; Humphrey, S.; Chaloner, G.; Lacharme-Lora, L.; Rothwell, L.; Kaiser, P.; Williams, N.J.; Humphrey, T.J.; Wigley, P.; et al. Cytokine Responses in Birds Challenged with the Human Food-Borne Pathogen Campylobacter Jejuni Implies a Th17 Response. R. Soc. Open Sci. 2016, 3, 150541. [Google Scholar] [CrossRef] [Green Version]
  17. Han, Z.; Willer, T.; Li, L.; Pielsticker, C.; Rychlik, I.; Velge, P.; Kaspers, B.; Rautenschlein, S. Influence of the Gut Microbiota Composition on Campylobacter Jejuni Colonization in Chickens. Infect. Immun. 2017, 85, e00380-17. [Google Scholar] [CrossRef] [Green Version]
  18. Lacharme-Lora, L.; Chaloner, G.; Gilroy, R.; Humphrey, S.; Gibbs, K.; Jopson, S.; Wright, E.; Reid, W.; Ketley, J.; Humphrey, T.; et al. B Lymphocytes Play a Limited Role in Clearance of Campylobacter Jejuni from the Chicken Intestinal Tract. Sci. Rep. 2017, 7, 45090. [Google Scholar] [CrossRef]
  19. Connerton, P.L.; Richards, P.J.; Lafontaine, G.M.; O’Kane, P.M.; Ghaffar, N.; Cummings, N.J.; Smith, D.L.; Fish, N.M.; Connerton, I.F. The Effect of the Timing of Exposure to Campylobacter Jejuni on the Gut Microbiome and Inflammatory Responses of Broiler Chickens. Microbiome 2018, 6, 88. [Google Scholar] [CrossRef]
  20. Garcia, J.S.; Byrd, J.A.; Wong, E.A. Expression of Nutrient Transporters and Host Defense Peptides in Campylobacter Challenged Broilers. Poult. Sci. 2018, 97, 3671–3680. [Google Scholar] [CrossRef]
  21. Skånseng, B.; Kaldhusdal, M.; Rudi, K. Comparison of Chicken Gut Colonisation by the Pathogens Campylobacter Jejuni and Clostridium Perfringens by Real-Time Quantitative PCR. Mol. Cell. Probes 2006, 20, 269–279. [Google Scholar] [CrossRef]
  22. Sergeant, M.J.; Constantinidou, C.; Cogan, T.A.; Bedford, M.R.; Penn, C.W.; Pallen, M.J. Extensive Microbial and Functional Diversity within the Chicken Cecal Microbiome. PLoS ONE 2014, 9, e91941. [Google Scholar] [CrossRef]
  23. Wei, S.; Morrison, M.; Yu, Z. Bacterial Census of Poultry Intestinal Microbiome. Poult. Sci. 2013, 92, 671–683. [Google Scholar] [CrossRef]
  24. Qu, A.; Brulc, J.M.; Wilson, M.K.; Law, B.F.; Theoret, J.R.; Joens, L.A.; Konkel, M.E.; Angly, F.; Dinsdale, E.A.; Edwards, R.A.; et al. Comparative Metagenomics Reveals Host Specific Metavirulomes and Horizontal Gene Transfer Elements in the Chicken Cecum Microbiome. PLoS ONE 2008, 3, e2945. [Google Scholar] [CrossRef] [Green Version]
  25. Thibodeau, A.; Fravalo, P.; Yergeau, É.; Arsenault, J.; Lahaye, L.; Letellier, A. Chicken Caecal Microbiome Modifications Induced by Campylobacter Jejuni Colonization and by a Non-Antibiotic Feed Additive. PLoS ONE 2015, 10, e0131978. [Google Scholar] [CrossRef] [Green Version]
  26. Taha-Abdelaziz, K.; Yitbarek, A.; Alkie, T.N.; Hodgins, D.C.; Read, L.R.; Weese, J.S.; Sharif, S. PLGA-Encapsulated CpG ODN and Campylobacter Jejuni Lysate Modulate Cecal Microbiota Composition in Broiler Chickens Experimentally Challenged with C. Jejuni. Sci. Rep. 2018, 8, 12076. [Google Scholar] [CrossRef] [Green Version]
  27. Awad, W.A.; Mann, E.; Dzieciol, M.; Hess, C.; Schmitz-Esser, S.; Wagner, M.; Hess, M. Age-Related Differences in the Luminal and Mucosa-Associated Gut Microbiome of Broiler Chickens and Shifts Associated with Campylobacter Jejuni Infection. Front. Cell. Infect. Microbiol. 2016, 6, 154. [Google Scholar] [CrossRef] [Green Version]
  28. Smith, C.K.; AbuOun, M.; Cawthraw, S.A.; Humphrey, T.J.; Rothwell, L.; Kaiser, P.; Barrow, P.A.; Jones, M.A. Campylobacter Colonization of the Chicken Induces a Proinflammatory Response in Mucosal Tissues. FEMS Immunol. Med. Microbiol. 2008, 54, 114–121. [Google Scholar] [CrossRef] [PubMed] [Green Version]
  29. Thépault, A.; Roulleau, X.; Loiseau, P.; Cauquil, L.; Poezevara, T.; Hyronimus, B.; Quesne, S.; Souchaud, F.; Keita, A.; Chemaly, M.; et al. Effect of Litter Treatment on Campylobacter Jejuni in Broilers and on Cecal Microbiota. Pathogens 2020, 9, 333. [Google Scholar] [CrossRef] [PubMed]
  30. Livak, K.J.; Schmittgen, T.D. Analysis of Relative Gene Expression Data Using Real-Time Quantitative PCR and the 2−ΔΔCT Method. Methods 2001, 25, 402–408. [Google Scholar] [CrossRef] [PubMed]
  31. Heidari, M.; Wang, D.; Fitzgerald, S.D.; Sun, S. Severe Necrotic Dermatitis in the Combs of Line 63 Chickens Infected with Marek’s Disease Virus. Avian Pathol. 2016, 45, 582–592. [Google Scholar] [CrossRef] [Green Version]
  32. Nang, N.T.; Lee, J.S.; Song, B.M.; Kang, Y.M.; Kim, H.S.; Seo, S.H. Induction of Inflammatory Cytokines and Toll-like Receptors in Chickens Infected with Avian H9N2 Influenza Virus. Vet. Res. 2011, 42, 64. [Google Scholar] [CrossRef] [Green Version]
  33. Cox, C.M.; Sumners, L.H.; Kim, S.; McElroy, A.P.; Bedford, M.R.; Dalloul, R.A. Immune Responses to Dietary β-Glucan in Broiler Chicks during an Eimeria Challenge. Poult. Sci. 2010, 89, 2597–2607. [Google Scholar] [CrossRef]
  34. Rasoli, M.; Yeap, S.K.; Tan, S.W.; Roohani, K.; Kristeen-Teo, Y.W.; Alitheen, N.B.; Rahaman, Y.A.; Aini, I.; Bejo, M.H.; Kaiser, P.; et al. Differential Modulation of Immune Response and Cytokine Profiles in the Bursae and Spleen of Chickens Infected with Very Virulent Infectious Bursal Disease Virus. BMC Vet. Res. 2015, 11, 75. [Google Scholar] [CrossRef]
  35. Su, S.; Dwyer, D.M.; Miska, K.B.; Fetterer, R.H.; Jenkins, M.C.; Wong, E.A. Expression of Host Defense Peptides in the Intestine of Eimeria-Challenged Chickens. Poult. Sci. 2017, 96, 2421–2427. [Google Scholar] [CrossRef]
  36. Escudié, F.; Auer, L.; Bernard, M.; Mariadassou, M.; Cauquil, L.; Vidal, K.; Maman, S.; Hernandez-Raquet, G.; Combes, S.; Pascal, G. FROGS: Find, Rapidly, OTUs with Galaxy Solution. Bioinformatics 2018, 34, 1287–1294. [Google Scholar] [CrossRef]
  37. Lynn, D.J.; Higgs, R.; Lloyd, A.T.; O’Farrelly, C.; Hervé-Grépinet, V.; Nys, Y.; Brinkman, F.S.L.; Yu, P.-L.; Soulier, A.; Kaiser, P.; et al. Avian Beta-Defensin Nomenclature: A Community Proposed Update. Immunol. Lett. 2007, 110, 86–89. [Google Scholar] [CrossRef]
  38. Min, W.; Kim, W.H.; Lillehoj, E.P.; Lillehoj, H.S. Recent Progress in Host Immunity to Avian Coccidiosis: IL-17 Family Cytokines as Sentinels of the Intestinal Mucosa. Dev. Comp. Immunol. 2013, 41, 418–428. [Google Scholar] [CrossRef]
  39. Chaloner, G.; Wigley, P.; Humphrey, S.; Kemmett, K.; Lacharme-Lora, L.; Humphrey, T.; Williams, N. Dynamics of Dual Infection with Campylobacter Jejuni Strains in Chickens Reveals Distinct Strain-to-Strain Variation in Infection Ecology. Appl. Environ. Microbiol. 2014, 80, 6366–6372. [Google Scholar] [CrossRef] [Green Version]
  40. Widders, P.R.; Thomas, L.M.; Long, K.A.; Tokhi, M.A.; Panaccio, M.; Apos, E. The Specificity of Antibody in Chickens Immunised to Reduce Intestinal Colonisation with Campylobacter Jejuni. Vet. Microbiol. 1998, 64, 39–50. [Google Scholar] [CrossRef]
  41. Radomska, K.A.; Vaezirad, M.M.; Verstappen, K.M.; Wösten, M.M.S.M.; Wagenaar, J.A.; Putten, J.P.M. van Chicken Immune Response after In Ovo Immunization with Chimeric TLR5 Activating Flagellin of Campylobacter Jejuni. PLoS ONE 2016, 11, e0164837. [Google Scholar] [CrossRef] [Green Version]
  42. Huang, J.; Yin, Y.-X.; Pan, Z.; Zhang, G.; Zhu, A.; Liu, X.; Jiao, X. Intranasal Immunization with Chitosan/PCAGGS-FlaA Nanoparticles Inhibits Campylobacter Jejuni in a White Leghorn Model. J. Biomed. Biotechnol. 2010, 2010, 589476. [Google Scholar] [CrossRef] [Green Version]
  43. Neal-McKinney, J.M.; Samuelson, D.R.; Eucker, T.P.; Nissen, M.S.; Crespo, R.; Konkel, M.E. Reducing Campylobacter Jejuni Colonization of Poultry via Vaccination. PLoS ONE 2014, 9, e114254. [Google Scholar] [CrossRef] [Green Version]
  44. Chintoan-Uta, C.; Cassady-Cain, R.L.; Al-Haideri, H.; Watson, E.; Kelly, D.J.; Smith, D.G.E.; Sparks, N.H.C.; Kaiser, P.; Stevens, M.P. Superoxide Dismutase SodB Is a Protective Antigen against Campylobacter Jejuni Colonisation in Chickens. Vaccine 2015, 33, 6206–6211. [Google Scholar] [CrossRef] [Green Version]
  45. Davis, S.K.; Selva, K.J.; Kent, S.J.; Chung, A.W. Serum IgA Fc Effector Functions in Infectious Disease and Cancer. Immunol. Cell Biol. 2020, 98, 276–286. [Google Scholar] [CrossRef] [Green Version]
  46. Li, X.; Swaggerty, C.L.; Kogut, M.H.; Chiang, H.-I.; Wang, Y.; Genovese, K.J.; He, H.; Zhou, H. Gene Expression Profiling of the Local Cecal Response of Genetic Chicken Lines That Differ in Their Susceptibility to Campylobacter Jejuni Colonization. PLoS ONE 2010, 5, e11827. [Google Scholar] [CrossRef] [Green Version]
  47. Humphrey, S.; Chaloner, G.; Kemmett, K.; Davidson, N.; Williams, N.; Kipar, A.; Humphrey, T.; Wigley, P. Campylobacter Jejuni Is Not Merely a Commensal in Commercial Broiler Chickens and Affects Bird Welfare. mBio 2014, 5, e01364-14. [Google Scholar] [CrossRef] [Green Version]
  48. Šefcová, M.; Larrea-Álvarez, M.; Larrea-Álvarez, C.; Revajová, V.; Karaffová, V.; Koščová, J.; Nemcová, R.; Ortega-Paredes, D.; Vinueza-Burgos, C.; Levkut, M.; et al. Effects of Lactobacillus Fermentum Supplementation on Body Weight and Pro-Inflammatory Cytokine Expression in Campylobacter Jejuni-Challenged Chickens. Vet. Sci. 2020, 7, 121. [Google Scholar] [CrossRef] [PubMed]
  49. Cerqueira, C.; Manfroi, B.; Fillatreau, S. IL-10-Producing Regulatory B Cells and Plasmocytes: Molecular Mechanisms and Disease Relevance. Semin. Immunol. 2019, 44, 101323. [Google Scholar] [CrossRef] [PubMed]
  50. Faber, E.; Gripp, E.; Maurischat, S.; Kaspers, B.; Tedin, K.; Menz, S.; Zuraw, A.; Kershaw, O.; Yang, I.; Rautenschlein, S.; et al. Novel Immunomodulatory Flagellin-Like Protein FlaC in Campylobacter Jejuni and Other Campylobacterales. mSphere 2015, 1, e00028-15. [Google Scholar] [CrossRef] [PubMed] [Green Version]
  51. Thibodeau, A.; Letellier, A.; Yergeau, É.; Larrivière-Gauthier, G.; Fravalo, P. Lack of Evidence That Selenium-Yeast Improves Chicken Health and Modulates the Caecal Microbiota in the Context of Colonization by Campylobacter Jejuni. Front. Microbiol. 2017, 8, 451. [Google Scholar] [CrossRef] [Green Version]
  52. Kogut, M.H.; Lee, A.; Santin, E. Microbiome and Pathogen Interaction with the Immune System. Poult. Sci. 2020, 99, 1906–1913. [Google Scholar] [CrossRef]
  53. Hermans, D.; Pasmans, F.; Heyndrickx, M.; Immerseel, F.V.; Martel, A.; Deun, K.V.; Haesebrouck, F. A Tolerogenic Mucosal Immune Response Leads to Persistent Campylobacter Jejuni Colonization in the Chicken Gut. Crit. Rev. Microbiol. 2012, 38, 17–29. [Google Scholar] [CrossRef] [Green Version]
Figure 1. Main steps of the experimental procedure. Each day, the number of chickens (n) used for blood sampling and necropsy is represented in red or brown respectively.
Vaccines 10 00981 g001
Figure 2. Effect of vaccination on Campylobacter colonisation of chicken caeca according to the age of the chickens (corresponding to the experiment days). Significant differences between the two groups are indicated by asterisks (* p < 0.05, *** p < 0.001; Wilcoxon rank sum test).
Vaccines 10 00981 g002
Figure 3. Anti-flagellin antibody levels after vaccination and challenge. (a) Levels of anti-flagellin IgY antibodies in serum. (b) Levels of anti-flagellin IgA antibodies in bile. Significant differences between the two groups are indicated by asterisks (* p < 0.05, ** p < 0.01, *** p < 0.001; Wilcoxon rank sum test).
Vaccines 10 00981 g003
Figure 4. Relative gene expressions of cytokines, chemokines and AMPs in caecum. Relative gene expression represents log2 ratio vaccinated/placebo. Values > 0 (above the dotted black line) represent relative over-expressions of cytokine, chemokine or AMP genes in the caecum of vaccinated chickens compared with the placebo group while values < 0 (below the dotted black line) represent relative sub-expressions of cytokine, chemokine or AMP genes in the caecum of vaccinated chickens compared with the placebo group. Student’s parametric test was used when the normality and homogeneity criteria of the variances were validated (checked by the Shapiro–Wilk normality test and Bartlett’s test respectively); otherwise, the non-parametric Mann–Whitney test was used. Significant differences between 2−ΔCt values of the vaccinated and placebo groups are indicated by asterisks in red (* p < 0.05, ** p < 0.01) for the expression of each gene at the corresponding time points. The genes evaluated were interferon (IFN)-γ, interleukin (IL)8-like(L)1, IL8L2, IL-1β, IL-4, IL-10, IL-17A, antimicrobial peptide avian β-defensins 10 (AvBD10) and AvBD12.
Vaccines 10 00981 g004
Figure 5. Richness and alpha diversity indices for chicken’s caecal microbiota on D19, D22 and D40. Significant differences between the vaccinated (v) group in red and placebo (p) group in blue are indicated by asterisks (* p < 0.05, ** p < 0.01, *** p < 0.001).
Vaccines 10 00981 g005
Figure 6. Representation of beta diversity of the chicken caecal microbiota on D19, D22 and D40. MDS based on weighted UniFrac distance. The vaccinated (v) group is in red and the placebo (p) group in blue.
Vaccines 10 00981 g006
Figure 7. Taxonomic composition represented by relative abundance of bacterial communities from the caecal microbiota of chickens from the vaccinated (v) and placebo (p) groups on D19, D22 and D40. (a) Relative abundance of phyla identified in caecal microbiota represented by a bar for each sample. (b) Relative abundance of the nine main families represented by a bar for each sample.
Vaccines 10 00981 g007
Figure 8. Differential abundances for members of the caecal microbial communities from the vaccinated and placebo groups on D40, identified by linear discrimination analysis coupled with effect size (LefSE). (a) Histogram of the LDA scores computed for taxa with significantly different relative abundance in the vaccinated group in green and placebo group in red. Only taxa belonging to family and genera with an LDA threshold value > two are reported. (b) Cladogram representing LefSE results of the identified taxa according to their phylogenetic characteristics. The green circles represent those of greater abundance in the vaccinated group, and red circles those in the placebo group. Yellow indicates non-significant differences between the two groups. The diameters of the circles are proportional to the taxon’s abundance. This representation highlights the presence of the differentially abundant taxonomic levels (f_ family, g_genera) as concentric arcs.
Vaccines 10 00981 g008aVaccines 10 00981 g008b
Table 1. Primer sequences for the gene expression determined by qPCR.
Target GenePrimer Sequence (5′-3′)Product Size (bp)NCBI Accession NumberReference
B-actinF: CCCACCTGAGCGCAAGTACT
R: AAGCATTTGCGGTGGACAAT
132NM_205518.1[31]
IFN-γF: TGAGCCAGATTGTTTCGATG
R: CTTGGCCAGGTCCATGATA
152NM_205149.1[32]
IL-1βF:
GTGAGGCTCAACATTGCGCTGTA
R:
TGTCCAGGCGGTAGAAGATGAAG
214NM_204524.1[32]
IL-4F: GCTCTCAGTGCCGCTGATG
R:
GAAACCTCTCCCTGGATGTCAT
60NM_204524.1[33]
IL-10F: CGCTGTCACCGCTTCTTCA
R:
CGAACGTCTCCTTGATCTGCTT
67NM_001004414.2Primer Express®
IL-17AR: CATGGGATTACAGGATCGATGA
F: GCGGCACTGGGCATCA
68NM_204460.1[16]
IL8L1F: CCGATGCCAGTGCATAGAG
R: CCTTGTCCAGAATTGCCTTG
191NM_205018.1[34]
IL8L2F: CCTGGTTTCAGCTGCTCTGT
R: GCGTCAGCTTCACATCTTGA
128NM_205498.1[34]
AvBD10F: CAGACCCACTTTTCCCTGACA
R: CCCAGCACGGCAGAAATT
64NM_001001609.2[35]
AvBD12F:
TGTAACCACGACAGGGGATTG
R:
GGGAGTTGGTGACAGAGGTTT
114NM_001001607.2[35]
Table 2. Body weights (mean ± SD in g) of chicken groups during the trial.
GroupsDay 19Day 22Day 28Day 35Day 40
Placebo181 ± 27218 ± 37312 ± 40432 ± 53524 ± 74
Vaccinated183 ± 22223 ± 30319 ± 31443 ± 48530 ± 58
Table 3. Number of sequences and OTUs per step. Ten chickens (five in the vaccinated group and five in the placebo group) on D19 and D40 and eight chickens (four in the vaccinated group and four in the placebo group) on D22 were tested.
D19D22D40
Number of sequences after read demultiplexing and pre-process (merging, denoising and dereplication) 1,133,635 (min: 74,225; max: 153,026)735,454 (min: 61, 456; max: 125,181)1,032,938 (min: 45,196; max: 163,639)
Number of OTU332
Placebo:
(min: 219; max:263)
Vaccinated: (min: 163, max:234)
348
Placebo: (min: 256; max: 299)
Vaccinated: (min: 115, max: 182)
412
Placebo: (min: 203; max: 296)
Vaccinated: (min: 271, max: 314)
Publisher’s Note: MDPI stays neutral with regard to jurisdictional claims in published maps and institutional affiliations.

