
Mathematical Modelling for Optimal Vaccine Dose Finding: Maximising Efficacy and Minimising Toxicity


Abstract
:1. Introduction
- i.
- Assumed statistical efficacy model.
- ii.
- Trial size.
- iii.
- Method of trial dose selection.
- When the method of trial dose selection is fixed, how dose-optimisation approaches are affected by the assumed statistical efficacy model and trial size.
- When trial size is fixed, how dose-optimisation approaches are affected by the assumed statistical efficacy model and method of trial dose selection.
2. Materials and Methods
2.1. Overview of Simulation Study Methodology
2.2. Efficacy, Toxicity, and Utility
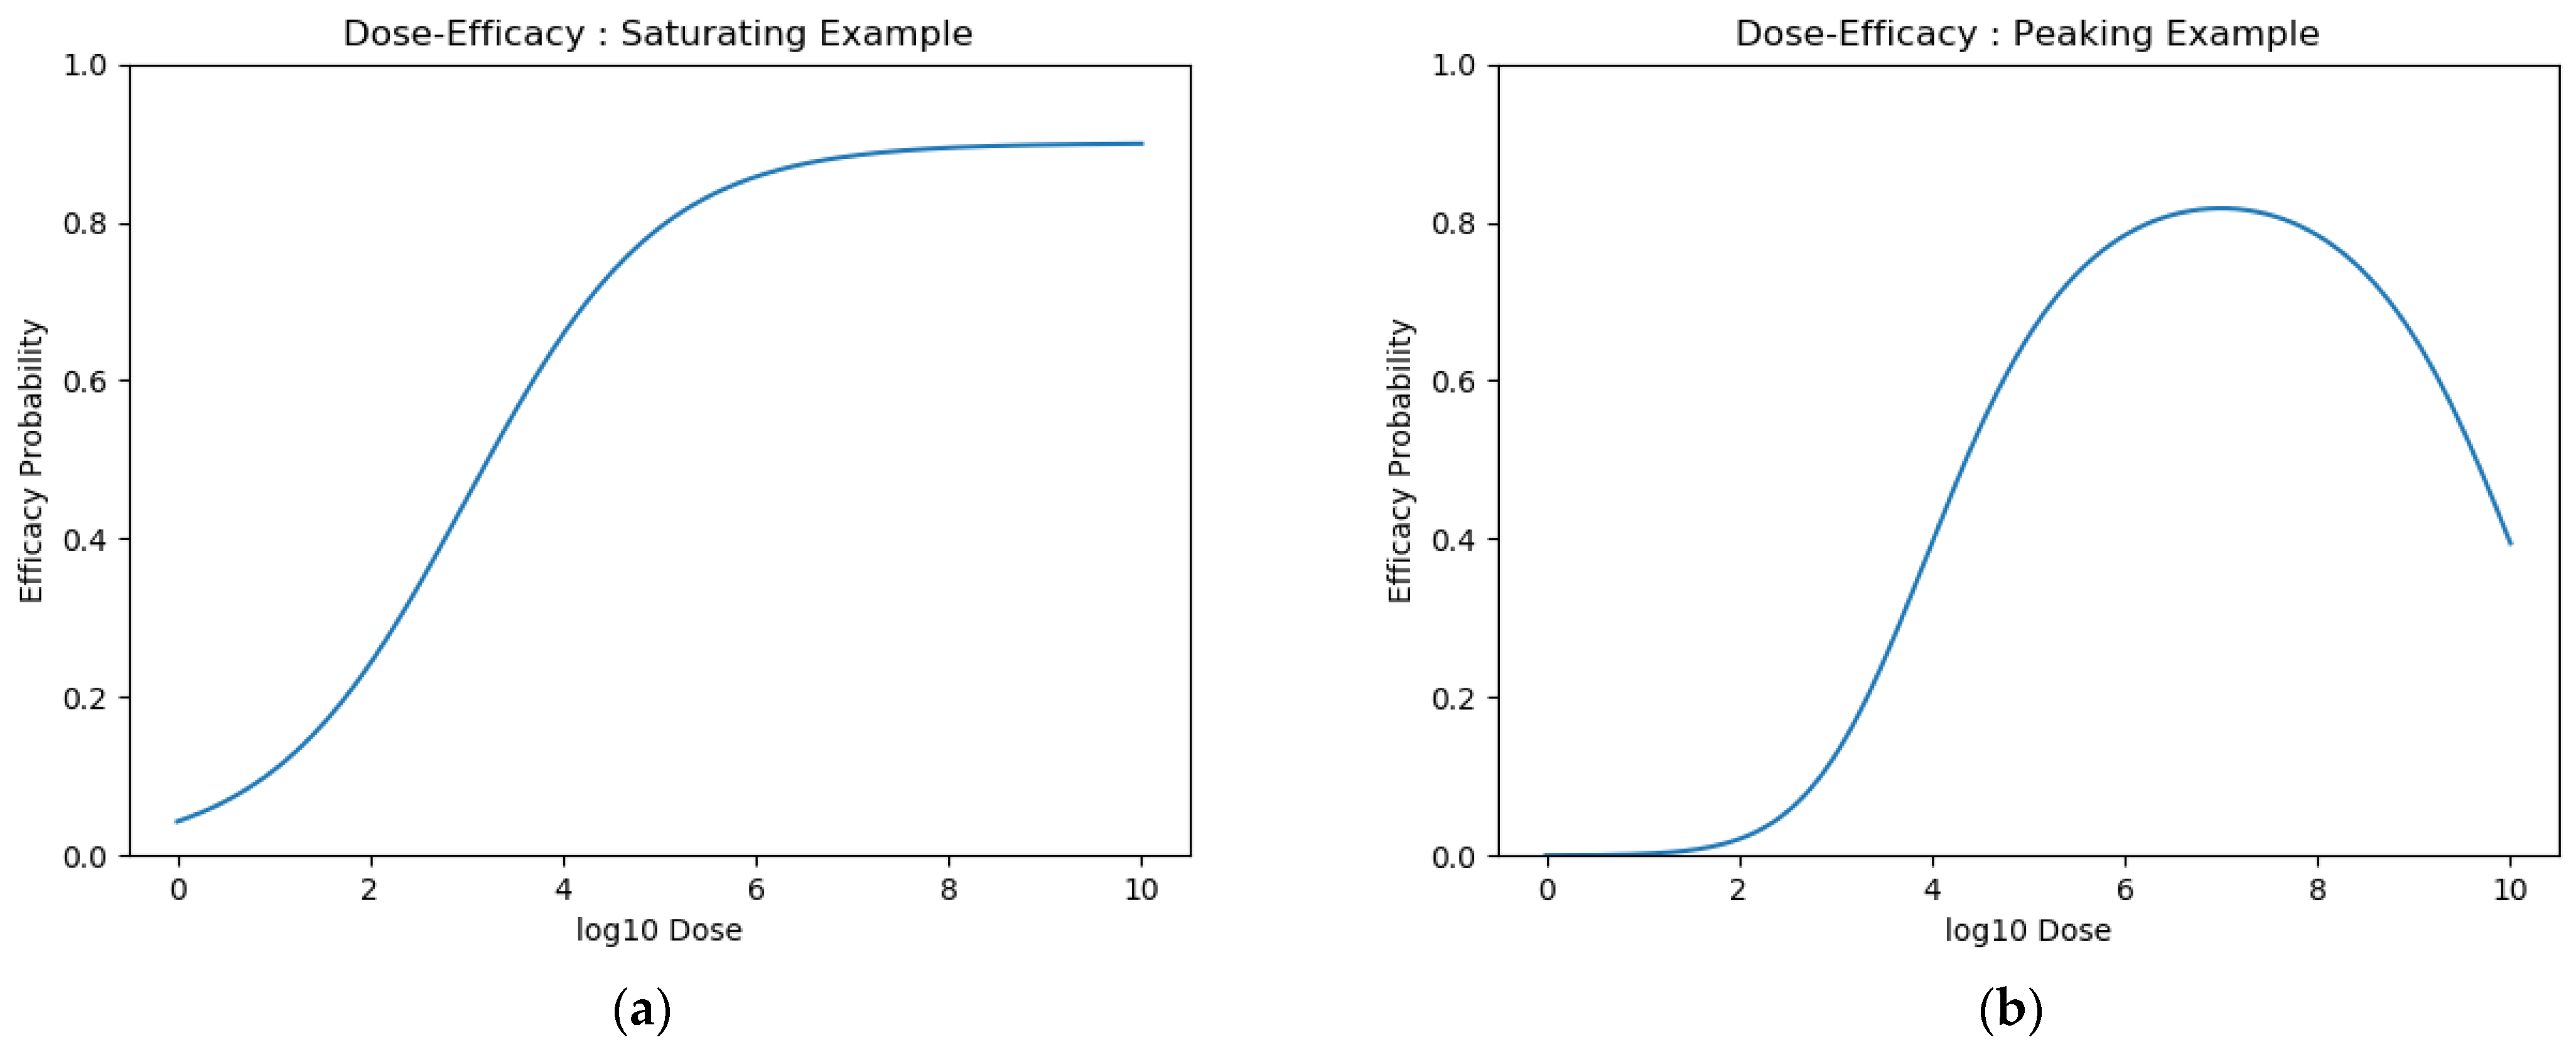
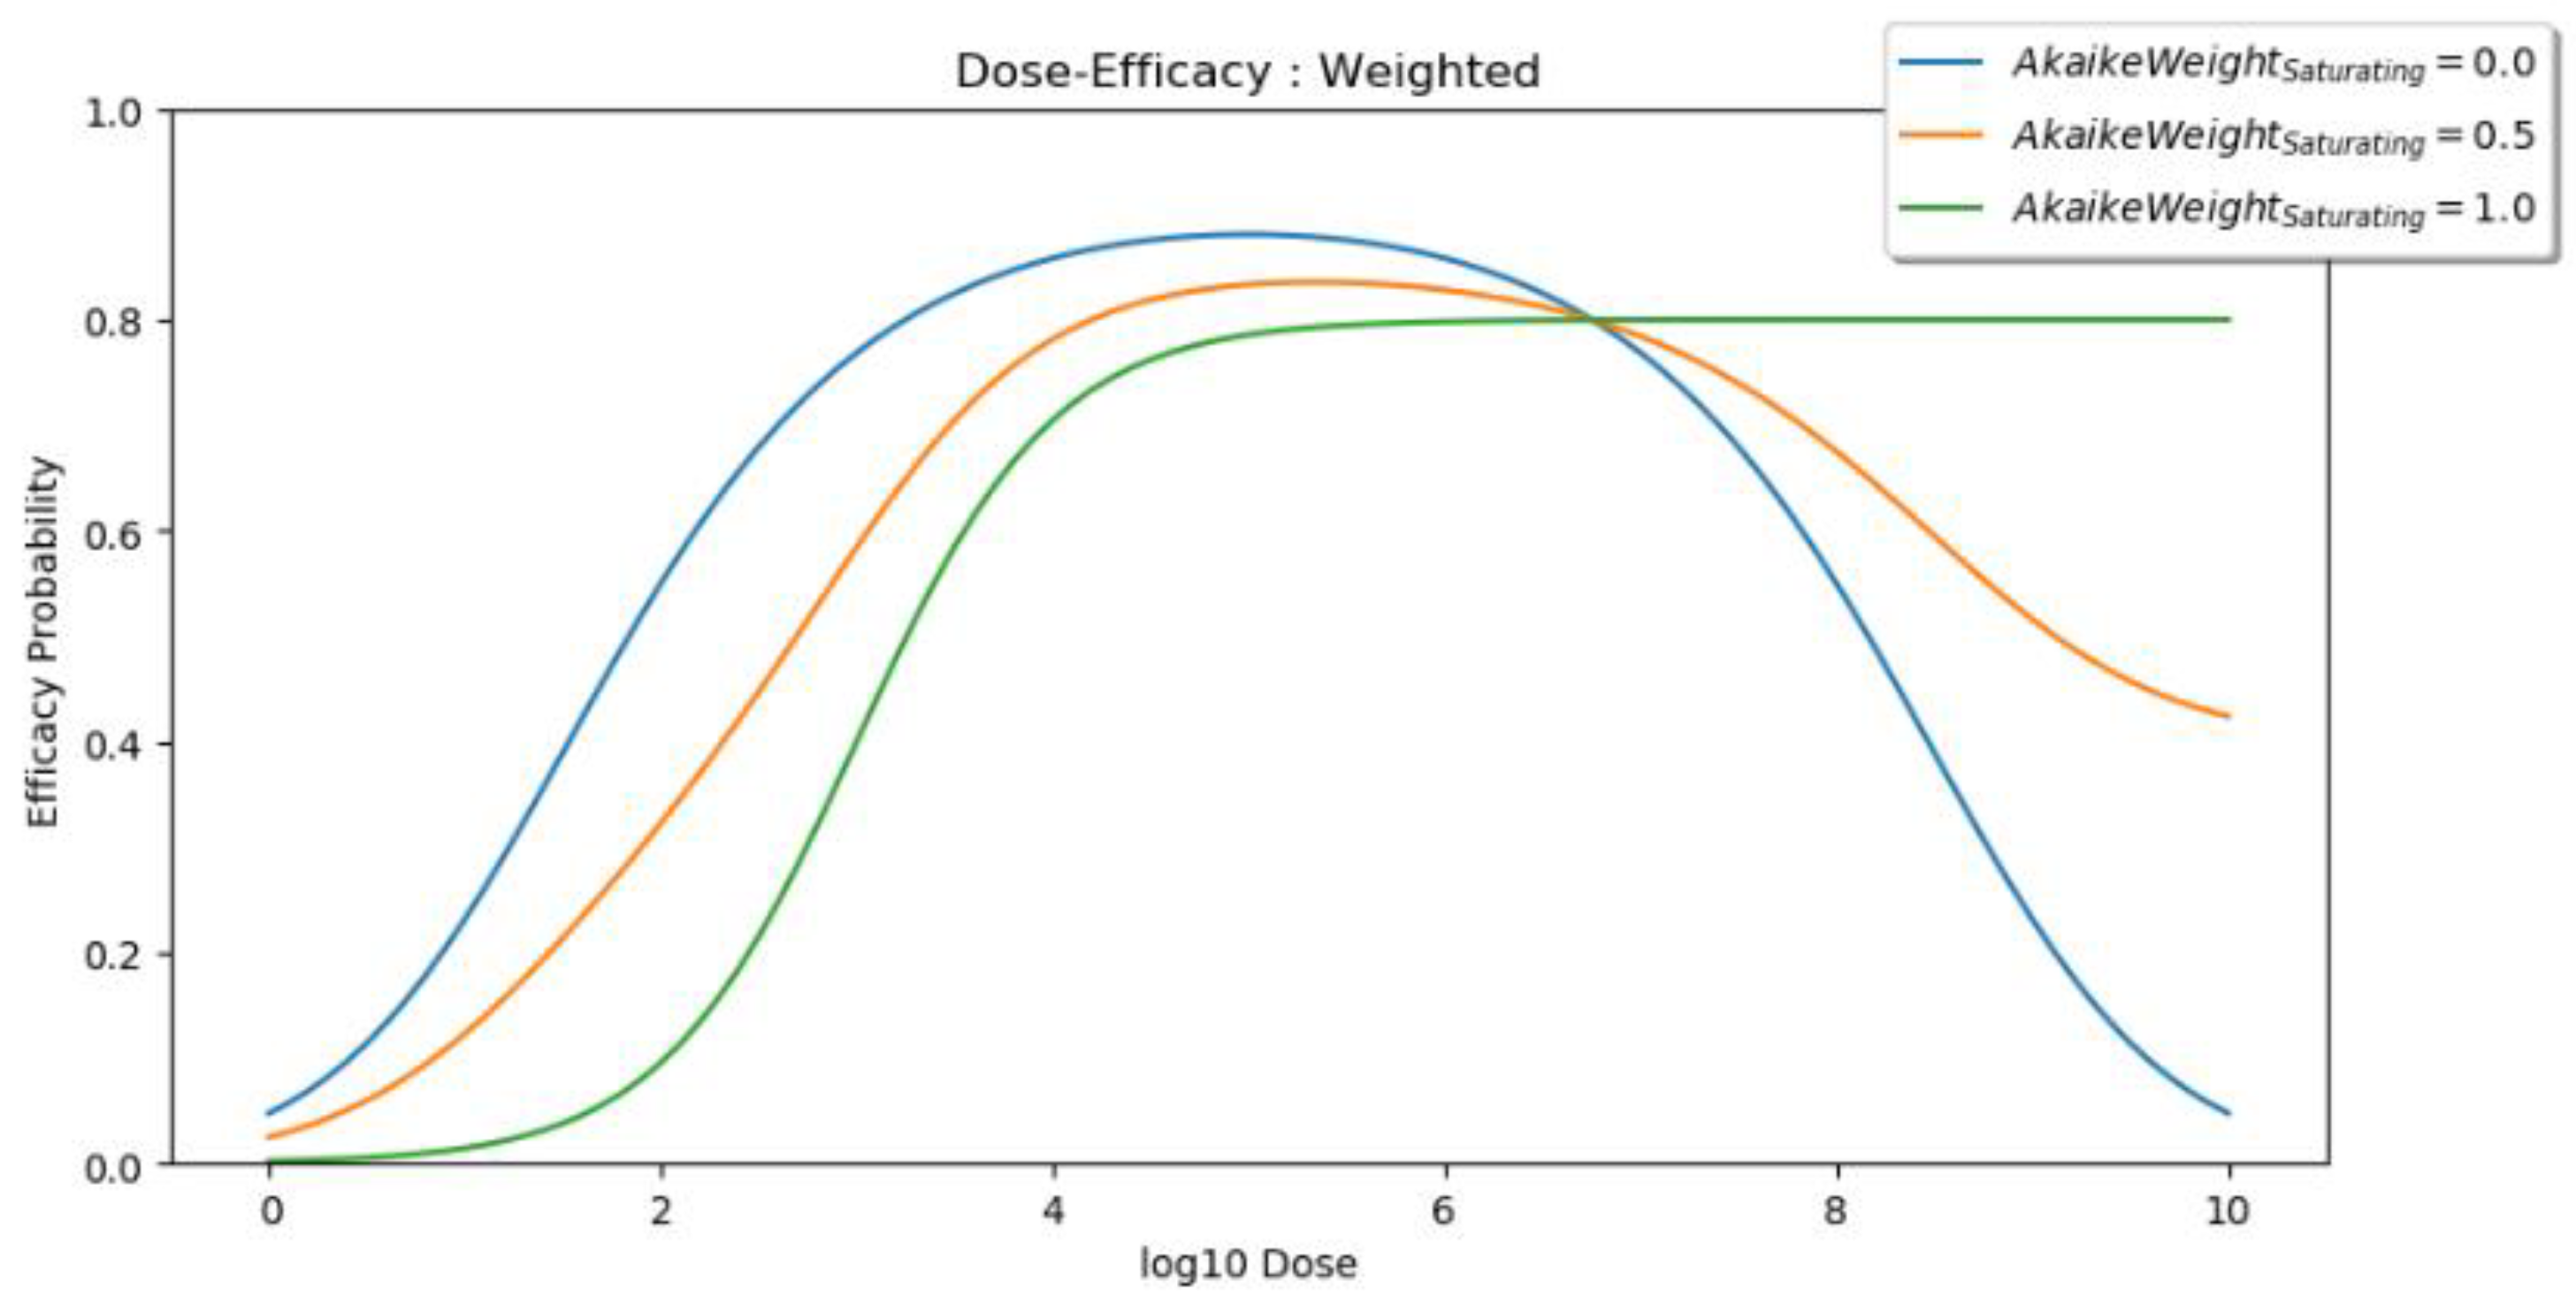
2.2.1. Dose Efficacy
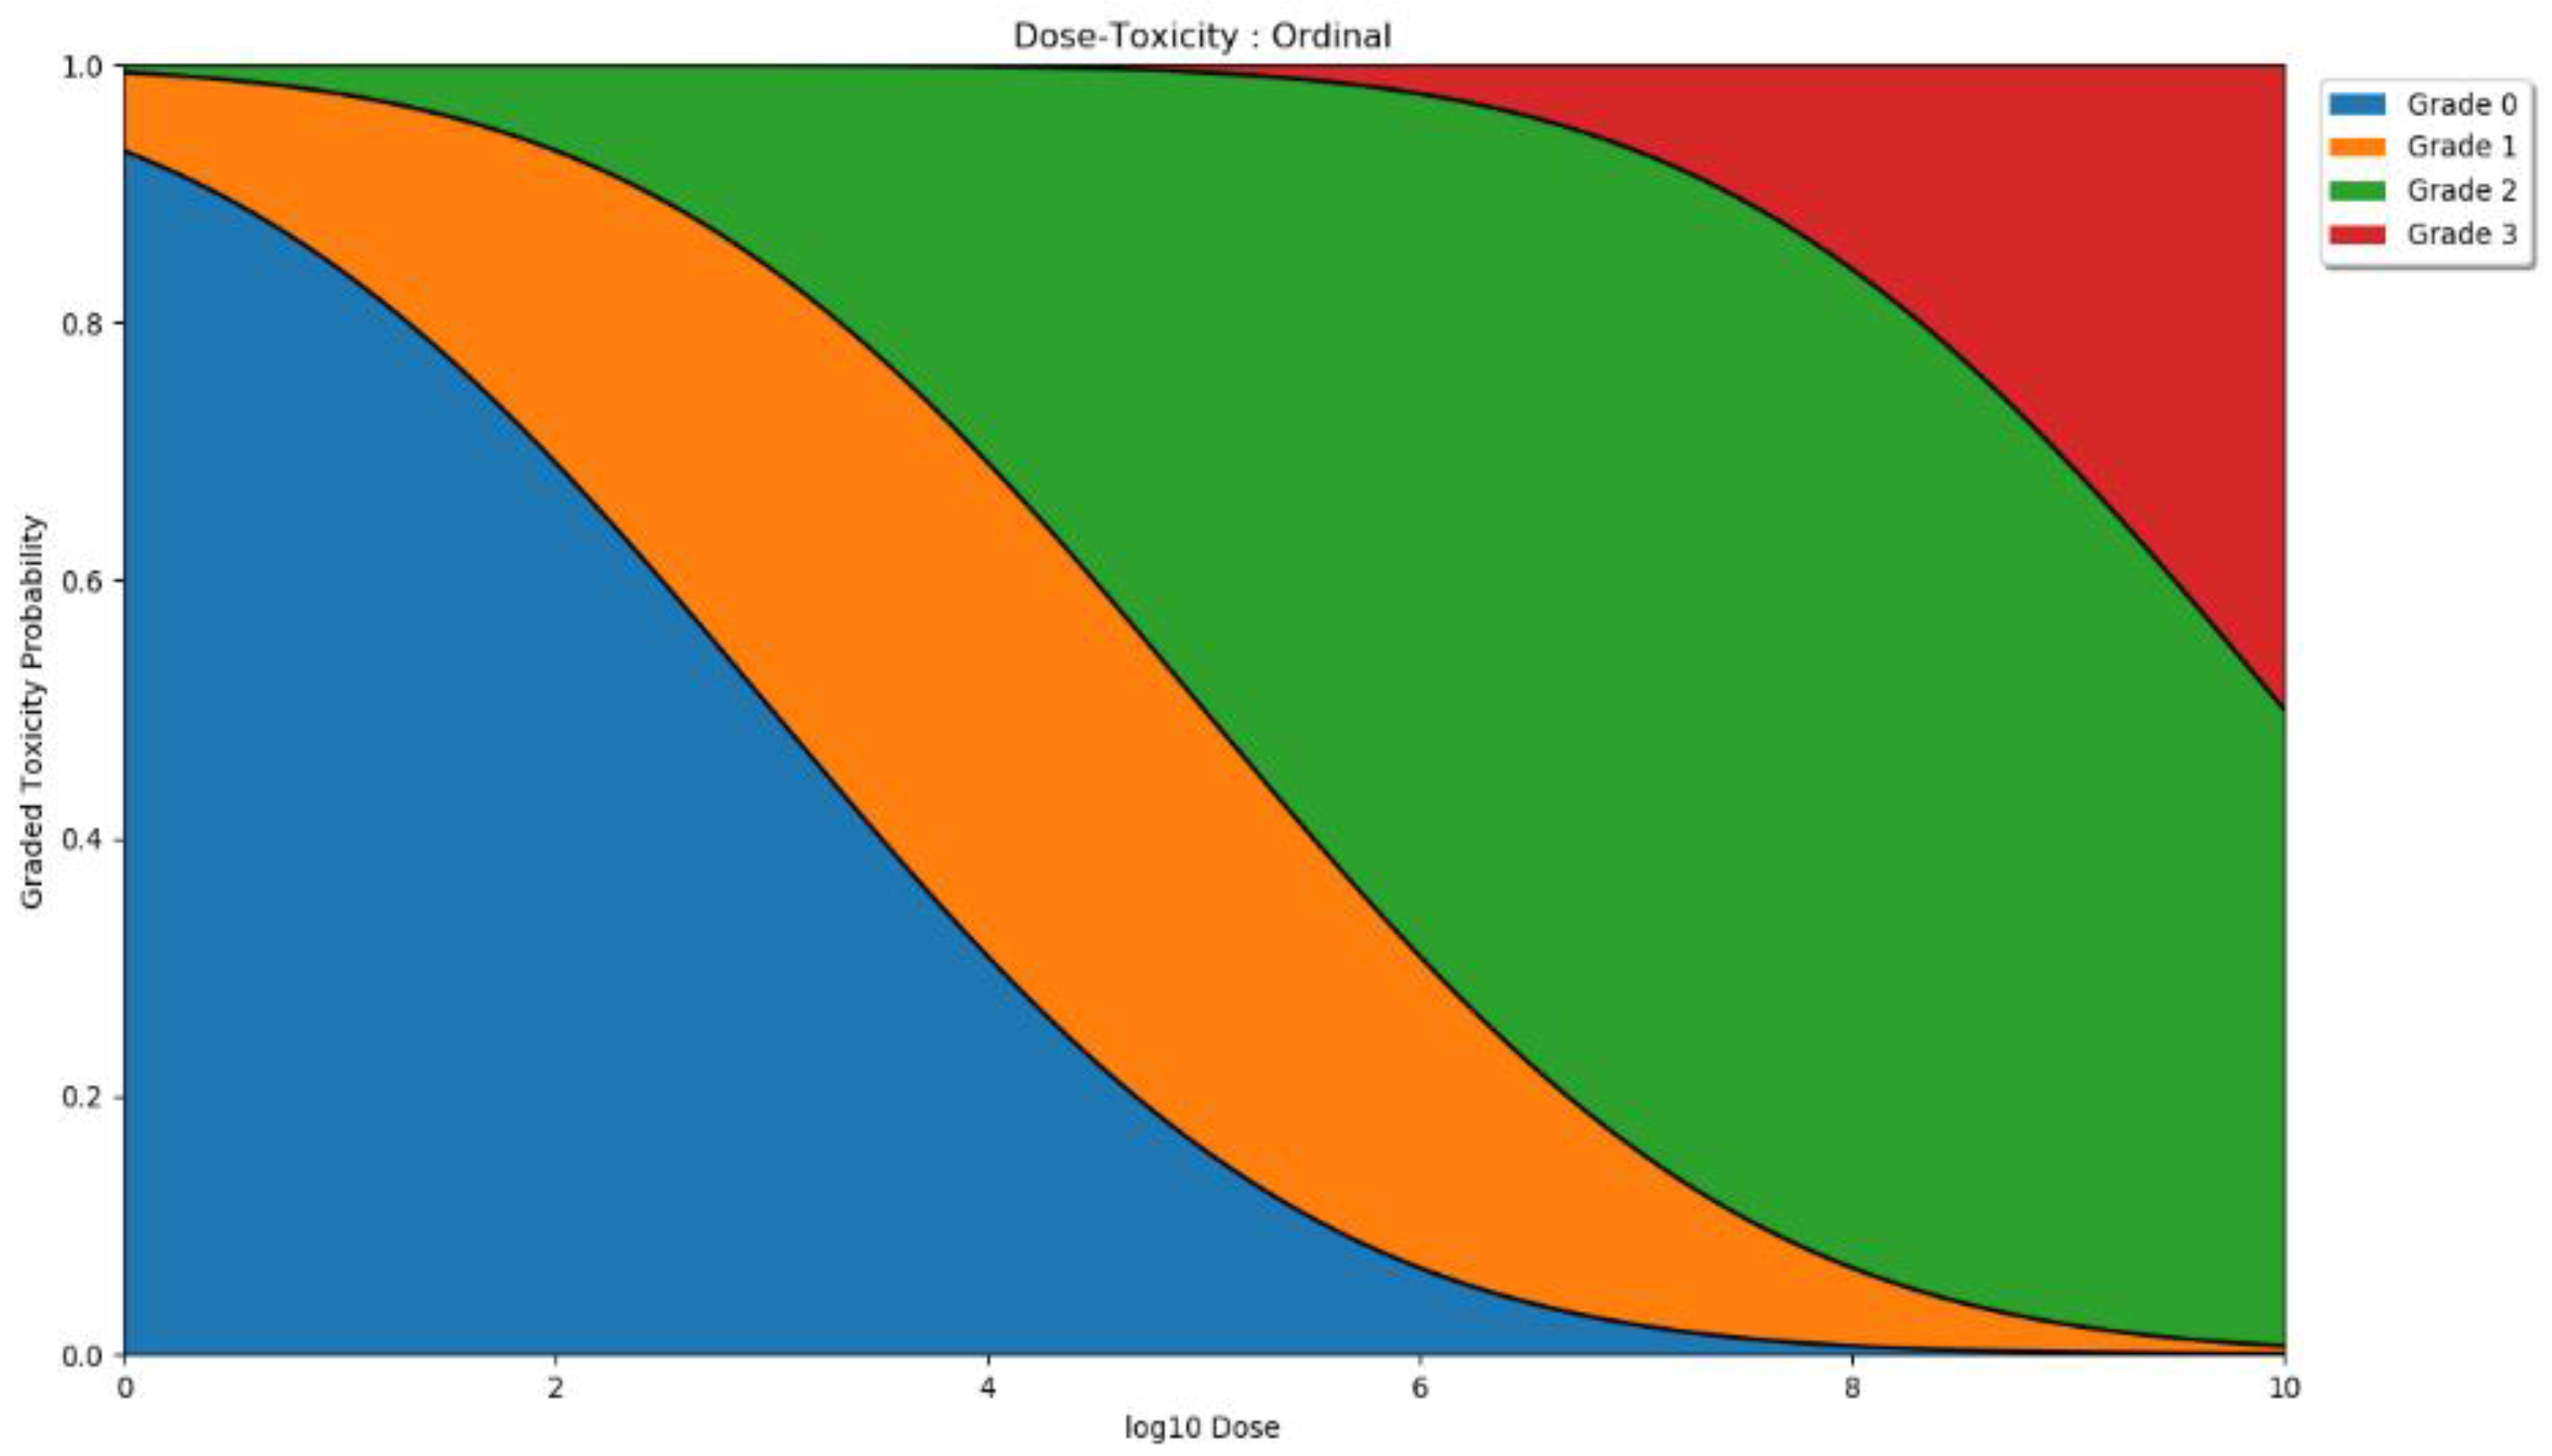
2.2.2. Dose Toxicity
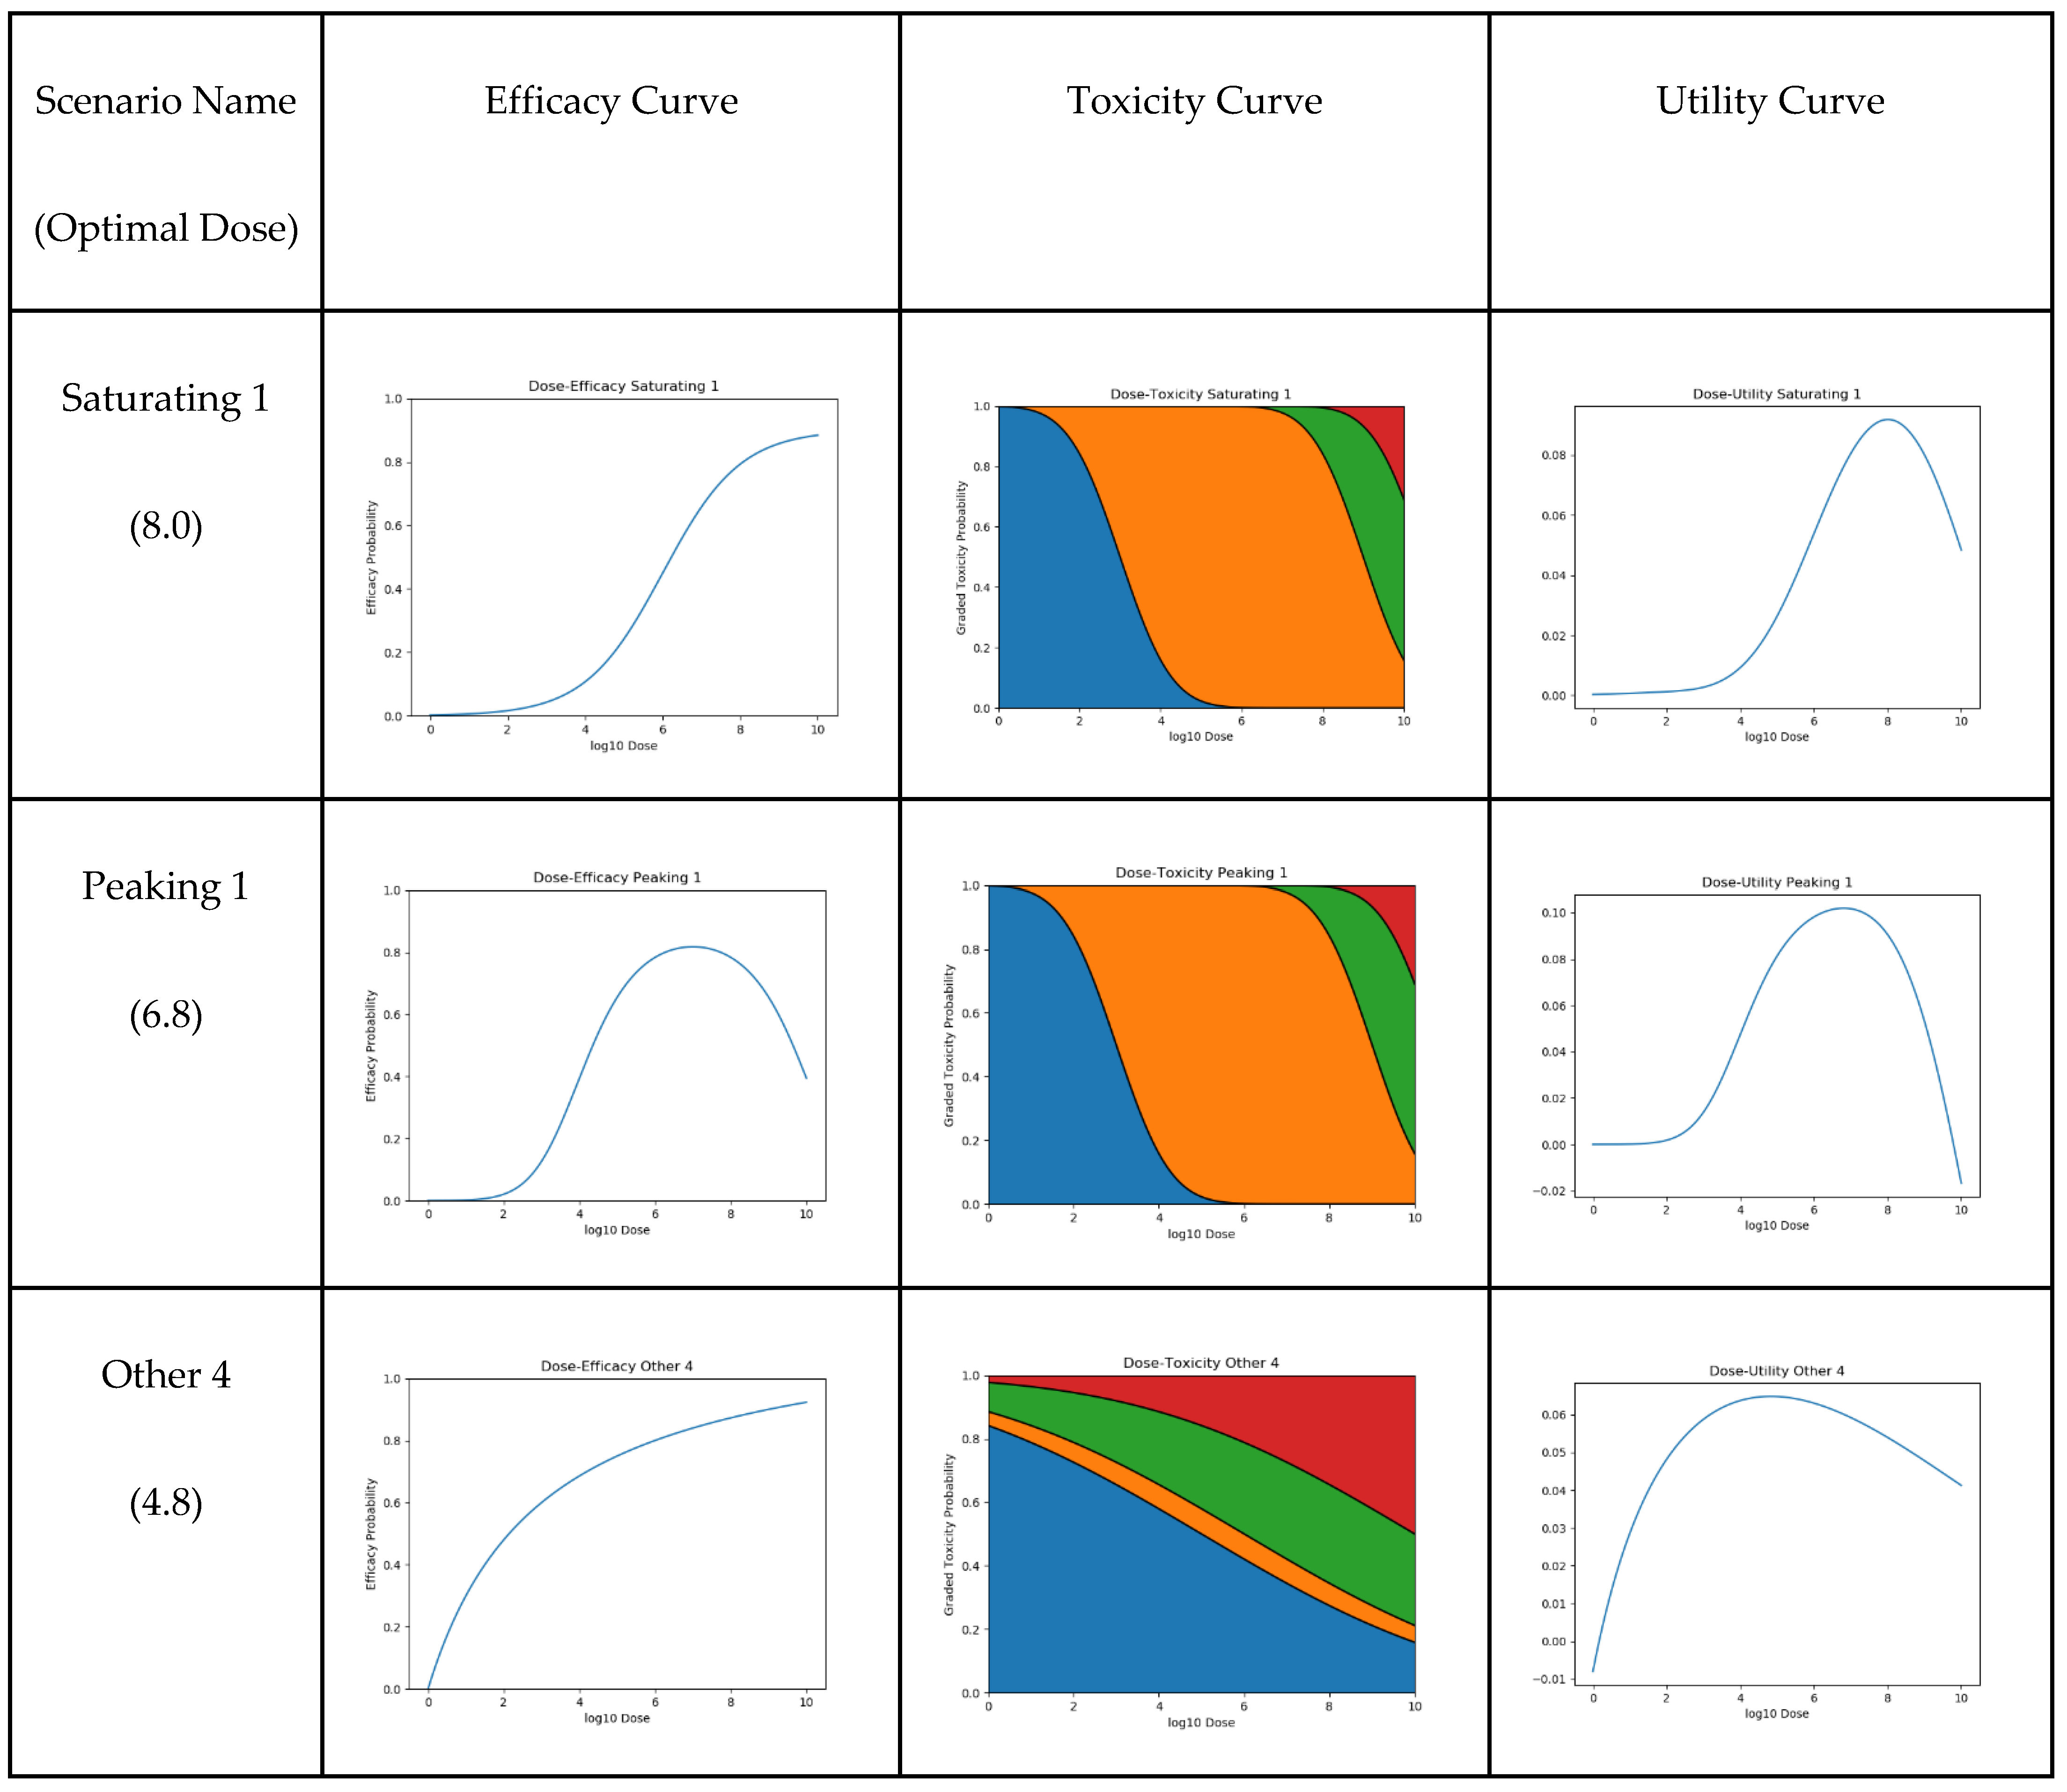
2.2.3. Dose Utility
- WeightEfficacy
- DisabilityWeightToxicity0
- DisabilityWeightToxicity1
- DisabilityWeightToxicity2
- DisabilityWeightToxicity3

| Weight | Value | Source |
|---|---|---|
| WeightEfficacy | 0.133 or 0.266 | Chosen to be equal to either DisabilityWeightToxicity3 or twice DisabilityWeightToxicity3 |
| DisabilityWeightToxicity0 | 0.000 | Chosen to be 0, as no discomfort/toxicity is caused |
| DisabilityWeightToxicity1 | 0.006 | [35] |
| DisabilityWeightToxicity2 | 0.051 | [35] |
| DisabilityWeightToxicity3 | 0.133 | [35] |
2.3. Scenarios
2.4. Dose-Optimisation Approaches
- i.
- An assumed efficacy model (saturating, peaking, or weighted);
- ii.
- A trial size (10/30/60/100);
- iii.
- A method of trial dose selection (with either retrospective or continual modelling).
2.5. Additional Details
2.6. Objective 1: When the Method of Trial Dose Selection Is Fixed, How Dose-Optimisation Approaches Are Affected by the Assumed Statistical Efficacy Model and Trial Size
- i.
- Efficacy model: saturating, peaking, or weighted;
- ii.
- Trial dose-selection method: full uniform exploration;
- iii.
- Trial size: 10, 30, 60, or 100.
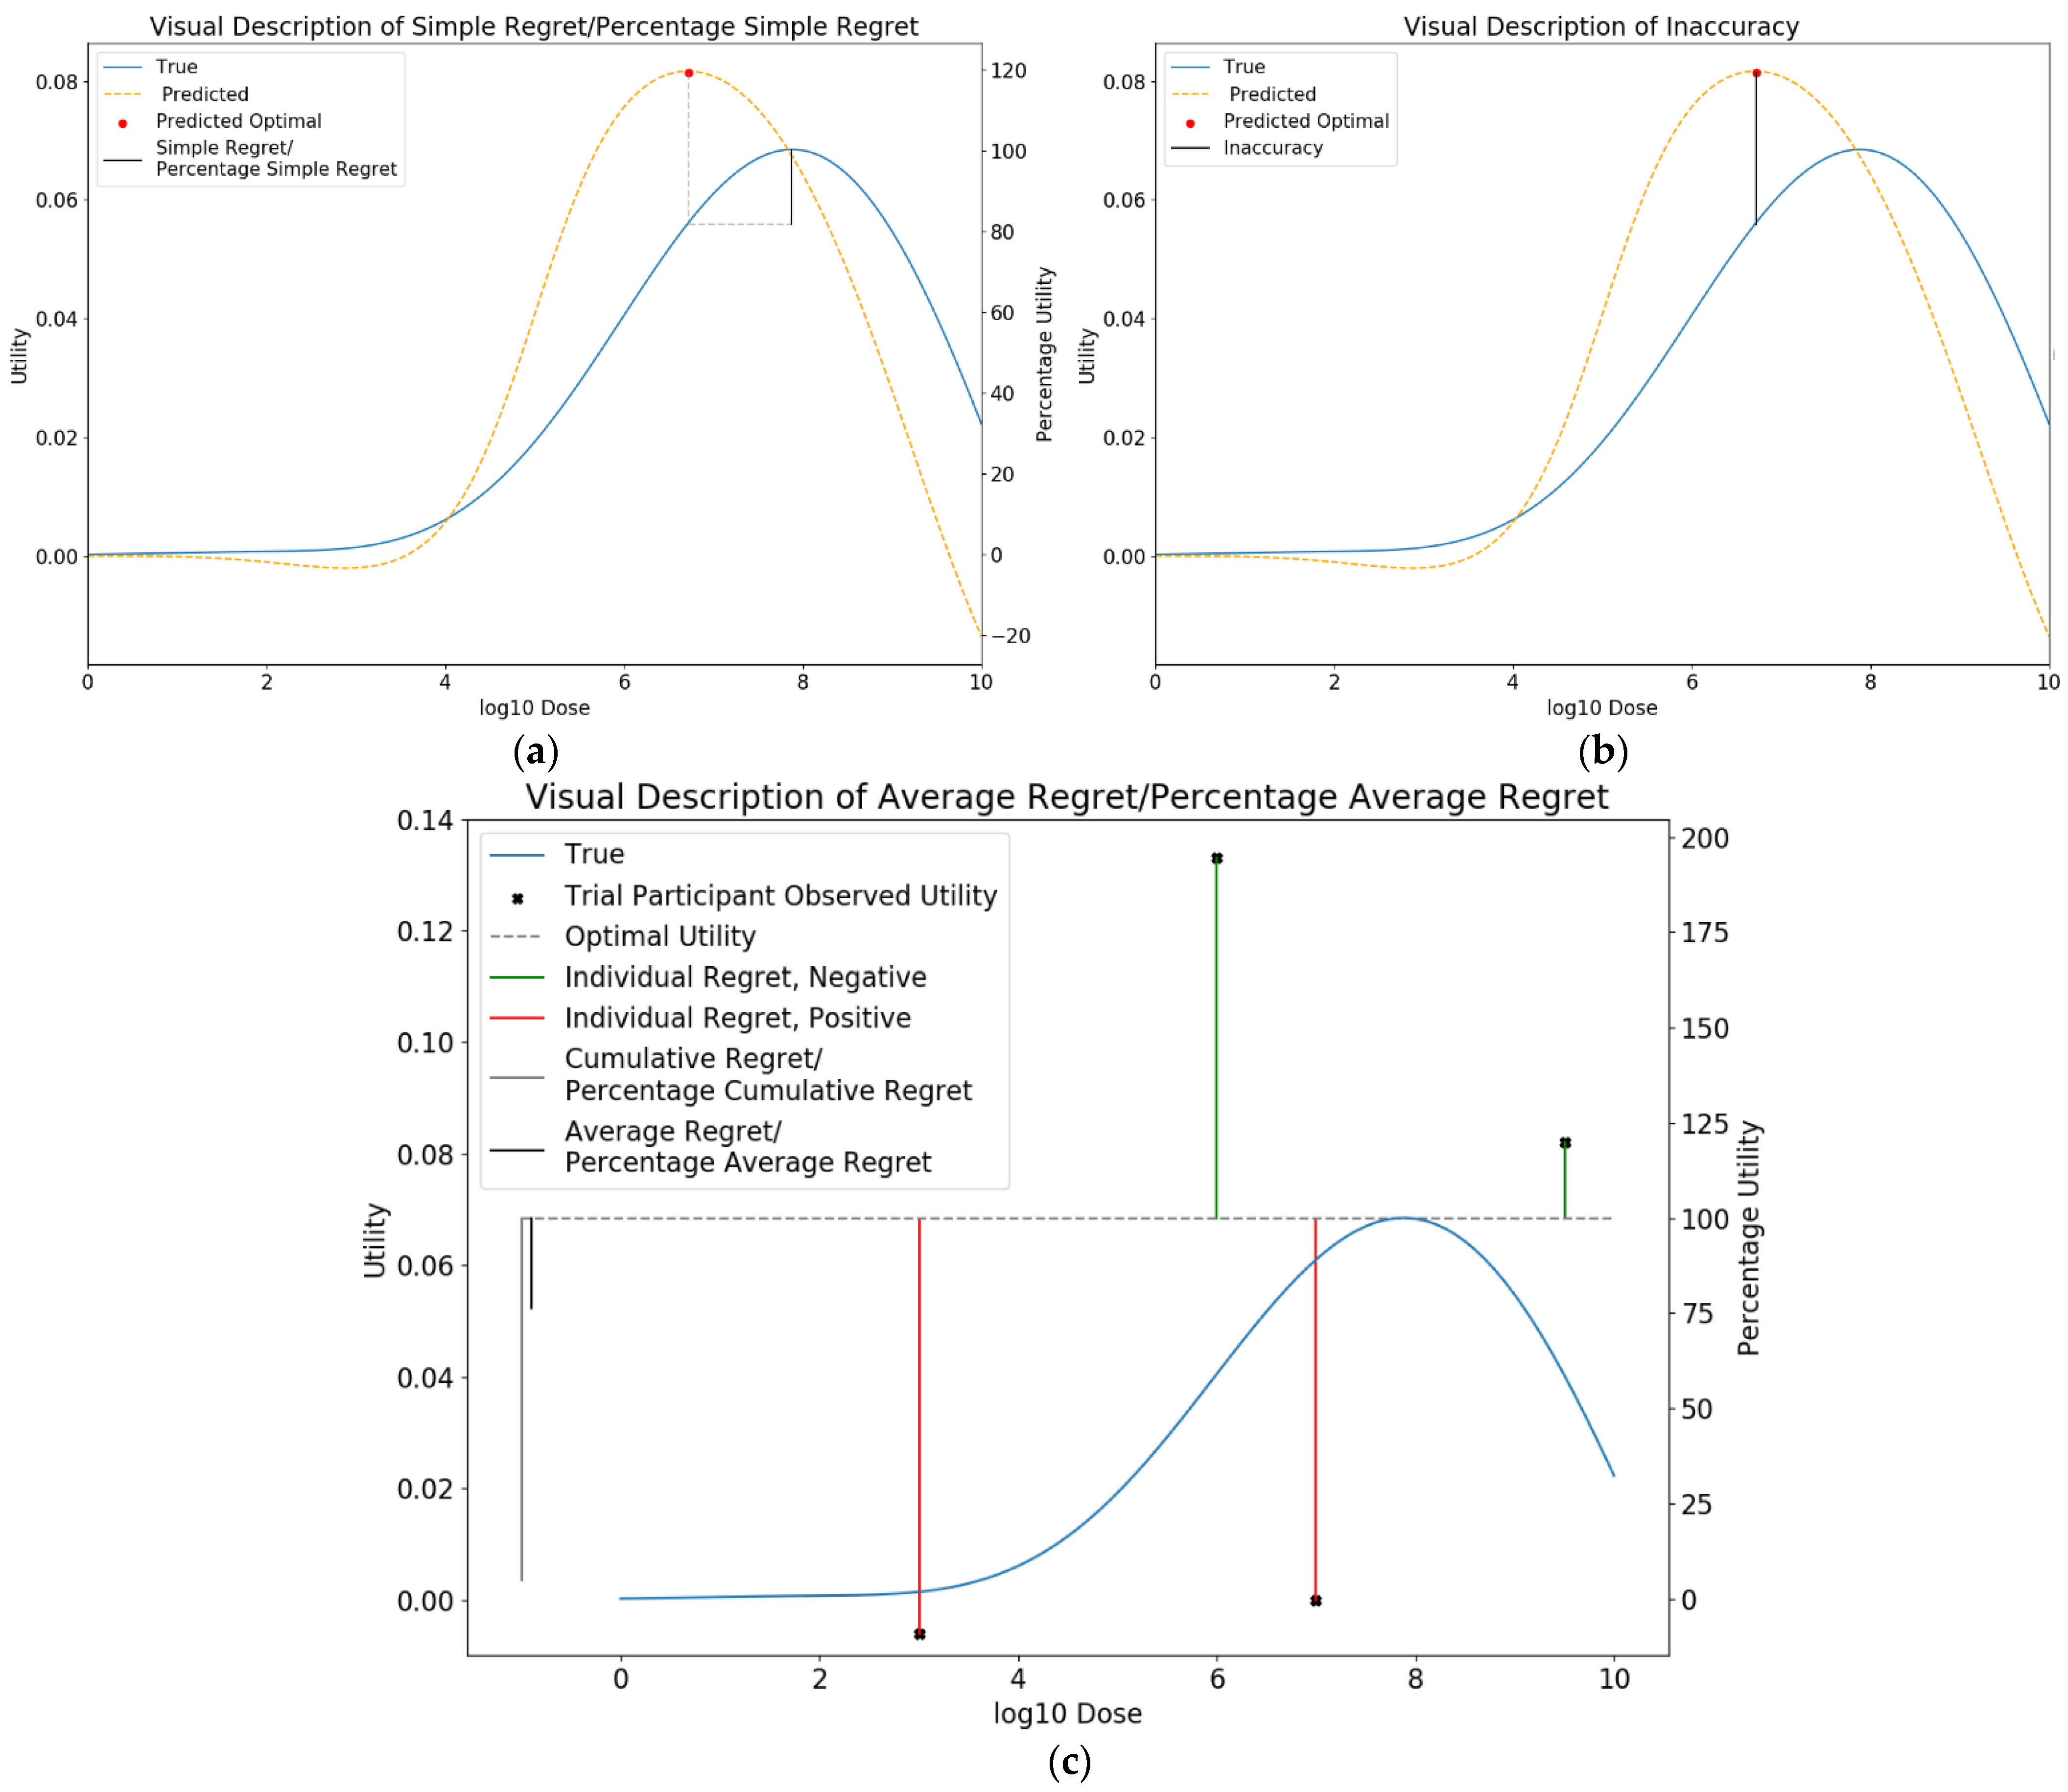
2.6.1. Metrics for Comparison between Approaches
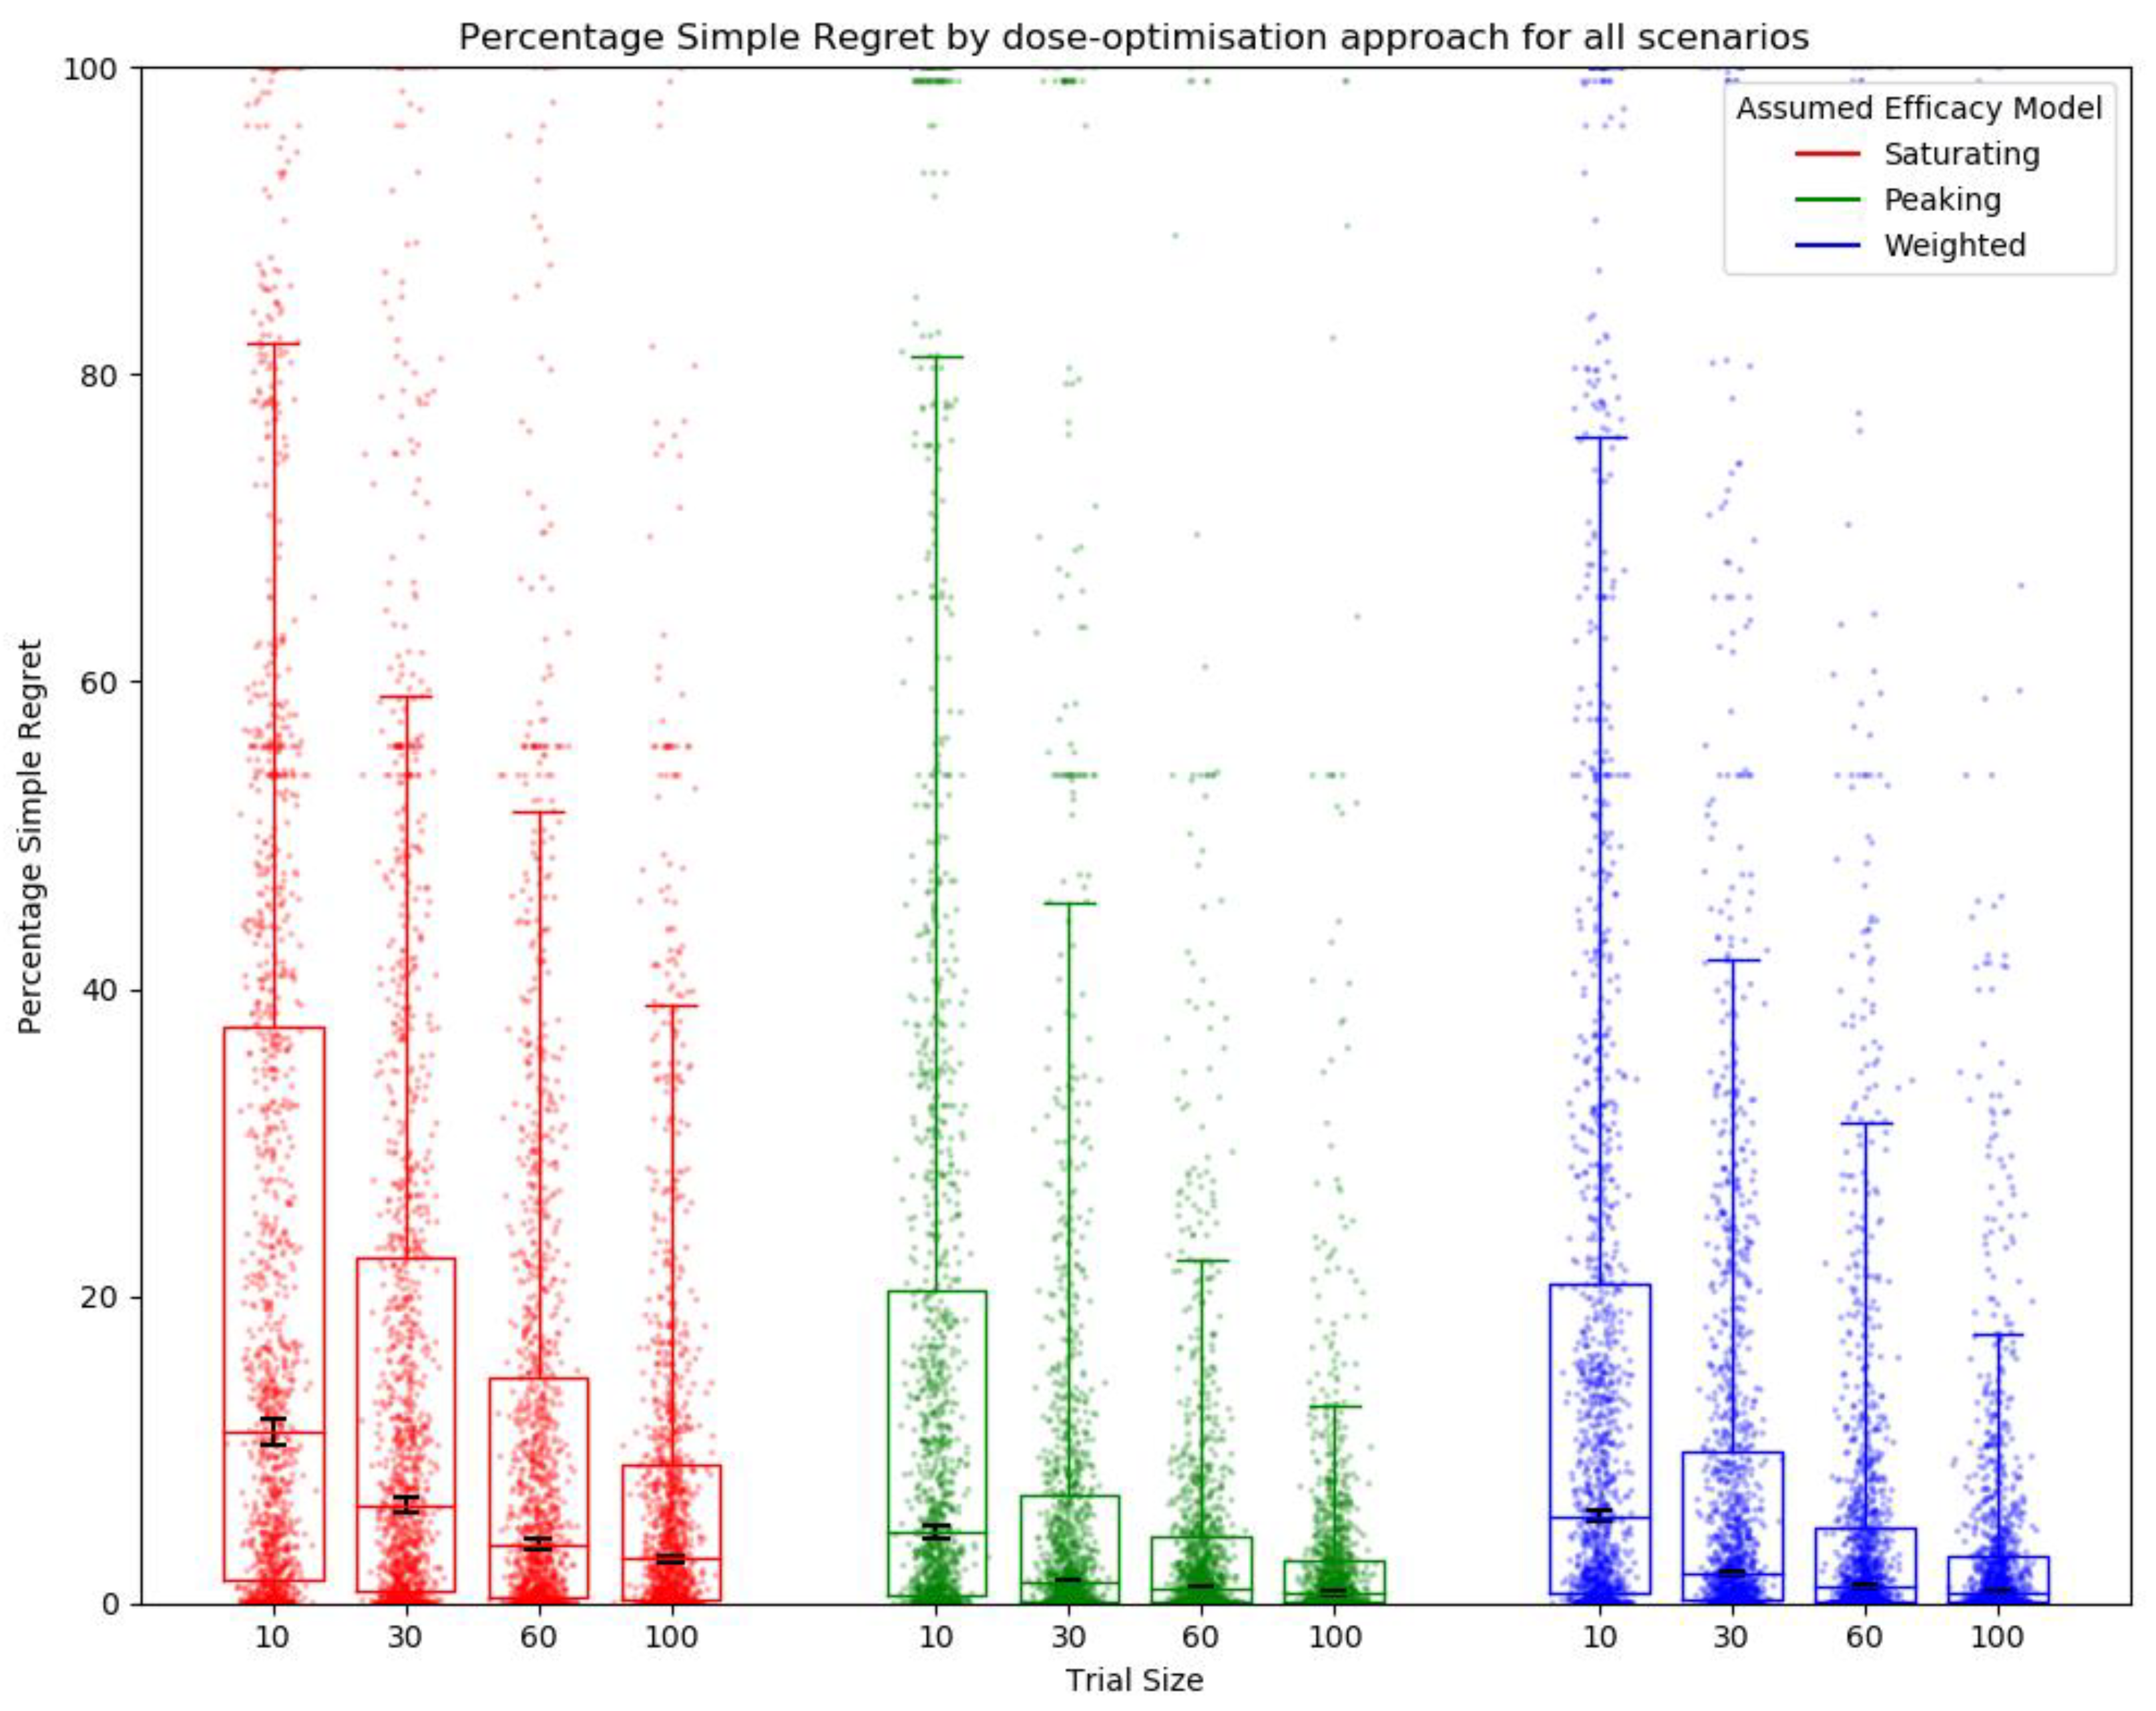
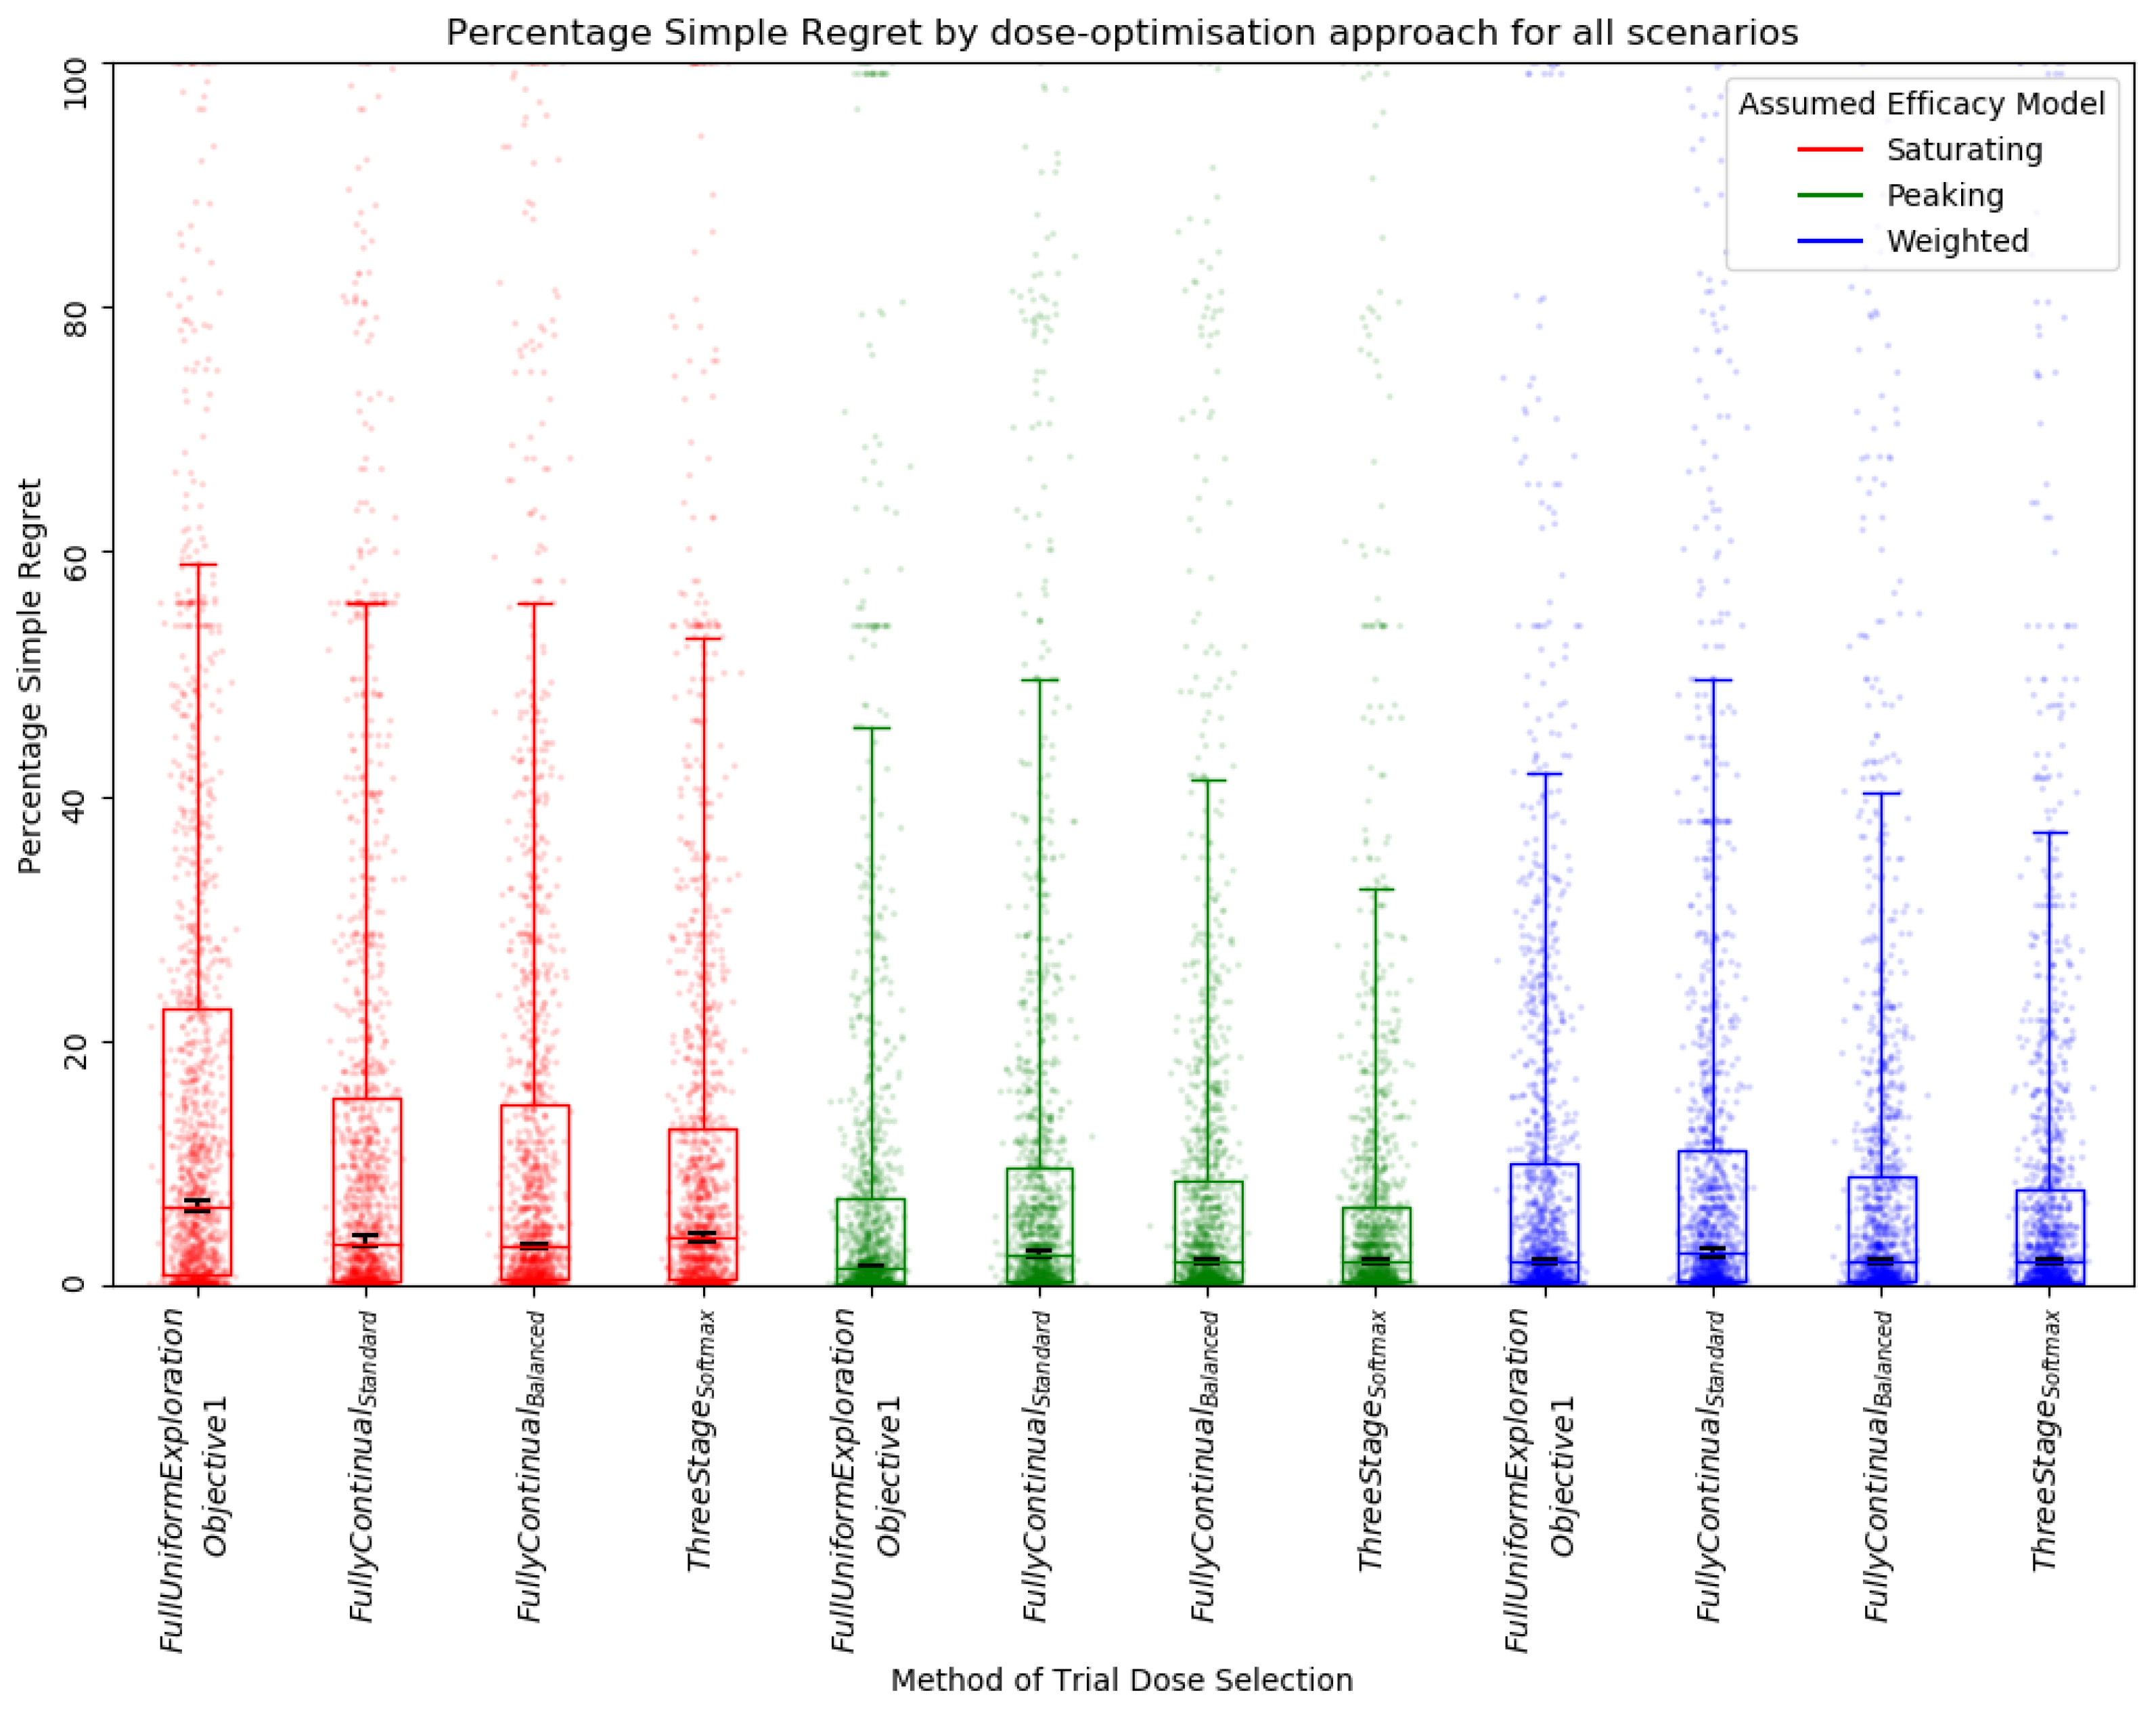
Simple Regret
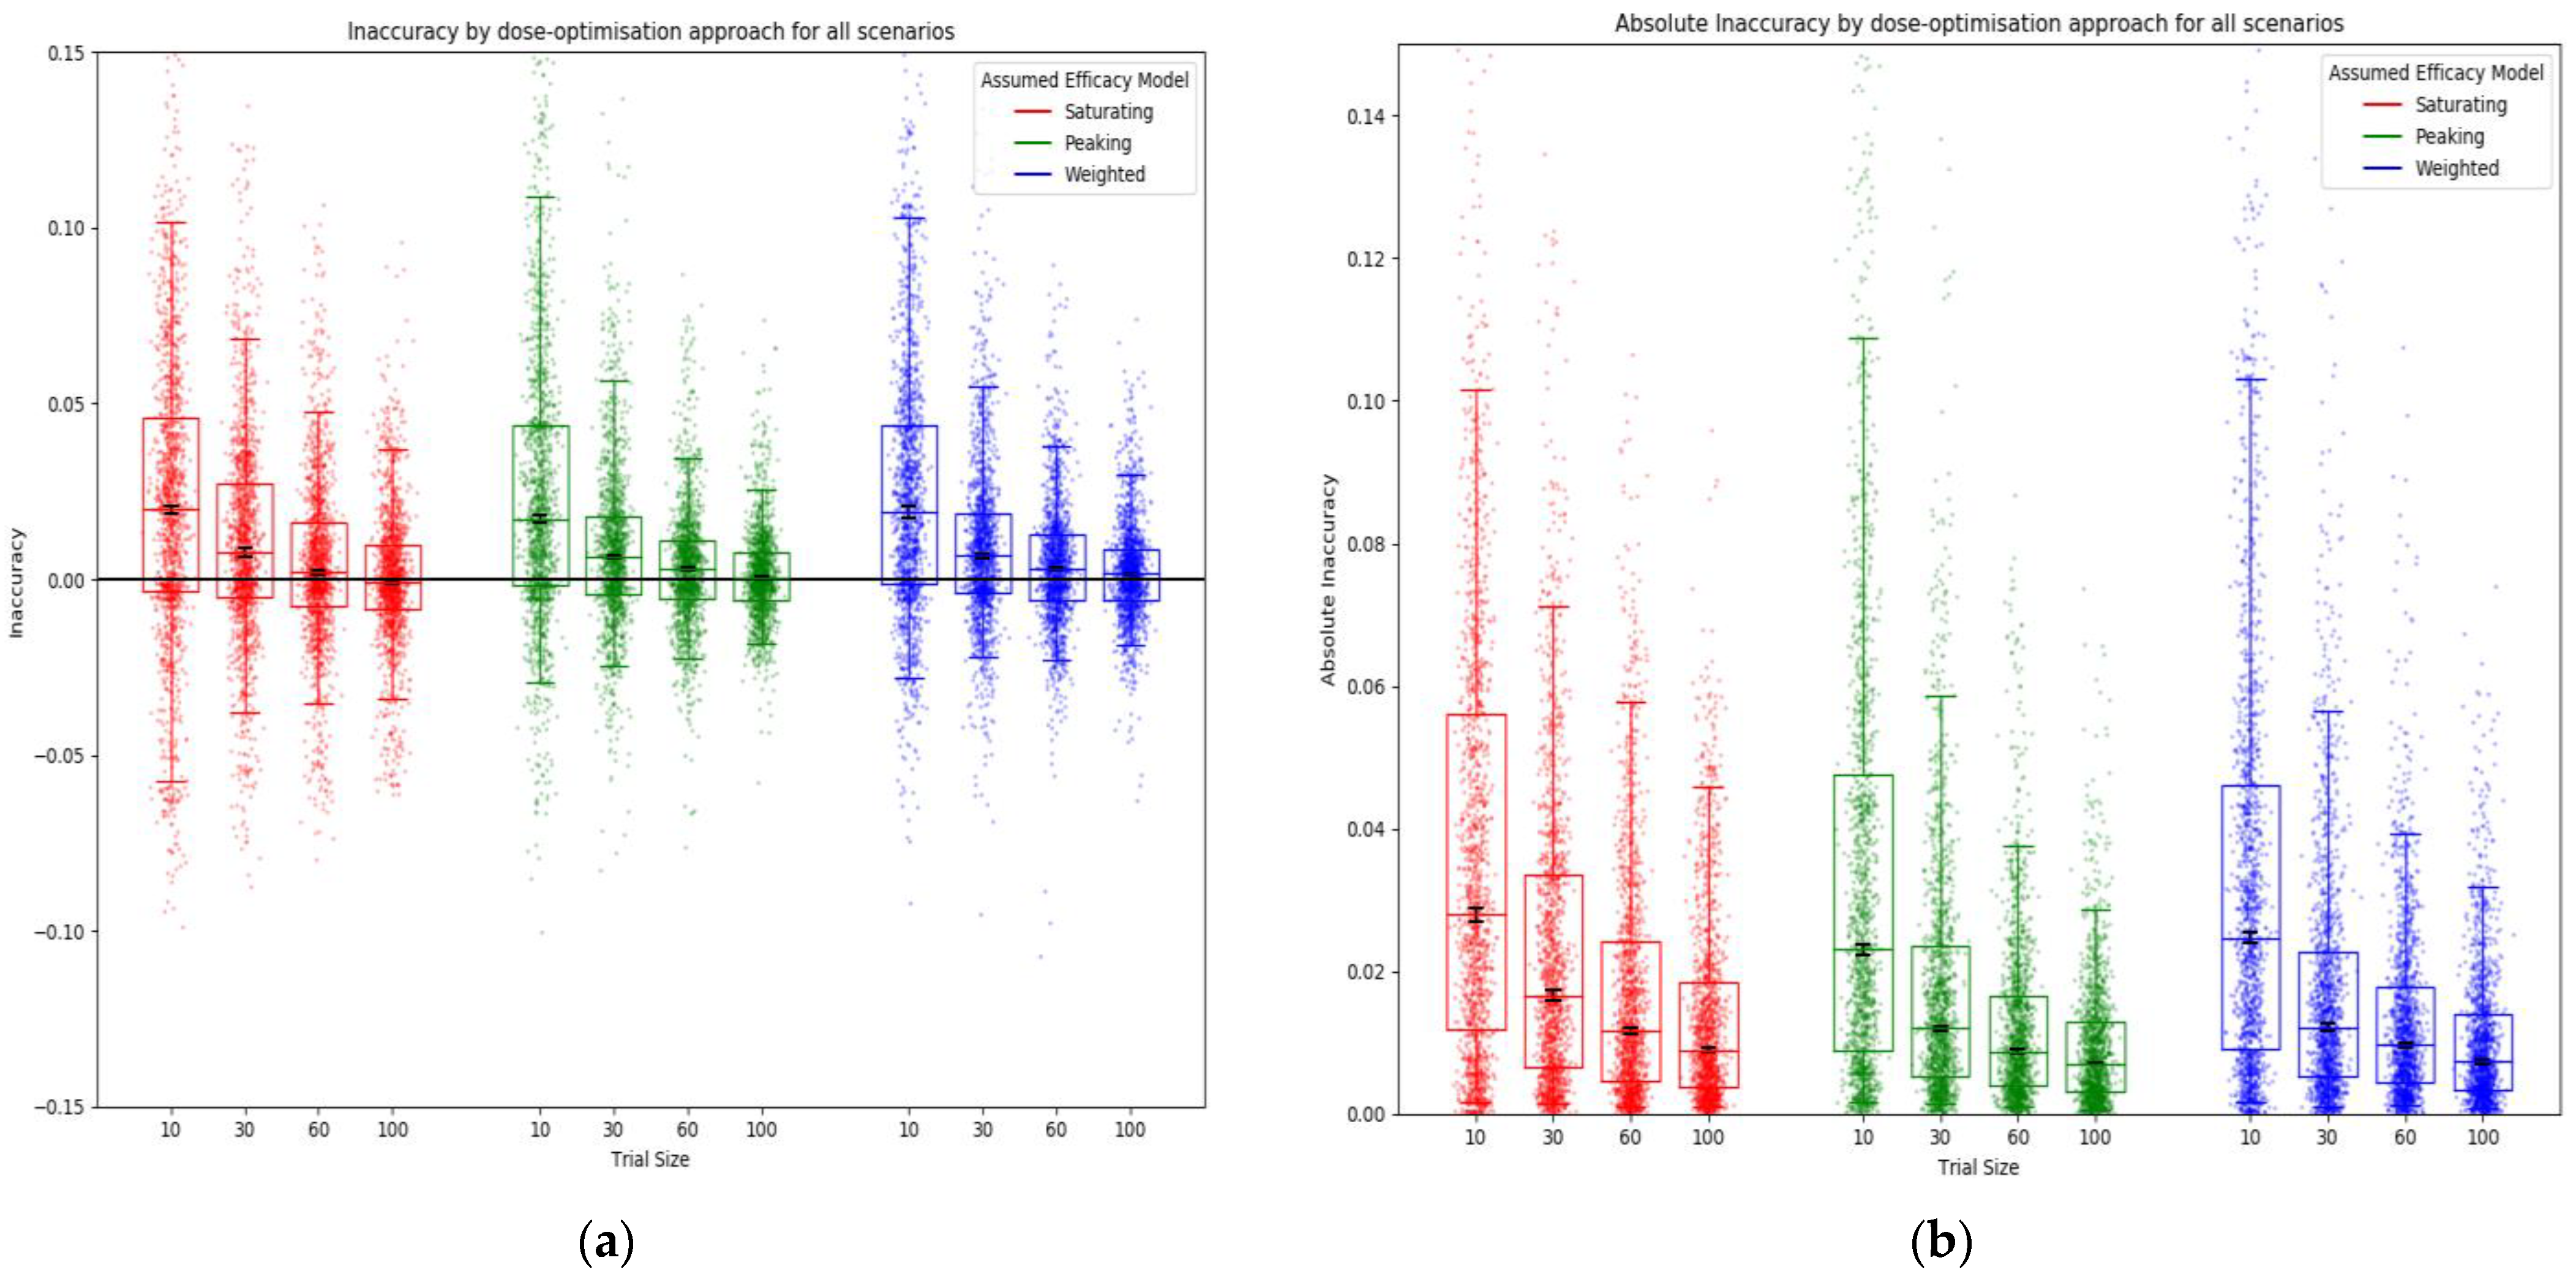
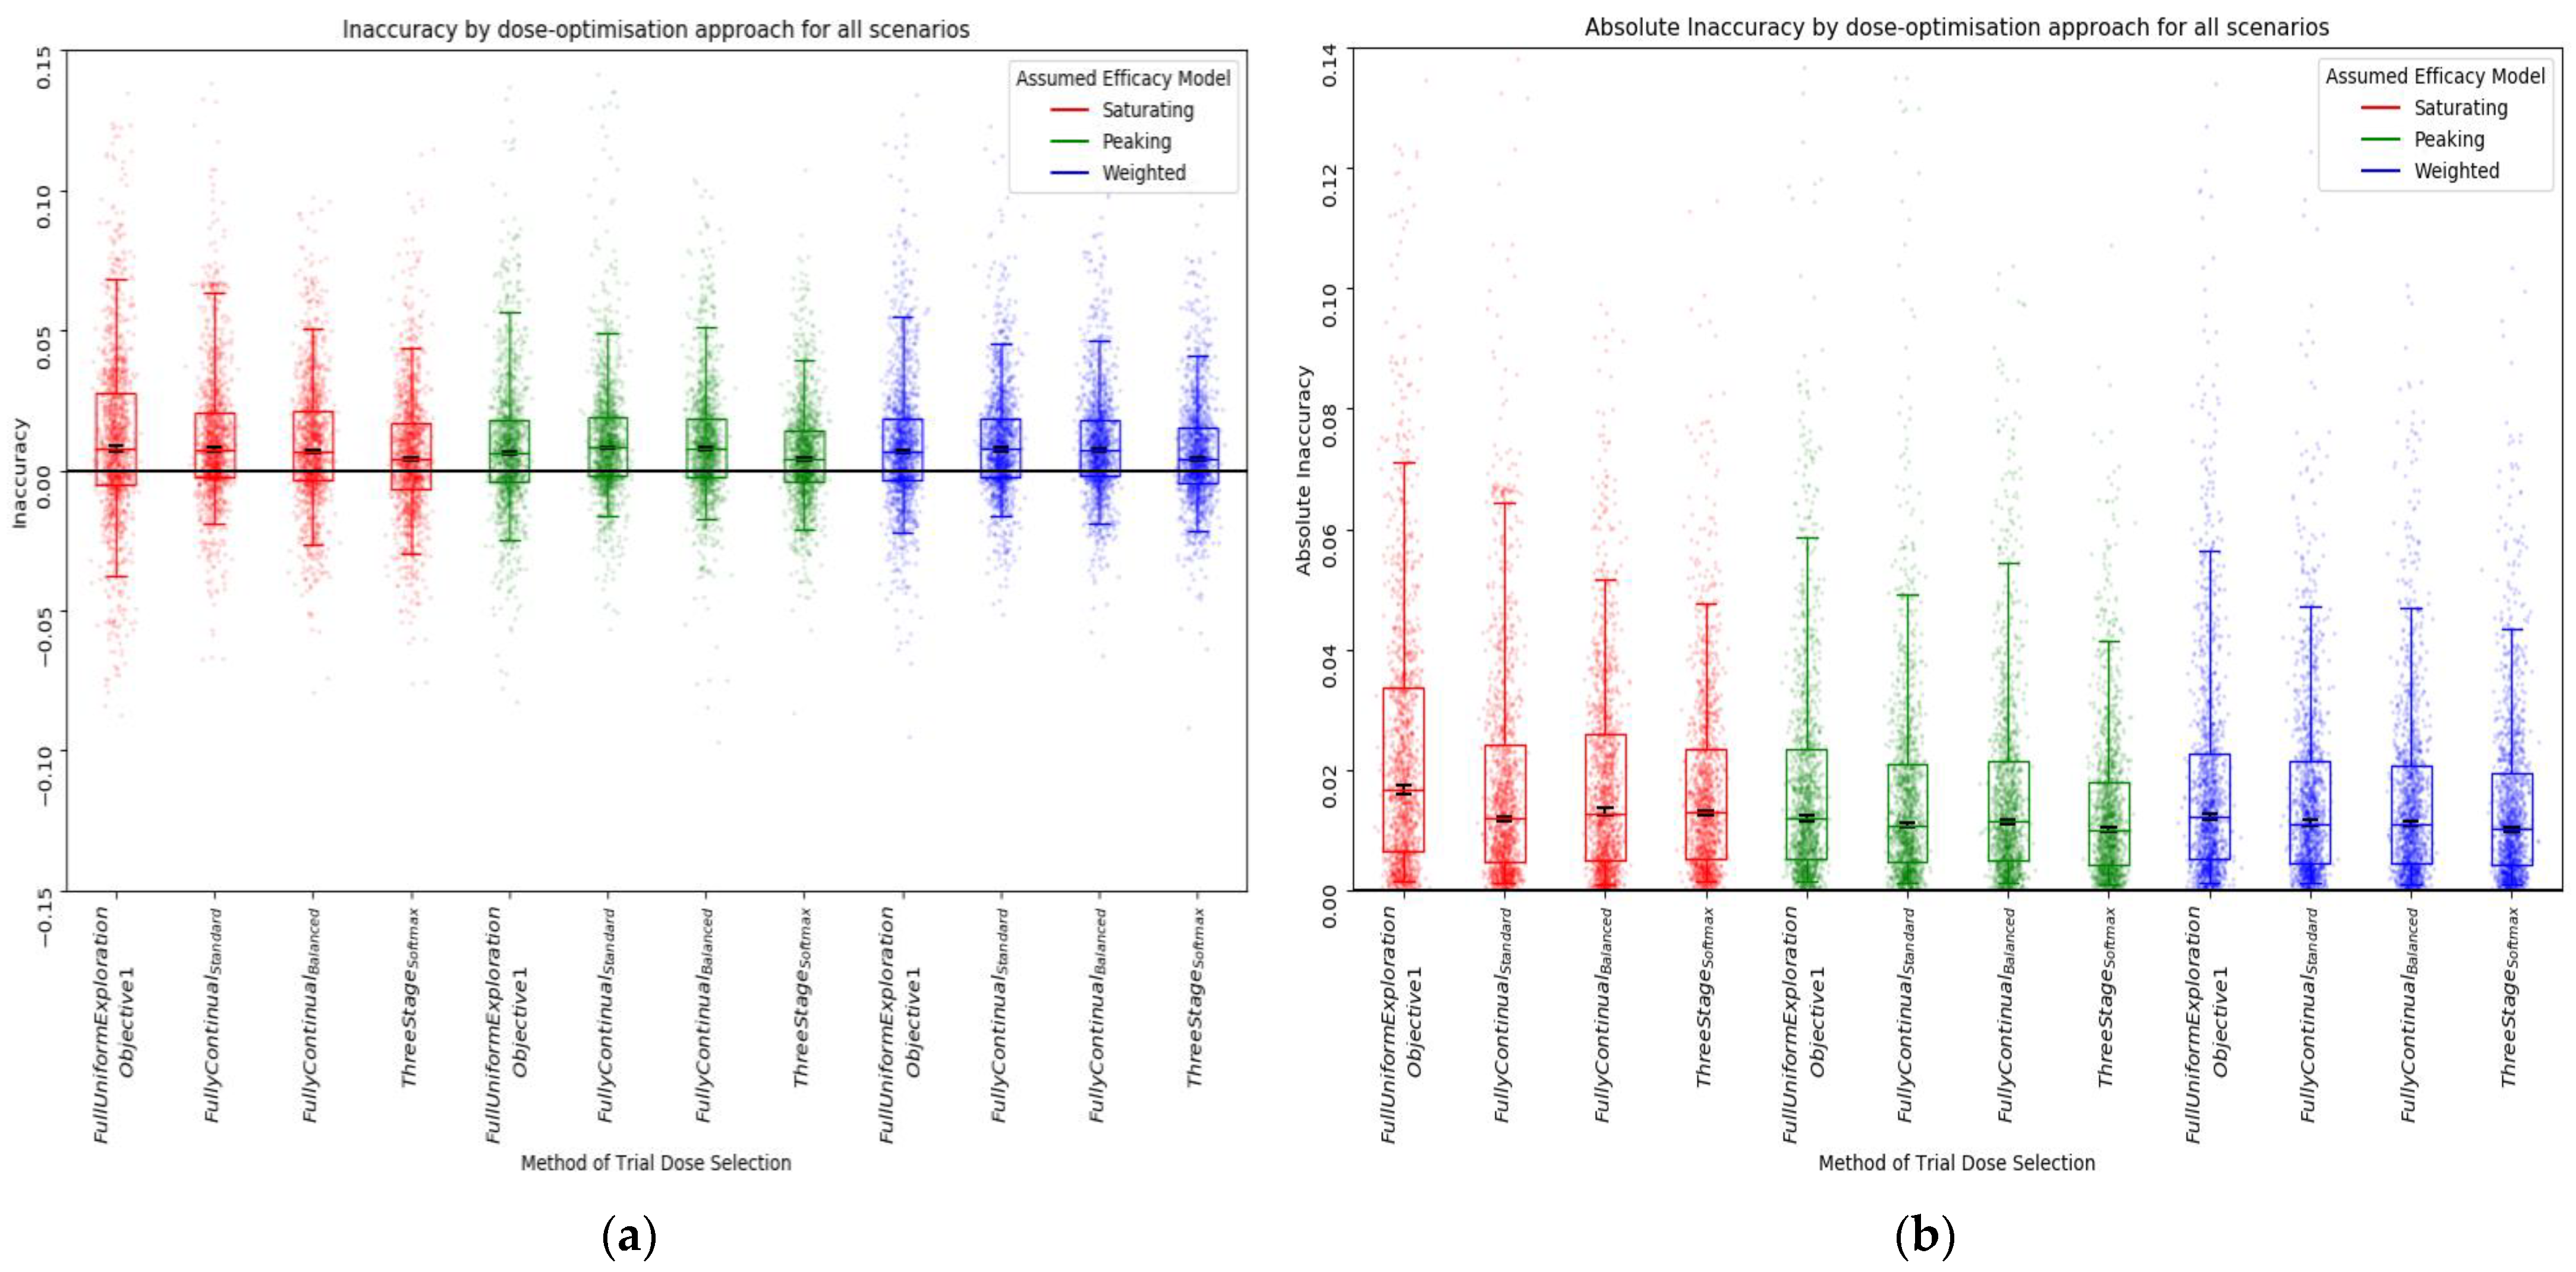
Inaccuracy
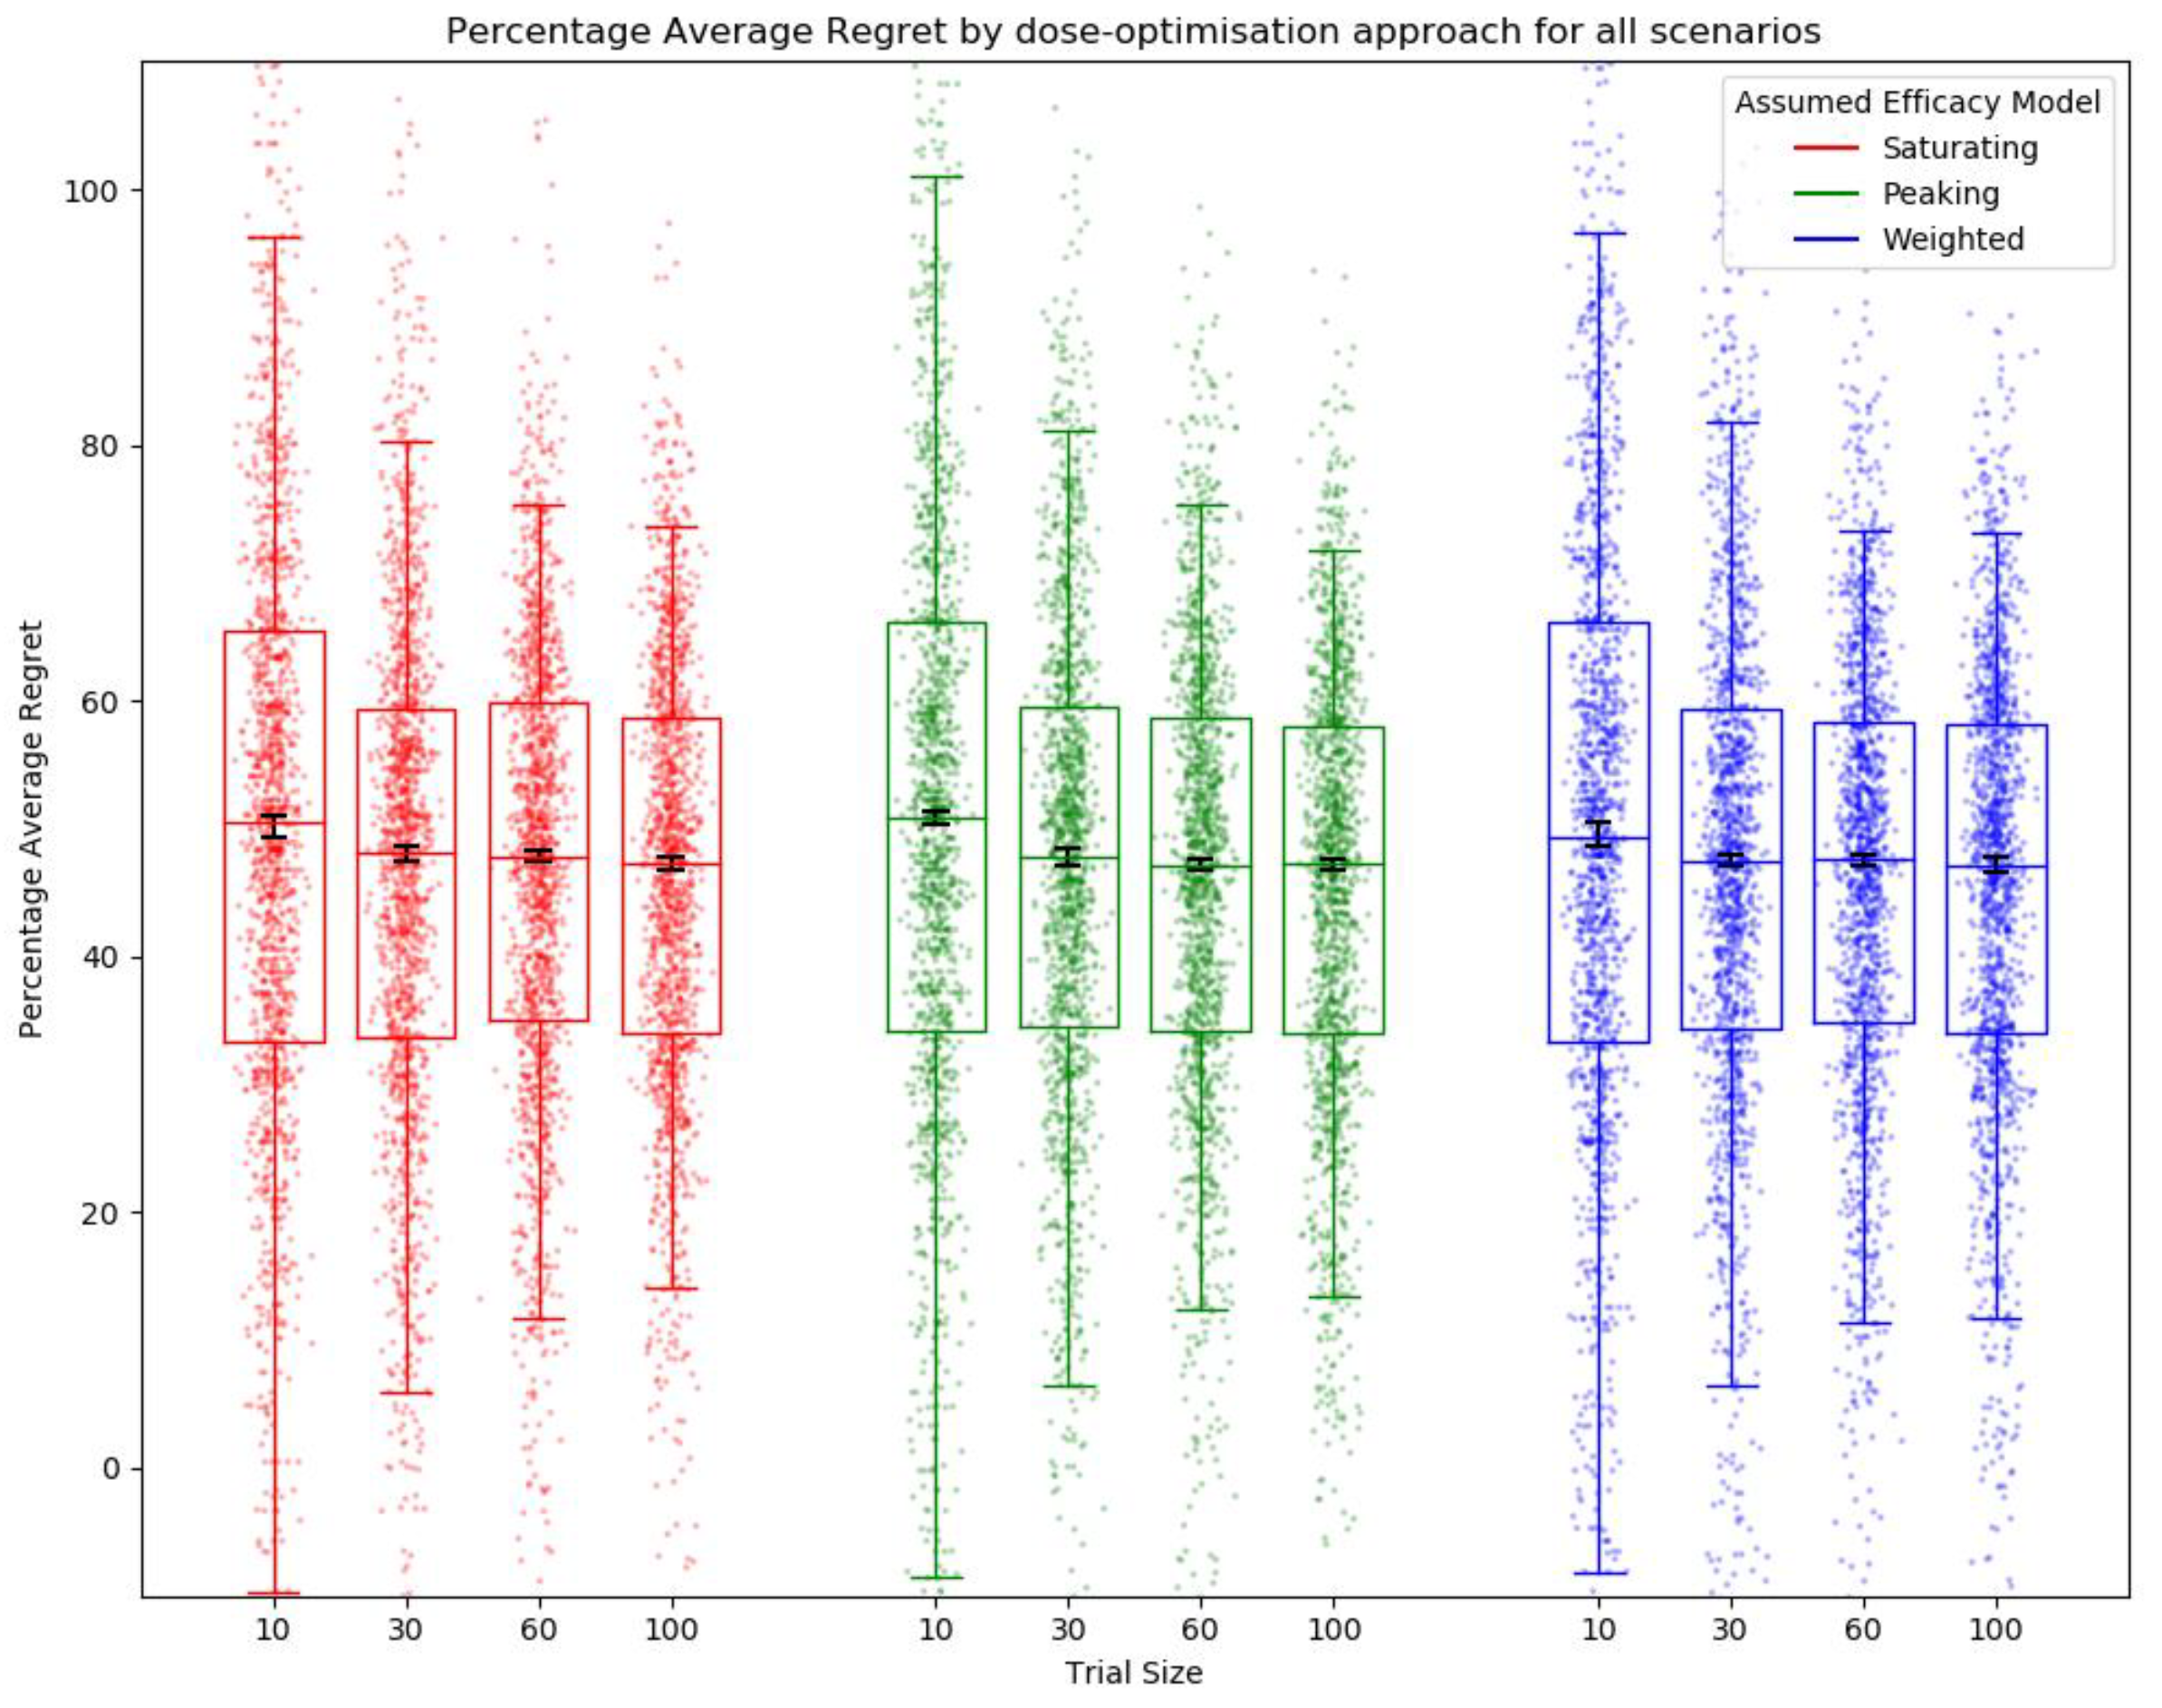
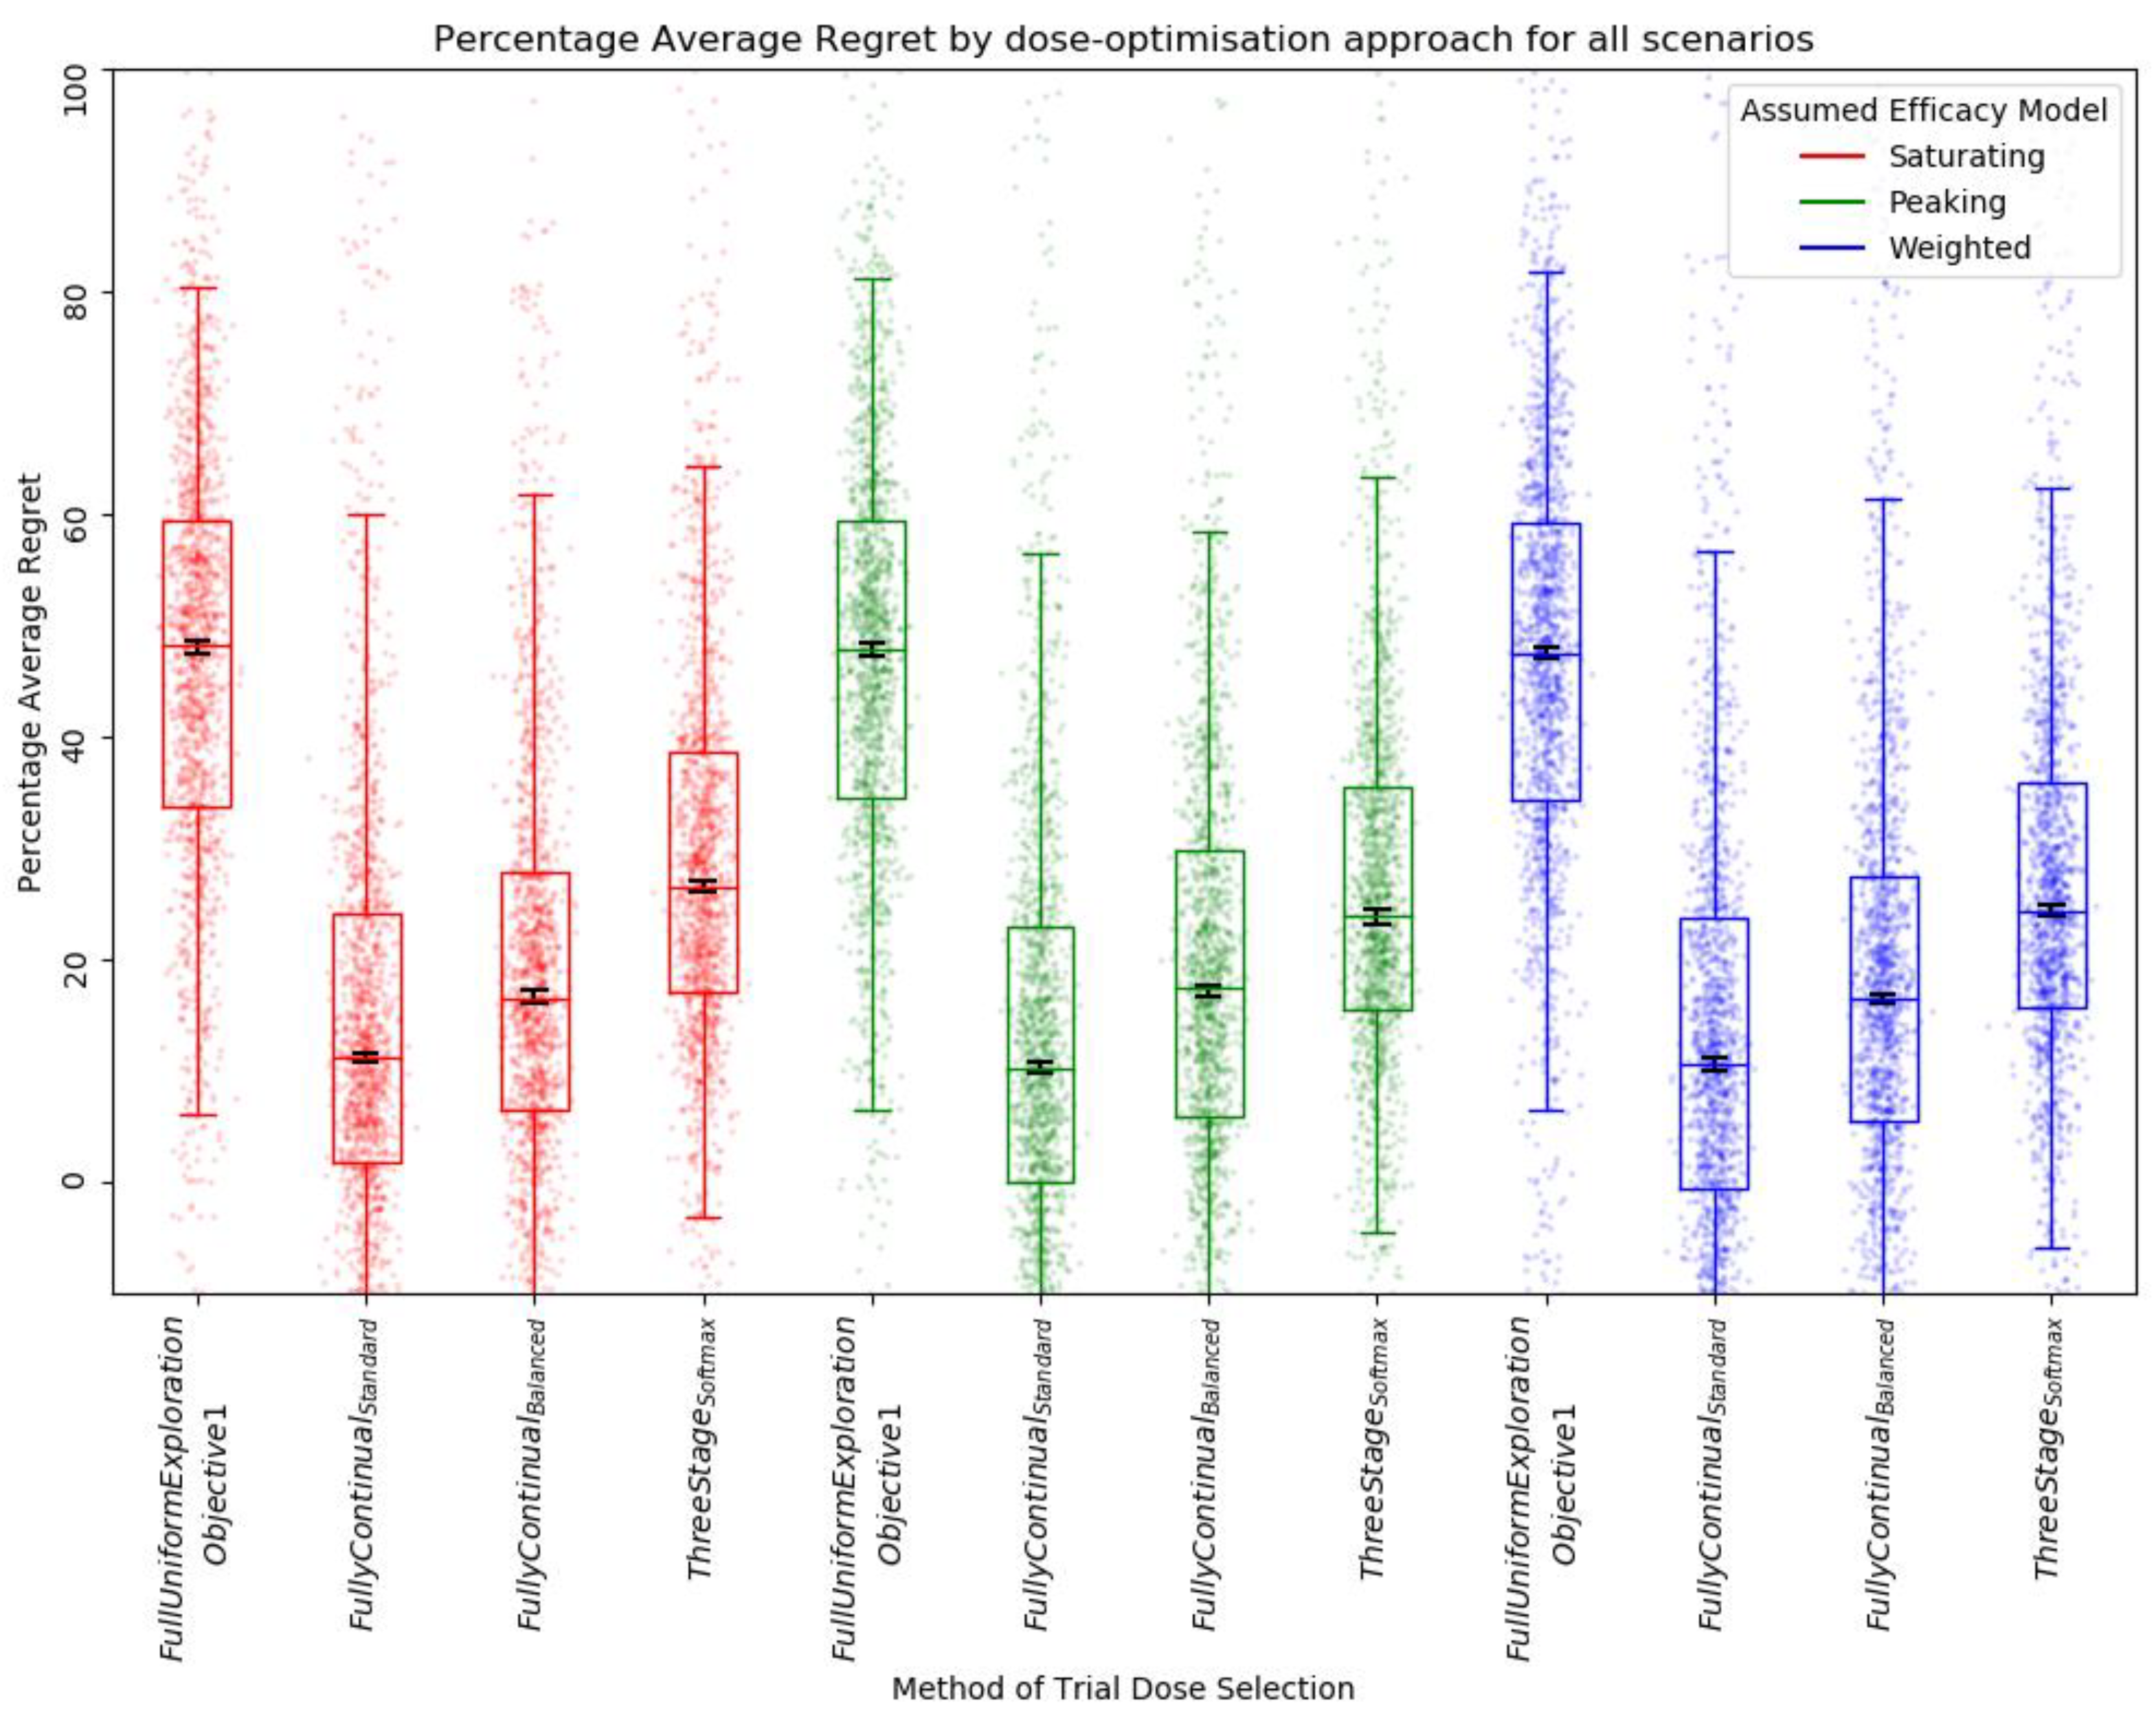
Average Regret
2.7. Objective 2: When Trial Size Is Fixed, How Dose-Optimisation Approaches Are Affected by the Assumed Statistical Efficacy Model and Method of Trial Dose Selection
- i.
- Efficacy model: saturating, peaking, or weighted;
- ii.
- Trial size: 30;
- iii.
- Trial dose-selection method: full uniform exploration, standard fully continual modelling, balanced exploration (softmax) fully continual modelling, or three-stage (softmax).
- Conducting a small trial on a select set of doses;
- Gathering efficacy and toxicity data from this experiment;
- Updating the efficacy and toxicity models based on these data;
- Using the models to select either the next set of doses to test or to select the final dose to predict as ‘optimal’.
2.7.1. Fully Continual Standard
2.7.2. Fully Continual, Balanced Exploration (Softmax)
2.7.3. Three-Stage (Softmax)
- Stage 1.
- a.
- ⅓ of the trial population is dosed following the full uniform exploration approach outlined in objective 1.
- b.
- Efficacy and toxicity models are calibrated using these data and pseudo-data [3.7.5].
- Stage 2.
- a.
- The second ⅓ of the population is dosed according to the utility predictions of the combined efficacy and toxicity models, using the softmax selection method with relatively high exploration.
- b.
- Efficacy and toxicity models are calibrated using these data, data from step one, and downweighted pseudo-data.
- Stage 3.
- a.
- The final ⅓ of the population is dosed according to the utility predictions of the combined efficacy and toxicity models, using the softmax selection method with relatively low exploration.
- b.
- Efficacy and toxicity models are calibrated using all collected data, with pseudo-data being ignored. The predicted optimal dose is selected according to the utility predictions of the combined efficacy and toxicity models.
2.7.4. Dose-Escalation/De-Escalation Rules
2.7.5. Pseudo-Data
2.7.6. Comparison between Approaches/Trial Designs
3. Results
3.1. Objective 1: When the Method of Trial Dose Selection Is Fixed, How Dose-Optimisation Approaches Are Affected by the Assumed Statistical Efficacy Model and Trial Size
3.2. Objective 2: When Trial Size Is Fixed, How Dose-Optimisation Approaches Are Affected by the Assumed Statistical Efficacy Model and Method of Trial Dose Selection
3.2.1. Qualitative Analysis
3.2.2. Quantitative Ranking
4. Discussion
5. Conclusions
Supplementary Materials
Author Contributions
Funding
Institutional Review Board Statement
Informed Consent Statement
Data Availability Statement
Conflicts of Interest
References
- Kaur, R.J.; Dutta, S.; Bhardwaj, P.; Charan, J.; Dhingra, S.; Mitra, P.; Singh, K.; Yadav, D.; Sharma, P.; Misra, S. Adverse Events Reported From COVID-19 Vaccine Trials: A Systematic Review. Indian J. Clin. Biochem. 2021, 36, 427–439. [Google Scholar] [CrossRef] [PubMed]
- Afrough, S.; Rhodes, S.; Evans, T.; White, R.; Benest, J. Immunologic Dose-Response to Adenovirus-Vectored Vaccines in Animals and Humans: A Systematic Review of Dose-Response Studies of Replication Incompetent Adenoviral Vaccine Vectors When Given via an Intramuscular or Subcutaneous Route. Vaccines 2020, 8, 131. [Google Scholar] [CrossRef] [PubMed] [Green Version]
- Handel, A.; Li, Y.; McKay, B.; Pawelek, K.A.; Zarnitsyna, V.; Antia, R. Exploring the Impact of Inoculum Dose on Host Immunity and Morbidity to Inform Model-Based Vaccine Design. PLOS Comput. Biol. 2018, 14, e1006505. [Google Scholar] [CrossRef] [PubMed] [Green Version]
- Rhodes, S.J.; Knight, G.M.; Kirschner, D.E.; White, R.G.; Evans, T.G. Dose Finding for New Vaccines: The Role for Immunostimulation/Immunodynamic Modelling. J. Theor. Biol. 2019, 465, 51–55. [Google Scholar] [CrossRef] [PubMed]
- Boissel, J.-P.; Pérol, D.; Décousus, H.; Klingmann, I.; Hommel, M. Using Numerical Modeling and Simulation to Assess the Ethical Burden in Clinical Trials and How It Relates to the Proportion of Responders in a Trial Sample. PLoS ONE 2021, 16, e0258093. [Google Scholar] [CrossRef]
- Rigaux, C.; Sébastien, B. Evaluation of Non-Linear-Mixed-Effect Modeling to Reduce the Sample Sizes of Pediatric Trials in Type 2 Diabetes Mellitus. J. Pharmacokinet. Pharmacodyn. 2020, 47, 59–67. [Google Scholar] [CrossRef]
- Kim, T.H.; Shin, S.; Shin, B.S. Model-Based Drug Development: Application of Modeling and Simulation in Drug Development. J. Pharm. Investig. 2018, 48, 431–441. [Google Scholar] [CrossRef]
- Gillespie, W.R. Noncompartmental Versus Compartmental Modelling in Clinical Pharmacokinetics. Clin. Pharmacokinet. 1991, 20, 253–262. [Google Scholar] [CrossRef]
- Gabrielsson, J.; Weiner, D. Non-Compartmental Analysis. In Computational Toxicology: Volume I; Reisfeld, B., Mayeno, A.N., Eds.; Methods in Molecular Biology; Humana Press: Totowa, NJ, USA, 2012; pp. 377–389. ISBN 978-1-62703-050-2. [Google Scholar]
- Bonate, P.L. Pharmacokinetic-Pharmacodynamic Modeling and Simulation; Springer Science & Business Media: Berlin, Germany, 2011; ISBN 978-1-4419-9485-1. [Google Scholar]
- Benest, J.; Rhodes, S.; Quaife, M.; Evans, T.G.; White, R.G. Optimising Vaccine Dose in Inoculation against SARS-CoV-2, a Multi-Factor Optimisation Modelling Study to Maximise Vaccine Safety and Efficacy. Vaccines 2021, 9, 78. [Google Scholar] [CrossRef]
- O’Quigley, J.; Pepe, M.; Fisher, L. Continual Reassessment Method: A Practical Design for Phase 1 Clinical Trials in Cancer. Biometrics 1990, 46, 33–48. [Google Scholar] [CrossRef]
- Pallmann, P.; Bedding, A.W.; Choodari-Oskooei, B.; Dimairo, M.; Flight, L.; Hampson, L.V.; Holmes, J.; Mander, A.P.; Odondi, L.; Sydes, M.R.; et al. Adaptive Designs in Clinical Trials: Why Use Them, and How to Run and Report Them. BMC Med. 2018, 16, 29. [Google Scholar] [CrossRef] [PubMed]
- Wheeler, G.M.; Mander, A.P.; Bedding, A.; Brock, K.; Cornelius, V.; Grieve, A.P.; Jaki, T.; Love, S.B.; Odondi, L.; Weir, C.J.; et al. How to Design a Dose-Finding Study Using the Continual Reassessment Method. BMC Med. Res. Methodol. 2019, 19, 18. [Google Scholar] [CrossRef] [PubMed]
- Van Meter, E.M.; Garrett-Mayer, E.; Bandyopadhyay, D. Dose-Finding Clinical Trial Design for Ordinal Toxicity Grades Using the Continuation Ratio Model: An Extension of the Continual Reassessment Method. Clin. Trials Lond. Engl. 2012, 9, 303–313. [Google Scholar] [CrossRef] [PubMed] [Green Version]
- James, G.D.; Symeonides, S.; Marshall, J.; Young, J.; Clack, G. Assessment of Various Continual Reassessment Method Models for Dose-Escalation Phase 1 Oncology Clinical Trials: Using Real Clinical Data and Simulation Studies. BMC Cancer 2021, 21, 1–10. [Google Scholar] [CrossRef] [PubMed]
- Morris, T.P.; White, I.R.; Crowther, M.J. Using Simulation Studies to Evaluate Statistical Methods. Stat. Med. 2019, 38, 2074–2102. [Google Scholar] [CrossRef] [Green Version]
- Takahashi, A.; Suzuki, T. Bayesian Optimization Design for Dose-Finding Based on Toxicity and Efficacy Outcomes in Phase I/II Clinical Trials. Pharm. Stat. 2021, 20, 422–439. [Google Scholar] [CrossRef]
- Andrews, N.; Tessier, E.; Stowe, J.; Gower, C.; Kirsebom, F.; Simmons, R.; Gallagher, E.; Thelwall, S.; Groves, N.; Dabrera, G.; et al. Duration of Protection against Mild and Severe Disease by Covid-19 Vaccines. N. Engl. J. Med. 2022, 386, 340–350. [Google Scholar] [CrossRef]
- Nauta, J. Statistics in Clinical Vaccine Trials: Estimating The Protection Curve. In Statistics in Clinical Vaccine Trials; Springer: Berlin/Heidelberg, Germany, 2011; pp. 108–109. ISBN 978-3-642-44191-2. [Google Scholar]
- Ward, B.J.; Pillet, S.; Charland, N.; Trepanier, S.; Couillard, J.; Landry, N. The Establishment of Surrogates and Correlates of Protection: Useful Tools for the Licensure of Effective Influenza Vaccines? Hum. Vaccines Immunother. 2018, 14, 647–656. [Google Scholar] [CrossRef] [Green Version]
- Nauta, J. Statistics in Clinical Vaccine Trials: Standard Statistical Methods for the Analysis of Immunogenicity Data. In Statistics in Clinical Vaccine Trials; Springer: Berlin/Heidelberg, Germany, 2011; p. 41. ISBN 978-3-642-44191-2. [Google Scholar]
- Voysey, M.; Sadarangani, M.; Pollard, A.J.; Fanshawe, T.R. Computing Threshold Antibody Levels of Protection in Vaccine Clinical Trials: An Assessment of Methodological Bias. PLoS ONE 2018, 13, e0202517. [Google Scholar] [CrossRef] [Green Version]
- Rhodes, S.J.; Zelmer, A.; Knight, G.M.; Prabowo, S.A.; Stockdale, L.; Evans, T.G.; Lindenstrøm, T.; White, R.G.; Fletcher, H. The TB Vaccine H56+IC31 Dose-Response Curve Is Peaked Not Saturating: Data Generation for New Mathematical Modelling Methods to Inform Vaccine Dose Decisions. Vaccine 2016, 34, 6285–6291. [Google Scholar] [CrossRef] [Green Version]
- Wages, N.A.; Slingluff, C.L. Flexible Phase I–II Design for Partially Ordered Regimens with Application to Therapeutic Cancer Vaccines. Stat. Biosci. 2020, 12, 104–123. [Google Scholar] [CrossRef] [PubMed]
- Benest, J.; Rhodes, S.; Afrough, S.; Evans, T.; White, R. Response Type and Host Species May Be Sufficient to Predict Dose-Response Curve Shape for Adenoviral Vector Vaccines. Vaccines 2020, 8, 155. [Google Scholar] [CrossRef] [PubMed] [Green Version]
- O’Quigley, J.; Iasonos, A.; Bornkamp, B. Dose-Response Functions. In Handbook of Methods for Designing and Monitoring Dose Finding Trials; CRC Press: Boca Raton, FL, USA, 2019; p. 199. ISBN 978-0-367-33068-2. [Google Scholar]
- Thall, P.F.; Cook, J.D. Dose-Finding Based on Efficacy–Toxicity Trade-Offs. Biometrics 2004, 60, 684–693. [Google Scholar] [CrossRef] [PubMed]
- Symonds, M.R.E.; Moussalli, A. A Brief Guide to Model Selection, Multimodel Inference and Model Averaging in Behavioural Ecology Using Akaike’s Information Criterion. Behav. Ecol. Sociobiol. 2011, 65, 13–21. [Google Scholar] [CrossRef]
- Sibille, M.; Patat, A.; Caplain, H.; Donazzolo, Y. A Safety Grading Scale to Support Dose Escalation and Define Stopping Rules for Healthy Subject First-Entry-into-Man Studies. Br. J. Clin. Pharmacol. 2010, 70, 736–748. [Google Scholar] [CrossRef] [Green Version]
- Food and Drug Administration. Guidance for Industry: Toxicity Grading Scale for Healthy Adult and Adolescent Volunteers Enrolled in Preventive Vaccine Clinical Trials. Available online: https://fda.gov/media/73679/download (accessed on 7 March 2022).
- Talbi, E.-G. Aggregation Method. In Metaheuristics: From Design to Implementation; John Wiley & Sons: Hoboken, NJ, USA, 2009; pp. 324–326. ISBN 978-0-470-27858-1. [Google Scholar]
- European Mediciens Agency. Visual Risk Contextualisation for Vaxzeria Art.5.3 Referral. Available online: https://www.ema.europa.eu/en/documents/chmp-annex/annex-vaxzevria-art53-visual-risk-contextualisation_en.pdf (accessed on 7 March 2022).
- Moore, S.; Hill, E.M.; Tildesley, M.J.; Dyson, L.; Keeling, M.J. Vaccination and Non-Pharmaceutical Interventions for COVID-19: A Mathematical Modelling Study. Lancet Infect. Dis. 2021, 21, 793–802. [Google Scholar] [CrossRef]
- Salomon, J.A.; Haagsma, J.A.; Davis, A.; de Noordhout, C.M.; Polinder, S.; Havelaar, A.H.; Cassini, A.; Devleesschauwer, B.; Kretzschmar, M.; Speybroeck, N.; et al. Disability Weights for the Global Burden of Disease 2013 Study. Lancet Glob. Health 2015, 3, e712–e723. [Google Scholar] [CrossRef] [Green Version]
- Lattimore, T.; Szepesvári, C. Instance-Dependent Lower Bounds. In Bandit Algorithms; Cambridge University Press: Cambridge, NY, USA, 2020; p. 171. ISBN 978-1-108-57140-1. [Google Scholar]
- Nelder, J.A.; Mead, R. A Simplex Method for Function Minimization. Comput. J. 1965, 7, 308–313. [Google Scholar] [CrossRef]
- Virtanen, P.; Gommers, R.; Oliphant, T.E.; Haberland, M.; Reddy, T.; Cournapeau, D.; Burovski, E.; Peterson, P.; Weckesser, W.; Bright, J.; et al. SciPy 1.0: Fundamental Algorithms for Scientific Computing in Python. Nat. Methods 2020, 17, 261–272. [Google Scholar] [CrossRef] [Green Version]
- David, S.; Kim, P.Y. Drug Trials. In StatPearls; StatPearls Publishing: Treasure Island, FL, USA, 2022. [Google Scholar]
- The 5 Stages of COVID-19 Vaccine Development: What You Need to Know about How a Clinical Trial Works|Johnson & Johnson. Available online: https://www.jnj.com/innovation/the-5-stages-of-covid-19-vaccine-development-what-you-need-to-know-about-how-a-clinical-trial-works (accessed on 7 March 2022).
- Food and Drug Administration. Step 3: Clinical Research. Available online: https://www.fda.gov/patients/drug-development-process/step-3-clinical-research (accessed on 7 March 2022).
- Villar, S.S.; Bowden, J.; Wason, J. Multi-Armed Bandit Models for the Optimal Design of Clinical Trials: Benefits and Challenges. Stat. Sci. Rev. J. Inst. Math. Stat. 2015, 30, 199–215. [Google Scholar] [CrossRef]
- Reverdy, P.; Leonard, N.E. Parameter Estimation in Softmax Decision-Making Models with Linear Objective Functions. IEEE Trans. Autom. Sci. Eng. 2016, 13, 54–67. [Google Scholar] [CrossRef] [Green Version]
- Vamplew, P.; Dazeley, R.; Foale, C. Softmax Exploration Strategies for Multiobjective Reinforcement Learning. Neurocomputing 2017, 263, 74–86. [Google Scholar] [CrossRef] [Green Version]
- Saari, D.G.; Merlin, V.R. The Copeland Method: I.: Relationships and the Dictionary. Econ. Theory 1996, 8, 51–76. [Google Scholar] [CrossRef]
- Talbi, E.-G. Ordinal Data Analysis. In Metaheuristics: From Design to Implementation; John Wiley & Sons: Hoboken, NJ, USA, 2009; p. 65. ISBN 978-0-470-27858-1. [Google Scholar]
- Conover, W.J. Practical Nonparametric Statistics; Wiley Series in Probability and Statistics; Chapter 3; Applied Probability and Statistics Section; Wiley: New York, NY, USA, 1999; ISBN 978-0-471-16068-7. [Google Scholar]
- Hobbs, B.F.; Hepenstal, A. Is Optimization Optimistically Biased? Water Resour. Res. 1989, 25, 152–160. [Google Scholar] [CrossRef]
- Ito, S.; Yabe, A.; Fujimaki, R. Unbiased Objective Estimation in Predictive Optimization. In Proceedings of the 35th International Conference on Machine Learning, Stockholm, Sweden, 3 July 2018. [Google Scholar]
- Diniz, M.A.; Tighiouart, M.; Rogatko, A. Comparison between Continuous and Discrete Doses for Model Based Designs in Cancer Dose Finding. PLoS ONE 2019, 14, e0210139. [Google Scholar] [CrossRef]
- Jamieson, K.; Nowak, R. Best-Arm Identification Algorithms for Multi-Armed Bandits in the Fixed Confidence Setting. In Proceedings of the 2014 48th Annual Conference on Information Sciences and Systems (CISS), Princeton, NJ, USA, 19–21 March 2014; IEEE: Princeton, NJ, USA, 2014; pp. 1–6. [Google Scholar]
- Kaibel, C.; Biemann, T. Rethinking the Gold Standard With Multi-Armed Bandits: Machine Learning Allocation Algorithms for Experiments. Organ. Res. Methods 2021, 24, 78–103. [Google Scholar] [CrossRef]
- Talbi, E.-G. Statistical Analysis. In Metaheuristics: From Design to Implementation; John Wiley & Sons: Hoboken, NJ, USA, 2009; pp. 63–64. ISBN 978-0-470-27858-1. [Google Scholar]
- Morton, V.; Torgerson, D.J. Effect of Regression to the Mean on Decision Making in Health Care. BMJ 2003, 326, 1083–1084. [Google Scholar] [CrossRef] [Green Version]
- van Hasselt, H.; Guez, A.; Silver, D. Deep Reinforcement Learning with Double Q-Learning. In Proceedings of the Thirtieth AAAI Conference on Artificial Intelligence, Phoenix, AZ, USA, 12–17 February 2016; AAAI Press: Palo Alto, CA, USA, 2016; pp. 2094–2100. [Google Scholar]
- Tokic, M.; Palm, G. Value-Difference Based Exploration: Adaptive Control between Epsilon-Greedy and Softmax. In KI 2011: Advances in Artificial Intelligence; Lecture Notes in Computer Science; Bach, J., Edelkamp, S., Eds.; Springer: Berlin/Heidelberg, Germany, 2011; Volume 7006, pp. 335–346. ISBN 978-3-642-24454-4. [Google Scholar]
- Aziz, M.; Kaufmann, E.; Riviere, M.-K. On Multi-Armed Bandit Designs for Dose-Finding Trials. J. Mach. Learn. Res. 2021, 22, 1–38. [Google Scholar]
- Audet, C.; Hare, W. Optimization Using Surrogates and Models. In Derivative-Free and Blackbox Optimization; Springer Series in Operations Research and Financial Engineering; Springer International Publishing: Cham, Switzerland, 2017; p. 235. ISBN 978-3-319-68913-5. [Google Scholar]
- Brock, K.; Billingham, L.; Copland, M.; Siddique, S.; Sirovica, M.; Yap, C. Implementing the EffTox Dose-Finding Design in the Matchpoint Trial. BMC Med. Res. Methodol. 2017, 17, 112. [Google Scholar] [CrossRef] [Green Version]
- Lee, S.M.; Cheng, B.; Cheung, Y.K. Continual Reassessment Method with Multiple Toxicity Constraints. Biostat. Oxf. Engl. 2011, 12, 386–398. [Google Scholar] [CrossRef] [Green Version]
- Cai, C.; Rahbar, M.H.; Hossain, M.M.; Yuan, Y.; Gonzales, N.R. A Placebo-Controlled Bayesian Dose Finding Design Based on Continuous Reassessment Method with Application to Stroke Research. Contemp. Clin. Trials Commun. 2017, 7, 11–17. [Google Scholar] [CrossRef] [PubMed]
- Le Tourneau, C.; Lee, J.J.; Siu, L.L. Dose Escalation Methods in Phase I Cancer Clinical Trials. JNCI J. Natl. Cancer Inst. 2009, 101, 708–720. [Google Scholar] [CrossRef] [PubMed] [Green Version]
- Tighiouart, M.; Cook-Wiens, G.; Rogatko, A. A Bayesian Adaptive Design for Cancer Phase I Trials Using a Flexible Range of Doses. J. Biopharm. Stat. 2018, 28, 562–574. [Google Scholar] [CrossRef]
- Du, Z.; Wang, L.; Pandey, A.; Lim, W.W.; Chinazzi, M.; Piontti, A.P.Y.; Lau, E.H.Y.; Wu, P.; Malani, A.; Cobey, S.; et al. Modeling Comparative Cost-Effectiveness of SARS-CoV-2 Vaccine Dose Fractionation in India. Nat. Med. 2022, 28, 1–5. [Google Scholar] [CrossRef] [PubMed]
- Emmerich, M.T.M.; Deutz, A.H. A Tutorial on Multiobjective Optimization: Fundamentals and Evolutionary Methods. Nat. Comput. 2018, 17, 585–609. [Google Scholar] [CrossRef] [Green Version]
- Shavarani, S.M.; López-Ibáñez, M.; Knowles, J. Realistic Utility Functions Prove Difficult for State-of-the-Art Interactive Multiobjective Optimization Algorithms. In Proceedings of the Genetic and Evolutionary Computation Conference, Lille, France, 26 June 2021; ACM: Lille, France; pp. 457–465. [Google Scholar]
- O’Quigley, J.; Shen, L.Z. Continual Reassessment Method: A Likelihood Approach. Biometrics 1996, 52, 673–684. [Google Scholar] [CrossRef]
- Zarnitsyna, V.I.; Handel, A.; McMaster, S.R.; Hayward, S.L.; Kohlmeier, J.E.; Antia, R. Mathematical Model Reveals the Role of Memory CD8 T Cell Populations in Recall Responses to Influenza. Front. Immunol. 2016, 7, 165. [Google Scholar] [CrossRef] [Green Version]
- Randomisation. Fundamentals of Clinical Trials; Friedman, L.M., Ed.; Springer: Cham, Switzerland, 2015; pp. 123–145. ISBN 978-3-319-18538-5. [Google Scholar]
- McDonald, I.; Murray, S.M.; Reynolds, C.J.; Altmann, D.M.; Boyton, R.J. Comparative Systematic Review and Meta-Analysis of Reactogenicity, Immunogenicity and Efficacy of Vaccines against SARS-CoV-2. NPJ Vaccines 2021, 6, 1–14. [Google Scholar] [CrossRef]
- Glass, E.J. Genetic Variation and Responses to Vaccines. Anim. Health Res. Rev. 2004, 5, 197–208. [Google Scholar] [CrossRef]
- Hodges, J.L. The Significance Probability of the Smirnov Two-Sample Test. Ark. För Mat. 1958, 3, 469–486. [Google Scholar] [CrossRef]
- Mann, H.B.; Whitney, D.R. On a Test of Whether One of Two Random Variables Is Stochastically Larger than the Other. Ann. Math. Stat. 1947, 18, 50–60. [Google Scholar] [CrossRef]
- Weisstein, E.W. Bonferroni Correction. Available online: https://mathworld.wolfram.com/ (accessed on 11 April 2022).


| Adverse Reaction Grade | General Description |
|---|---|
| 0 | None. |
| 1 | Mild. Does not interfere with normal activity. |
| 2 | Moderate. Interference with normal activity. Little or no treatment required. |
| 3 | Severe. Prevents normal activity. Requires treatment. |
| Aggregate of Simple Regret, Absolute Inaccuracy, and Average Regret | Simple Regret | Absolute Inaccuracy | Average Regret | |||||
|---|---|---|---|---|---|---|---|---|
| Approach | Rank | Score | Rank | Score | Rank | Score | Rank | Score |
| Weighted, Fully Continual, Balanced | 8 | 0.570 | 1 | 0.564 | 3 | 0.522 | 4 | 0.625 |
| Peaking, Fully Continual, Standard | 12 | 0.572 | 7 | 0.498 | 4 | 0.517 | 1 | 0.701 |
| Peaking, Softmax Three Stage | 12 | 0.536 | 4 | 0.552 1 | 1 | 0.556 | 7 | 0.500 |
| Peaking, Fully Continual, Balanced | 14 | 0.557 | 3 | 0.552 1 | 6 | 0.510 | 5 | 0.610 |
| Weighted, Fully Continual, Standard | 15 | 0.565 | 8 | 0.485 | 5 | 0.514 | 2 | 0.698 |
| Weighted, Softmax Three Stage | 15 | 0.528 | 5 | 0.541 | 2 | 0.549 | 8 | 0.493 |
| Saturating, Fully Continual, Standard | 20 | 0.543 | 10 | 0.447 | 7 | 0.492 | 3 | 0.691 |
| Peaking, Full uniform exploration | 24 | 0.414 | 2 | 0.563 | 10 | 0.480 | 12 | 0.201 |
| Saturating, Fully Continual, Balanced | 24 | 0.519 | 9 | 0.463 | 9 | 0.486 | 6 | 0.609 |
| Saturating, Softmax Three Stage | 28 | 0.465 | 11 | 0.442 | 8 | 0.489 | 9 | 0.465 |
| Weighted, Full uniform exploration | 28 | 0.400 | 6 | 0.516 | 11 | 0.480 | 11 | 0.203 |
| Saturating, Full uniform exploration | 34 | 0.330 | 12 | 0.378 | 12 | 0.406 | 10 | 0.205 |
Publisher’s Note: MDPI stays neutral with regard to jurisdictional claims in published maps and institutional affiliations. |
© 2022 by the authors. Licensee MDPI, Basel, Switzerland. This article is an open access article distributed under the terms and conditions of the Creative Commons Attribution (CC BY) license (https://creativecommons.org/licenses/by/4.0/).
Share and Cite
Benest, J.; Rhodes, S.; Evans, T.G.; White, R.G. Mathematical Modelling for Optimal Vaccine Dose Finding: Maximising Efficacy and Minimising Toxicity. Vaccines 2022, 10, 756. https://doi.org/10.3390/vaccines10050756
Benest J, Rhodes S, Evans TG, White RG. Mathematical Modelling for Optimal Vaccine Dose Finding: Maximising Efficacy and Minimising Toxicity. Vaccines. 2022; 10(5):756. https://doi.org/10.3390/vaccines10050756
Chicago/Turabian StyleBenest, John, Sophie Rhodes, Thomas G. Evans, and Richard G. White. 2022. "Mathematical Modelling for Optimal Vaccine Dose Finding: Maximising Efficacy and Minimising Toxicity" Vaccines 10, no. 5: 756. https://doi.org/10.3390/vaccines10050756