Article

A Functional NIRS Study of Brain Functional Networks Induced by Social Time Coordination

1
Graduate School of Life and Medical Sciences, Doshisha University, 1-3 Tatara Miyakodani, Kyotanabe, Kyoto 610-0394, Japan
2
Faculty of Life and Medical Sciences, Doshisha University, 1-3 Tatara Miyakodani, Kyotanabe, Kyoto 610-0394, Japan
*
Author to whom correspondence should be addressed.
Brain Sci. 2019, 9(2), 43; https://doi.org/10.3390/brainsci9020043
Submission received: 6 February 2019 / Revised: 12 February 2019 / Accepted: 14 February 2019 / Published: 15 February 2019
(This article belongs to the Special Issue Collection on Cognitive Neuroscience)

Abstract

:
The ability to coordinate one’s behavior with the others’ behavior is essential to achieve a joint action in daily life. In this paper, the brain activity during synchronized tapping task was measured using functional near infrared spectroscopy (fNIRS) to investigate the relationship between time coordination and brain function. Furthermore, using brain functional network analysis based on graph theory, we examined important brain regions and network structures that serve as the hub when performing the synchronized tapping task. Using the data clustering method, two types of brain function networks were extracted and associated with time coordination, suggesting that they were involved in expectation and imitation behaviors.

1. Introduction

Joint action are social interactions in which more than two people coordinate their behavior to change the environment. In daily life, the ability to coordinate one’s behavior with the others’ behavior is essential to achieve a joint action, which is one of the most important components of social interaction [1,2,3]. Neural mechanisms for temporal coordination with external stimuli have been studied using finger-tapping tasks [4]. It reveals that we tend to respond predictively, and not imitatively, to stimuli whose intervals are short and periodic.
It has also been reported that temporal synchronization with periodic stimuli is associated with brain activation in the primary sensorimotor area, ipsilateral cerebellum, premotor cortex, supplementary motor area, and superior temporal gyrus [5,6]. Many studies have focused on the brain activity in responding to periodic or random stimuli; however, the external stimuli in the case of a joint action in daily life is neither periodic nor completely random [7,8]. The joint action can be achieved by temporal coordination between interacting partners, and also by predicting or imitating each other’s behavior. The rhythm of the partner’s behavior can be predicted on the basis of the partner’s intention, strategy, character, and so on. The predictive behavior forms a key component of social interaction.
As one of the simulation models considered herein, for the analysis of the joint action, we focused on the neural basis of temporal coordination with the external stimulus whose interval was non-periodic but predictive. According to our hypothesis, there are two strategies for this coordination: (1) an active strategy by responding prior to the stimulus occurrence; and (2) a passive strategy by following up the stimulus occurrence. Therefore, we aimed to detect the brain activity patterns associated with these two strategies.
The brain activity during a response to the auditory cues was measured using functional near infrared spectroscopy (fNIRS), which quantifies the changes in hemoglobin (Hb) concentration [9]. Although functional magnetic resonance imaging (fMRI), which works on the principle of magnetism, is traditionally used for measuring brain activity, the method has several disadvantages, such as the equipment is noisy and it adds many constraints to the experimental environment. On the other hand, fNIRS can measure brain activity in a condition closer to real life, and it is suitable for experiments involving the use of sound as the equipment noise is less intense than that of fMRI. Moreover, fNIRS is superior in temporal resolution, and we think that it is more suitable for measuring the brain activity for dynamically changing behavior. Furthermore, clinical studies and research on infants employ fNIRS because it is less restrictive for subjects and is highly safe, and, thus, fNIRS has also attracted the attention of the social brain researchers [10].
Furthermore, functional connectivity, which is defined as a statistical dependence between distant neurophysiological activities, has been studied recently. In particular, connectomics, in which statistical correlations between brain regions are analyzed as a brain network, has become an active field of research [11,12,13]. Rubinov et al. [14] proposed a method to analyze the features of a functional-network structure based on the graph theory, and revealed the network structures unique to specific diseases by analyzing specific cognitive states using the metrics of graph theory.
In this study, the brain activity patterns were investigated in terms of the brain functional-network structure using graph theoretical analysis.

2. Materials and Methods

2.1. Participants

Twenty healthy subjects (aged 22 ± 0.6 years, 10 females, all right handed) participated in this experiment after giving written informed consent. This study was carried out in accordance with the research ethics committee of Doshisha University, Kyoto, Japan (approval code: 15098). The room temperature and humidity were controlled during the experiment (21.8 ± 1.0 ° C , and 78.8 ± 3.6%). Participants performed a synchronized tapping task, and we measured their brain activities during the task using fNIRS.

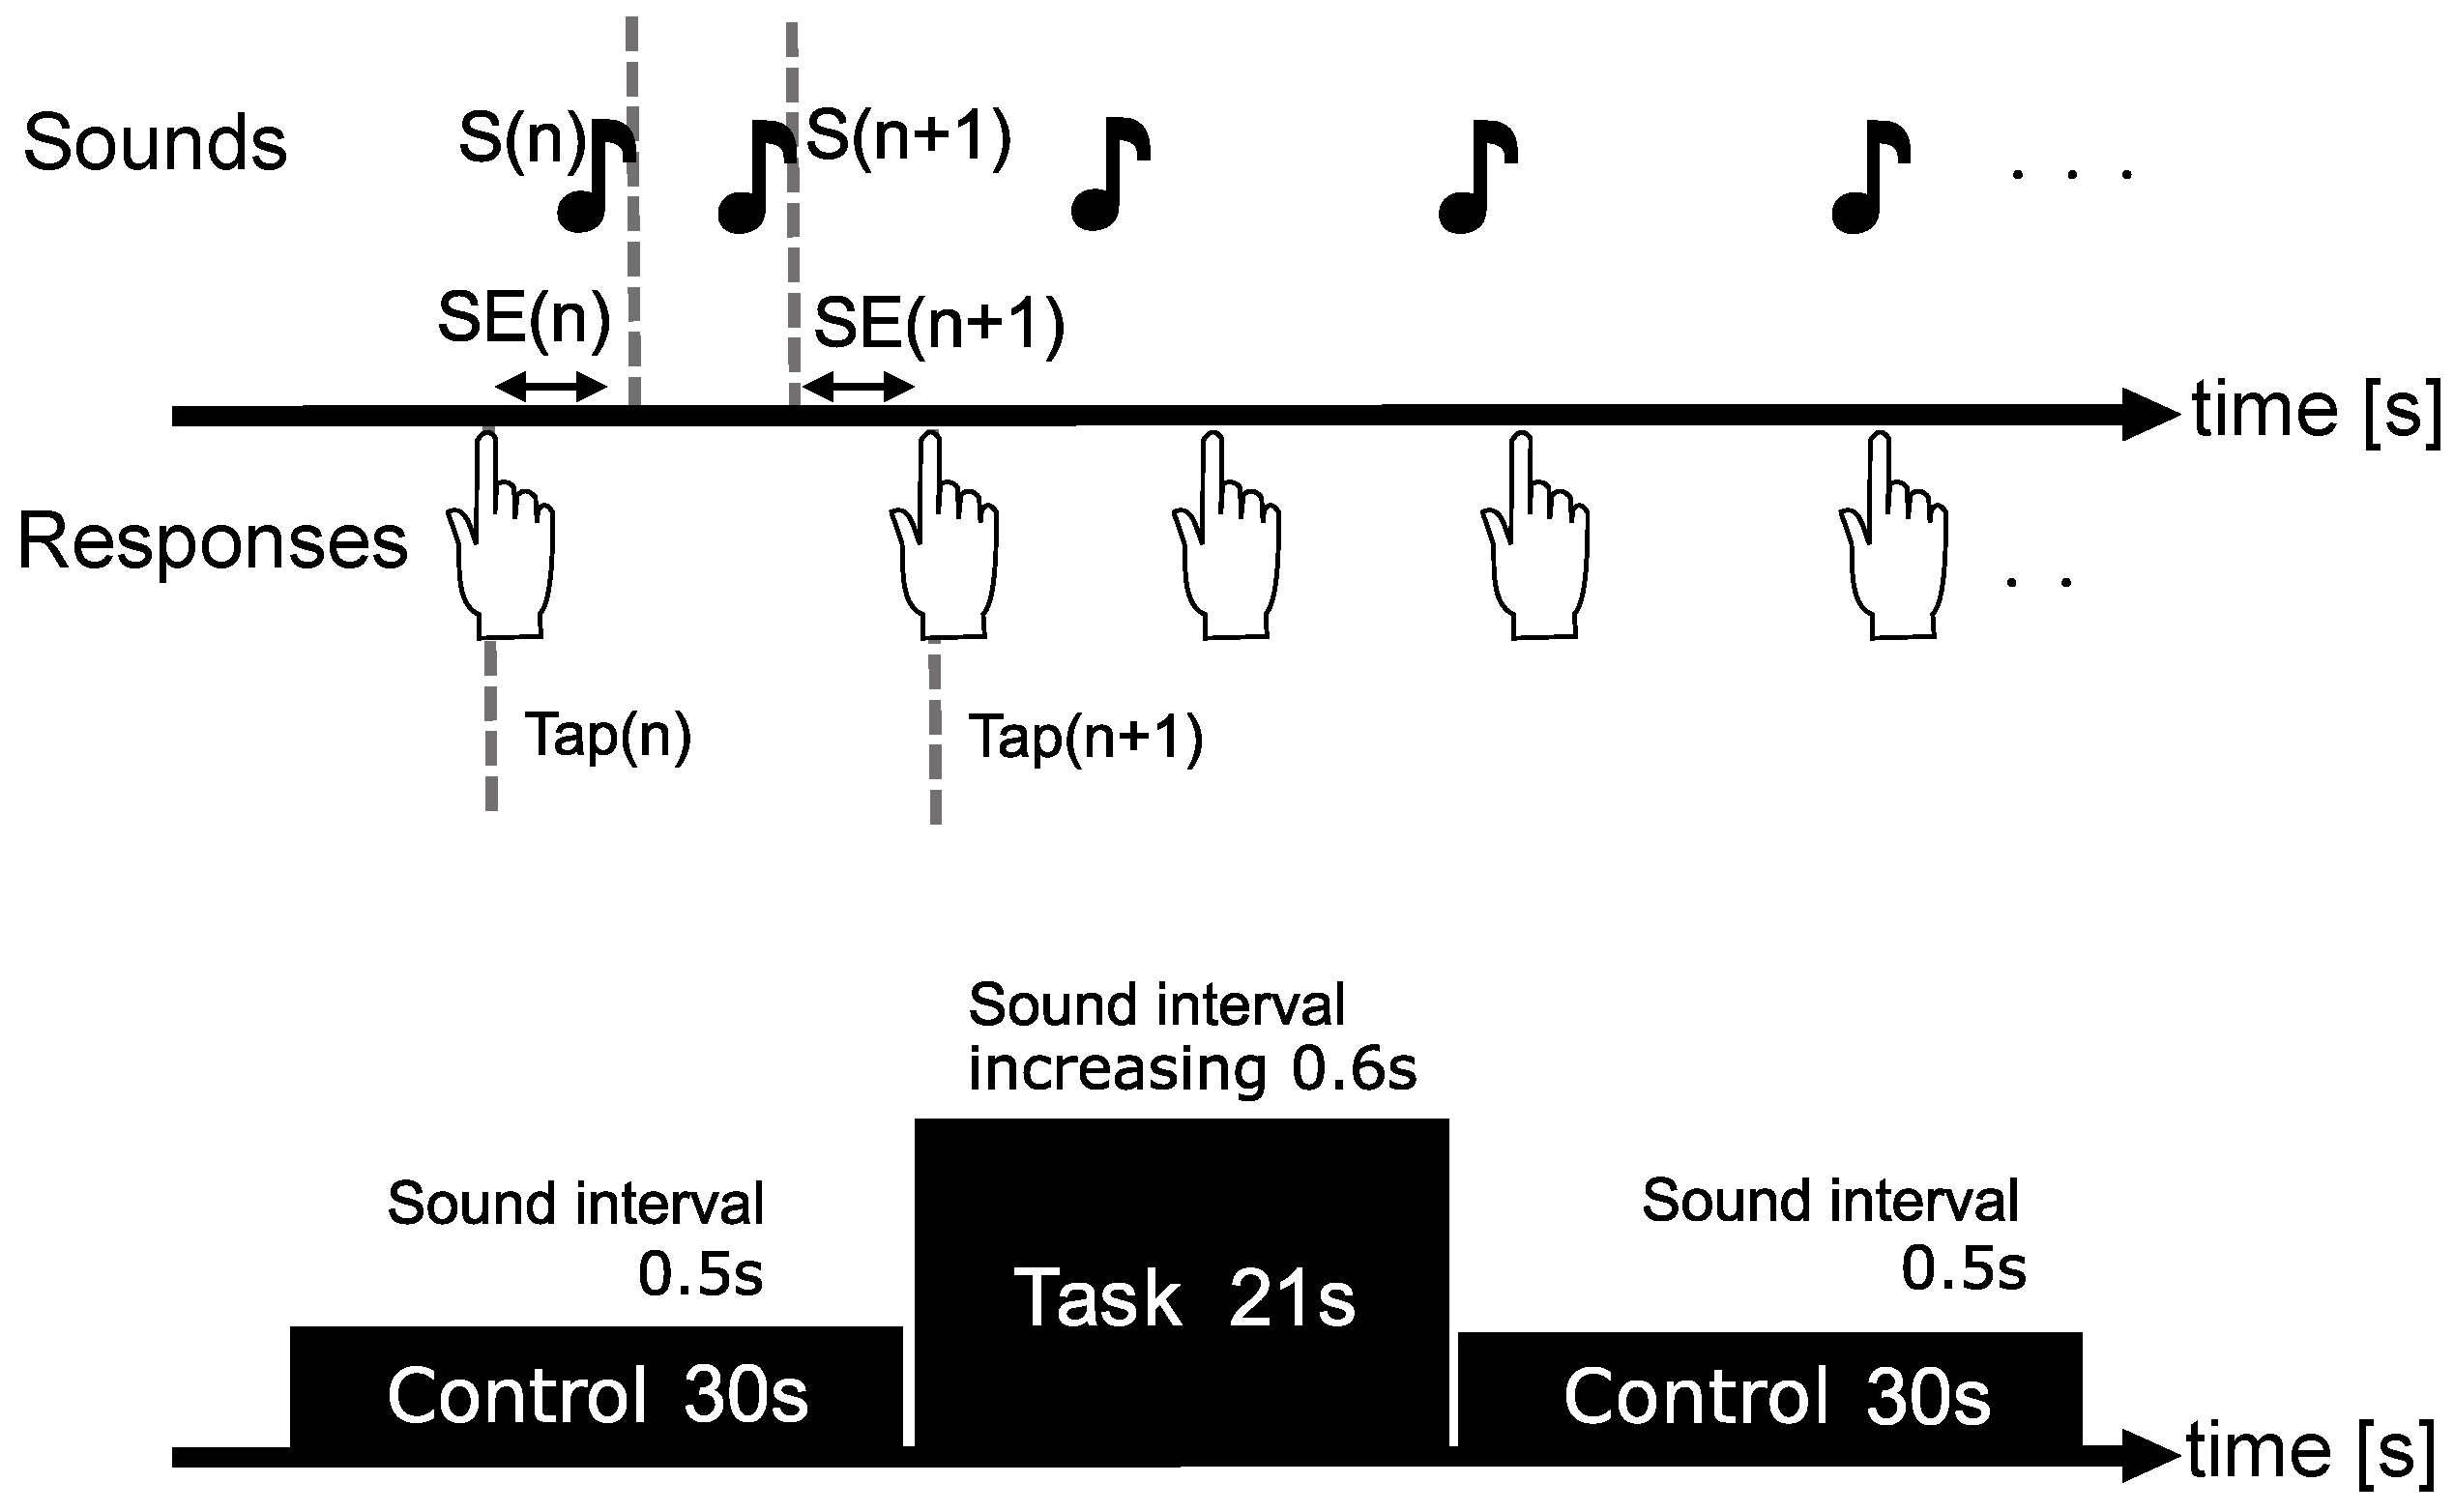
2.2. Behavioral Data Acquisition

The Synchronized Tapping Task

The synchronized tapping task involved synchronization of tapping with a sound stimulus. Figure 1 shows the experimental design. The experiment consisted of pre-control, task, and post-control phases. The pre-scan time of the fNIRS measurement for the baseline correction was set to 20 s before pre-control. During the control block, the sound was presented at 0.5 s intervals for 30 s. For the task block, sound was presented for 21 s with increasing time intervals of 0.6 ± 0.03 s. Sound stimulus was presented seven times. The subjects were instructed to watch the fixation point on the screen and to press the button in synchrony with the sound presented during both the control and the task block. Sound was presented through an earphone (ATH–ANC 23 Audio Technica Corporation, Tokyo, Japan) and a sine wave of 500 Hz lasting 0.1 s was used. The experiment was implemented with Presentation software (Neurobehavioral system Inc., Albany, NS, Canada). We recorded the subject’s response using a keyboard, and the difference between their response time and stimulus presentation time was used as an indicator of their performances.

2.3. fNIRS Data Acquisition

The subjects sat in front of a personal computer and performed the synchronized tapping task. The oxy- and the deoxy-Hb concentrations were measured using ETG-7100 fNIRS system (Hitachi, Ltd., Tokyo, Japan), with a sampling frequency of 10 Hz. An fNIRS system consists of irradiation probes and detection probes that are placed on the human head. Near-infrared signals are injected from the irradiation probes into the brain surface, where they diffuse into the cerebral tissue up to a depth of 20–30 mm. Two wavelengths of near-infrared light (695 and 830 nm) were used, and the light reflected by the oxy- or the deoxy-Hb could be distinguished by detection probes. The relative changes in the oxy- and deoxy-Hb concentrations were calculated on the basis of the modified Beer–Lambert law [15]. Figure 2 shows the locations of the fNIRS measurement probes. Two sets of 3 × 10 probes (15 emitters and 15 detecters, forming 47 measurement channels) were attached to the forehead and occipital regions, respectively, according to the reference point of the International 10–20 system. Besides, a 3 × 5 probe set (8 emitters and 7 detecters, forming 22 channels) was attached to the top head region. In total, 116 channels covering the whole brain were set. Each inter-probe distance was fixed at 30 mm. We used a 3D magnetic digitizer stylus (PATRIOT, Polhemus, Colchester, VT, USA) to obtain the relative locations of 10–20 standard positions and fNIRS probes in a real-world coordinate system.

2.4. fNIRS Data Processing

2.4.1. Preprocessing

The obtained fNIRS data were band-pass filtered (pass-band: 0.010 Hz to 0.33 Hz) [16,17]. Oxy-Hb data changed per unit time. A step where the change exceeded 0.1 mM·mm was regarded as a motion artifact [18], and the channel data that included such values were excluded from the analysis. Moreover, spatial registration of fNIRS channel location to Montreal Neurological Institute (MNI) space was performed using probabilistic registration and virtual registration toolboxes (available at http://www.jichi.ac.jp/brainlab/tools.html) on the platform for optical topography analysis tools (POTATo) developed by Hitachi, Ltd.

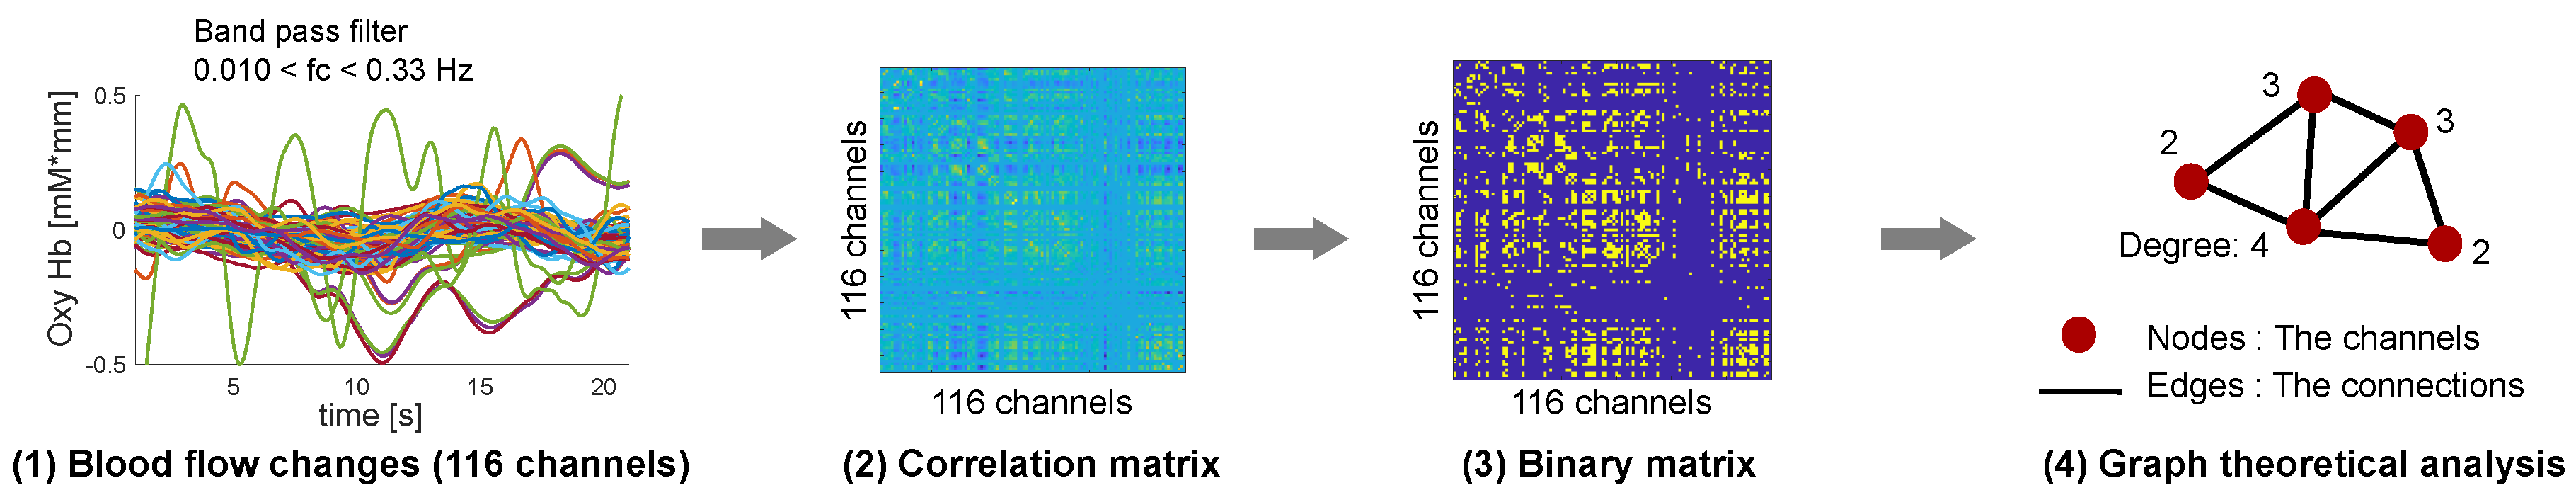
2.4.2. Functional Connectivity Analysis

Figure 3 shows the procedure for fNIRS data processing. To investigate the functional connectivity of the network during the synchronized tapping task, Pearson correlation coefficients for the 116 channels of Oxy-Hb time course during the task block were calculated; we performed Fisher’s z-transformation to approximately normalize the distribution of the correlation coefficients. The Fisher-transformed correlation matrix was binarized to preserve edge density of 15%. It has been said that a network structure with an edge density of 5% to 50% keeps the small world topology [19,20]. In addition, Bernhardt et al. [21] analyzed a network with 15% edge density as a representative for the functional network structure. The binarized matrix is regarded as the adjacency matrix of the undirected graph, with fNIRS measurement channel as the node and the functional connectivity as the binary edge. Moreover, graph theory analysis was used in this study; the degree, which is one of the well-known network metrics, was calculated using Brain Connectivity Toolbox (https://sites.google.com/site/bctnet/). The degree k i of a certain node i (corresponding to the ith measurement channel of fNIRS system in this study) is expressed by Equation (1), where N is the total number of the nodes in the network and a is the element of the adjacency matrix.
k i = j N a i j
k i indicates the number of nodes that are functionally connected with other nodes in the network and reflects the importance of the nodes in the network [14].

2.4.3. Behavioral Data Analysis

Synchronization error (SE) was calculated from the data related to the response time in the task. SE shows the difference between the time durations when the subject pressed the button (response) and the auditory cue was given (stimulus; Equation (2)).
SE ( n ) = Response ( n ) - Stimulus ( n )
If the subject pressed the button before the cue, SE takes a negative value, and, if they pressed the button after the cue, SE takes a positive value. Here, the SE for the initial signal in the task block was excluded from the analysis because the initial stimulus in the task block was not regarded as the model signal that simulates the others’ tapping, but as a reminding signal for starting of the task. In addition, the average values of SE in each cluster were calculated and compared with each other.

2.5. Subject Classification

Since SE varies between participants as much as between behaviors, it is not necessarily a good behavioral measure of the two strategies we assumed. Here, we used data-driven approach to separate the participants into some groups by data clustering in terms of the similarity of the brain network, and compared the network measure and the SE among groups. Ward’s method, which is a well-known hierarchical clustering method, was used to categorize the subjects into multiple groups.

3. Results

3.1. Spatial Registration of the Measurement Channels to the Brain Regions

The measurement channel of each subject was aligned to the MNI space. Each measurement channel was associated with the highest percentage of the brain regions among the estimated brain regions of each subject. Table 1 shows the brain regions corresponding to each channel.

3.2. Subject Classification

Figure 4 shows the dendrogram obtained as a result of the hierarchical clustering. The vertical axis shows the distance between the clusters, and the horizontal axis shows the subjects. Based on this result, the subjects were classified into groups with the largest distance between the clusters. It revealed that there were two brain states during the synchronized tapping task. We compared the two groups based on their brain states, and the behavioral data of each cluster.

3.3. Functional Connectivity in Cluster A

The regions with top 10% degree comprised the left middle frontal gyrus (LMFG), and the left triangular part of inferior frontal gyrus (LTrIFG). Figure 4 shows the network connections around the LMFG and LTrIFG, found in 60% of the subjects. It was drawn using BrainNetViewer 1.53 (https://www.nitrc.org/projects/bnv/). These two regions were connected to each other. In addition, LMFG was connected with the right middle frontal gyrus (RMFG), and the right superior frontal gyrus (RSFG). Furthermore, unpaired two-sample t-test for the difference between two groups, setting LMFG and LTriIFG as the region-of-interests was conducted. Degree centralities of two regions in Cluster A were significantly higher than those in Cluster B ( p < 0.05 ).

3.4. Functional Connectivity in Cluster B

The regions with top 10% degree comprised the LMFG, the left middle occipital gyrus (LMOG), the left postcentral gyrus (LPoG), the left supramarginal gyrus (LSMG), and the right middle temporal gyrus (RMTG). In addition to Cluster A, Figure 4 shows the functional connections between these regions and the other regions. Regions with the top 10% degree were interconnected, and all the top 10%-degree regions had at least one connection with each other. LMFG had a connection with LPoG and LMOG, which are regions within the top 10% degree. In addition, LMOG had connections with RMTG, LSMG, precuneus, and the right superior temporal gyrus (RSTG). Moreover, unpaired two-sample t-test for the difference between two groups, setting LMFG, LMOG, LPoG, LSMG and RMTG as the region-of-interests was conducted. The results of the t-test indicated that the degree centralities of the LMOG and LPoG in Cluster B were significantly higher than those in Cluster A ( p < 0.05 ).

3.5. Analysis of Behavioral Data

We used SE values for the analysis of behavioral data. The average values of SE in Cluster A, and Cluster B were 90.0 ± 154.9 ms and −8.9 ± 261.5 ms, respectively. There was no significant difference between the two clusters ( p < 0.05 ).

4. Discussion

The top 10%-degree brain region indicate that they are extensively connected to other regions of the brain and are therefore high centrality regions in the functional network. As a result of clustering on the basis of degree, we grouped the subjects into two clusters, Cluster A with network centrality in the frontal lobe and Cluster B with network centrality in the temporal and lateral lobes, during timing synchronization. In addition, at least one of the central regions in both clusters had a mutual connection. This suggests that the principal network in timing synchronization consists only of the central regions of the various network clusters, which are interconnected with each other.
For the subjects in Cluster A, LMFG and LTrIFG corresponded to the central region of the network, with top 10% degree, and both regions are involved in theory of mind (ToM) [22]. ToM is one of the social skills necessary to understand the mind of the others, and also the intention behind their action. IFG is also involved in mirror neuron systems [23]. The mirror neuron system is a neural mechanism that allows unconscious understanding of the behavior and intention of the others; this neural basis is also found in infants [24]. In addition, MFG has been reported to be involved in sustaining attention [25]. Thus, by functionally connecting the region related to observation and imitation of behavior, and the MFG which sustains attention, the subjects were able to synchronize their response time. They observed and responded to the sound stimulus, and modeled the others’ behavior while paying attention to the next cue. Furthermore, the mean values of the SE in Cluster A shows the subjects’ tendency to respond slowly to the cues. This suggests that the subjects responded “reactively” to the cue. Since imitating the others indicates reacting to the opponent’s behavior, the result of this SE value supports the results of the brain function network (Cluster A).
On the other hand, LMFG, LPoG, LMOG, LSMG, and RMTG were the regions with the top 10% degree in subjects of Cluster B, and these regions corresponded to the central region of the network. LMFG associated with sustenance of attention had many connections with the other high degree regions. This indicates that the highest degree of attention was paid on the functions of the other regions. LPoG is a somatosensory cortex, and we think that it became the center of the network because of its relation with the urge to push the button [26]. LMOG is a visual cortex. In this experiment, fixation point was always presented as a visual stimulus. Therefore, it is conceivable that factors, which are important in the network, do not include processing of visual information. Summerfield et al. [27] reported that this region is activated in the expectation of the next stimulus. In addition, it is reported that LSMG, which is connected to LMOG and forms the center of the network, becomes active when responding to predictable stimuli [28]. STS, including RSTG and RMTG, and precuneus are regions related to the ToM and are thought to be involved in understanding the intention of the cue [22]. Taken together, we conclude that the subjects were synchronizing their response time with the stimulus using LMOG, which is activated in anticipation of the next cue, and is also connected to the regions involved in understanding the meaning of the cues such as RSTG, RMTG, and precuneus. In addition, subjects tended to respond before the cues were generated, as demonstrated by the mean values of SE in Cluster B. Based on these results, we conclude that the subjects in Cluster B proactively responded to the stimulus.
The results of Clusters A and B suggest that timing coordination involved both imitative and predictive behaviors. In previous studies, the mirror neuronal systems have been shown to be involved in recognition of the others, and it has been clarified that humans understand the behavior of the others by simulating them in their interbrain or actual behavior [24]. Here, as shown by the Cluster A network, the mirror neurons are involved in this task along with the imitative behavior to coordinate with the others to synchronize timing. In addition to imitation, as shown by the network result of Cluster B, a network involved in anticipation was formed, suggesting the need to predict the timing of others.
These results reveal the central region and the structural features of the brain functional network associated with time coordination. The participants were asked to synchronize with the presence of the sound stimuli, and the stimuli were regarded as the opponent’s behavior in this study. However, the inter-stimulus interval did not differ in response to the subjects’ tapping. Therefore, further studies are required to confirm whether the same result can be obtained when the timing is synchronized as the two persons mutually adapt.
One of the limitations of the current study is the motion artifact (MA) correction method. It is a crucial issue in fNIRS-based analysis, and many methods have been proposed recently, including principle component analysis, spline interpolation, Kalman filtering, wavelet filtering and correlation-based signal improvement [29,30]. However, accuracy of MA correction significantly differs among different methods and the methodological differences lead to different statistical results [31].

5. Conclusions

Joint action can be regarded as social interactions in which more than two people coordinate their behavior to change the environment. The ability to coordinate our behavior with external stimulus is essential to achieve a joint action. In this study, using synchronous tapping task, brain activity was measured by fNIRS when people coordinated their timing. In addition, brain functional networks in the task were examined using the graph theory analysis. We suggest that there are two kinds of brain function networks related to the task being performed. We also showed that these networks comprise a major network. Furthermore, from the point of view of the two networks and behaviors, it was revealed that both expectative behavior and imitative behavior are involved in time synchronization. Our findings demonstrate that it is possible to take actions that are adapted to other people’s actions by predicting and imitating behaviors that have been regarded as important in social interactions.

Author Contributions

Conceptualization, M.M., T.H. and S.H.; Data curation, M.M.; Formal analysis, M.M., T.H. and S.H.; Investigation, M.M. and S.H.; Methodology, M.M., T.H. and S.H.; Project administration, T.H.; Software, M.M.; Supervision, T.H. and S.H.; Validation, M.M. and S.H.; Writing—original draft, M.M. and S.H.; and Writing—review and editing, T.H. and S.H.

Funding

This research received no specific grant from any funding agency in the public, commercial, or not-for-profit sectors.

Acknowledgments

The authors thank the members of Medical Information System Laboratory, Doshisha University, for their help and expertise in performing experiments and analysis.

Conflicts of Interest

The authors declare that there are no conflicts of interest regarding the publication of this paper.

Abbreviations

The following abbreviations are used in this manuscript:
fNIRSfunctional near-infrared spectroscopy
fMRIfunctional magnetic resonance imaging
MNIMontreal Neurological Institute
POTAToplatform for optical topography analysis tools
Hbhemoglobin
SEsynchronization error
LMFGleft middle frontal gyrus
TrIFGtriangular part of inferior frontal gyrus
RMFGright middle frontal gyrus
RSFGright superior frontal gyrus
LMOGleft middle occipital gyrus
LPoGleft postcentral gyrus
LSMGleft supramarginal gyrus
RMTGright middle temporal gyrus
RSFGright superior temporal gyrus
ToMtheory of mind

References

  1. Wiltermuth, S.S.; Heath, C. Synchrony and cooperation. Psychol. Sci. 2009, 20, 1–5. [Google Scholar] [CrossRef] [PubMed]
  2. Rabinowitch, T.C.; Knafo-Noam, A. Synchronous rhythmic interaction enhances children’s perceived similarity and closeness towards each other. PLoS ONE 2015, 10, e0120878. [Google Scholar] [CrossRef] [PubMed]
  3. Sebanz, N.; Bekkering, H.; Knoblich, G. Joint action: bodies and minds moving together. Trends Cogn. Sci. 2006, 10, 70–76. [Google Scholar] [CrossRef] [PubMed] [Green Version]
  4. Repp, B.H. Sensorimotor synchronization: A review of the tapping literature. Psychon. Bull. Rev. 2005, 12, 969–992. [Google Scholar] [CrossRef] [PubMed]
  5. Thaut, M.H. Neural basis of rhythmic timing networks in the human brain. Ann. N. Y. Acad. Sci. 2003, 999, 364–373. [Google Scholar] [CrossRef] [PubMed]
  6. Chen, J.L.; Zatorre, R.J.; Penhune, V.B. Interactions between auditory and dorsal premotor cortex during synchronization to musical rhythms. Neuroimage 2006, 32, 1771–1781. [Google Scholar] [CrossRef] [PubMed]
  7. Lewis, P.A.; Wing, A.; Pope, P.; Praamstra, P.; Miall, R. Brain activity correlates differentially with increasing temporal complexity of rhythms during initialisation, synchronisation, and continuation phases of paced finger tapping. Neuropsychologia 2004, 42, 1301–1312. [Google Scholar] [CrossRef]
  8. Mayville, J.M.; Jantzen, K.J.; Fuchs, A.; Steinberg, F.L.; Kelso, J.S. Cortical and subcortical networks underlying syncopated and synchronized coordination revealed using fMRI. Hum. Brain Map. 2002, 17, 214–229. [Google Scholar] [CrossRef] [Green Version]
  9. Irani, F.; Platek, S.M.; Bunce, S.; Ruocco, A.C.; Chute, D. Functional near infrared spectroscopy (fNIRS): an emerging neuroimaging technology with important applications for the study of brain disorders. Clin. Neuropsychol. 2007, 21, 9–37. [Google Scholar] [CrossRef]
  10. Minagawa-Kawai, Y.; Matsuoka, S.; Dan, I.; Naoi, N.; Nakamura, K.; Kojima, S. Prefrontal activation associated with social attachment: Facial-emotion recognition in mothers and infants. Cereb. Cortex 2008, 19, 284–292. [Google Scholar] [CrossRef]
  11. Sanz-Arigita, E.J.; Schoonheim, M.M.; Damoiseaux, J.S.; Rombouts, S.A.; Maris, E.; Barkhof, F.; Scheltens, P.; Stam, C.J. Loss of ‘small-world’networks in Alzheimer’s disease: graph analysis of FMRI resting-state functional connectivity. PLoS ONE 2010, 5, e13788. [Google Scholar] [CrossRef]
  12. Sporns, O.; Tononi, G.; Kötter, R. The human connectome: A structural description of the human brain. PLoS Comput. Biol. 2005, 1, e42. [Google Scholar] [CrossRef] [PubMed]
  13. Van Dijk, K.R.; Sabuncu, M.R.; Buckner, R.L. The influence of head motion on intrinsic functional connectivity MRI. Neuroimage 2012, 59, 431–438. [Google Scholar] [CrossRef] [PubMed] [Green Version]
  14. Rubinov, M.; Sporns, O. Complex network measures of brain connectivity: uses and interpretations. Neuroimage 2010, 52, 1059–1069. [Google Scholar] [CrossRef] [PubMed]
  15. Maki, A.; Yamashita, Y.; Ito, Y.; Watanabe, E.; Mayanagi, Y.; Koizumi, H. Spatial and temporal analysis of human motor activity using noninvasive NIR topography. Med. Phys. 1995, 22, 1997–2005. [Google Scholar] [CrossRef] [PubMed]
  16. Niu, H.; Lu, C.M.; Zhu, C.; Khadka, S.; Tian, F.; Lin, Z.J.; Liu, H. Resting-state functional connectivity assessed with two diffuse optical tomographic systems. J. Biomed. Opt. 2011, 16, 046006. [Google Scholar] [CrossRef] [Green Version]
  17. Imai, M.; Watanabe, H.; Yasui, K.; Kimura, Y.; Shitara, Y.; Tsuchida, S.; Takahashi, N.; Taga, G. Functional connectivity of the cortex of term and preterm infants and infants with Down’s syndrome. Neuroimage 2014, 85, 272–278. [Google Scholar] [CrossRef]
  18. Pena, M.; Maki, A.; Kovačić, D.; Dehaene-Lambertz, G.; Koizumi, H.; Bouquet, F.; Mehler, J. Sounds and silence: An optical topography study of language recognition at birth. Proc. Natl. Acad. Sci. USA 2003, 100, 11702–11705. [Google Scholar] [CrossRef] [Green Version]
  19. Achard, S.; Bullmore, E. Efficiency and cost of economical brain functional networks. PLoS Comput. Biol. 2007, 3, e17. [Google Scholar] [CrossRef]
  20. Wang, J.; Wang, L.; Zang, Y.; Yang, H.; Tang, H.; Gong, Q.; Chen, Z.; Zhu, C.; He, Y. Parcellation-dependent small-world brain functional networks: a resting-state fMRI study. Hum. Brain Map. 2009, 30, 1511–1523. [Google Scholar] [CrossRef]
  21. Bernhardt, B.C.; Chen, Z.; He, Y.; Evans, A.C.; Bernasconi, N. Graph-theoretical analysis reveals disrupted small-world organization of cortical thickness correlation networks in temporal lobe epilepsy. Cereb. Cortex 2011, 21, 2147–2157. [Google Scholar] [CrossRef] [PubMed]
  22. Powell, J.L.; Grossi, D.; Corcoran, R.; Gobet, F.; Garcia-Finana, M. The neural correlates of theory of mind and their role during empathy and the game of chess: A functional magnetic resonance imaging study. Neuroscience 2017, 355, 149–160. [Google Scholar] [CrossRef] [PubMed] [Green Version]
  23. Kilner, J.M.; Neal, A.; Weiskopf, N.; Friston, K.J.; Frith, C.D. Evidence of mirror neurons in human inferior frontal gyrus. J. Neurosci. 2009, 29, 10153–10159. [Google Scholar] [CrossRef] [PubMed]
  24. Dapretto, M.; Davies, M.S.; Pfeifer, J.H.; Scott, A.A.; Sigman, M.; Bookheimer, S.Y.; Iacoboni, M. Understanding emotions in others: Mirror neuron dysfunction in children with autism spectrum disorders. Nat. Neurosci. 2006, 9, 28. [Google Scholar] [CrossRef] [PubMed]
  25. Andersson, M.; Ystad, M.; Lundervold, A.; Lundervold, A.J. Correlations between measures of executive attention and cortical thickness of left posterior middle frontal gyrus-a dichotic listening study. Behav. Brain Funct. 2009, 5, 41. [Google Scholar] [CrossRef] [PubMed]
  26. Yan, B.; Li, K.; Xu, J.; Wang, W.; Li, K.; Liu, H.; Shan, B.; Tang, X. Acupoint-specific fMRI patterns in human brain. Neurosci. Lett. 2005, 383, 236–240. [Google Scholar] [CrossRef]
  27. Summerfield, C.; Koechlin, E. A neural representation of prior information during perceptual inference. Neuron 2008, 59, 336–347. [Google Scholar] [CrossRef] [PubMed]
  28. Coull, J.; Nobre, A. Dissociating explicit timing from temporal expectation with fMRI. Curr. Opin. Neurobiol. 2008, 18, 137–144. [Google Scholar] [CrossRef] [PubMed]
  29. Brigadoi, S.; Ceccherini, L.; Cutini, S.; Scarpa, F.; Scatturin, P.; Selb, J.; Gagnon, L.; Boas, D.A.; Cooper, R.J. Motion artifacts in functional near-infrared spectroscopy: A comparison of motion correction techniques applied to real cognitive data. NeuroImage 2014, 85, 181–191. [Google Scholar] [CrossRef] [PubMed] [Green Version]
  30. Chiarelli, A.M.; Maclin, E.L.; Fabiani, M.; Gratton, G. A kurtosis-based wavelet algorithm for motion artifact correction of fNIRS data. NeuroImage 2015, 112, 128–137. [Google Scholar] [CrossRef] [PubMed] [Green Version]
  31. Pfeifer, M.D.; Scholkmann, F.; Labruyère, R. Signal Processing in Functional Near-Infrared Spectroscopy (fNIRS): Methodological Differences Lead to Different Statistical Results. Front. Hum. Neurosci. 2018, 11, 641. [Google Scholar] [CrossRef] [PubMed]
Figure 1. A block design consisting of two controls and one task block. A synchronous tapping task was used, and the subjects were required to respond to the sound stimulus presented at regular time intervals. In the control phase, the sound interval was 0.5 s ( S ( n + 1 ) S ( n ) = 0.5 s), while, in the task phase, the sound intervals were regularly increased ( S ( n + 2 ) = S ( n + 1 ) S ( n ) + 0.6 ± 0.03 s).
Brainsci 09 00043 g001
Figure 2. Probe set configuration. Red circles indicate emitters and blue circles indicate detectors. A 3 × 10 probe set (47 channels) was attached to each of the forehead and occipital regions, and a 3 × 5 probe set (22 channels) was attached to the top head region. In total, 116 channels were measured for the whole brain.
Brainsci 09 00043 g002
Figure 3. Procedure for the brain function network analysis. (1) The noise associated with Oxy-Hb changes (116 channels) was removed by pre-processing. (2) Pearson correlation matrix of Oxy-Hb concentration changes was calculated. (3) The correlation matrix was binarized by threshold (edge density of 15%). (4) Network feature amount (degree) was calculated based on graph theory. The red dots indicate nodes and the lines indicate edges. The numerical values indicate the number of nodes connected by other nodes.
Brainsci 09 00043 g003
Figure 4. Brain states were classified by hierarchical clustering. Two clusters with the greatest distance were revealed. The red circle indicates the central area of the network with a high degree. Cluster A was in the frontal lobe, and Cluster B was in the temporal and lateral lobes. Letters L and R indicate the left and right sides of the brain, respectively.
Brainsci 09 00043 g004
Table 1. The associated brain region corresponding to all the channels (116 channels). Each measurement channel was associated with the highest percentage of the brain regions for each subject.
ChannelRegion ChannelRegion
1right postcentral gyrus 59left middle occipital gyrus
2right precentral gyrus 60left middle occipital gyrus
3right middle frontal gyrus 61left middle occipital gyrus
4right superior frontal gyrus 62left calcarine sulcus
5right medial superior frontal gyrus 63right inferior occipital gyrus
6left superior frontal gyrus 64right middle occipital gyrus
7left middle frontal gyrus 65right middle temporal gyrus
8left middle frontal gyrus 66right superior temporal gyrus
9left postcentral gyrus 67left middle temporal gyrus
10right supramarginal gyrus 68left middle temporal gyrus
11right precentral gyrus 69left inferior occipital gyrus
12right triangular part of inferior frontal gyrus 70left lingual gyrus
13right middle frontal gyrus 71left cerebellum crus II
14right superior frontal gyrus 72right lingual gyrus
15left medial superior frontal gyrus 73right inferior occipital gyrus
16left middle frontal gyrus 74right inferior temporal gyrus
17left middle frontal gyrus 75right middle temporal gyrus
18left precentral gyrus 76left middle temporal gyrus
19left postcentral gyrus 77left middle temporal gyrus
20right postcentral gyrus 78left cerebellum crus I
21right triangular part of inferior frontal gyrus 79left cerebellum crus I
22right middle frontal gyrus 80left cerebellum crus II
23right middle frontal gyrus 81right lingual gyrus
24right medial superior frontal gyrus 82right cerebellum crus I
25left superior frontal gyrus 83right cerebellum crus I
26left middle frontal gyrus 84right inferior temporal gyrus
27left triangular part of inferior frontal gyrus 85right middle temporal gyrus
28left postcentral gyrus 86left inferior temporal gyrus
29right superior temporal gyrus 87left cerebellum crus I
30right opercular part of inferior frontal gyrus 88left cerebellum crus II
31right triangular part of inferior frontal gyrus 89left cerebellum crus III
32right middle frontal gyrus 90left cerebellum crus IV
33right superior frontal gyrus 91right cerebellum crus II
34left medial superior frontal gyrus 92right cerebellum crus II
35left middle frontal gyrus 93right cerebellum crus I
36left triangular part of inferior frontal gyrus 94right inferior temporal gyrus
37left triangular part of inferior frontal gyrus 95right superior frontal gyrus
38left postcentral gyrus 96right precentral gyrus
39right middle temporal gyrus 97right superior parietal cortex
40right triangular part of inferior frontal gyrus 98right superior parietal cortex
41right middle frontal gyrus 99right superior frontal gyrus
42right superior frontal gyrus 100right superior frontal gyrus
43right medial superior frontal gyrus 101right precentral gyrus
44left superior frontal gyrus 102right superior parietal cortex
45left middle frontal gyrus 103right cuneus
46left triangular part of inferior frontal gyrus 104supplementary motor area
47left superior temporal gyrus 105left paracentral lobule
48left supramarginal gyrus 106left precuneus
49left middle temporal gyrus 107left precuneus
50left middle occipital gyrus 108left superior frontal gyrus
51left middle occipital gyrus 109left superior frontal gyrus
52left calcarine sulcus 110left paracentral lobule
53right superior occipital gyrus 111left superior parietal cortex
54right middle occipital gyrus 112left superior parietal cortex
55right middle temporal gyrus 113left superior frontal gyrus
56right superior temporal gyrus 114left precentral gyrus
57right supramarginal gyrus 115left postcentral gyrus
58left middle temporal gyrus 116left superior parietal cortex

