
Investigation into Deep Brain Stimulation Lead Designs: A Patient-Specific Simulation Study

 ,
,
Abstract
:
1. Introduction
2. Materials and Methods
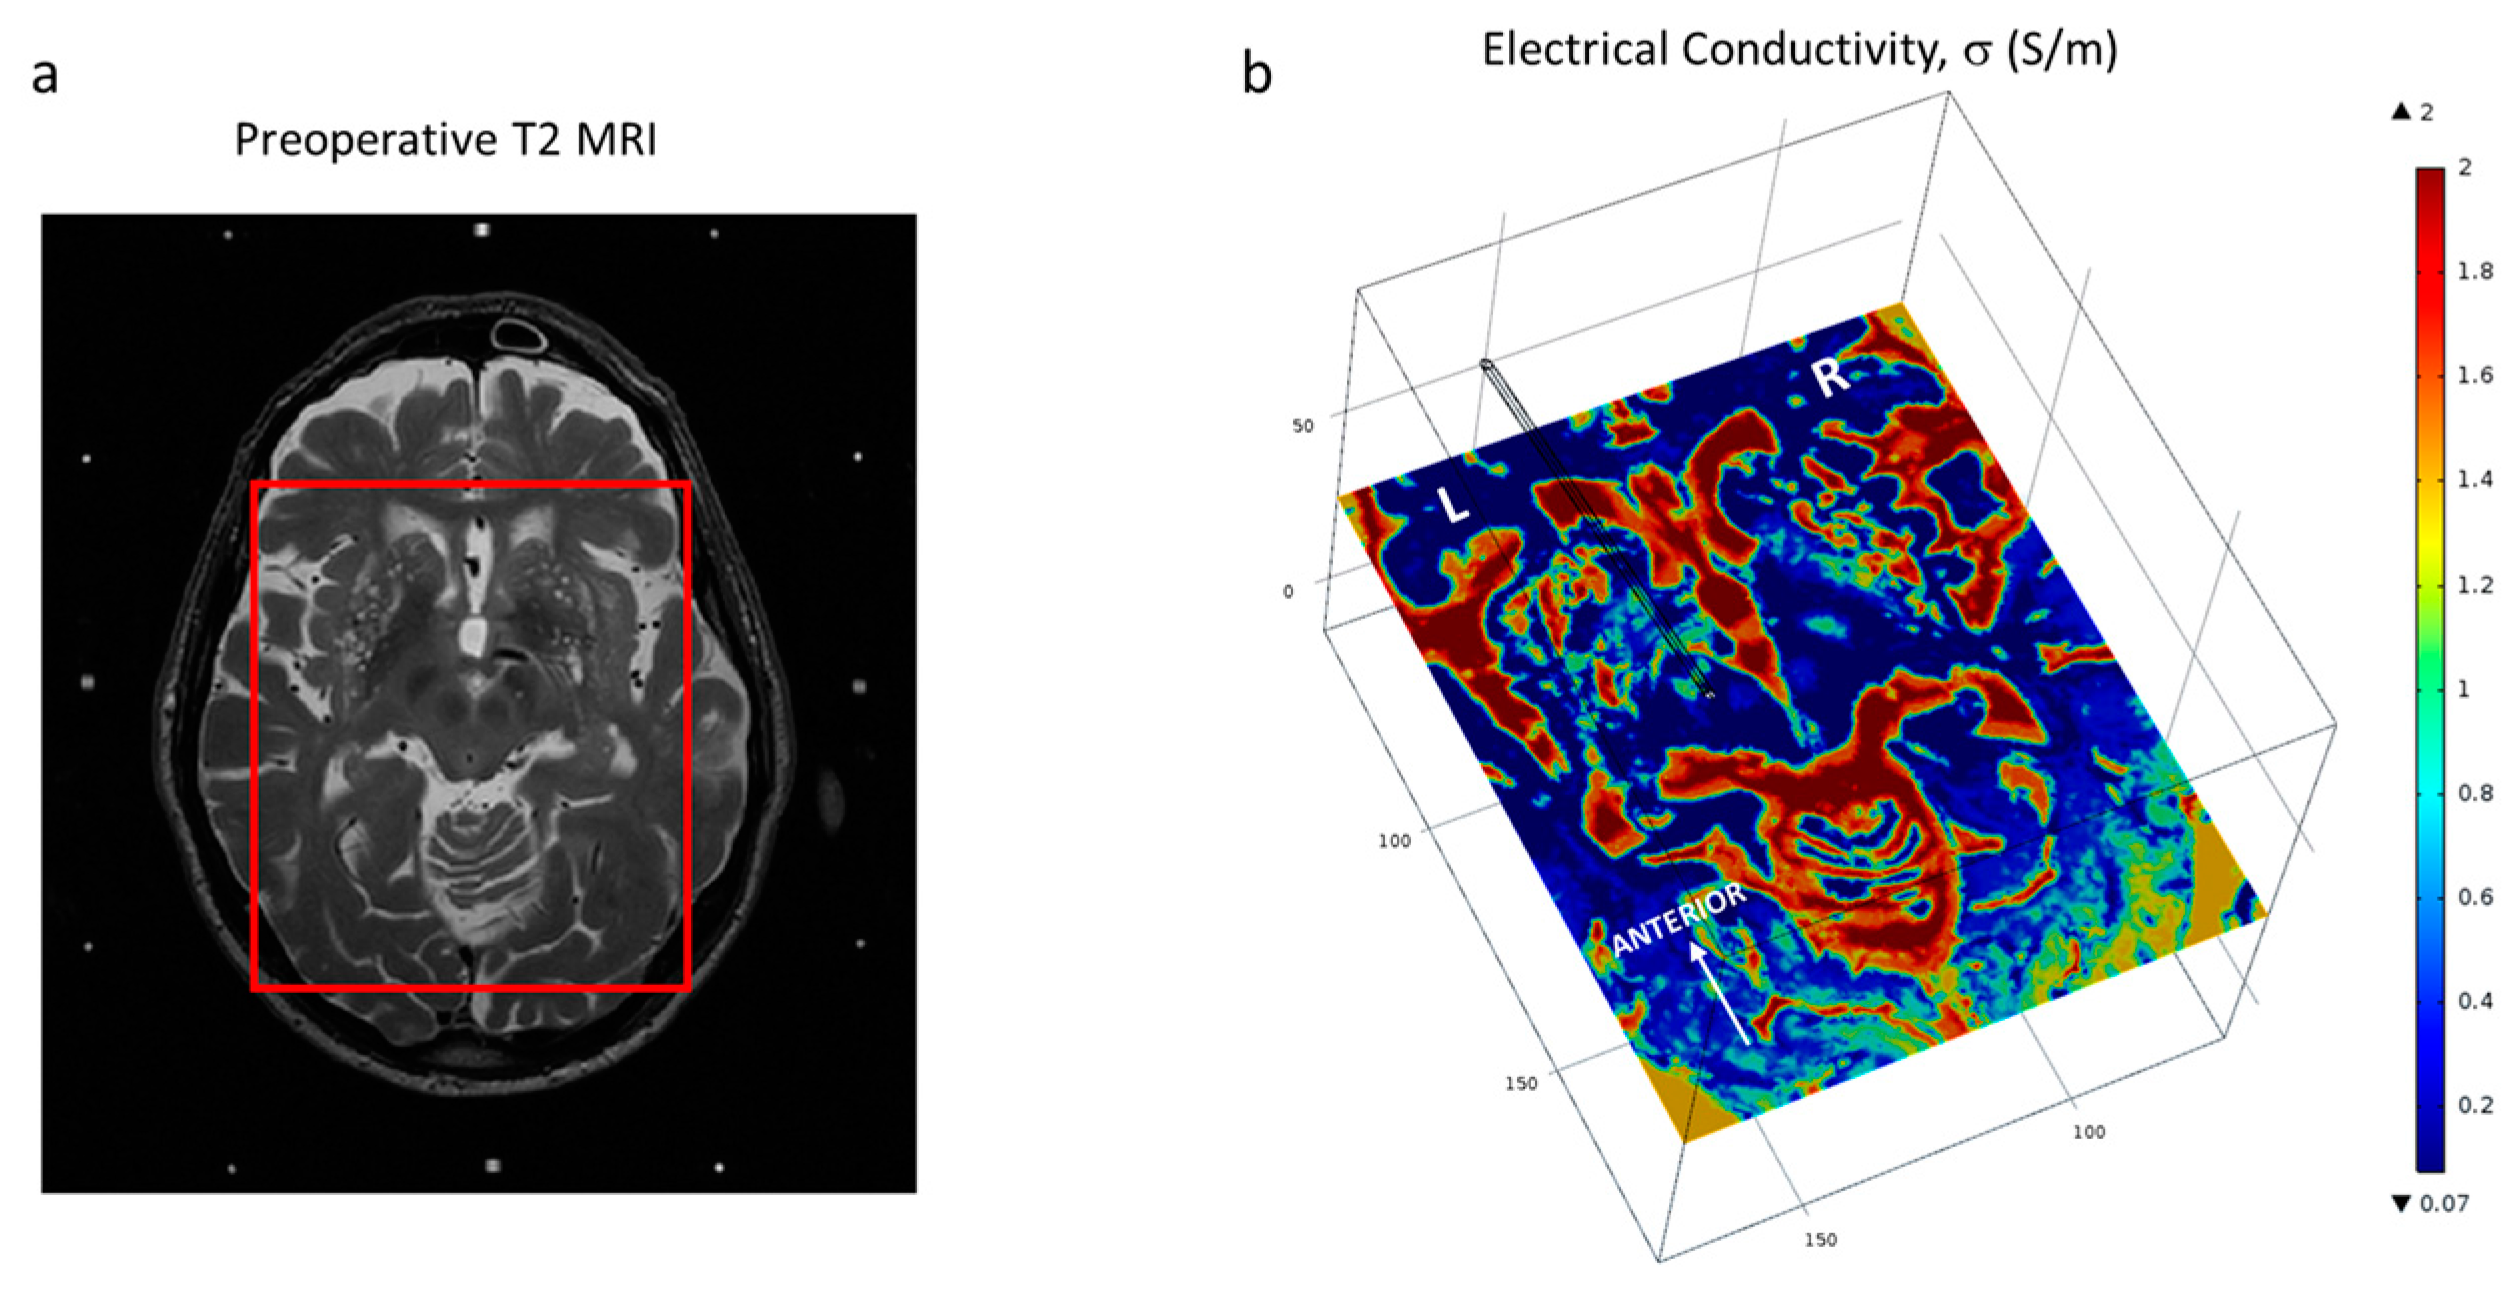
2.1. Patient Data, Surgery and Imaging
2.2. FEM Modelling and Simulation
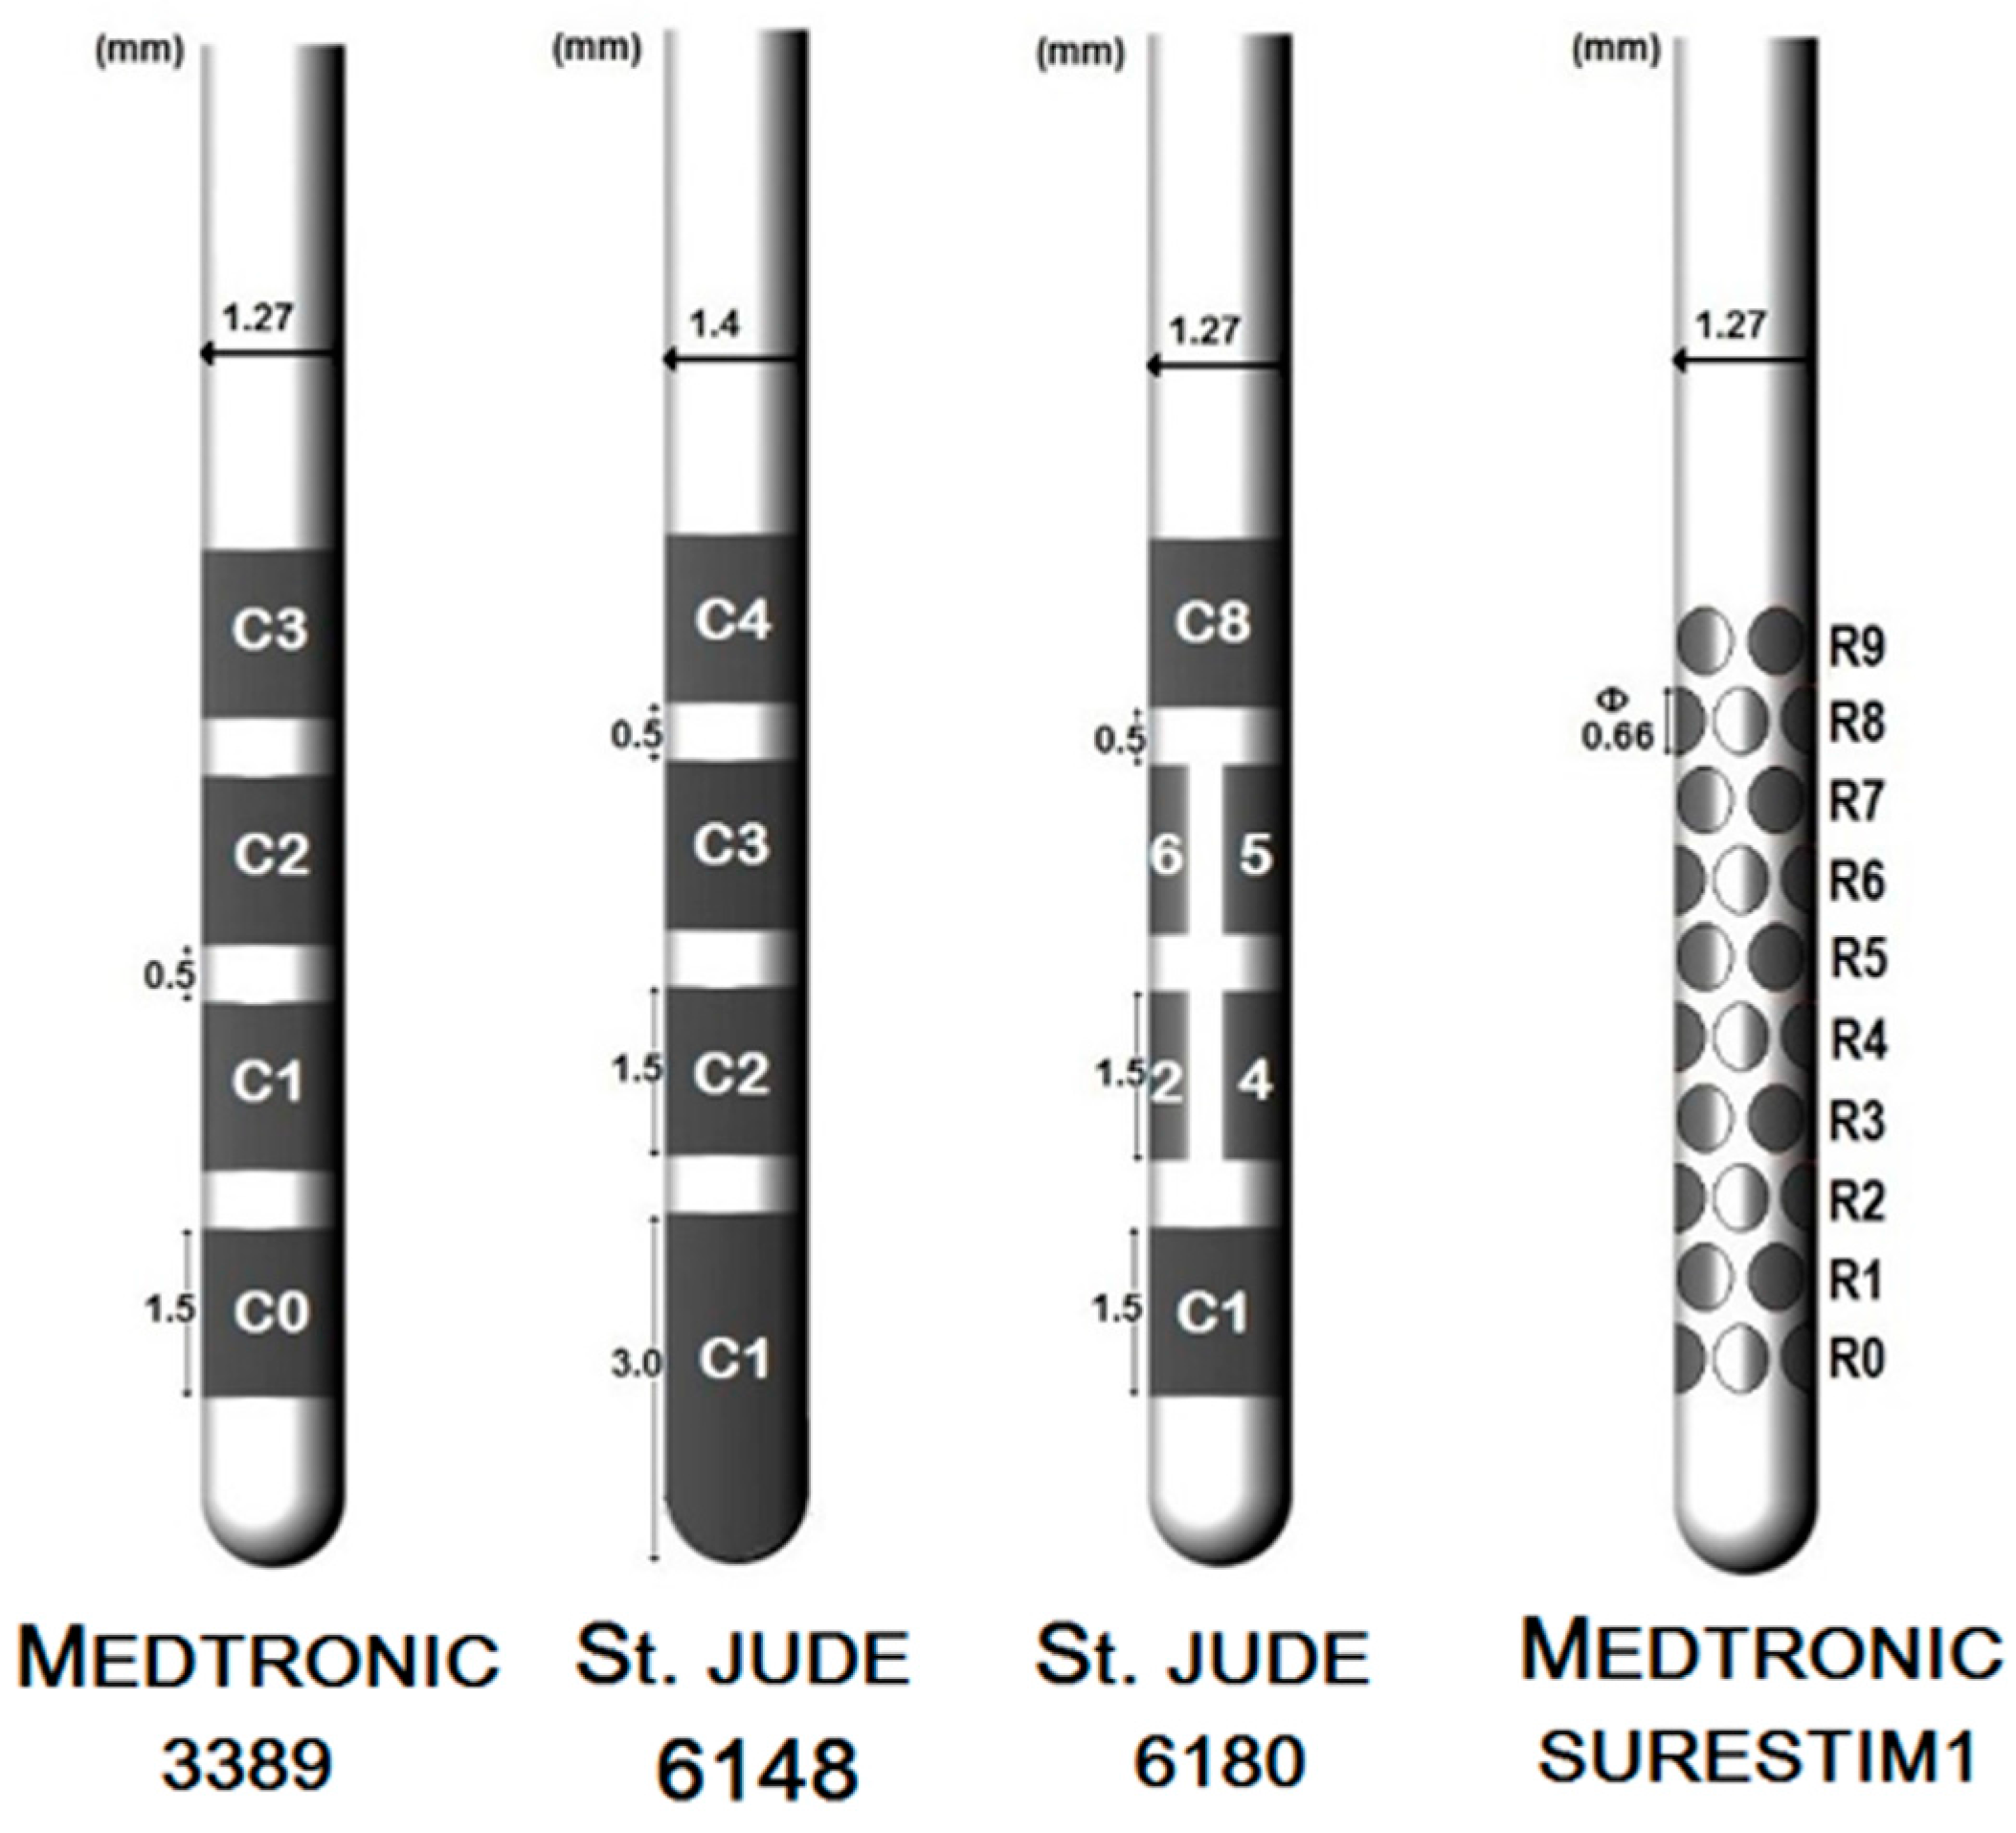
2.2.1. DBS Leads
2.2.2. Brain Tissue Model
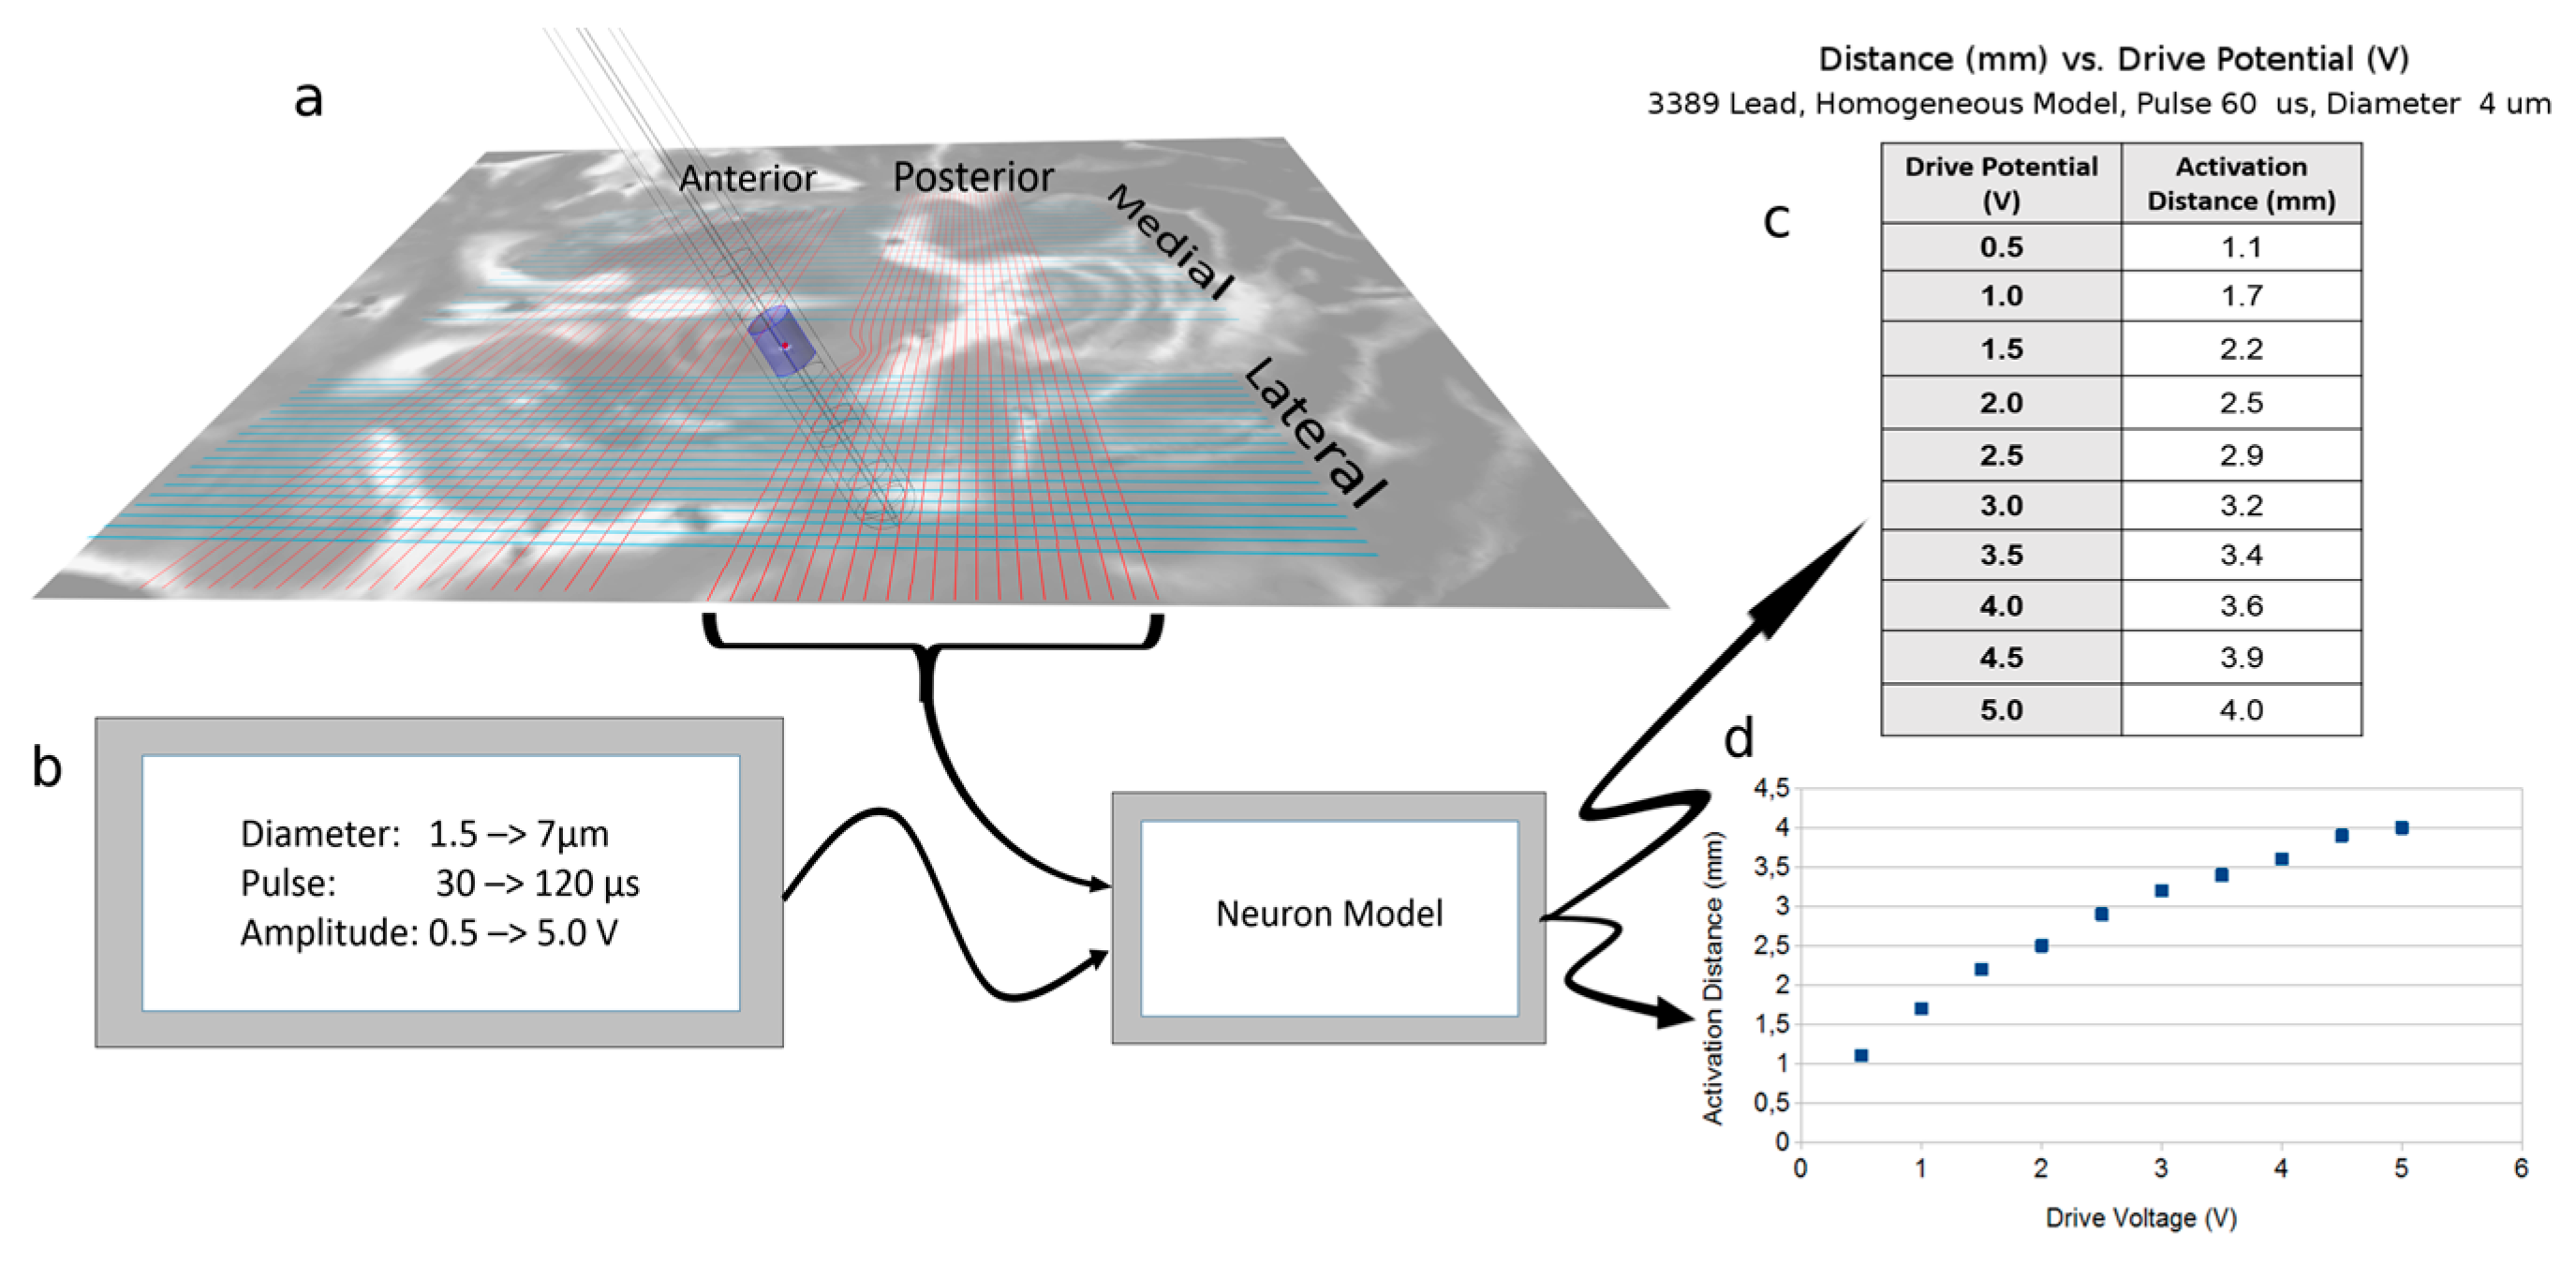
2.3. Neuron Model Simulations
2.4. Electric Field Simulations
2.5. Data Analysis
3. Results
3.1. Neuron Model Simulations
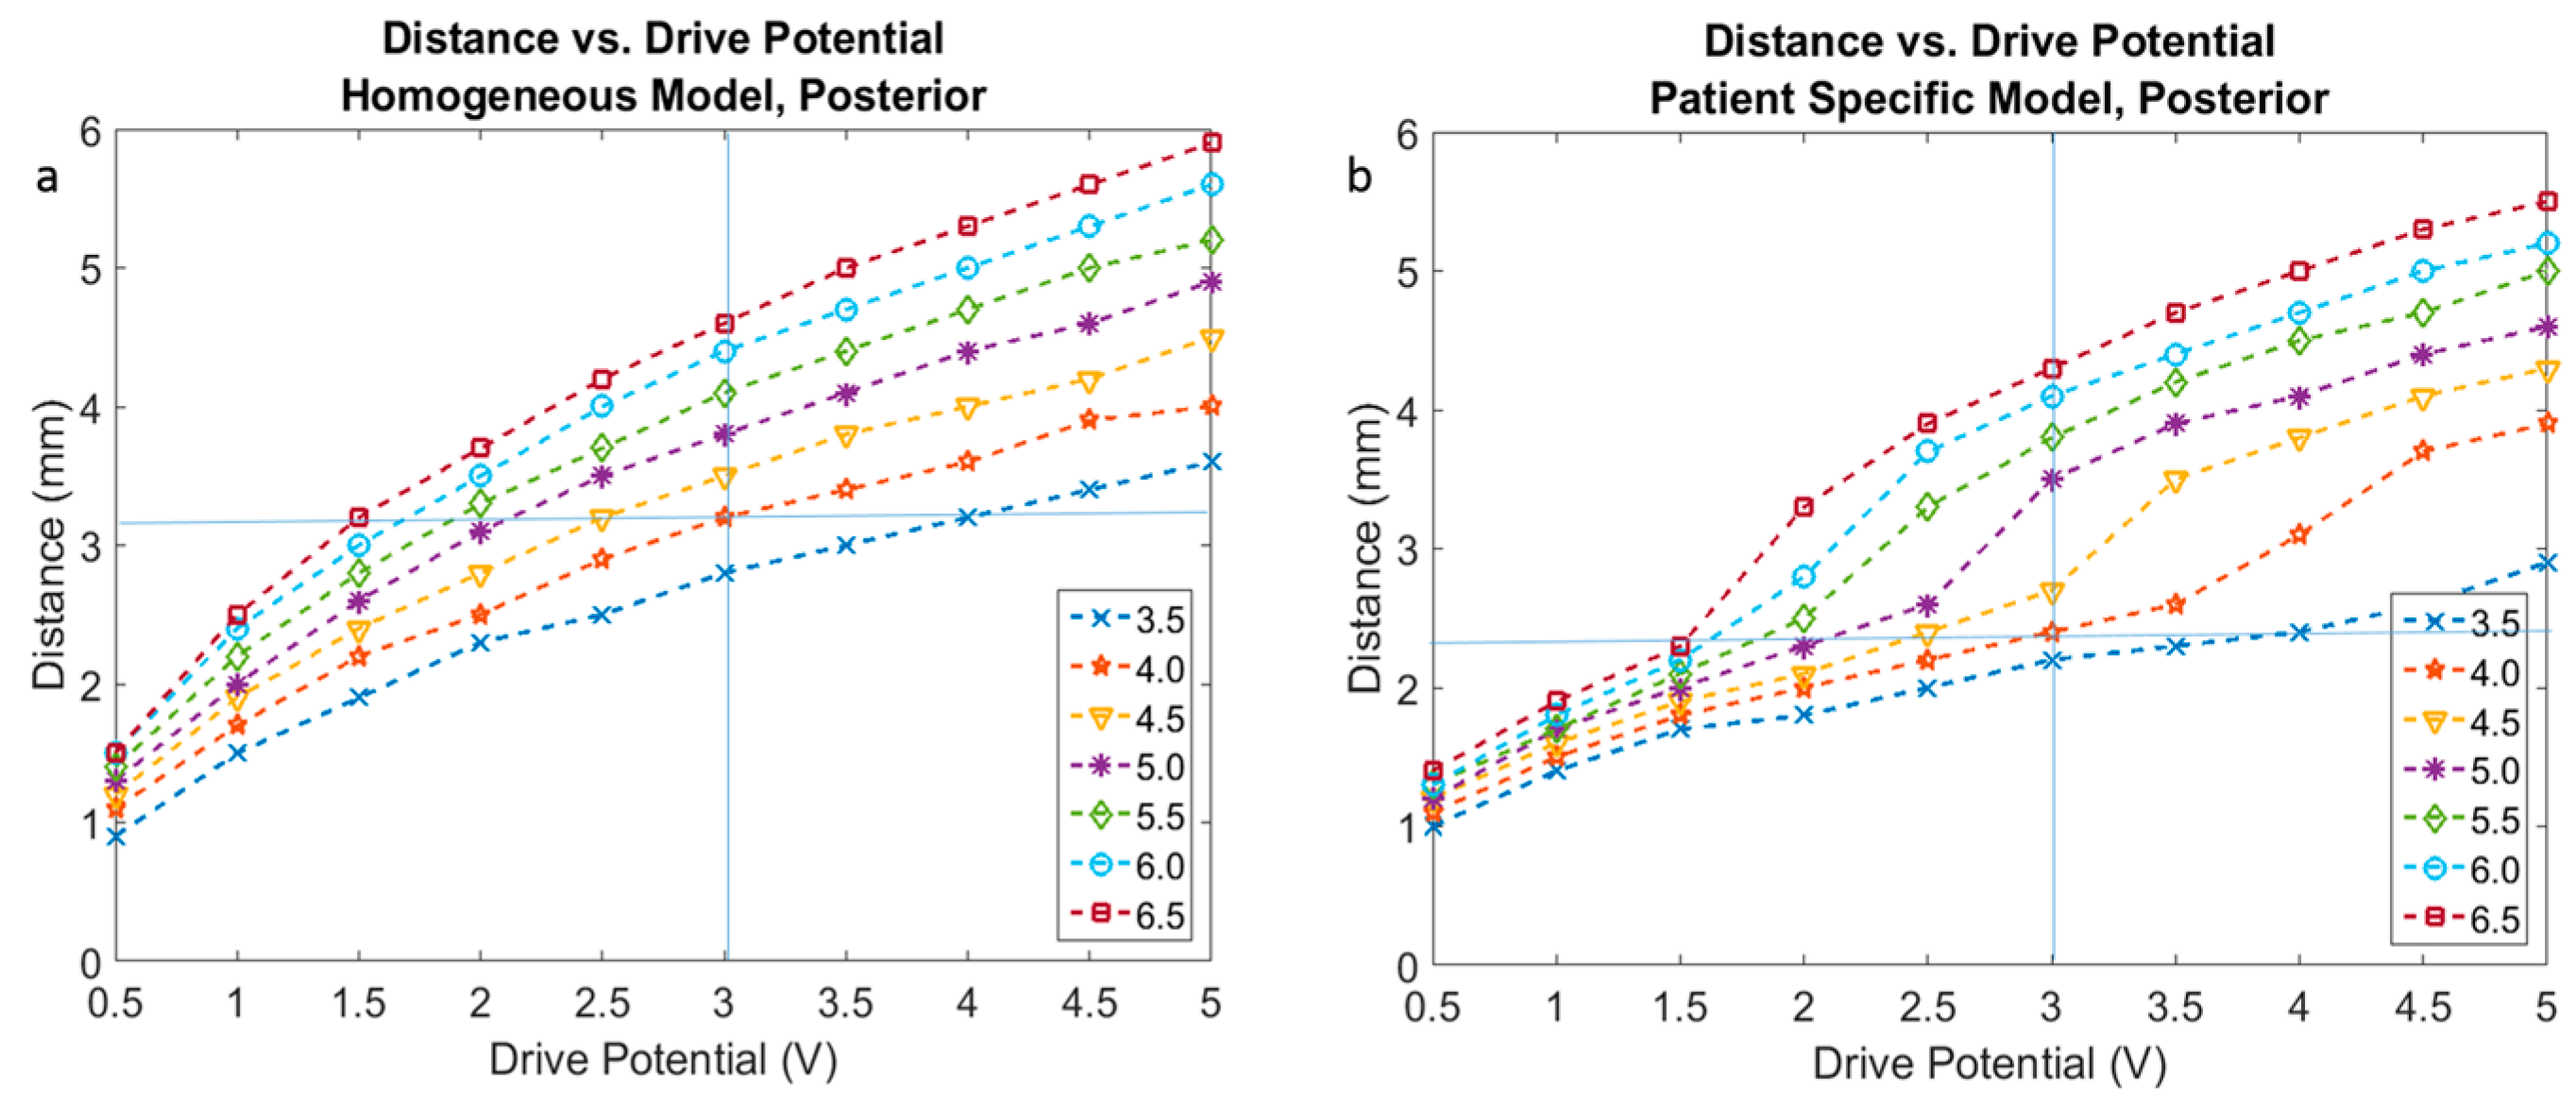
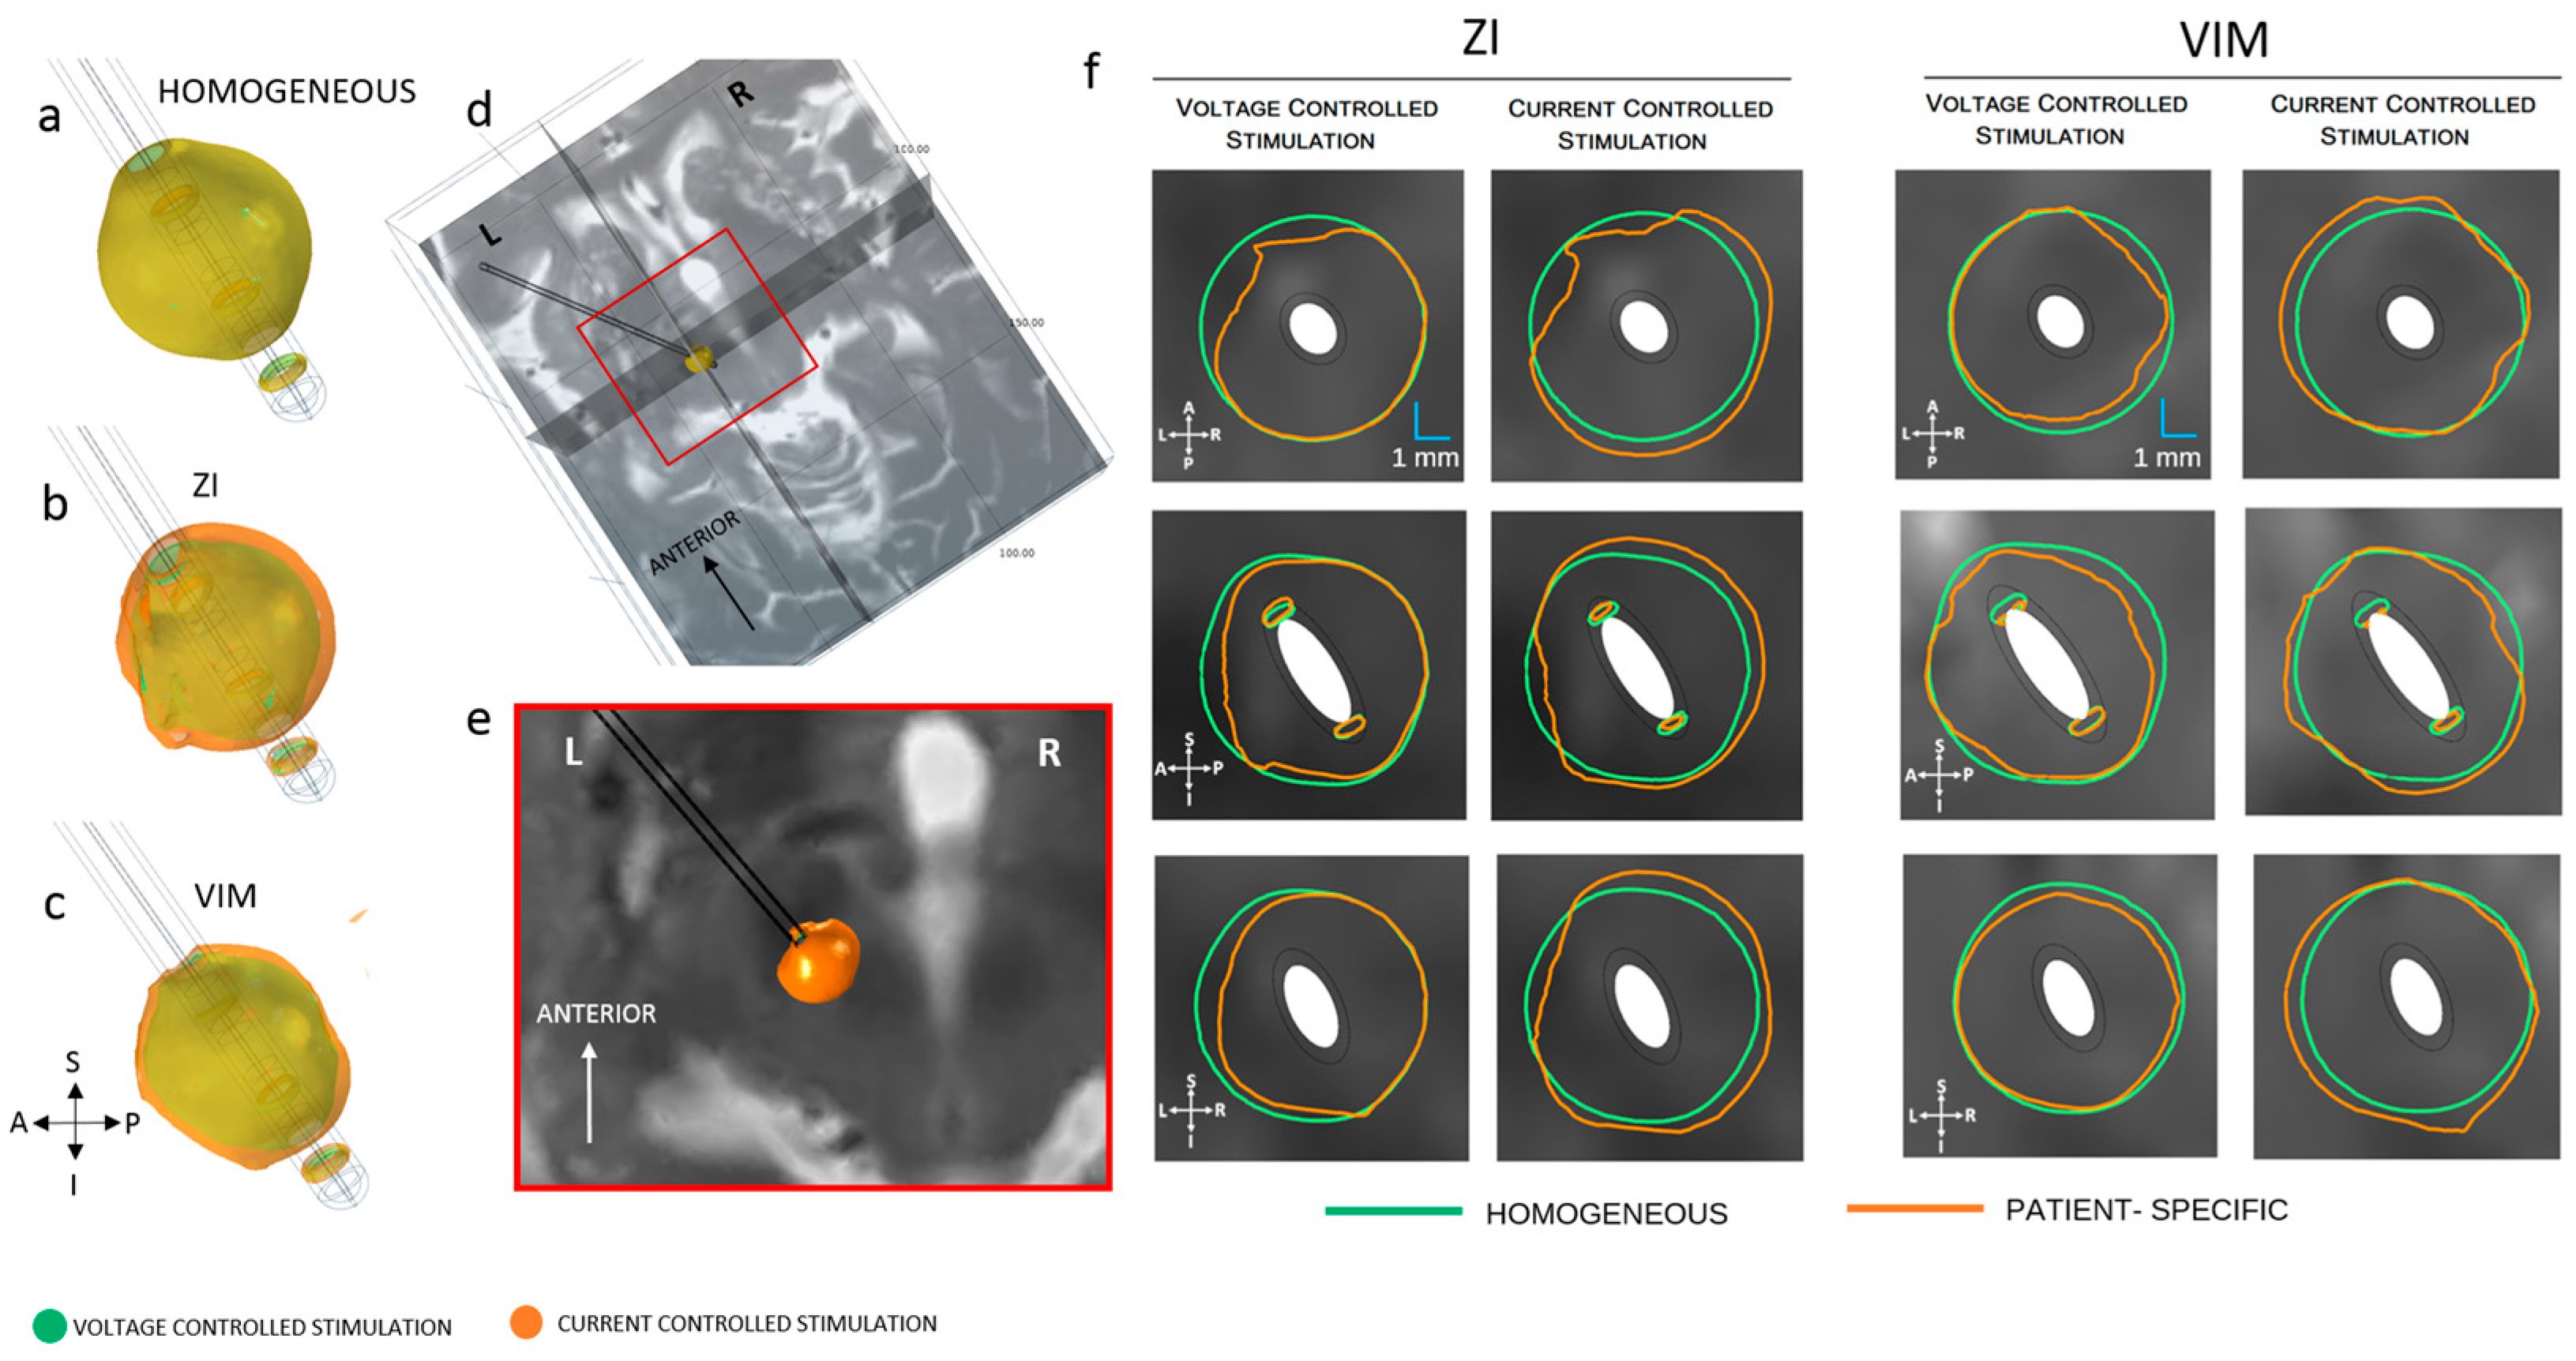
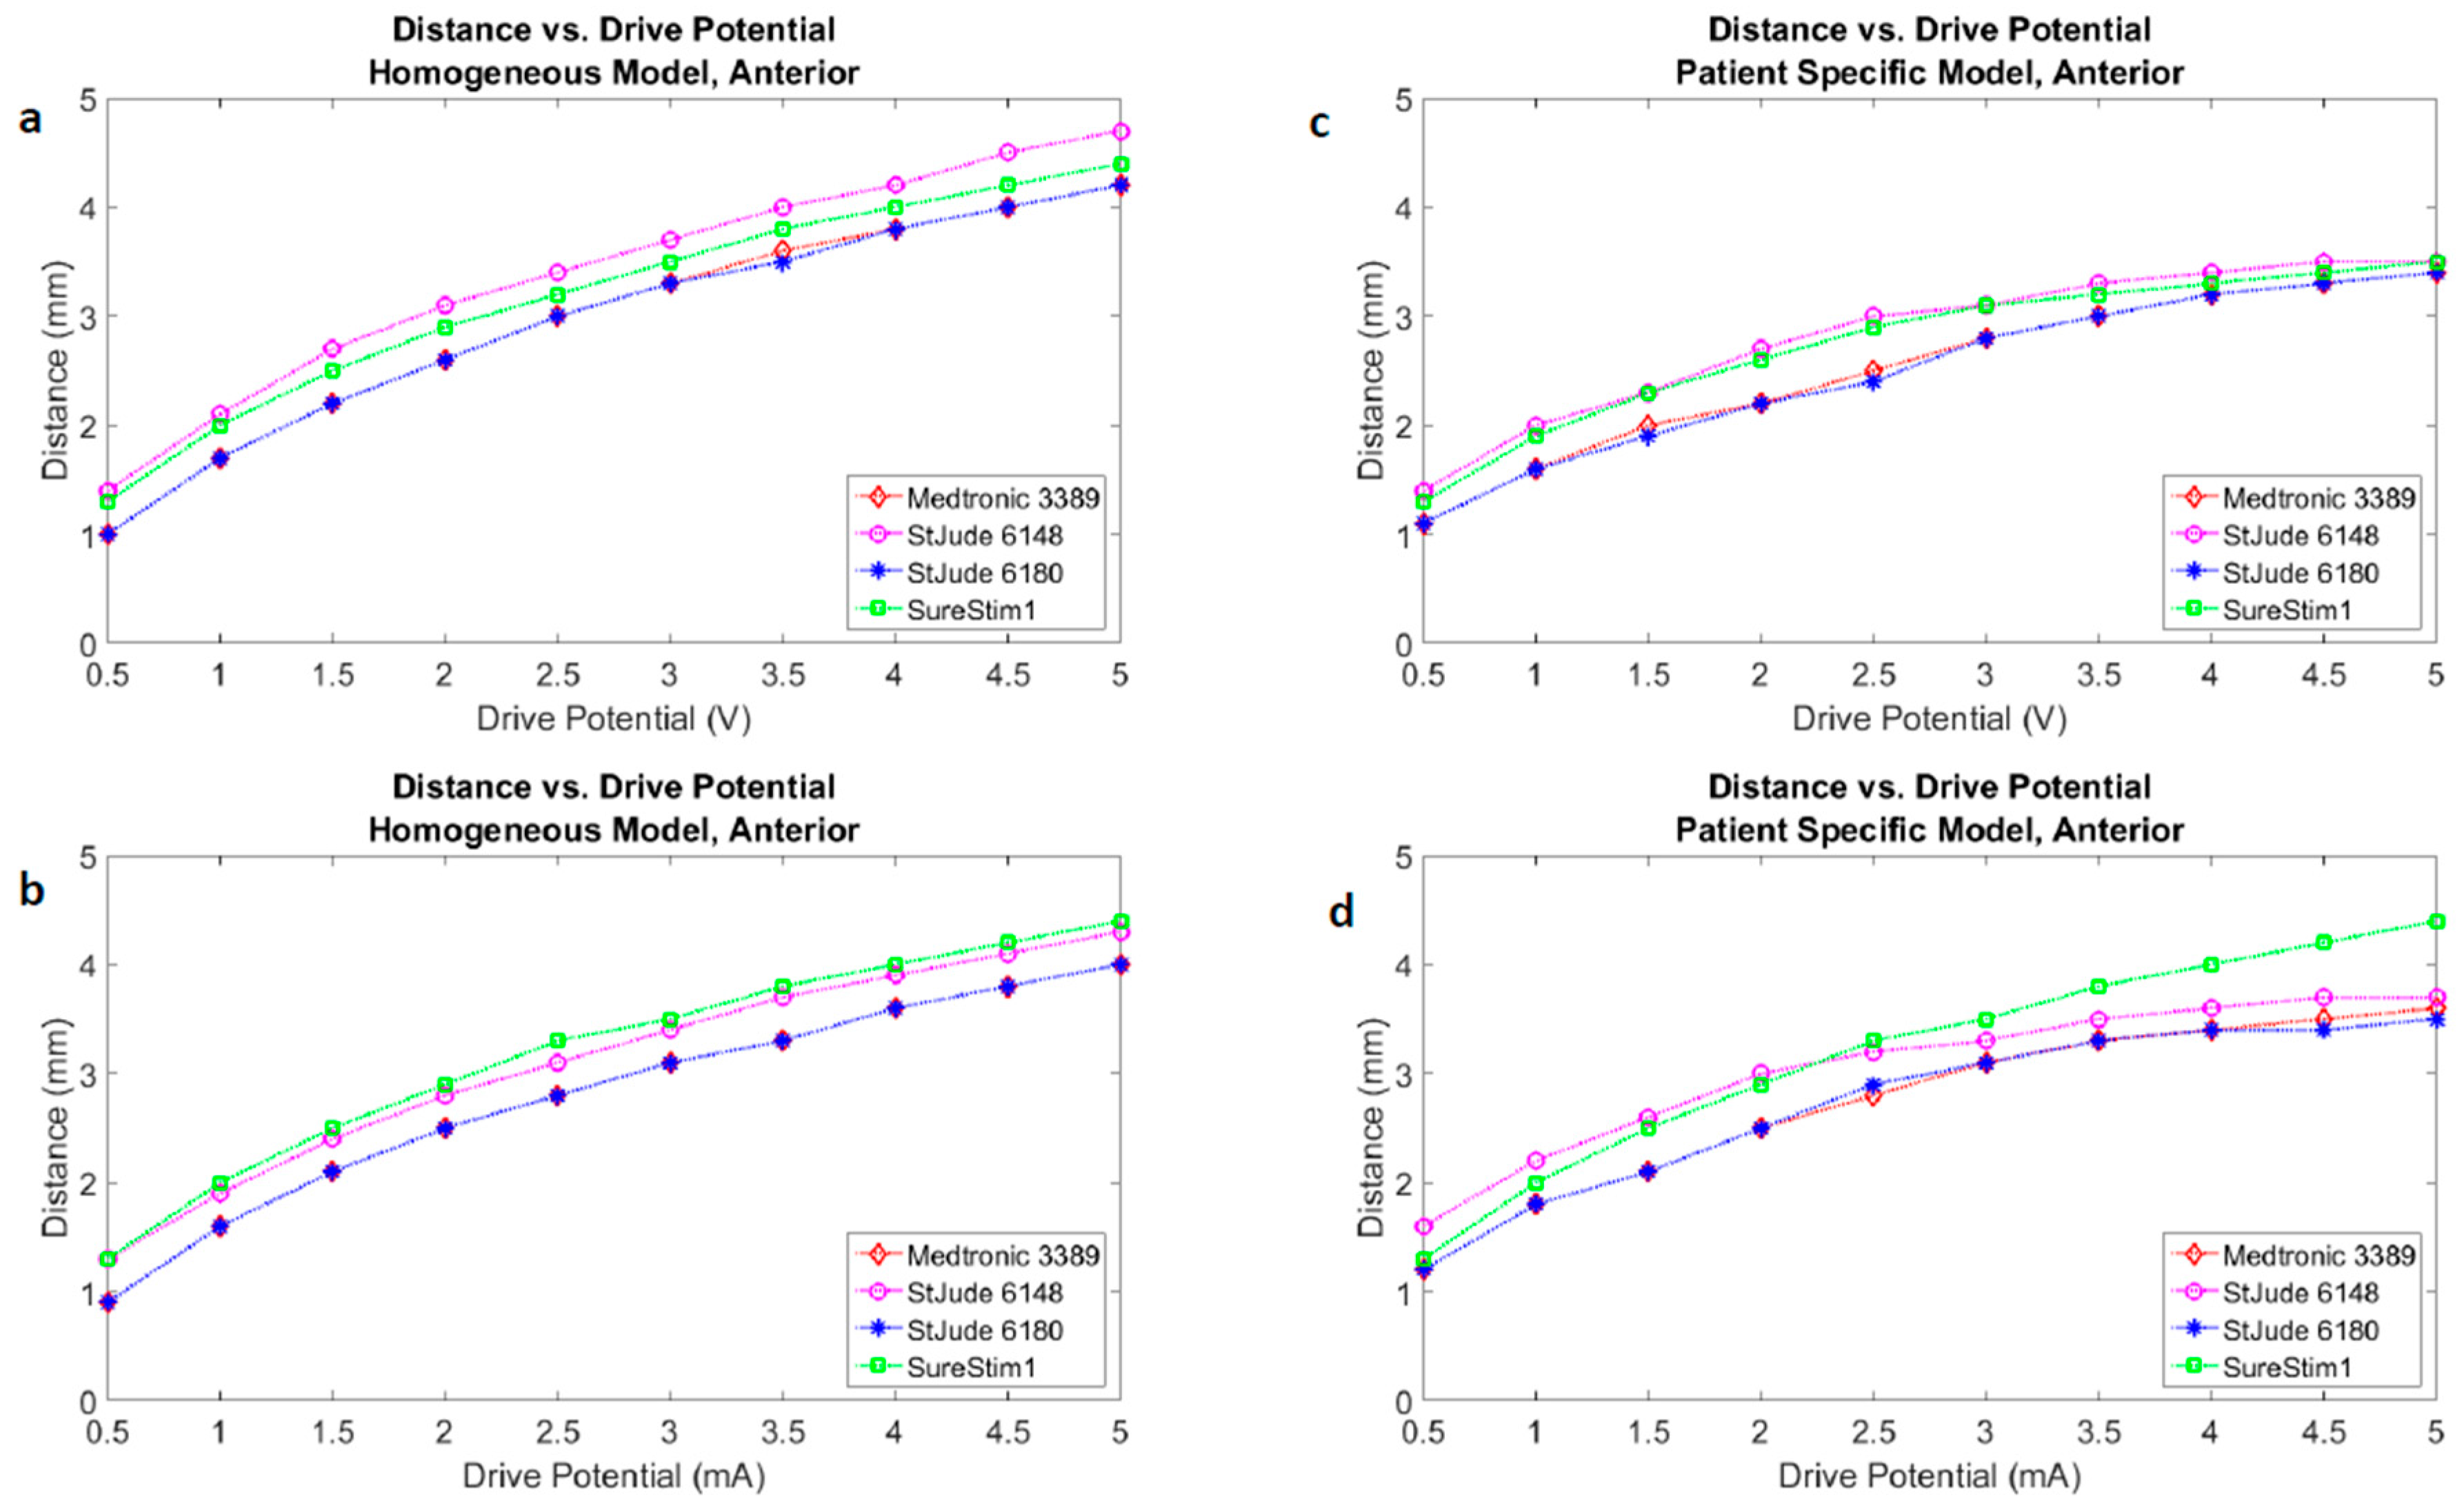
3.2. Homogenous vs. Patient-Specific Models
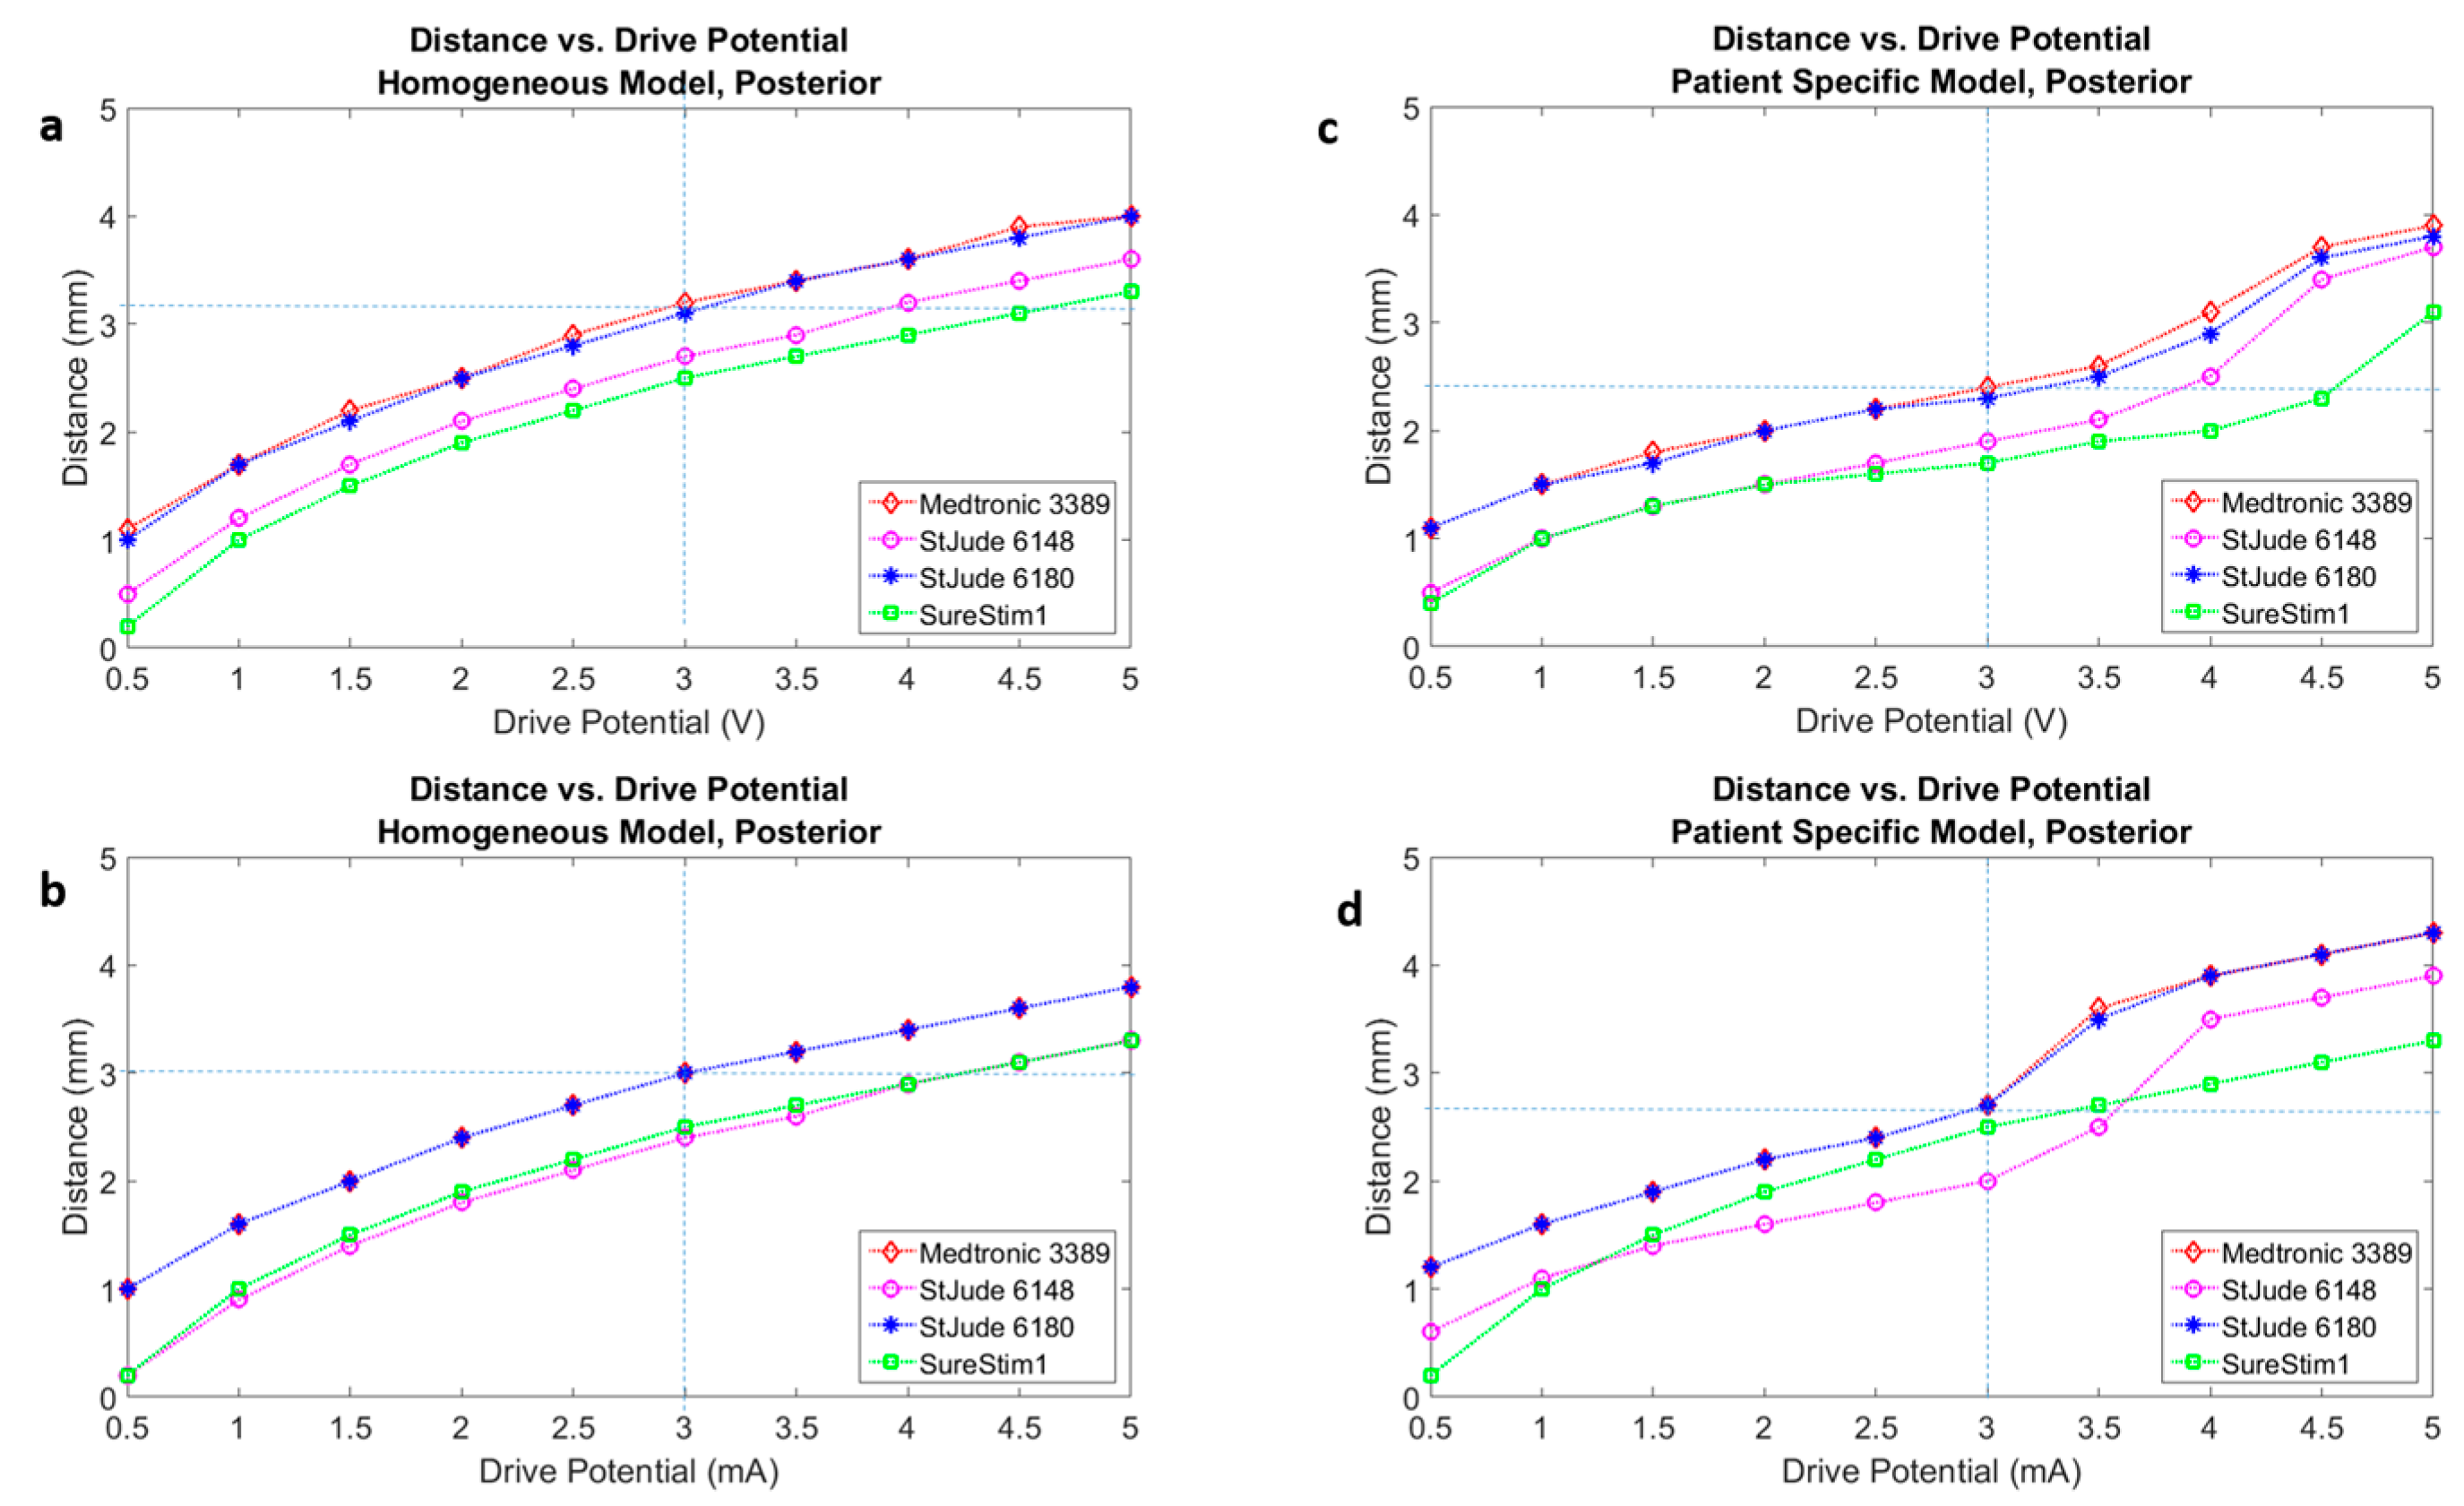
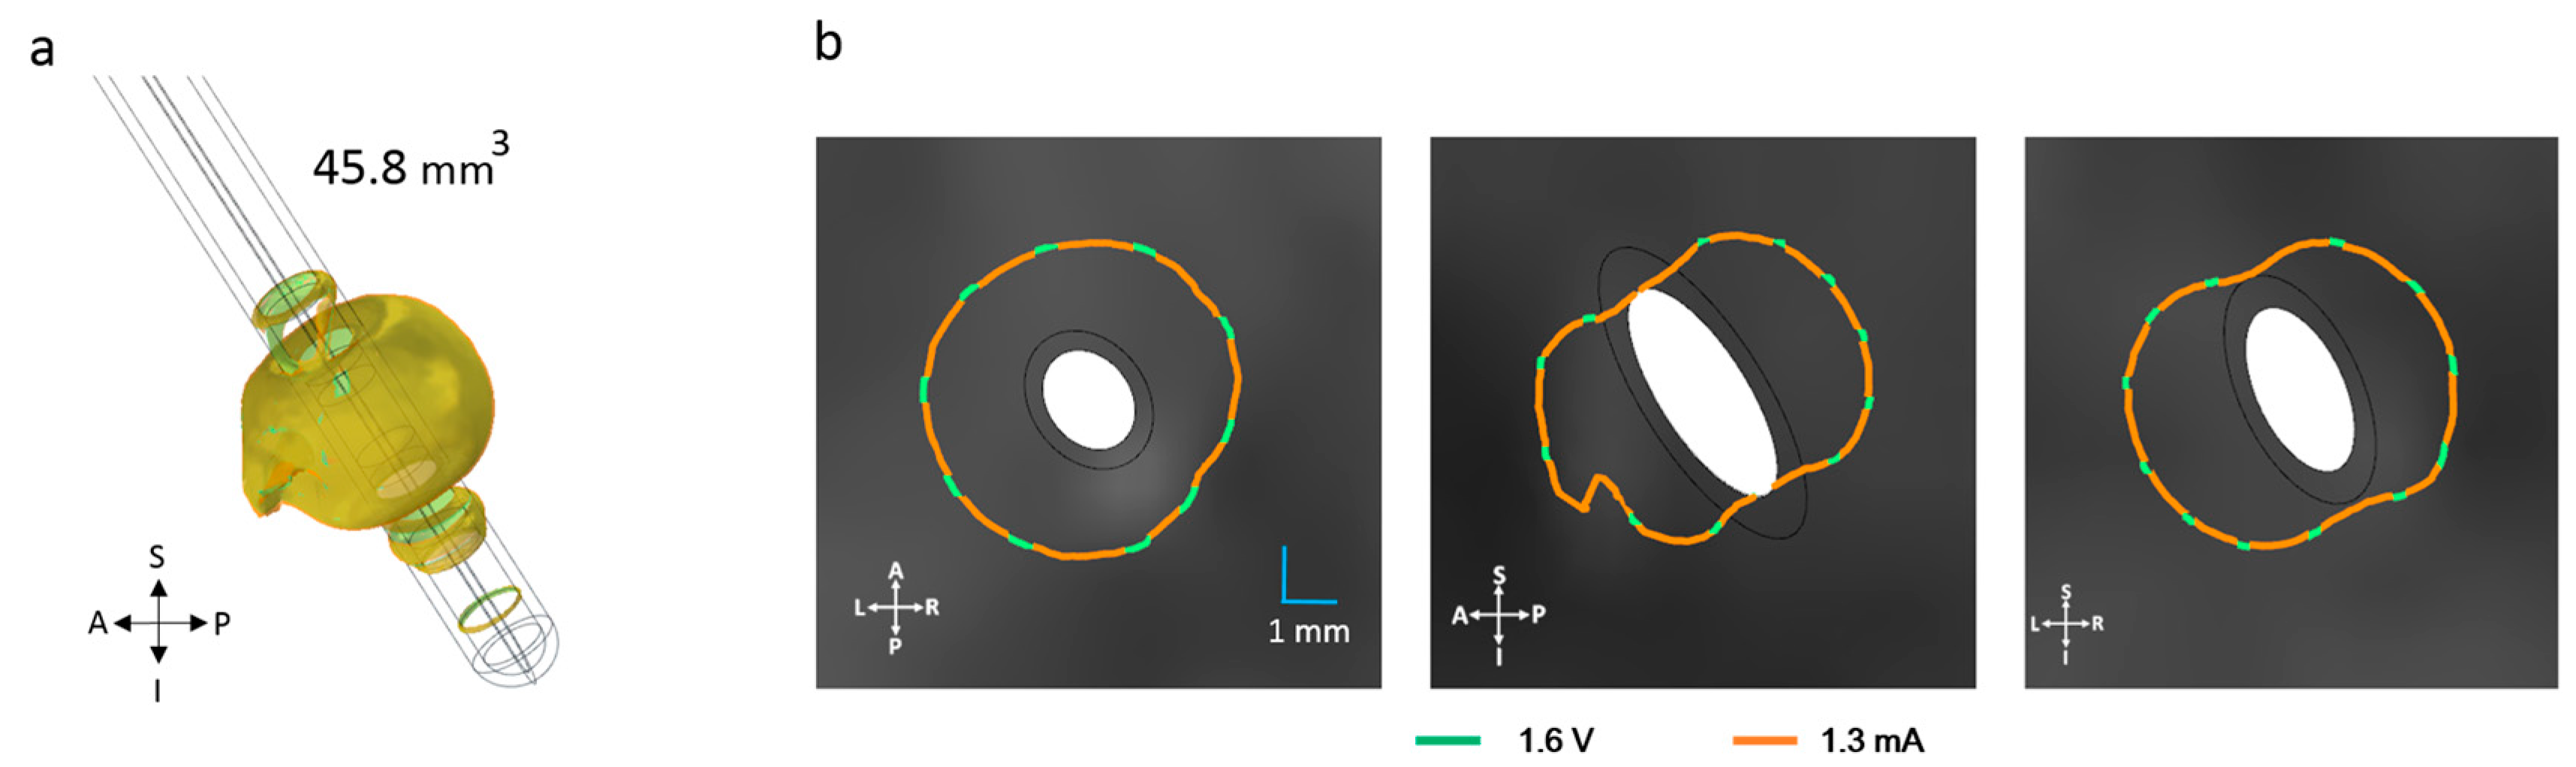
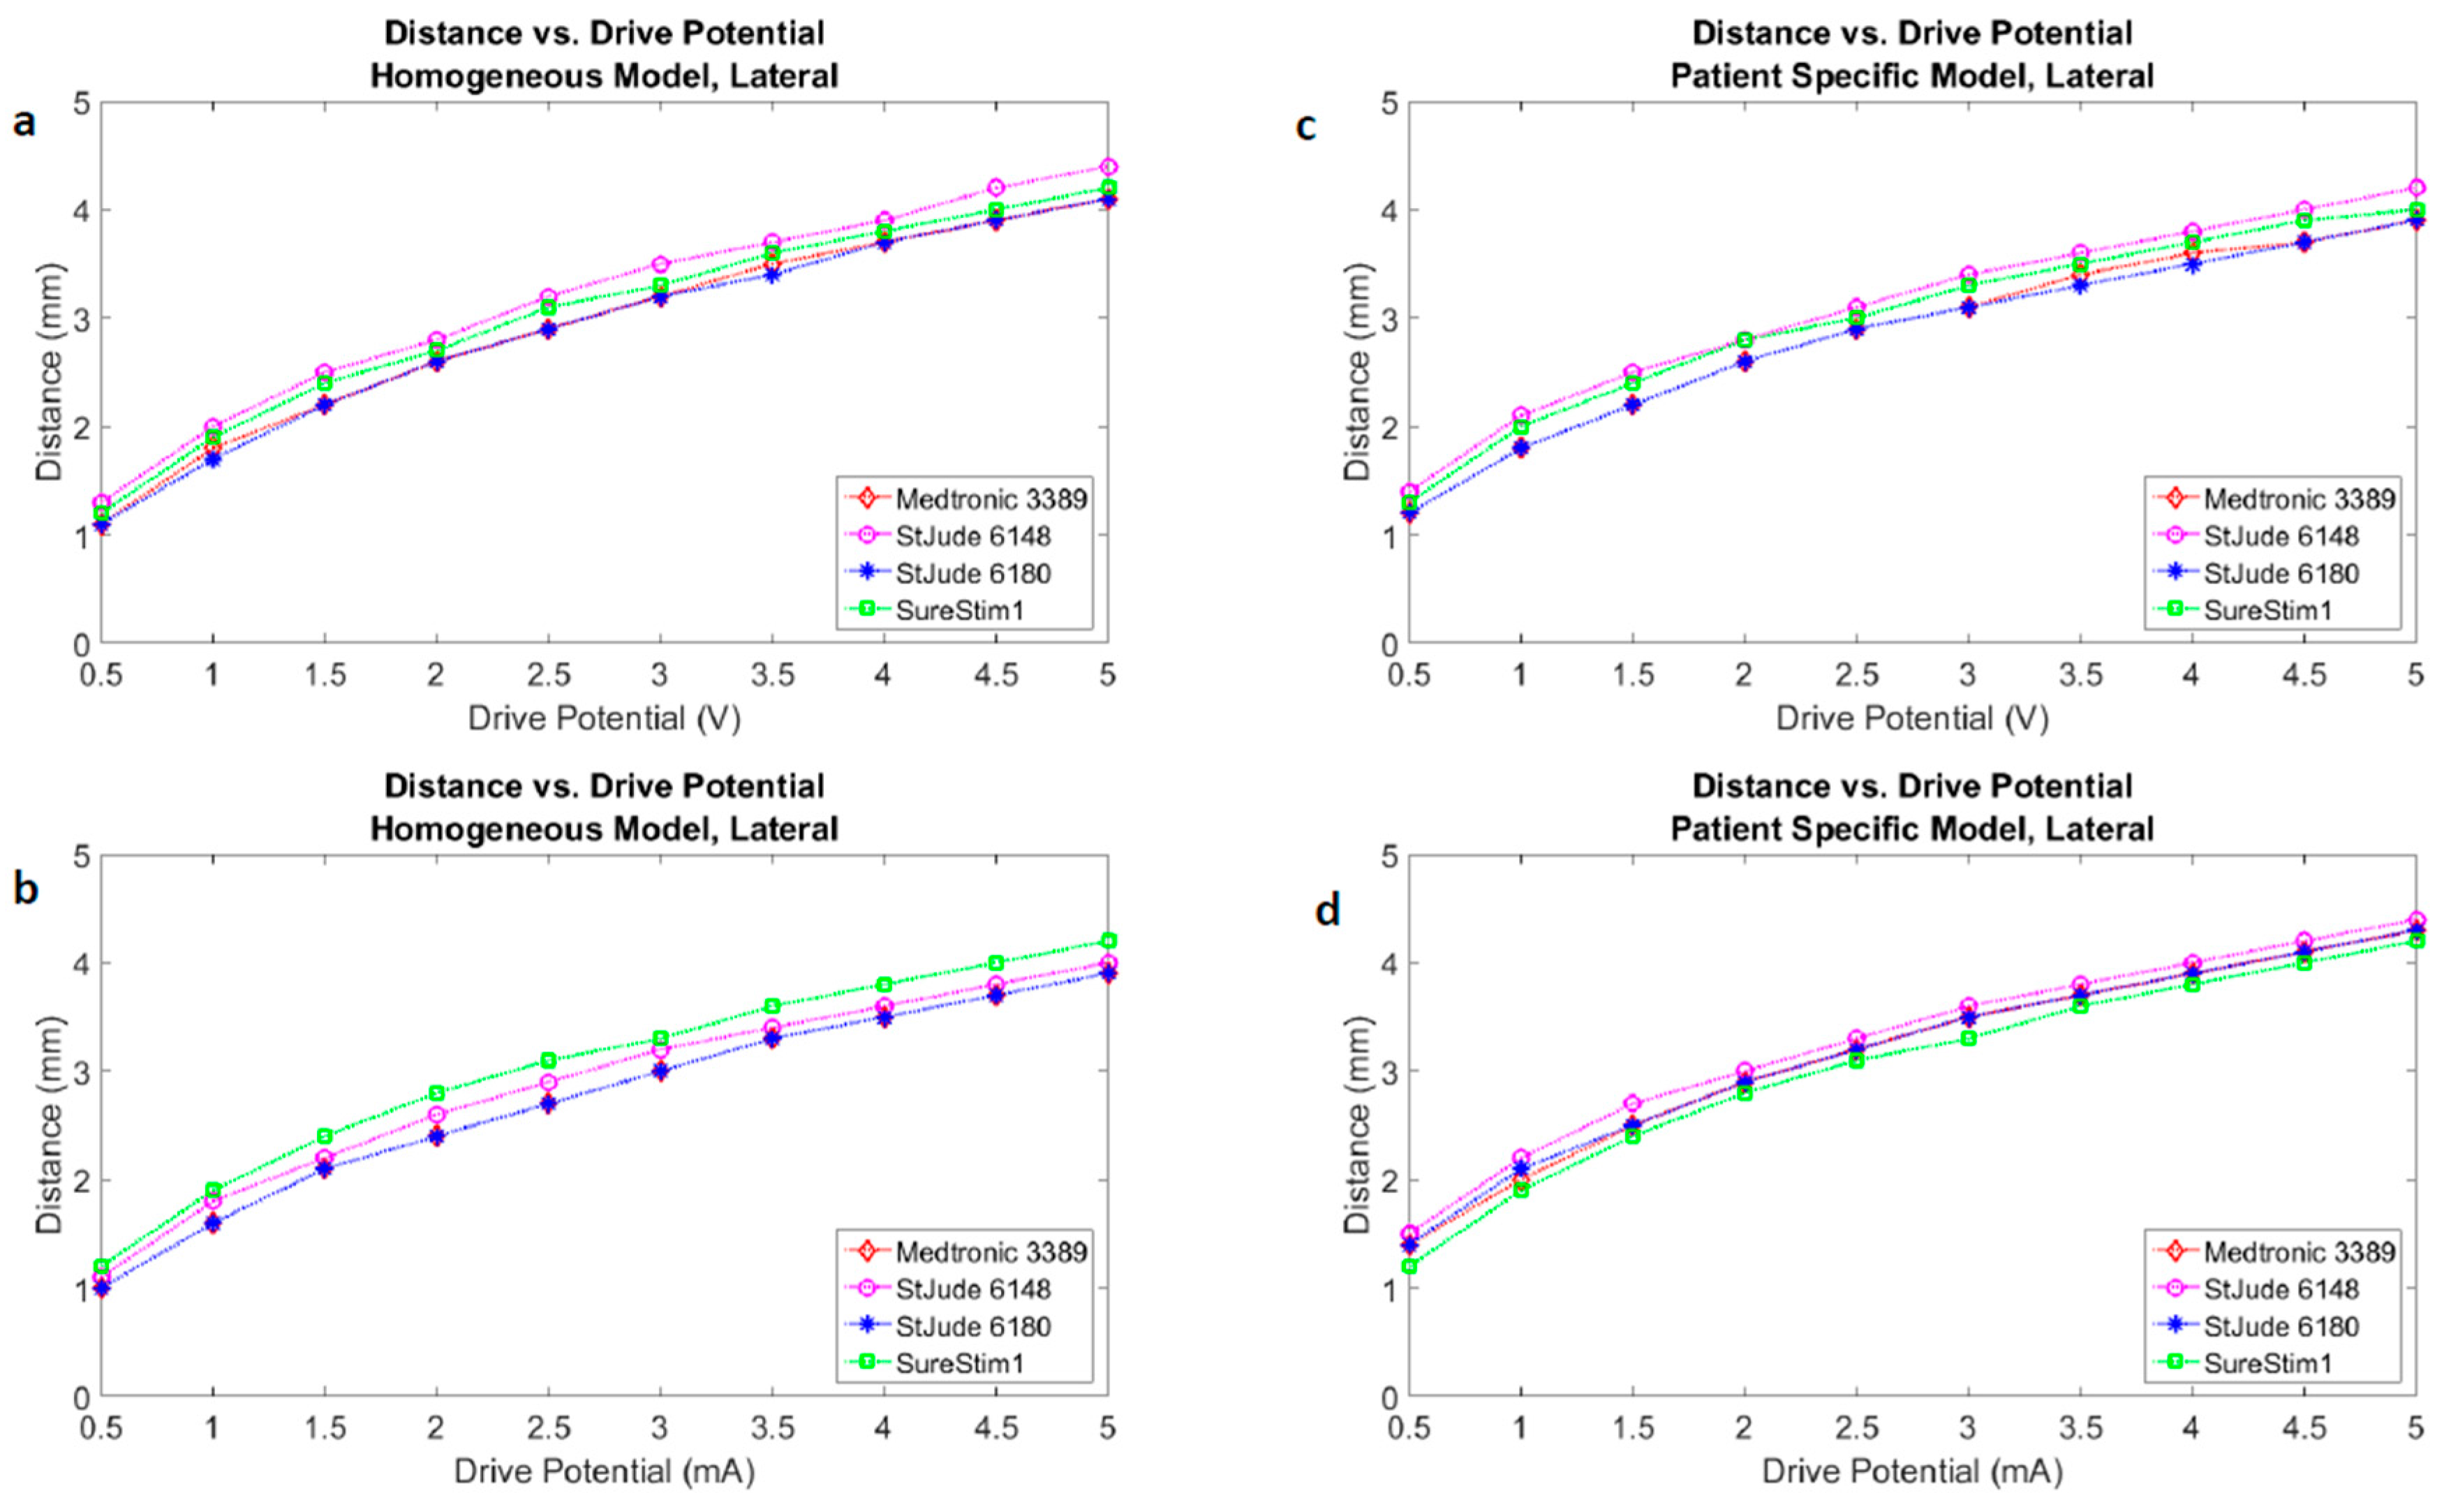
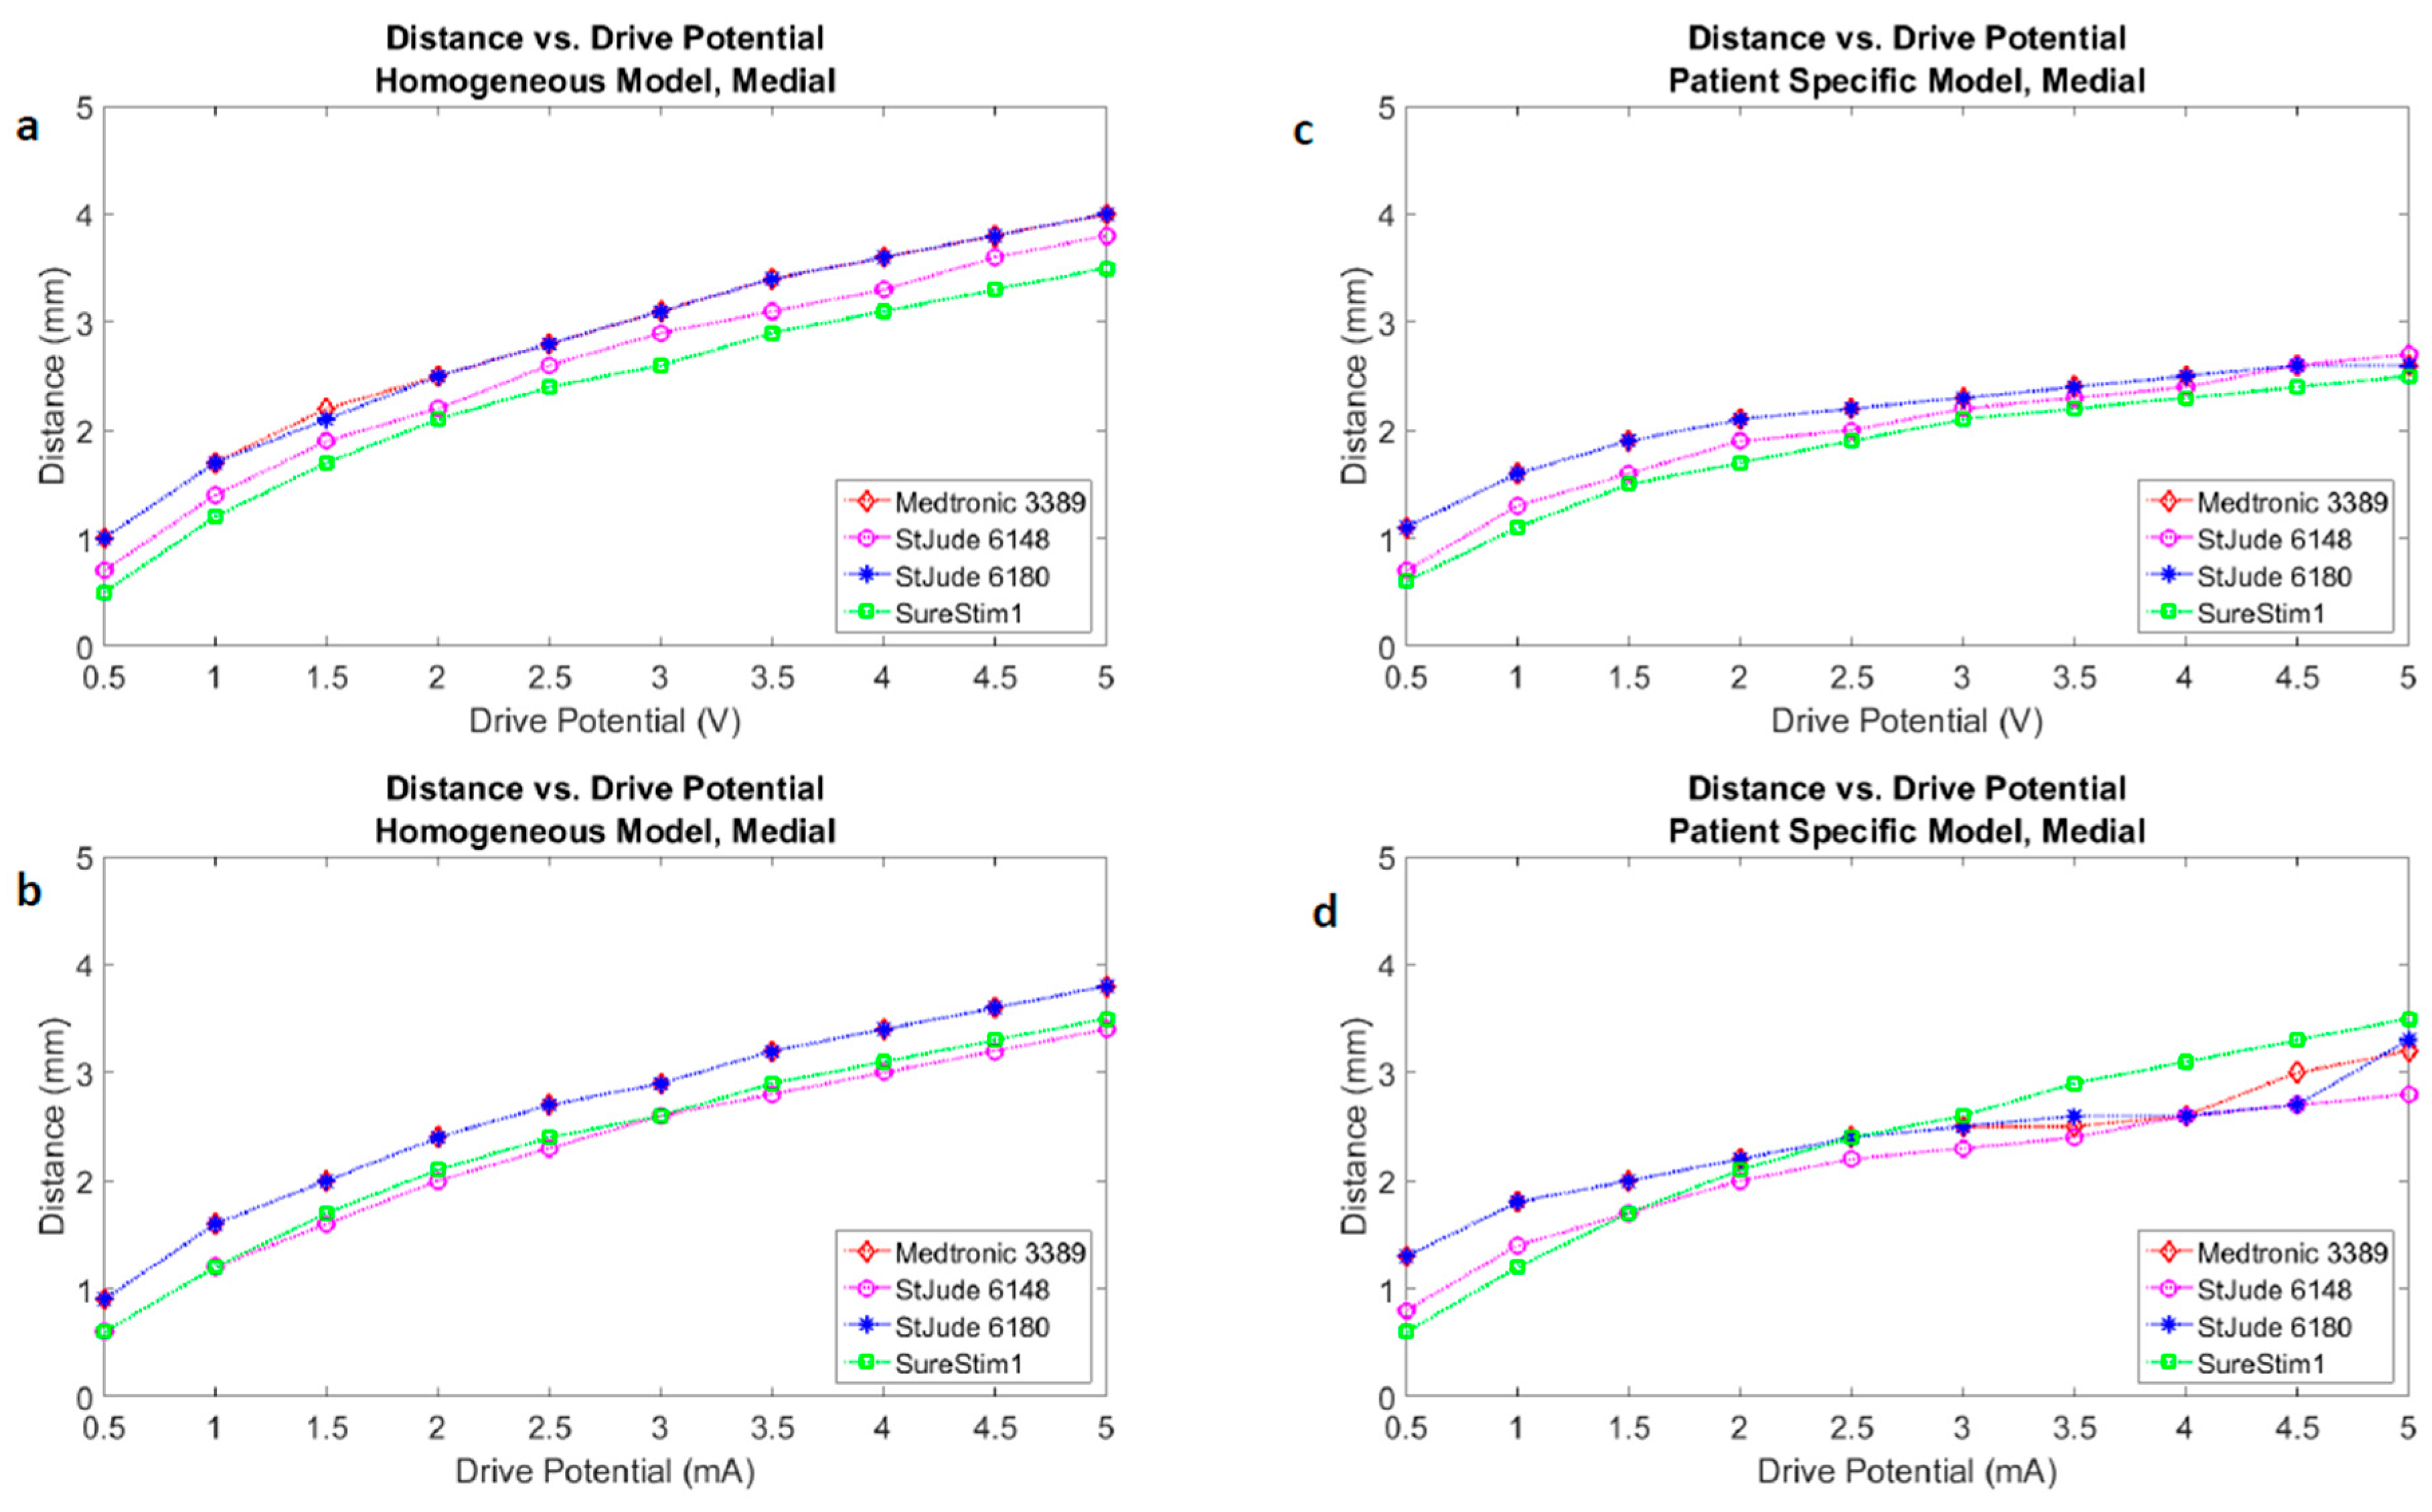
3.3. Lead Comparison
3.4. Patient-Specific Stimulation Amplitude Setting
3.5. Steering Function
4. Discussion
4.1. FEM and Neuron Modelling
4.2. Homogeneous vs. Patient-Specific Tissue Models
4.3. DBS Leads Comparison
4.4. Patient-Specific Stimulation Amplitude Setting
4.5. Steering DBS Leads
5. Conclusions
Acknowledgments
Author Contributions
Conflicts of Interest
Appendix


References
- Hariz, M.; Blomstedt, P.; Zrinzo, L. Future of brain stimulation: New targets, new indications, new technology. Mov. Disord. 2013, 28, 1784–1792. [Google Scholar] [CrossRef] [PubMed]
- Martens, H.C.; Toader, E.; Decre, M.M.; Anderson, D.J.; Vetter, R.; Kipke, D.R.; Baker, K.B.; Johnson, M.D.; Vitek, J.L. Spatial steering of deep brain stimulation volumes using a novel lead design. Clin. Neurophysiol. 2011, 122, 558–566. [Google Scholar] [CrossRef] [PubMed]
- Mahlknecht, P.; Limousin, P.; Foltynie, T. Deep brain stimulation for movement disorders: Update on recent discoveries and outlook on future developments. J. Neurol. 2015, 262, 2583–2595. [Google Scholar] [CrossRef] [PubMed]
- Gross, R.E.; McDougal, M.E. Technological advances in the surgical treatment of movement disorders. Curr. Neurol. Neurosci. Rep. 2013, 13, 371. [Google Scholar] [CrossRef] [PubMed]
- Hemm, S.; Mennessier, G.; Vayssiere, N.; Cif, L.; El Fertit, H.; Coubes, P. Deep brain stimulation in movement disorders: Stereotactic coregistration of two-dimensional electrical field modeling and magnetic resonance imaging. J. Neurosurg. 2005, 103, 949–955. [Google Scholar] [CrossRef] [PubMed]
- Åström, M.; Tripoliti, E.; Hariz, M.I.; Zrinzo, L.U.; Martinez-Torres, I.; Limousin, P.; Wårdell, K. Patient-specific model-based investigation of speech intelligibility and movement during deep brain stimulation. Stereotact. Funct. Neurosurg. 2010, 88, 224–233. [Google Scholar] [CrossRef] [PubMed]
- Coenen, V.A.; Allert, N.; Paus, S.; Kronenburger, M.; Urbach, H.; Madler, B. Modulation of the cerebello-thalamo-cortical network in thalamic deep brain stimulation for tremor: A diffusion tensor imaging study. Neurosurgery 2014, 75, 657–669. [Google Scholar] [CrossRef] [PubMed]
- Wårdell, K.; Kefalopoulou, Z.; Diczfalusy, E.; Andersson, M.; Astrom, M.; Limousin, P.; Zrinzo, L.; Hariz, M. Deep brain stimulation of the pallidum internum for gilles de la tourette syndrome: A patient-specific model-based simulation study of the electric field. Neuromodulation 2015, 18, 90–96. [Google Scholar] [CrossRef] [PubMed]
- Butson, C.R.; Cooper, S.E.; Henderson, J.M.; McIntyre, C.C. Patient-specific analysis of the volume of tissue activated during deep brain stimulation. NeuroImage 2007, 34, 661–670. [Google Scholar] [CrossRef] [PubMed]
- Chaturvedi, A.; Butson, C.R.; Lempka, S.F.; Cooper, S.E.; McIntyre, C.C. Patient-specific models of deep brain stimulation: Influence of field model complexity on neural activation predictions. Brain Stimul. 2010, 3, 65–67. [Google Scholar] [CrossRef] [PubMed]
- Alonso, F.; Hemm-Ode, S.; Wårdell, K. Influence on deep brain stimulation from lead design, operating mode and tissue impedance changes—A simulation study. Brain Disord. Ther. 2015, 4, 3. [Google Scholar]
- Åström, M.; Lemaire, J.J.; Wårdell, K. Influence of heterogeneous and anisotropic tissue conductivity on electric field distribution in deep brain stimulation. Med. Biol. Eng. Comput 2012, 50, 23–32. [Google Scholar] [CrossRef] [PubMed]
- Schmidt, C.; van Rienen, U. Modeling the field distribution in deep brain stimulation: The influence of anisotropy of brain tissue. IEEE Trans. Biomed. Eng. 2012, 59, 1583–1592. [Google Scholar] [CrossRef] [PubMed]
- Åström, M.; Diczfalusy, E.; Martens, H.; Wårdell, K. Relationship between neural activation and electric field distribution during deep brain stimulation. IEEE Trans. Biomed. Eng. 2015, 62, 664–672. [Google Scholar] [CrossRef] [PubMed]
- Wårdell, K.; Hemm-Ode, S.; Rejmstad, P.; Zsigmond, P. High-resolution laser doppler measurements of microcirculation in the deep brain structures: A method for potential vessel tracking. Stereotact. Funct. Neurosurg. 2016, 94, 1–9. [Google Scholar] [CrossRef] [PubMed]
- Wårdell, K.; Diczfalusy, E.; Åström, M. Patient-specific modeling and simulation of deep brain stimulation. In Studies in Mechanobiology, Tissue Engineering and Biomaterials; Springer Berlin Heidelberg: Heidelberg, Germeny, 2011; Volume 9, pp. 357–375. [Google Scholar]
- Åström, M.; Zrinzo, L.U.; Tisch, S.; Tripoliti, E.; Hariz, M.I.; Wårdell, K. Method for patient-specific finite element modeling and simulation of deep brain stimulation. Med. Biol. Eng. Comput. 2009, 47, 21–28. [Google Scholar] [CrossRef] [PubMed]
- Gabriel, S.; Lau, R.W.; Gabriel, C. The dielectric properties of biological tissues: II. Measurements in the frequency range 10 hz to 20 ghz. Phys. Med. Biol. 1996, 41, 2251–2269. [Google Scholar] [CrossRef] [PubMed]
- Audreccetti, D.; Fossi, R.; Petrucci, C. Dielectric Properties of Body Tissue. Italian National Research Council. Available online: http://niremf.ifac.cnr.it/tissprop/htmlclie/htmlclie.htm#atsftag (accessed on 4 April 2016).
- Wårdell, K.; Zrinzo, L.; Hariz, M.; Andersson, M. Patient-Specific Brain Modelling for Deep Brain Stimulation Simulation. In Proceedings of the 6th International IEEE/EMBS Conference on Neural Engineering proceedings, California, CA, USA, 6–8 November 2013.
- Yousif, N.; Bayford, R.; Liu, X. The influence of reactivity of the electrode-brain interface on the crossing electric current in therapeutic deep brain stimulation. Neuroscience 2008, 156, 597–606. [Google Scholar] [CrossRef] [PubMed]
- Nielsen, M.S.; Bjarkam, C.R.; Sorensen, J.C.; Bojsen-Moller, M.; Sunde, N.A.; Ostergaard, K. Chronic subthalamic high-frequency deep brain stimulation in Parkinson’s disease—A histopathological study. Eur. J. Neurol. 2007, 14, 132–138. [Google Scholar] [CrossRef] [PubMed]
- McIntyre, C.C.; Mori, S.; Sherman, D.L.; Thakor, N.V.; Vitek, J.L. Electric field and stimulating influence generated by deep brain stimulation of the subthalamic nucleus. Clin. Neurophysiol. 2004, 115, 589–595. [Google Scholar] [CrossRef] [PubMed]
- Kuncel, A.M.; Cooper, S.E.; Grill, W.M. A method to estimate the spatial extent of activation in thalamic deep brain stimulation. Clin. Neurophysiol. 2008, 119, 2148–2158. [Google Scholar] [CrossRef] [PubMed]
- Madler, B.; Coenen, V.A. Explaining clinical effects of deep brain stimulation through simplified target-specific modeling of the volume of activated tissue. AJNR Am. J. Neuroradiol. 2012, 33, 1072–1080. [Google Scholar] [CrossRef] [PubMed]
- Bronstein, J.M.; Tagliati, M.; McIntyre, C.; Chen, R.; Cheung, T.; Hargreaves, E.L.; Israel, Z.; Moffitt, M.; Montgomery, E.B.; Stypulkowski, P.; et al. The rationale driving the evolution of deep brain stimulation to constant-current devices. Neuromodulation 2015, 18, 85–89. [Google Scholar] [CrossRef] [PubMed]
- Ning, L.; Setsompop, K.; Michailovich, O.; Makris, N.; Shenton, M.E.; Westin, C.F.; Rathi, Y. A joint compressed-sensing and super-resolution approach for very high-resolution diffusion imaging. Neuroimage 2016, 125, 386–400. [Google Scholar] [CrossRef] [PubMed]
- Wei, X.F.; Grill, W.M. Current density distributions, field distributions and impedance analysis of segmented deep brain stimulation electrodes. J. Neural. Eng. 2005, 2, 139–147. [Google Scholar] [CrossRef] [PubMed]
- Contarino, M.F.; Bour, L.J.; Verhagen, R.; Lourens, M.A.; de Bie, R.M.; van den Munckhof, P.; Schuurman, P.R. Directional steering: A novel approach to deep brain stimulation. Neurology 2014, 83, 1163–1169. [Google Scholar] [CrossRef] [PubMed]
- Cubo, R.; Åström, M.; Medvedev, A. Target coverage and selectivity in field steering brain stimulation. Conf. Proc. IEEE Eng. Med. Biol Soc. 2014. [Google Scholar] [CrossRef]
- Van Dijk, K.J.; Verhagen, R.; Chaturvedi, A.; McIntyre, C.C.; Bour, L.J.; Heida, C.; Veltink, P.H. A novel lead design enables selective deep brain stimulation of neural populations in the subthalamic region. J. Neural. Eng. 2015, 12, 046003. [Google Scholar] [CrossRef] [PubMed]


| Model | Voltage | Current | Voltage | Current |
|---|---|---|---|---|
| Volumes (mm3) | Volumes (mm3) | Difference (%) | Difference (%) | |
| HOMOGENEOUS | 144 | 144 | 0 | 0 |
| ZI | 118.0 | 177.4 | −18.0 | 22.9 |
| VIM | 111.0 | 160.5 | −23.2 | 11.4 |
| Lead | ZI (mm3) | VIM (mm3) | Relative Difference (%) | |||
|---|---|---|---|---|---|---|
| Voltage | Current | Voltage | Current | Voltage | Current | |
| 3389 | 118.0 | 177.4 | 111.0 | 160.5 | 5.9 | 9.5 |
| 6148 | 127.4 | 174.2 | 116.0 | 155.0 | 8.9 | 11.0 |
| 6180 | 113.0 | 177.8 | 107.5 | 161.0 | 4.9 | 9.4 |
| SureStim1 | 101.2 | 181.5 | 96.2 | 163.0 | 4.9 | 10.2 |
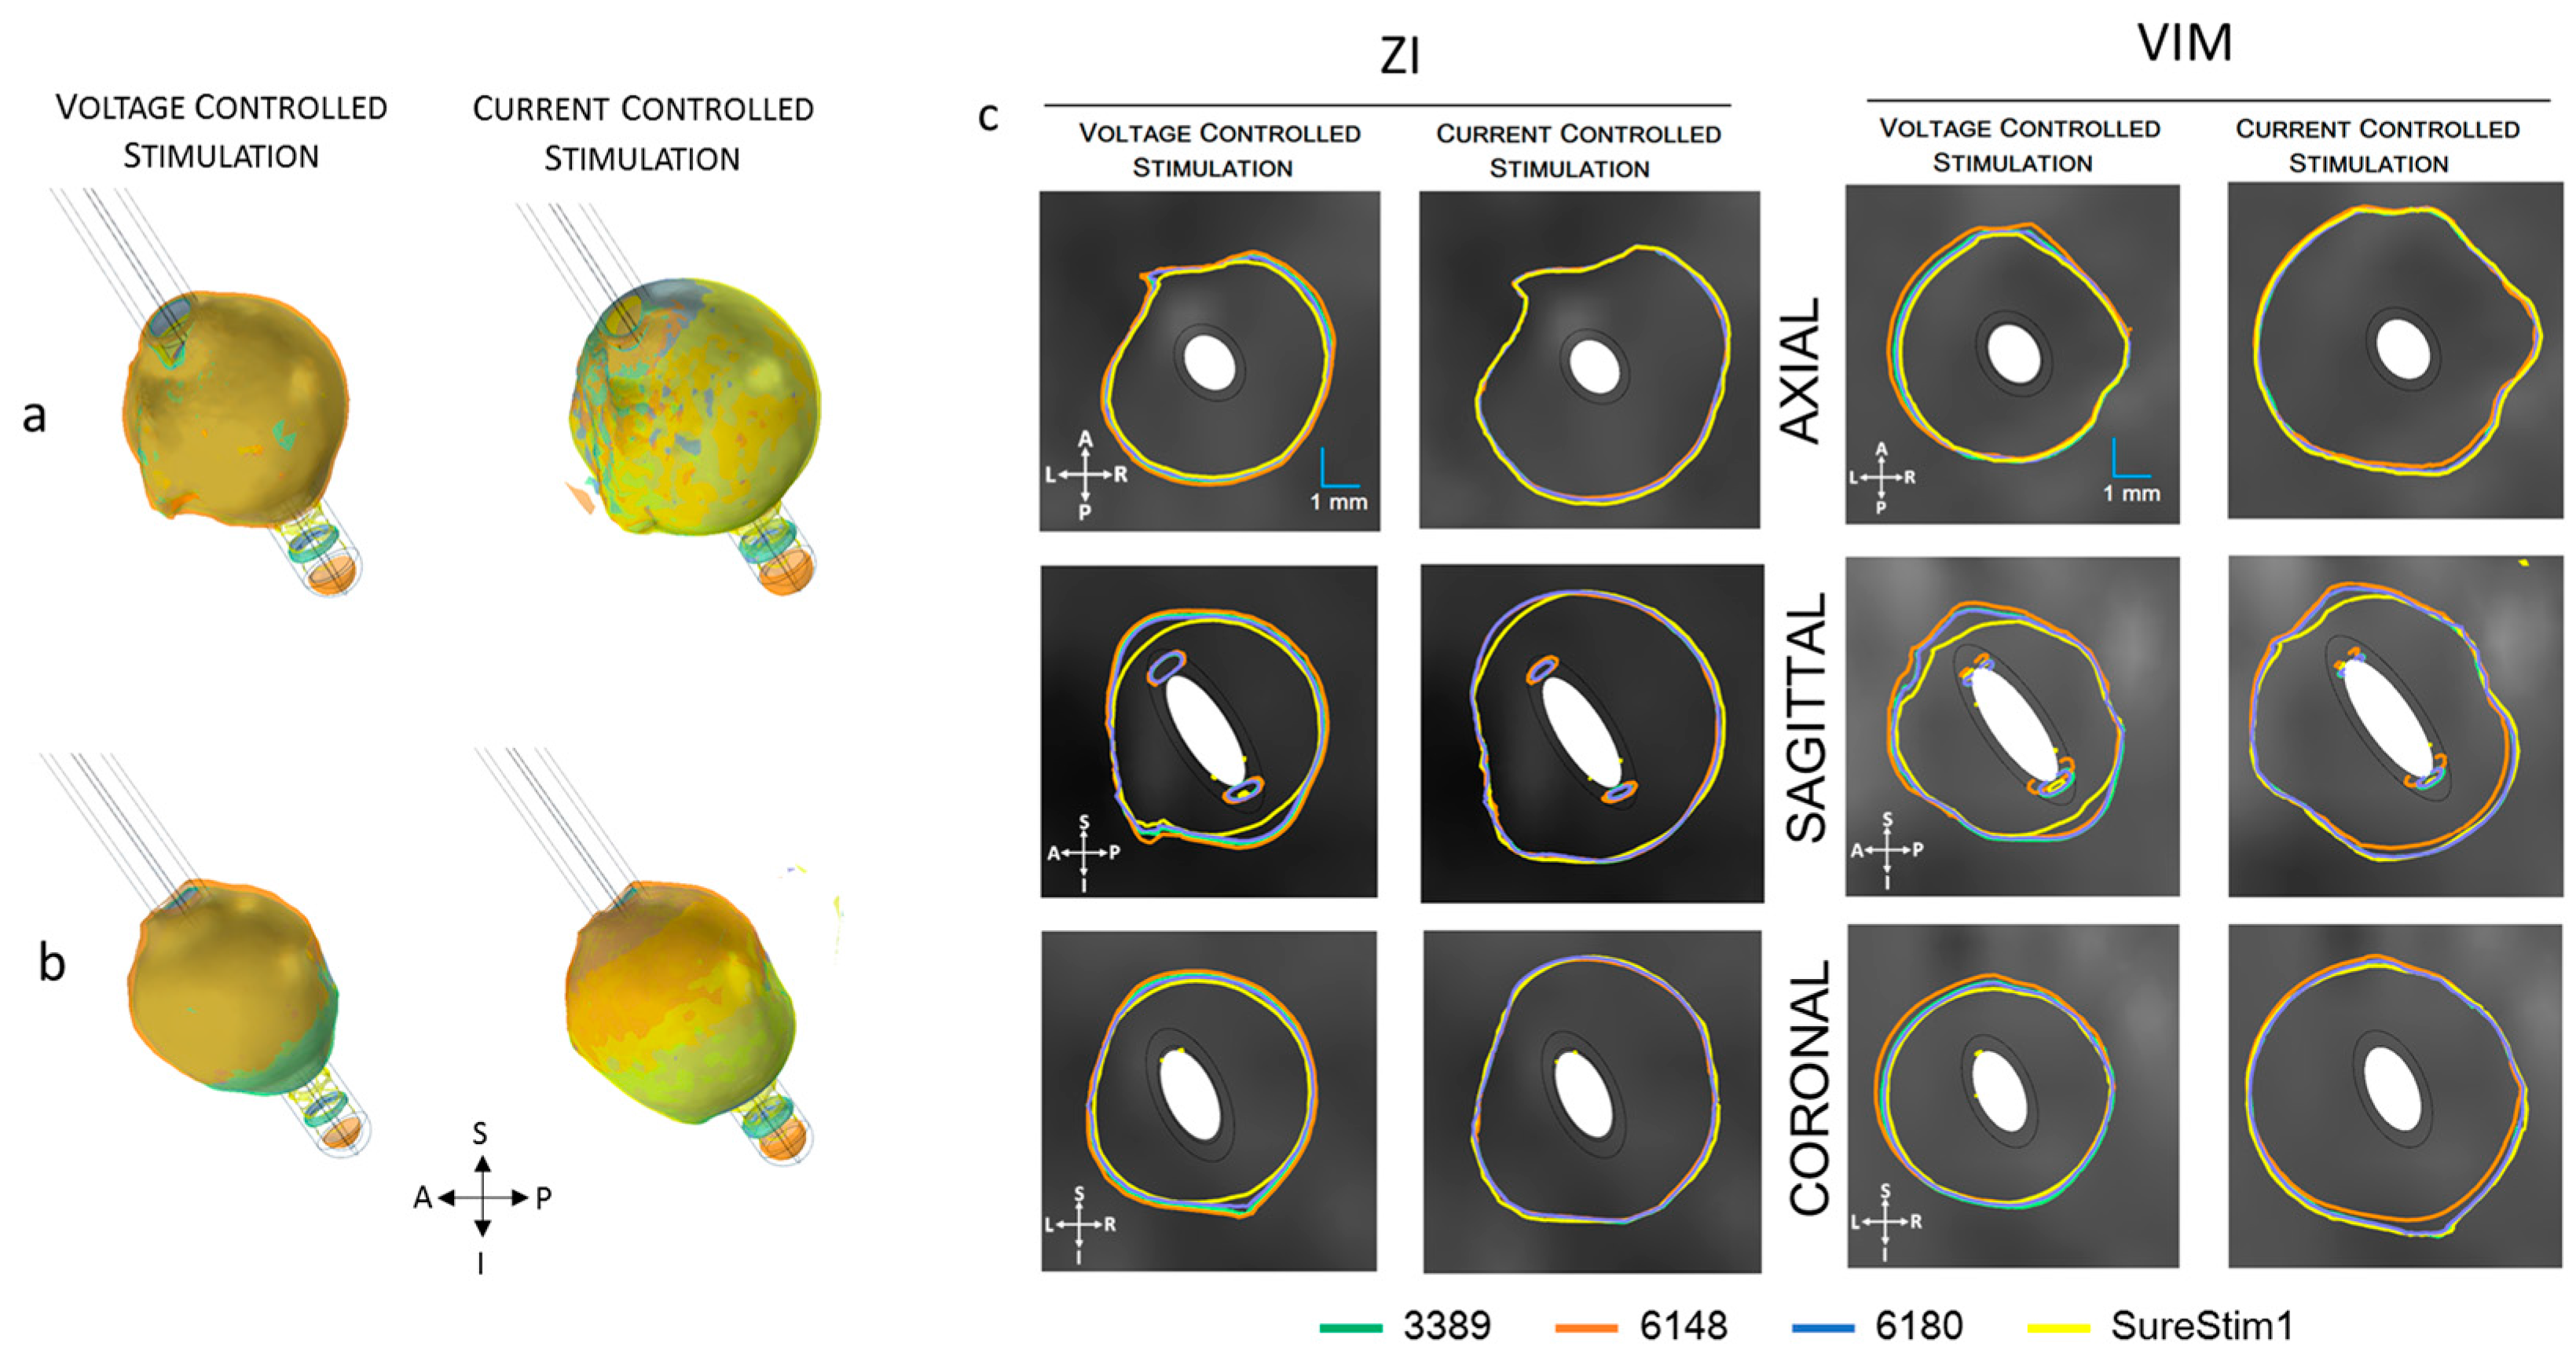
| Plane | 3389 | 6148 | 6180 | SureStim1 | ||||
|---|---|---|---|---|---|---|---|---|
| Voltage | Current | Voltage | Current | Voltage | Current | Voltage | Current | |
| AXIAL | 3.34 | 3.85 | 3.46 | 3.84 | 3.29 | 3.86 | 3.23 | 3.94 |
| SAGITTAL | 3.40 | 3.87 | 3.50 | 3.85 | 3.35 | 3.90 | 3.17 | 3.90 |
| CORONAL | 3.50 | 3.83 | 3.55 | 3.80 | 3.32 | 3.84 | 3.23 | 3.88 |
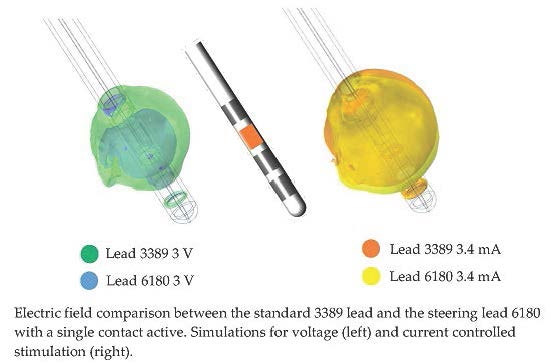
| Plane | 6180 | SureStim1 | Relative Difference (%) | |||
|---|---|---|---|---|---|---|
| Voltage | Current | Voltage | Current | 6180 | SureStim1 | |
| AXIAL | 2.80 | 4.18 | 2.51 | 3.65 | 49 | 45 |
| SAGITTAL | 2.92 | 3.95 | 3.18 | 4.46 | 36 | 40 |
| CORONAL | 2.68 | 4.54 | 3.15 | 4.69 | 69 | 49 |
© 2016 by the authors; licensee MDPI, Basel, Switzerland. This article is an open access article distributed under the terms and conditions of the Creative Commons Attribution (CC-BY) license (http://creativecommons.org/licenses/by/4.0/).
Share and Cite
Alonso, F.; Latorre, M.A.; Göransson, N.; Zsigmond, P.; Wårdell, K. Investigation into Deep Brain Stimulation Lead Designs: A Patient-Specific Simulation Study. Brain Sci. 2016, 6, 39. https://doi.org/10.3390/brainsci6030039
Alonso F, Latorre MA, Göransson N, Zsigmond P, Wårdell K. Investigation into Deep Brain Stimulation Lead Designs: A Patient-Specific Simulation Study. Brain Sciences. 2016; 6(3):39. https://doi.org/10.3390/brainsci6030039
Chicago/Turabian StyleAlonso, Fabiola, Malcolm A. Latorre, Nathanael Göransson, Peter Zsigmond, and Karin Wårdell. 2016. "Investigation into Deep Brain Stimulation Lead Designs: A Patient-Specific Simulation Study" Brain Sciences 6, no. 3: 39. https://doi.org/10.3390/brainsci6030039