


Association between Mood and Sensation Seeking Following rTMS
 ,
,
Abstract
:1. Introduction
2. Materials and Methods
2.1. Subjects
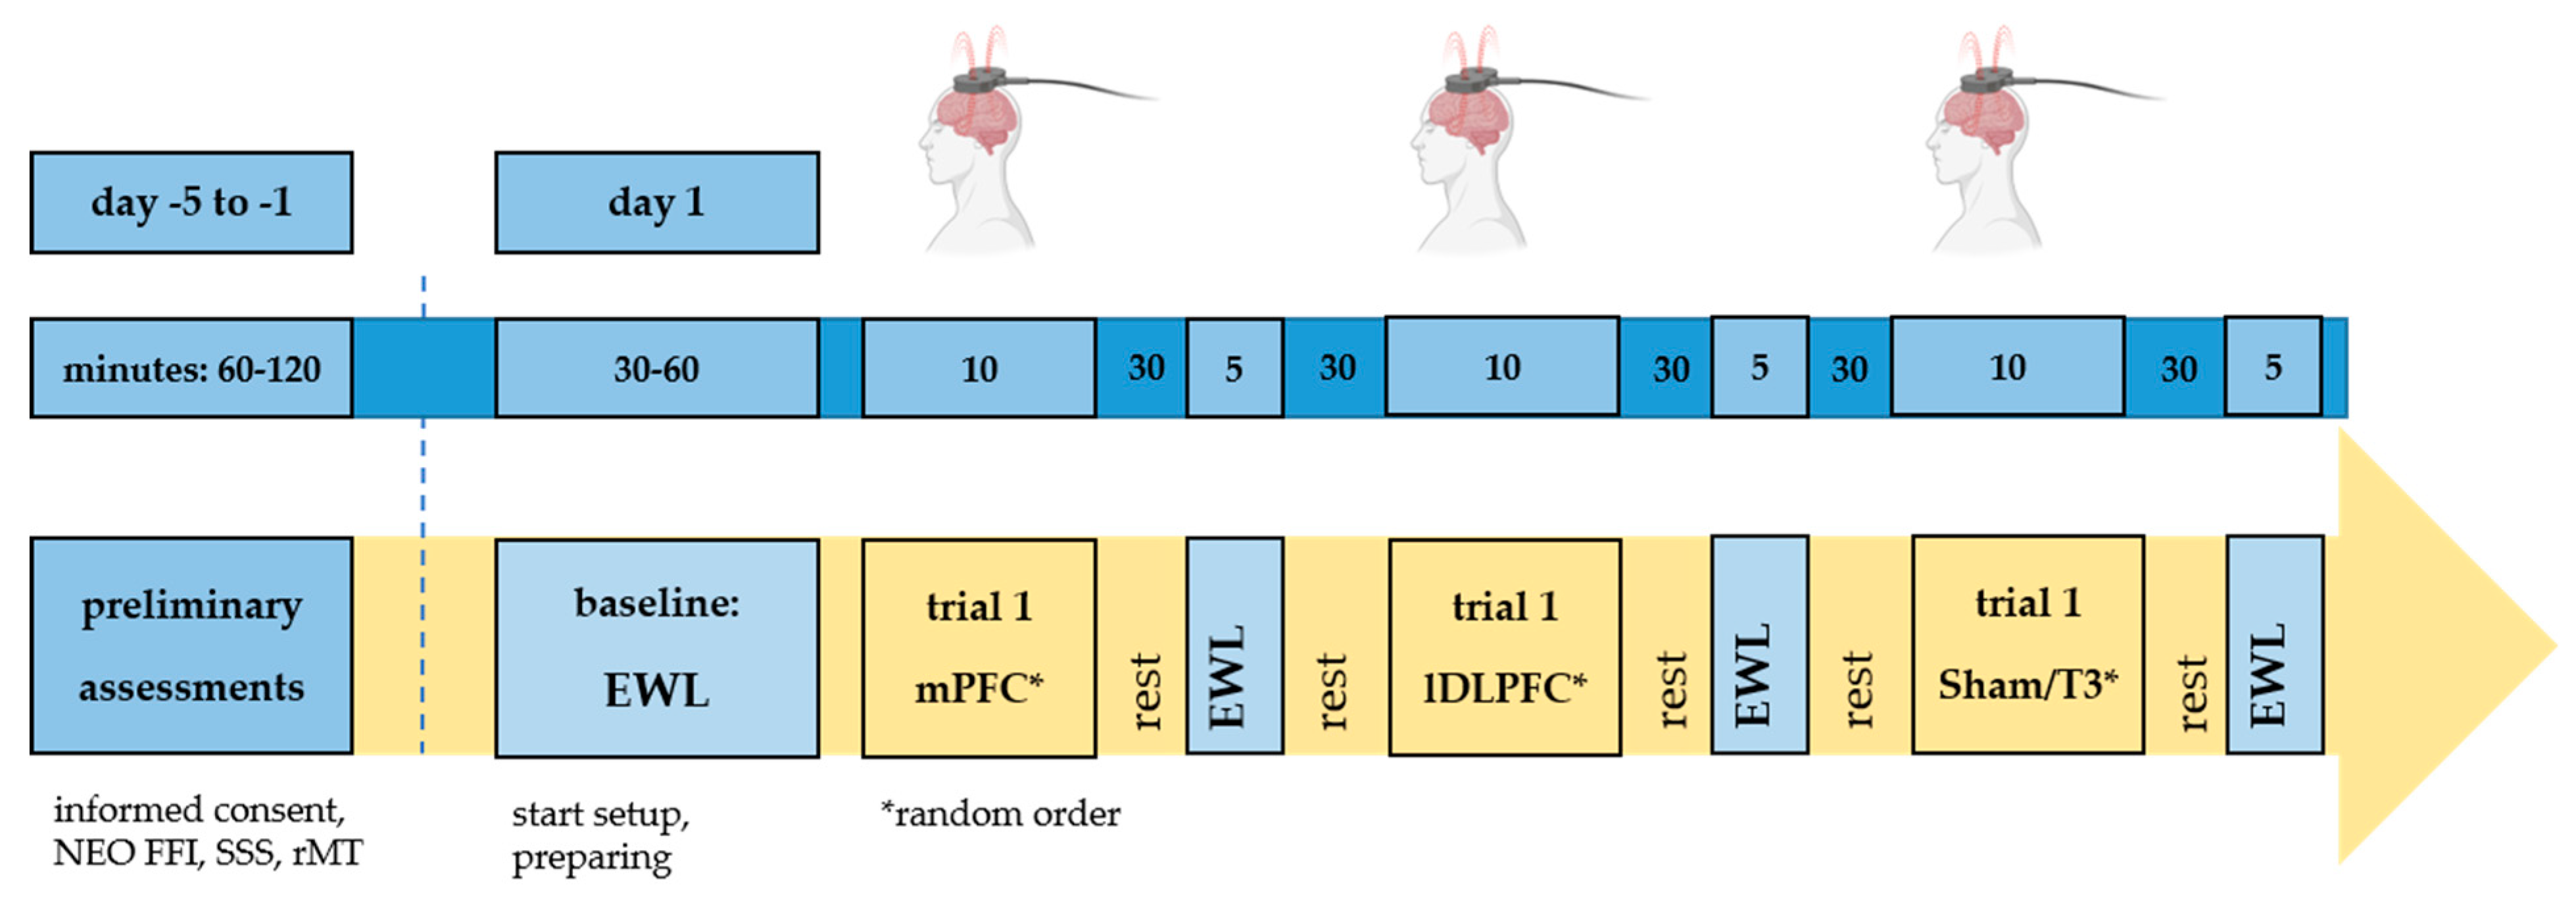
2.2. Trial Design
2.3. Assessment of Personality Traits
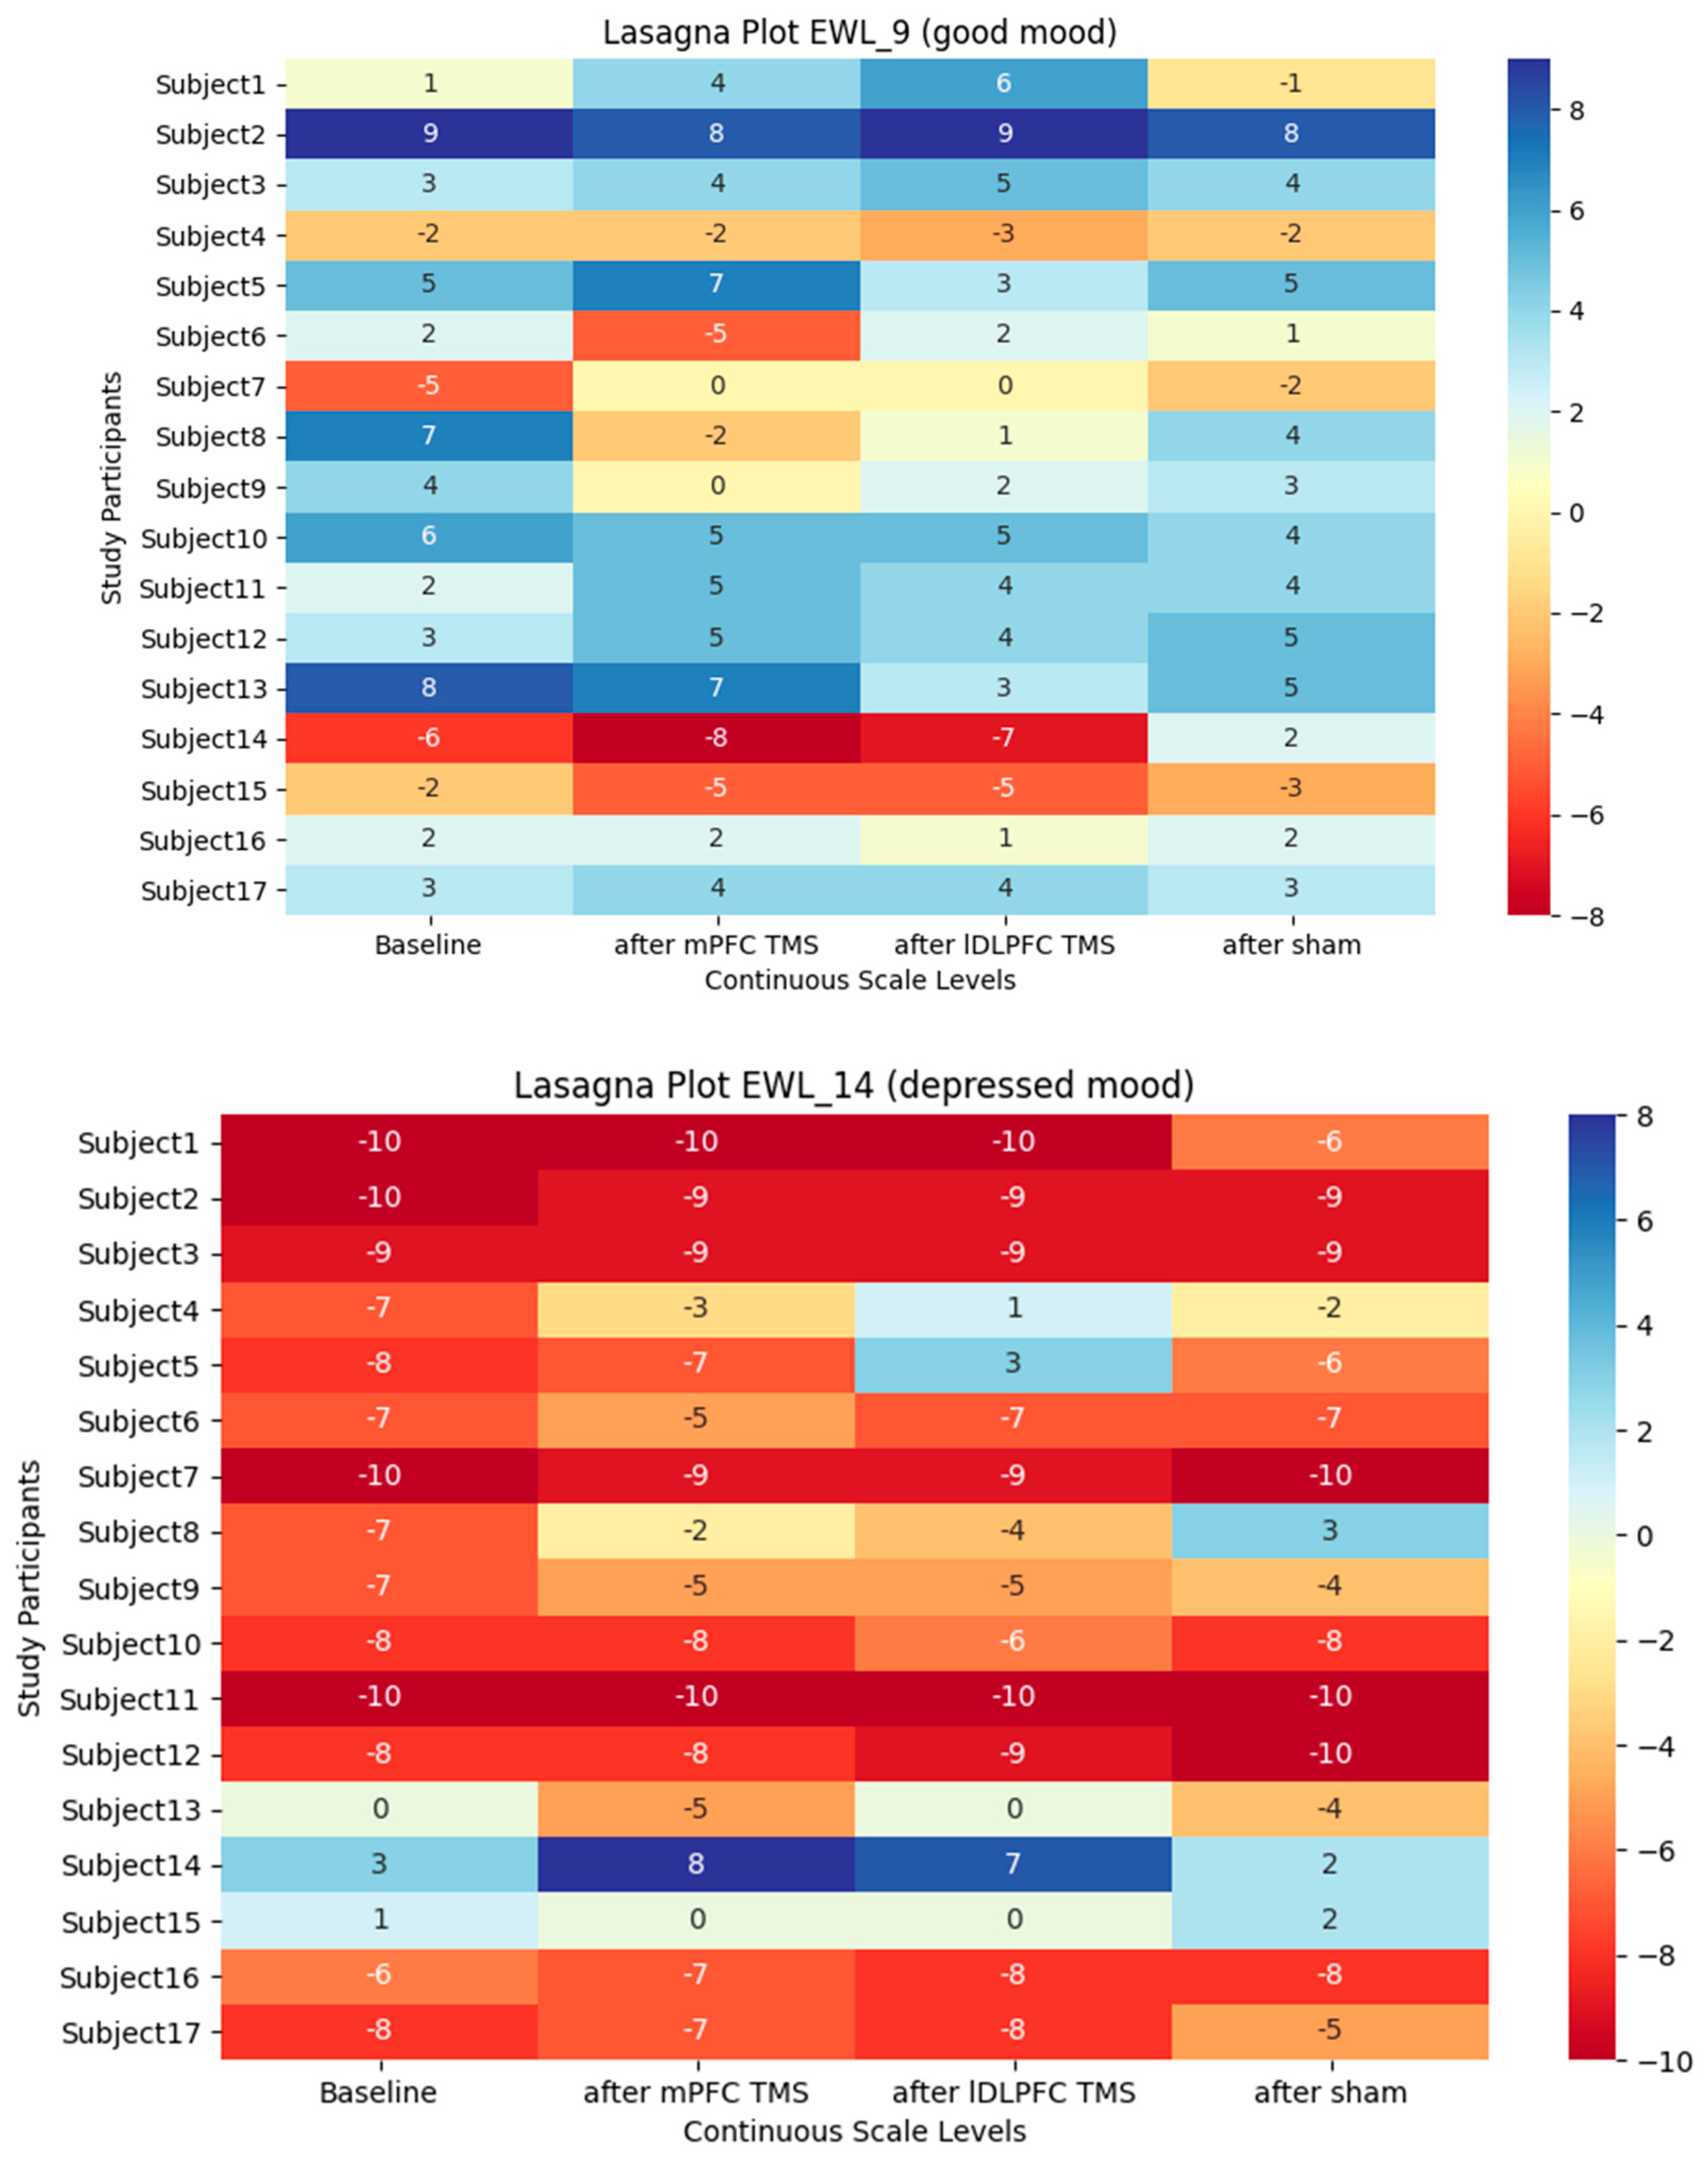
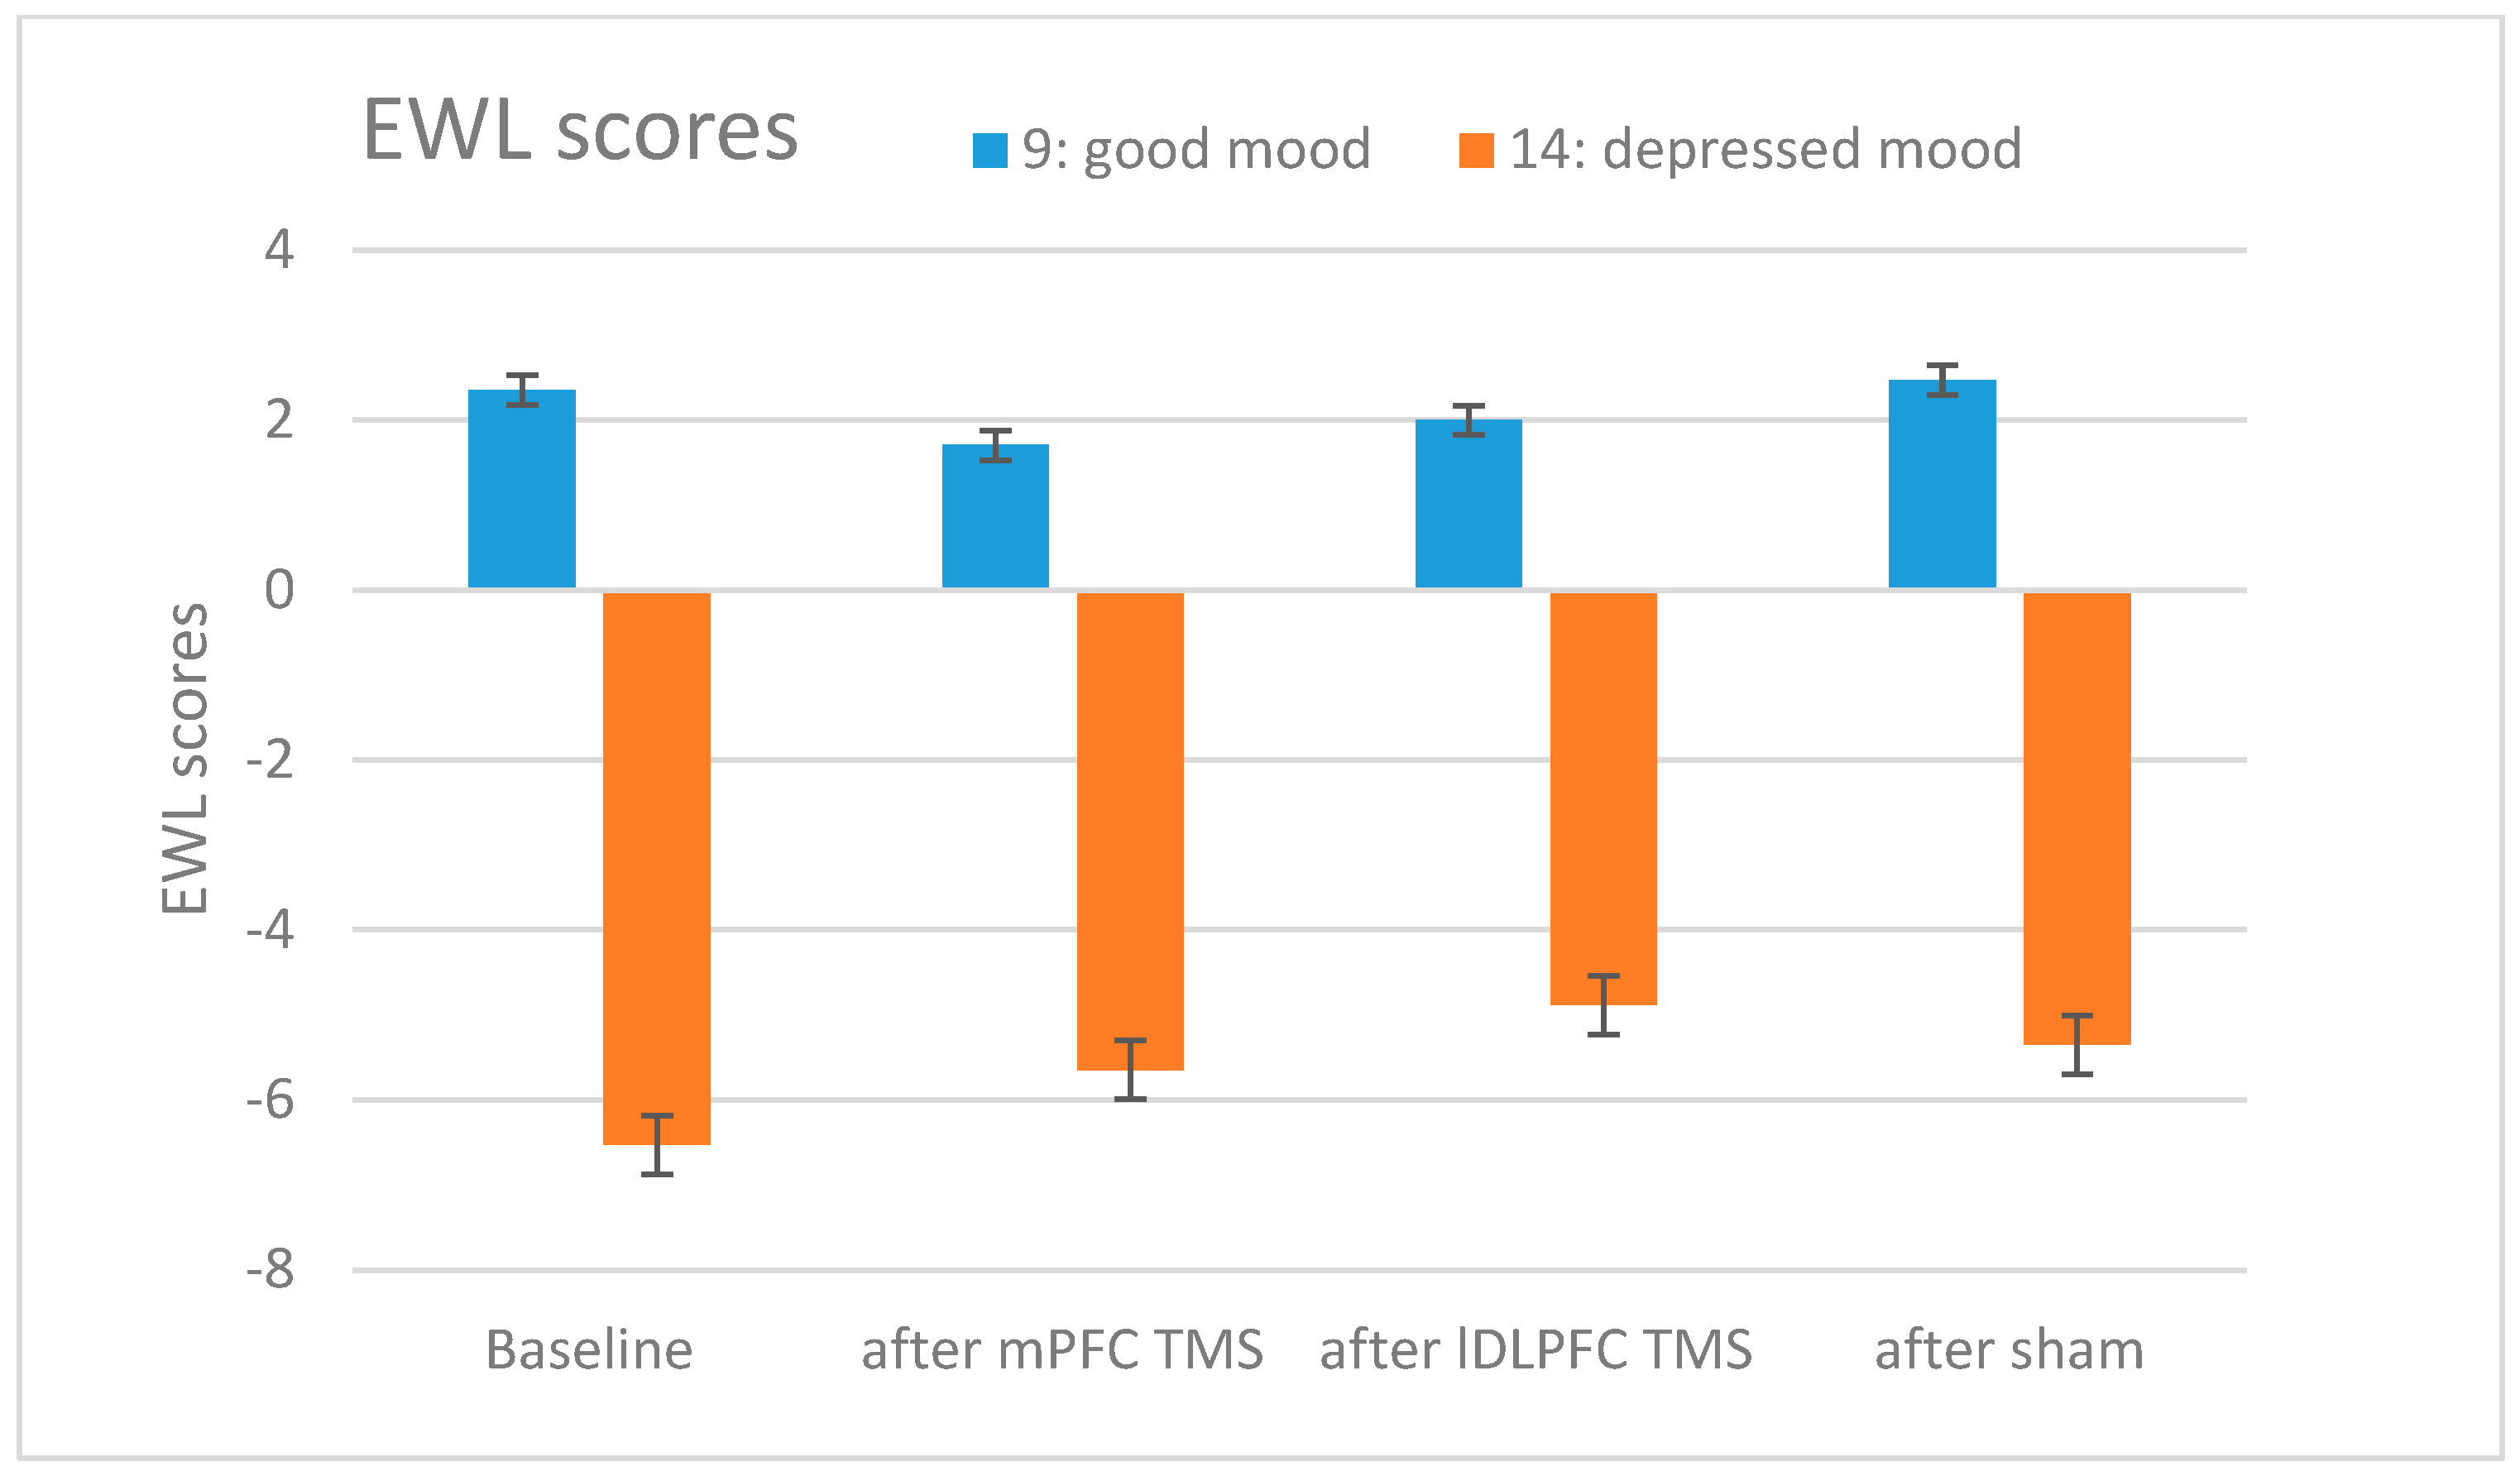
2.4. Mood Rating
2.5. Repetitive Transcranial Magnetic Stimulation Procedure
2.6. Statistics
| Pearson’s r | Strength of Association/Correlation |
| 0 | None |
| 0 to ±0.25 | Negligible |
| ±0.25 to ±0.50 | Weak |
| ±0.50 to ±0.75 | Moderate |
| ±0.75 to ±1 | Strong |
| ±1 | Perfect |
3. Results
4. Discussion
5. Conclusions
Author Contributions
Funding
Institutional Review Board Statement
Informed Consent Statement
Data Availability Statement
Conflicts of Interest
Appendix A

| Pascual-Leone et al. (1996) | George et al. (1996) | Dearing et al. (1997) | Nedjat et al. (1998) | Cohrs et al. (1998) | Mosimann et al. (2000) | Padberg et al. (2001) | |
|---|---|---|---|---|---|---|---|
| Outcome parameter | Mood | Mood, hormone levels | Mood (rTMS with two coil shapes) | Mood | REM-sleep, mood | Mood | Mood, facial expressions |
| Mood rating | VAS | NIMH mood scale, VAS | VAS | VAS | VAS | VAS | VAS, computerized analysis of facial expressions |
| Design | Crossover | Crossover | Crossover | Parallel group | Crossover | Crossover | Crossover |
| N | 10 | 10 | 9 | 50 | 12 | 25 | 9 |
| Stimulation target | RPFC, LPFC, midfrontal | RPFC, LPFC, midfrontal, occipital, cerebellum | RPFC, LPFC | LPFC | RPFC, LPFC, right, left inferior parietal, mid-occipital | LPFC | Right and left DLPFC |
| Sham condition | None | None | RPFC coil 45°, 90° angled | None | Vertex coil 90° | LPFC coil 90° angled | None |
| Stimulated sites per session | 6 | 1 | 3 | n/a | 1 | 1 | 2 |
| Intensity (%MT) | 110 | 120 | 80 | 80 | 120 | 100 | 110 |
| Frequency (Hz) | 10 | 5 | 20 | 10, 20 | 20 | 20 | 10 |
| No. of trains | 10 | 10 | 20 | 20 | 160 | 40 | 10 |
| Train duration (s) | 5 | 10 | 2 | 5; 2 | 0.25 | 2 | 5 |
| Intertrain interval (s) | 25 | 120 | 58 | 60 | 8 | 30 | 30 |
| Pulses per site | 500 | 500 | 800 | 1000; 800 | 800 | 1600 | 500 |
| Time of mood rating (min after TMS, 0 = baseline) | 0; 1 | 0; 30; 60; 90; 180; >480; 1440 | - | 0; 1; 1440 | 1 | 0; 20 | 0; 1; 15 |
| Effect of left PFC stim. | Happiness↓; sadness↑ | Happiness↓; sadness↑ (NIMH) | Happiness↓; sadness↑ | - | - | Happiness↑; sadness↑↓ | Sadness↑; activity↓ |
| Effect of right PFC stim. | Happiness↑; sadness↑ | Happiness↑; sadness↓ (NIMH) | - | - | - | - | General state↓ |
| Conclusion (p < 0.05) | rTMS to LPFC: happiness↓; sadness↑ | rTMS to LPFC: happiness↓ | rTMS to LPFC: happiness↓ | No mood effects | No mood effects | No mood effects | rTMS to LDLPFC: frequency of laughing↑; emotional reaction time↓ |
| Baeken et al. (2006) | Baeken et al. (2008) | Grossheinrich et al. (2009) | Leyman et al. (2009) | Baeken et al. (2011) | Schaller et al. (2011) | |
|---|---|---|---|---|---|---|
| Outcome parameter | Mood | Mood | Mood, cognition, EEG | Attentional control, mood | Endocrinological response (HPA-system) | Mood after 9 daily sessions of rTMS |
| Mood rating | VAS, POMS | VAS, POMS, PANAS | PANAS | VAS | POMS | BDI, VAS |
| Design | Crossover | Parallel group | Parallel group | Crossover | Crossover | Parallel group |
| N | 28 | Group 1: 25 (right DLPFC), group 2: 20 (left DLPFC) | 24 (mPFC:12, left DLPFC:12) | 18 (exp.1/13 completed VAS); 22 (exp.2/20 completed VAS) | 24 | 44 (active: 22, sham: 22) |
| Stimulation target | Left DLPFC | Right DLPFC (1), left DLPFC (2) | Left DLPFC (exp.1), mPFC (exp.2) | Left DLPFC (exp.1), right DLPFC (exp.2) | Right DLPFC | Left DLPFC |
| Sham condition | Left DLPFC, coil angled 90° | Right (1); left DLPFC (2) coil angled 90°; sham and active stim. 1 week apart | Left DLPFC, mPFC: imTBS with sham coil | Left DLPFC (exp.1), right DLPFC (exp.2) with coil angled 90° | n/a | Left DLPFC using sham coil |
| Stimulated sites per session | 1 | 1 | 1 | 1 | n/a | 1 |
| Intensity (%MT) | 110 | 110 | 80 | 110 | n/a | Started with 100, increased on day 5, 9 to 136.9 |
| Frequency (Hz) | 10 | 10 | TBS | 10 | n/a | 25 |
| No. of trains | 40 | 40 | cTBS: continuous, iTBS: 20 | 40 | n/a | 15 per day for 9 days |
| Train duration (s) | 3.9 | 3.9 | cTBS: 40; iTBS: 2 | 3.9 | n/a | 2 |
| Intertrain interval (s) | 26.1 | 26.1 | 8 | 26.1 | n/a | 8 |
| Pulses per site | 1560 | 1560 | 600 | 1560 | N/A | 6750 |
| Time of mood rating (min after TMS, 0 = baseline) | 0; 1; 30 | 0; 1; 30 | 0; 30 | 0; 1; 40 | 0; 1; 30 | BDI: 0, day 5 immediately after stimulation, day 10 (one day after last stimulation. VAS: 0, day 5 before and after stimulation, day 10 |
| Effect of left PFC stim. | vigor↑ (POMS, VAS) | - | - | - | - | See conclusion |
| Effect of right PFC stim. | - | - | - | - | - | - |
| Conclusion | No mood effects | No mood effects | No mood effects | No mood effects | No mood effects | BDI↓ compared to sham, BDI↓ (within subject effect in active group): BDI at day 1, day 5, day 10, VAS: gloomy↑ at day 5 immediately after active stimulation. No VAS-effects in sham |
| Baeken et al. (2014) | Pulopulos et al. (2019) | Dumitru et al. (2020) | Moulier et al. (2021) | Crewther et al. (2022) | |
|---|---|---|---|---|---|
| Outcome parameter | Cortisol level, mood | Mood, cortisol secretion | Mood, emotion processing | Mood, neural processing of emotional stimuli, brain anatomy | Acute hormone levels, emotional state |
| Mood rating | VAS | VAS | GAD-7, PHQ-9, emotion processing tasks | BDI, VAS, HDRS, HAD, MAS | VAS, STAI |
| Design | Crossover | Crossover | Crossover | Parallel group | Crossover |
| N | 31 | 35 | 28 | 30 (16 sham, 14 active) | 11 |
| Stimulation target | Left DLPFC | Left DLPFC | Left DLPFC | Left and right DLPFC and motor cortex | |
| Sham condition | Left DLPFC, coil angled 90° | Left DLPFC using sham coil | Coil angled 90° | Left DLPFC using sham coil | Coil angled 90°, same target like active |
| Stimulated sites per session | 1, after three days other condition | 1, after at least 1 week other condition, 2 iTBS sessions per day | 1, after three days other condition | 1, 10 sessions within 1 week | 4 |
| Intensity (%MT) | 110 | 110 | 80 | 80 | 90 |
| Frequency (Hz) | 20 | iTBS | iTBS | iTBS | 20 |
| No. of trains | 1.9 | 54 | 20 | 20 | 10 |
| Train duration (s) | 8 | 2 | 2 | n/a | |
| Intertrain interval (s) | 12.1 | 6 | 8 | 8 | 26.6 |
| Pulses per site | 1560 | 1620 | 600 | 600 | 250 |
| Time of mood rating (min after TMS, 0 = baseline) | 0; 1; 5; 10 | 0; 1; 10; 15; 20 | 1 | After 10 sessions (within one week) and follow up 15 days after last iTBS and 3 months | 0; 1; 15; 30 |
| Effect of left PFC stim. | See conclusion | See conclusion | See conclusion | See conclusion | - |
| Effect of right PFC stim. | - | - | - | - | - |
| Conclusion | No mood effects | No mood effects | iTBS increased positive affective processing (word recall) compared to sham, effect on facial emotion recognition for happy and sad faces | No mood effects compared to sham | No mood effects |
Appendix A.1. LF-rTMS 1 Hz Trials
| Grisaru et al. (2001) | Jenkins et al. 2002 | Barrett et al. (2004) | |
|---|---|---|---|
| Outcome parameter | Mood, sleep, evaluation of side effects | Mood | Mood, speech, brain activity |
| Mood rating | VAS | PANAS, POMS, UWIST, SAI, BFS | PANAS (a), affect questionnaire (b) |
| Design | Crossover | Crossover | Parallel group |
| N | 18 | 19 | 10 |
| Stimulation target | Right PFC, left PFC | Right DLPFC, left DLPFC | Right DLPFC, left DLPFC |
| Sham condition | Inactive coil, active coil angled 90° | None | None |
| Stimulated sites per session | 1 | 1 | 1 |
| Intensity (%MT) | 110 | 100 | 100 |
| Frequency (Hz) | 1 | 1 | 1; 10 |
| No. of trains | 1 | Continuous (1 Hz), 15 (10 Hz); 3 series à 150 s, 10 min break | |
| Train duration (s) | 500 | 60 | 150; 1 |
| Intertrain interval (s) | continuous | 15 | 0; 10 |
| Pulses per site | 500 | 1000 | 450 |
| Time of mood rating (min after TMS, 0 = baseline) | 0; 5; 30; 240 | 0; 1 | 0; 5 |
| Effect of left PFC stim. | - | Sadness↓ (POMS, PANAS) | See conclusion |
| Effect of right PFC stim. | - | Sadness↓ (POMS, PANAS) | - |
| Conclusion | No mood effects | No mood effects | Affect↓ (10 Hz, b), happiness↑; sadness↑ (1 Hz, a) |
References
- Padberg, F.; George, M.S. Repetitive transcranial magnetic stimulation of the prefrontal cortex in depression. Exp. Neurol. 2009, 219, 2–13. [Google Scholar] [CrossRef]
- Lefaucheur, J.P.; Aleman, A.; Baeken, C.; Benninger, D.H.; Brunelin, J.; Di Lazzaro, V.; Filipović, S.R.; Grefkes, C.; Hasan, A.; Hummel, F.C.; et al. Evidence-based guidelines on the therapeutic use of repetitive transcranial magnetic stimulation (rTMS): An update (2014–2018). Clin. Neurophysiol. 2020, 131, 474–528. [Google Scholar] [CrossRef] [PubMed]
- McClintock, S.M.; Reti, I.M.; Carpenter, L.L.; McDonald, W.M.; Dubin, M.; Taylor, S.F.; Cook, I.A.; O’Reardon, J.; Husain, M.M.; Wall, C.; et al. Consensus Recommendations for the Clinical Application of Repetitive Transcranial Magnetic Stimulation (rTMS) in the Treatment of Depression. J. Clin. Psychiatry 2018, 79, 35–48. [Google Scholar] [CrossRef] [PubMed]
- Bolden, L.B.; Griffis, J.C.; Pati, S.; Szaflarski, J.P. Cortical excitability and neuropsychological functioning in healthy adults. Neuropsychologia 2017, 102, 190–196. [Google Scholar] [CrossRef]
- Schluter, R.S.; Jansen, J.M.; van Holst, R.J.; van den Brink, W.; Goudriaan, A.E. Differential Effects of Left and Right Prefrontal High-Frequency Repetitive Transcranial Magnetic Stimulation on Resting-State Functional Magnetic Resonance Imaging in Healthy Individuals. Brain Connect. 2018, 8, 60–67. [Google Scholar] [CrossRef]
- Pascual-Leone, A.; Catalá, M.D.; Pascual-Leone Pascual, A. Lateralized effect of rapid-rate transcranial magnetic stimulation of the prefrontal cortex on mood. Neurology 1996, 46, 499–502. [Google Scholar] [CrossRef]
- Michelucci, R.; Valzania, F.; Passarelli, D.; Santangelo, M.; Rizzi, R.; Buzzi, A.M.; Tempestini, A.; Tassinari, C.A. Rapid-rate transcranial magnetic stimulation and hemispheric language dominance: Usefulness and safety in epilepsy. Neurology 1994, 44, 1697–1700. [Google Scholar] [CrossRef]
- Jennum, P.; Friberg, L.; Fuglsang-Frederiksen, A.; Dam, M. Speech localization using repetitive transcranial magnetic stimulation. Neurology 1994, 44, 269–273. [Google Scholar] [CrossRef] [PubMed]
- George, M.S.; Wassermann, E.M.; Williams, W.A.; Steppel, J.; Pascual-Leone, A.; Basser, P.; Hallett, M.; Post, R.M. Changes in mood and hormone levels after rapid-rate transcranial magnetic stimulation (rTMS) of the prefrontal cortex. J. Neuropsychiatry Clin. Neurosci. 1996, 8, 172–180. [Google Scholar]
- Schaller, G.; Lenz, B.; Friedrich, K.; Dygon, D.; Richter-Schmidinger, T.; Jacobi, A.; Mueller, S.E.; Maihöfner, C.; Sperling, W.; Kornhuber, J. Repetitive transcranial magnetic stimulation influences mood in healthy male volunteers. J. Psychiatr. Res. 2011, 45, 1178–1183. [Google Scholar] [CrossRef]
- Padberg, F.; Juckel, G.; Prässl, A.; Zwanzger, P.; Mavrogiorgou, P.; Hegerl, U.; Hampel, H.; Möller, H.J. Prefrontal cortex modulation of mood and emotionally induced facial expressions: A transcranial magnetic stimulation study. J. Neuropsychiatry Clin. Neurosci. 2001, 13, 206–212. [Google Scholar] [CrossRef]
- Barrett, J.; Della-Maggiore, V.; Chouinard, P.A.; Paus, T. Mechanisms of action underlying the effect of repetitive transcranial magnetic stimulation on mood: Behavioral and brain imaging studies. Neuropsychopharmacology 2004, 29, 1172–1189. [Google Scholar] [CrossRef] [PubMed]
- Dumitru, A.; Rocchi, L.; Saini, F.; Rothwell, J.C.; Roiser, J.P.; David, A.S.; Richieri, R.M.; Lewis, G.; Lewis, G. Influence of theta-burst transcranial magnetic stimulation over the dorsolateral prefrontal cortex on emotion processing in healthy volunteers. Cogn. Affect. Behav. Neurosci. 2020, 20, 1278–1293. [Google Scholar] [CrossRef] [PubMed]
- Remue, J.; Baeken, C.; De Raedt, R. Does a single neurostimulation session really affect mood in healthy individuals? A systematic review. Neuropsychologia 2016, 85, 184–198. [Google Scholar] [CrossRef]
- Mosimann, U.P.; Rihs, T.A.; Engeler, J.; Fisch, H.; Schlaepfer, T.E. Mood effects of repetitive transcranial magnetic stimulation of left prefrontal cortex in healthy volunteers. Psychiatry Res. 2000, 94, 251–256. [Google Scholar] [CrossRef]
- Leyman, L.; De Raedt, R.; Vanderhasselt, M.A.; Baeken, C. Influence of high-frequency repetitive transcranial magnetic stimulation over the dorsolateral prefrontal cortex on the inhibition of emotional information in healthy volunteers. Psychol. Med. 2009, 39, 1019–1028. [Google Scholar] [CrossRef] [PubMed]
- Baeken, C.; Vanderhasselt, M.A.; De Raedt, R. Baseline ‘state anxiety’ influences HPA-axis sensitivity to one sham-controlled HF-rTMS session applied to the right dorsolateral prefrontal cortex. Psychoneuroendocrinology 2011, 36, 60–67. [Google Scholar] [CrossRef]
- Baeken, C.; Leyman, L.; De Raedt, R.; Vanderhasselt, M.A.; D’Haenen, H. Left and right High Frequency repetitive Transcranial Magnetic Stimulation of the dorsolateral prefrontal cortex does not affect mood in female volunteers. Clin. Neurophysiol. 2008, 119, 568–575. [Google Scholar] [CrossRef]
- Baeken, C.; Leyman, L.; De Raedt, R.; Vanderhasselt, M.A.; D’Haenen, H. Lack of impact of repetitive High Frequency Transcranial Magnetic Stimulation on mood in healthy female subjects. J. Affect. Disord. 2006, 90, 63–66. [Google Scholar] [CrossRef]
- Cohrs, S.; Tergau, F.; Riech, S.; Kastner, S.; Paulus, W.; Ziemann, U.; Rüther, E.; Hajak, G. High-frequency repetitive transcranial magnetic stimulation delays rapid eye movement sleep. Neuroreport 1998, 9, 3439–3443. [Google Scholar] [CrossRef]
- Grisaru, N.; Bruno, R.; Pridmore, S. Effect on the emotions of healthy individuals of slow repetitive transcranial magnetic stimulation applied to the prefrontal cortex. J. ECT 2001, 17, 184–189. [Google Scholar] [CrossRef]
- Jenkins, J.; Shajahan, P.M.; Lappin, J.M.; Ebmeier, K.P. Right and left prefrontal transcranial magnetic stimulation at 1 Hz does not affect mood in healthy volunteers. BMC Psychiatry 2002, 2, 1. [Google Scholar] [CrossRef] [PubMed]
- Crewther, B.T.; Kasprzycka, W.; Cook, C.J.; Rola, R. Impact of one HF-rTMS session over the DLPFC and motor cortex on acute hormone dynamics and emotional state in healthy adults: A sham-controlled pilot study. Neurol. Sci. 2022, 43, 651–659. [Google Scholar] [CrossRef] [PubMed]
- Baeken, C.; Vanderhasselt, M.A.; Remue, J.; Rossi, V.; Schiettecatte, J.; Anckaert, E.; De Raedt, R. One left dorsolateral prefrontal cortical HF-rTMS session attenuates HPA-system sensitivity to critical feedback in healthy females. Neuropsychologia 2014, 57, 112–121. [Google Scholar] [CrossRef]
- Grossheinrich, N.; Rau, A.; Pogarell, O.; Hennig-Fast, K.; Reinl, M.; Karch, S.; Dieler, A.; Leicht, G.; Mulert, C.; Sterr, A.; et al. Theta burst stimulation of the prefrontal cortex: Safety and impact on cognition, mood, and resting electroencephalogram. Biol. Psychiatry 2009, 65, 778–784. [Google Scholar] [CrossRef] [PubMed]
- Pulopulos, M.M.; De Witte, S.; Vanderhasselt, M.A.; De Raedt, R.; Schiettecatte, J.; Anckaert, E.; Salvador, A.; Baeken, C. The influence of personality on the effect of iTBS after being stressed on cortisol secretion. PLoS ONE 2019, 14, e0223927. [Google Scholar] [CrossRef]
- Moulier, V.; Gaudeau-Bosma, C.; Thomas, F.; Isaac, C.; Thomas, M.; Durand, F.; Schenin-King Andrianisaina, P.; Valabregue, R.; Laidi, C.; Benadhira, R.; et al. Effect of Intermittent Theta Burst Stimulation on the Neural Processing of Emotional Stimuli in Healthy Volunteers. J. Clin. Med. 2021, 10, 2449. [Google Scholar] [CrossRef]
- Kan, R.L.D.; Padberg, F.; Giron, C.G.; Lin, T.T.Z.; Zhang, B.B.B.; Brunoni, A.R.; Kranz, G.S. Effects of repetitive transcranial magnetic stimulation of the left dorsolateral prefrontal cortex on symptom domains in neuropsychiatric disorders: A systematic review and cross-diagnostic meta-analysis. Lancet Psychiatry 2023, 10, 252–259. [Google Scholar] [CrossRef]
- Jiang, R.; Calhoun, V.D.; Zuo, N.; Lin, D.; Li, J.; Fan, L.; Qi, S.; Sun, H.; Fu, Z.; Song, M.; et al. Connectome-based individualized prediction of temperament trait scores. Neuroimage 2018, 183, 366–374. [Google Scholar] [CrossRef]
- Rolls, E.T.; Wan, Z.; Cheng, W.; Feng, J. Risk-taking in humans and the medial orbitofrontal cortex reward system. Neuroimage 2022, 249, 118893. [Google Scholar] [CrossRef]
- Wan, Z.; Rolls, E.T.; Cheng, W.; Feng, J. Sensation-seeking is related to functional connectivities of the medial orbitofrontal cortex with the anterior cingulate cortex. Neuroimage 2020, 215, 116845. [Google Scholar] [CrossRef]
- Silverman, M.H.; Wilson, S.; Ramsay, I.S.; Hunt, R.H.; Thomas, K.M.; Krueger, R.F.; Iacono, W.G. Trait neuroticism and emotion neurocircuitry: Functional magnetic resonance imaging evidence for a failure in emotion regulation. Dev. Psychopathol. 2019, 31, 1085–1099. [Google Scholar] [CrossRef]
- Anderson, Z.; Damme, K.S.F.; Carroll, A.L.; Ka-Yi Chat, I.; Young, K.S.; Craske, M.G.; Bookheimer, S.; Zinbarg, R.; Nusslock, R. Association between reward-related functional connectivity and tri-level mood and anxiety symptoms. NeuroImage Clin. 2023, 37, 103335. [Google Scholar] [CrossRef]
- Chang, N.H.S.; Kumakura, Y.; Møller, A.; Linnet, J.; Bender, D.; Doudet, D.J.; Vafaee, M.S.; Gjedde, A. On the learning of addictive behavior: Sensation-seeking propensity predicts dopamine turnover in dorsal striatum. Brain Imaging Behav. 2022, 16, 355–365. [Google Scholar] [CrossRef]
- Norbury, A.; Husain, M. Sensation-seeking: Dopaminergic modulation and risk for psychopathology. Behav. Brain Res. 2015, 288, 79–93. [Google Scholar] [CrossRef] [PubMed]
- Hoppenbrouwers, S.S.; Farzan, F.; Barr, M.S.; Voineskos, A.N.; Schutter, D.J.; Fitzgerald, P.B.; Daskalakis, Z.J. Personality goes a long a way: An interhemispheric connectivity study. Front. Psychiatry 2010, 1, 140. [Google Scholar] [CrossRef]
- McCrae, R.R.; Costa, P.T., Jr.; Martin, T.A. The NEO-PI-3: A more readable revised NEO Personality Inventory. J. Pers. Assess 2005, 84, 261–270. [Google Scholar] [CrossRef]
- Borkenau, P.; Ostendorf, F. NEO-Fünf-Faktoren-Inventar (NEO-FFI) Nach Costa und McCrae: Handanweisung; Hogrefe: Göttingen, Germany, 1993. [Google Scholar]
- Zuckerman, M. Sensation seeking: A comparative approach to a human trait. Behav. Brain Sci. 1984, 7, 413–434. [Google Scholar] [CrossRef]
- Loas, G.; Verrier, A.; Flament, M.F.; Perez-Diaz, F.; Corcos, M.; Halfon, O.; Lang, F.; Bizouard, P.; Venisse, J.L.; Guelfi, J.D.; et al. Factorial structure of the Sensation-Seeking Scale-Form V: Confirmatory factorial analyses in nonclinical and clinical samples. Can. J. Psychiatry 2001, 46, 850–855. [Google Scholar] [CrossRef]
- Zuckerman, M. The sensation seeking scale V (SSS-V): Still reliable and valid. Personal. Individ. Differ. 2007, 43, 1303–1305. [Google Scholar] [CrossRef]
- Canli, T.; Amin, Z.; Haas, B.; Omura, K.; Constable, R.T. A double dissociation between mood states and personality traits in the anterior cingulate. Behav. Neurosci. 2004, 118, 897–904. [Google Scholar] [CrossRef]
- Larsen, R.J.; Ketelaar, T. Personality and susceptibility to positive and negative emotional states. J. Pers. Soc. Psychol. 1991, 61, 132–140. [Google Scholar] [CrossRef]
- Karl, J.A.; Fischer, R. The Relationship Between Negative Affect, State Mindfulness, and the Role of Personality. Mindfulness 2022, 13, 2729–2737. [Google Scholar] [CrossRef]
- Janke, W.; Debus, G. Die Eigenschaftswörterliste EWL; Göttingen, H., Ed.; Hogrefe: Göttingen, Germany, 1977. [Google Scholar]
- Zuckerman, M. The psychophysiology of sensation seeking. J. Pers. 1990, 58, 313–345. [Google Scholar] [CrossRef]
- Netter, P.; Hennig, J.; Roed, I.S. Serotonin and dopamine as mediators of sensation seeking behavior. Neuropsychobiology 1996, 34, 155–165. [Google Scholar] [CrossRef] [PubMed]
- Pogarell, O.; Koch, W.; Pöpperl, G.; Tatsch, K.; Jakob, F.; Mulert, C.; Grossheinrich, N.; Rupprecht, R.; Möller, H.J.; Hegerl, U.; et al. Acute prefrontal rTMS increases striatal dopamine to a similar degree as D-amphetamine. Psychiatry Res. 2007, 156, 251–255. [Google Scholar] [CrossRef] [PubMed]
- Pogarell, O.; Koch, W.; Pöpperl, G.; Tatsch, K.; Jakob, F.; Zwanzger, P.; Mulert, C.; Rupprecht, R.; Möller, H.J.; Hegerl, U.; et al. Striatal dopamine release after prefrontal repetitive transcranial magnetic stimulation in major depression: Preliminary results of a dynamic [123I] IBZM SPECT study. J. Psychiatr. Res. 2006, 40, 307–314. [Google Scholar] [CrossRef]
- Post, A.; Keck, M.E. Transcranial magnetic stimulation as a therapeutic tool in psychiatry: What do we know about the neurobiological mechanisms? J. Psychiatr. Res. 2001, 35, 193–215. [Google Scholar] [CrossRef]
- Speer, A.M.; A Kimbrell, T.; Wassermann, E.M.; Repella, J.D.; Willis, M.W.; Herscovitch, P.; Post, R.M. Opposite effects of high and low frequency rTMS on regional brain activity in depressed patients. Biol. Psychiatry 2000, 48, 1133–1141. [Google Scholar] [CrossRef] [PubMed]
- Shaul, U.; Ben-Shachar, D.; Karry, R.; Klein, E. Modulation of frequency and duration of repetitive magnetic stimulation affects catecholamine levels and tyrosine hydroxylase activity in human neuroblastoma cells: Implication for the antidepressant effect of rTMS. Int. J. Neuropsychopharmacol. 2003, 6, 233–241. [Google Scholar] [CrossRef]
- Loo, C.K.; Taylor, J.L.; Gandevia, S.C.; McDarmont, B.N.; Mitchell, P.B.; Sachdev, P.S. Transcranial magnetic stimulation (TMS) in controlled treatment studies: Are some “sham” forms active? Biol. Psychiatry 2000, 47, 325–331. [Google Scholar] [CrossRef] [PubMed]
- Huang, Y.Z.; Edwards, M.J.; Rounis, E.; Bhatia, K.P.; Rothwell, J.C. Theta burst stimulation of the human motor cortex. Neuron 2005, 45, 201–206. [Google Scholar] [CrossRef] [PubMed]
- Thut, G.; Pascual-Leone, A. A review of combined TMS-EEG studies to characterize lasting effects of repetitive TMS and assess their usefulness in cognitive and clinical neuroscience. Brain Topogr. 2010, 22, 219–232. [Google Scholar] [CrossRef] [PubMed]


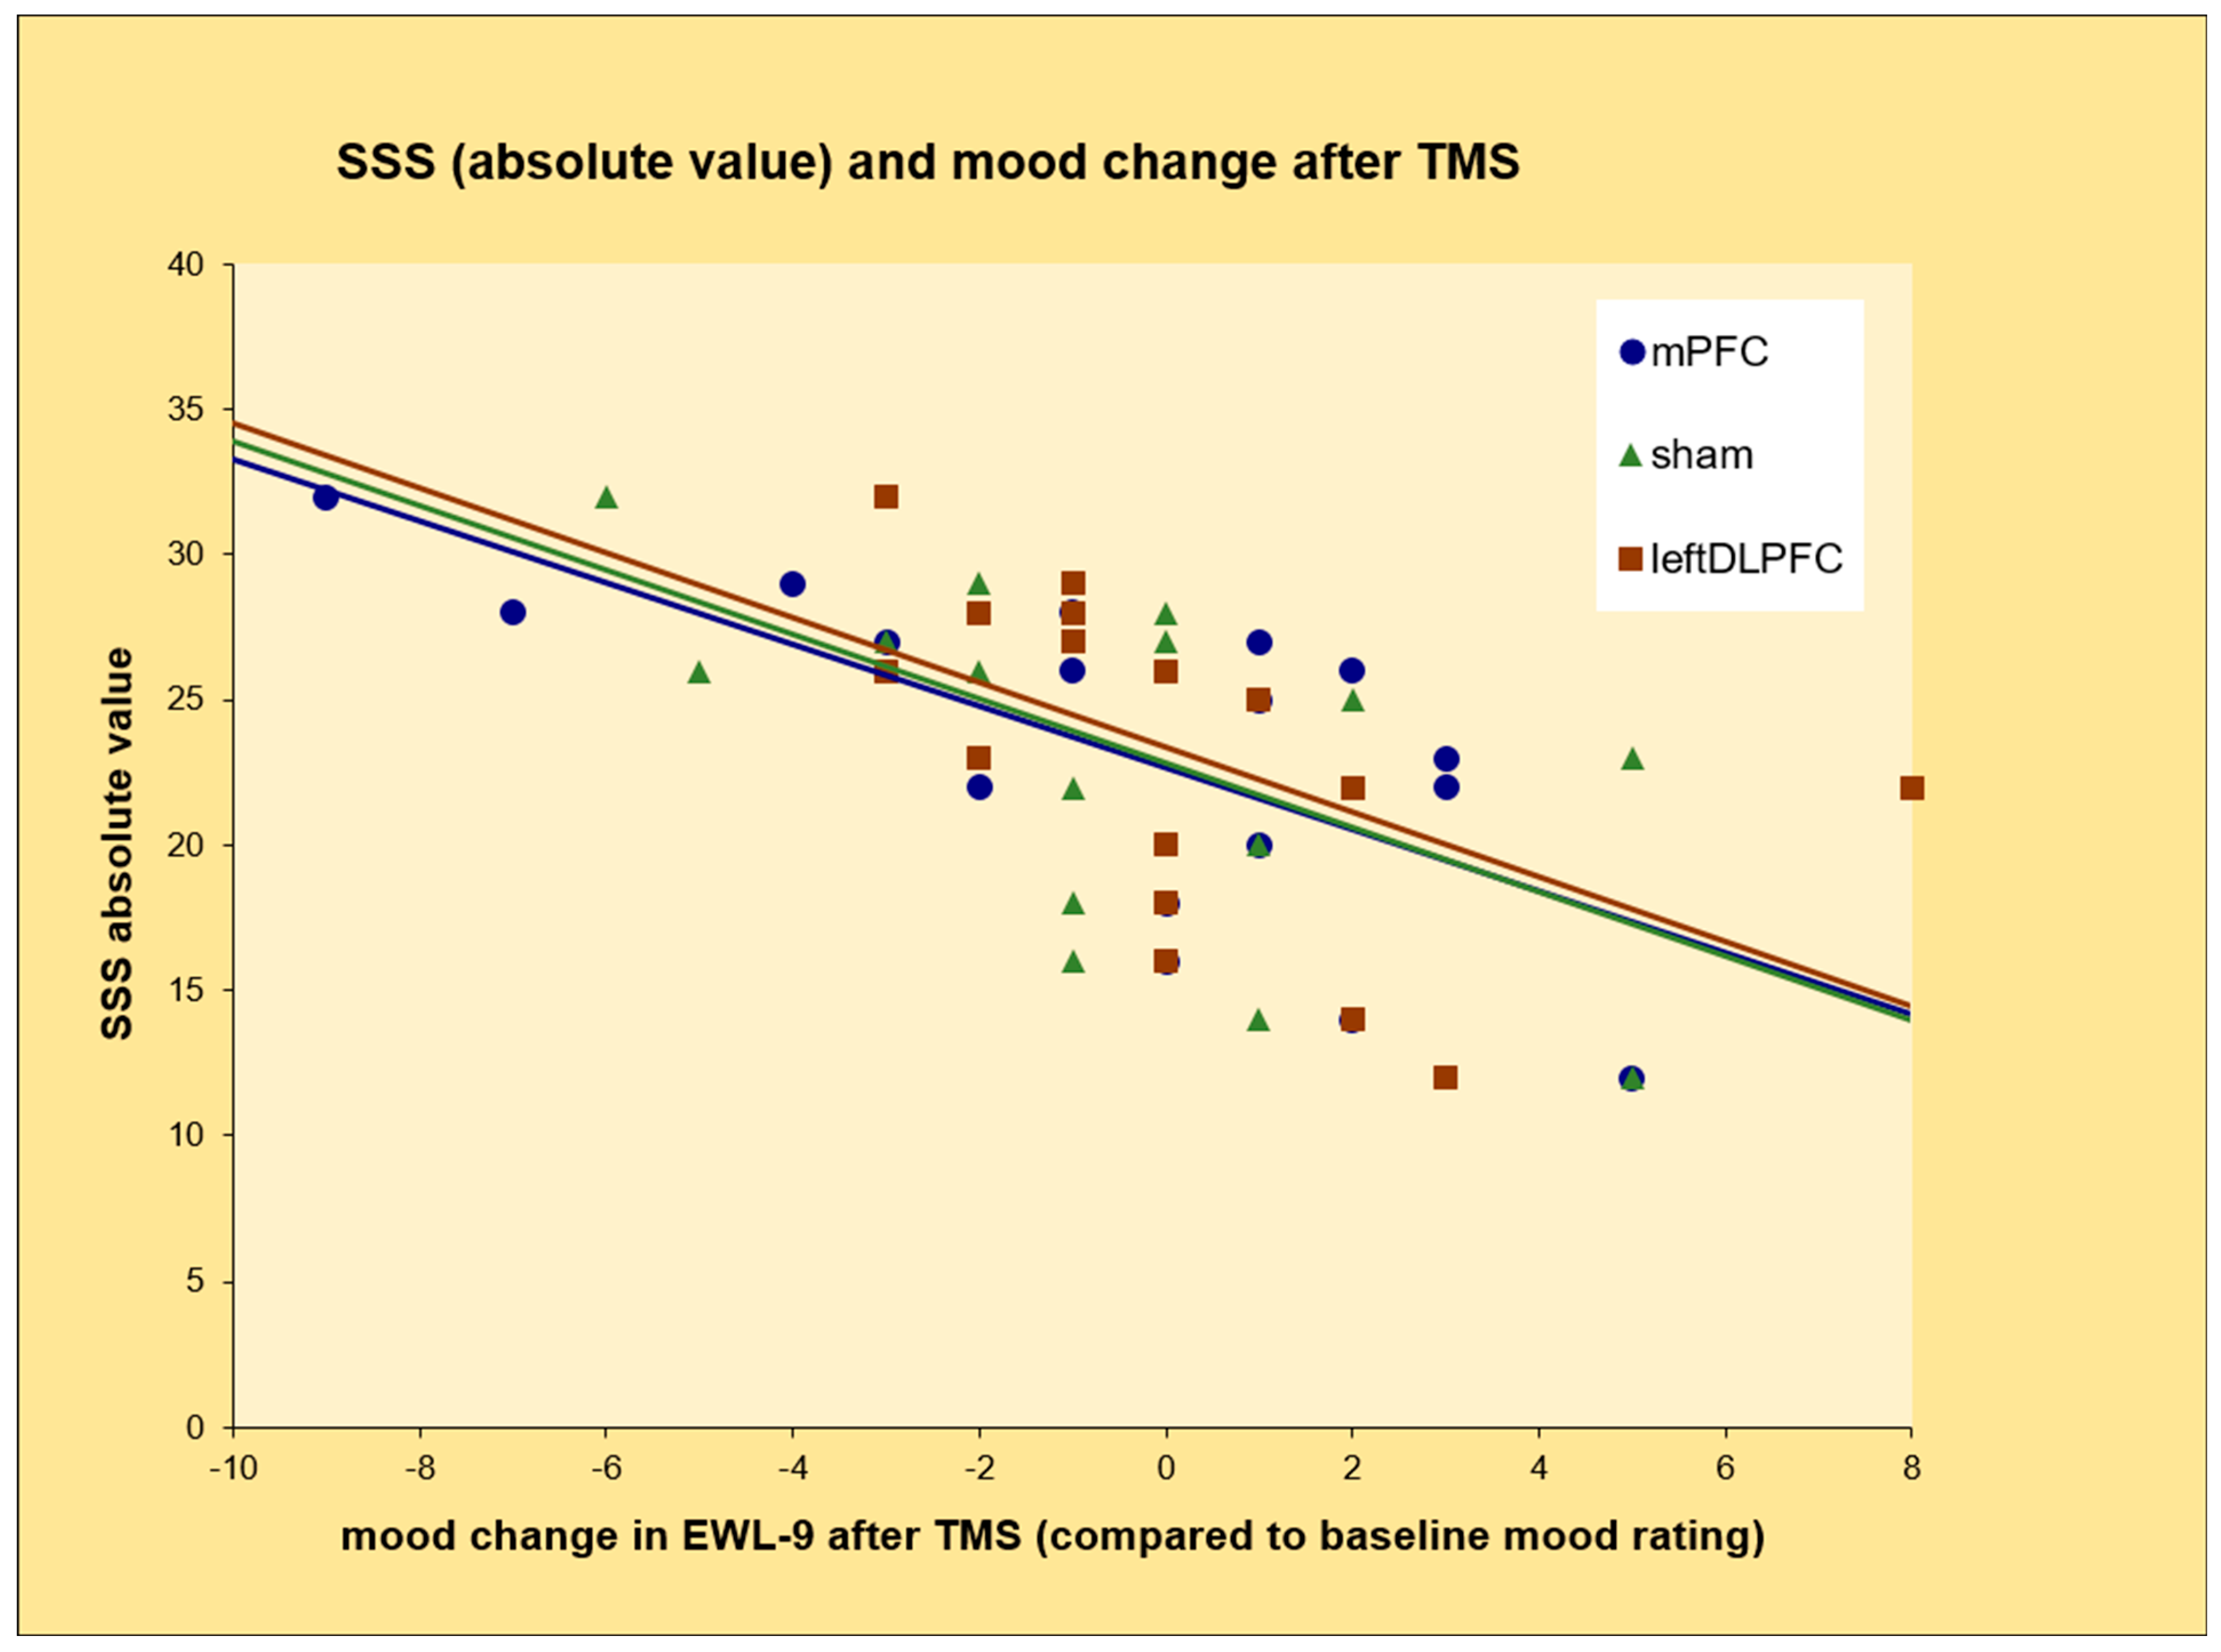
| Pearson Correlation between SSS-V Total Score and Mood Change in EWL-9 (Good Mood) and EWL-14 (Depressed Mood) after TMS | |||
|---|---|---|---|
| Correlation Mood Change in EWL-9 | Pearson’s r | Strength of Association/Correlation | p |
| After lDLPFC TMS | −0.580 | Moderate | 0.015 |
| After mPFC TMS | −0.683 | Moderate | 0.003 |
| After sham TMS | −0.523 | Moderate | 0.031 |
| Correlation mood change in EWL-14 | Pearson’s r | Strength of association/correlation | p |
| After lDLPFC TMS | 0.078 | None | 0.767 |
| After mPFC TMS | 0.044 | Weak | 0.867 |
| After sham TMS | 0.311 | Weak | 0.225 |
Disclaimer/Publisher’s Note: The statements, opinions and data contained in all publications are solely those of the individual author(s) and contributor(s) and not of MDPI and/or the editor(s). MDPI and/or the editor(s) disclaim responsibility for any injury to people or property resulting from any ideas, methods, instructions or products referred to in the content. |
© 2023 by the authors. Licensee MDPI, Basel, Switzerland. This article is an open access article distributed under the terms and conditions of the Creative Commons Attribution (CC BY) license (https://creativecommons.org/licenses/by/4.0/).
Share and Cite
Kumpf, U.; Soldini, A.; Burkhardt, G.; Bulubas, L.; Dechantsreiter, E.; Eder, J.; Padberg, F.; Palm, U. Association between Mood and Sensation Seeking Following rTMS. Brain Sci. 2023, 13, 1265. https://doi.org/10.3390/brainsci13091265
Kumpf U, Soldini A, Burkhardt G, Bulubas L, Dechantsreiter E, Eder J, Padberg F, Palm U. Association between Mood and Sensation Seeking Following rTMS. Brain Sciences. 2023; 13(9):1265. https://doi.org/10.3390/brainsci13091265
Chicago/Turabian StyleKumpf, Ulrike, Aldo Soldini, Gerrit Burkhardt, Lucia Bulubas, Esther Dechantsreiter, Julia Eder, Frank Padberg, and Ulrich Palm. 2023. "Association between Mood and Sensation Seeking Following rTMS" Brain Sciences 13, no. 9: 1265. https://doi.org/10.3390/brainsci13091265