
The Effect of Cognitive Task Complexity on Healthy Gait in the Walking Corsi Test


Abstract
:1. Introduction
2. Materials and Methods
2.1. Study Design
2.2. Participants
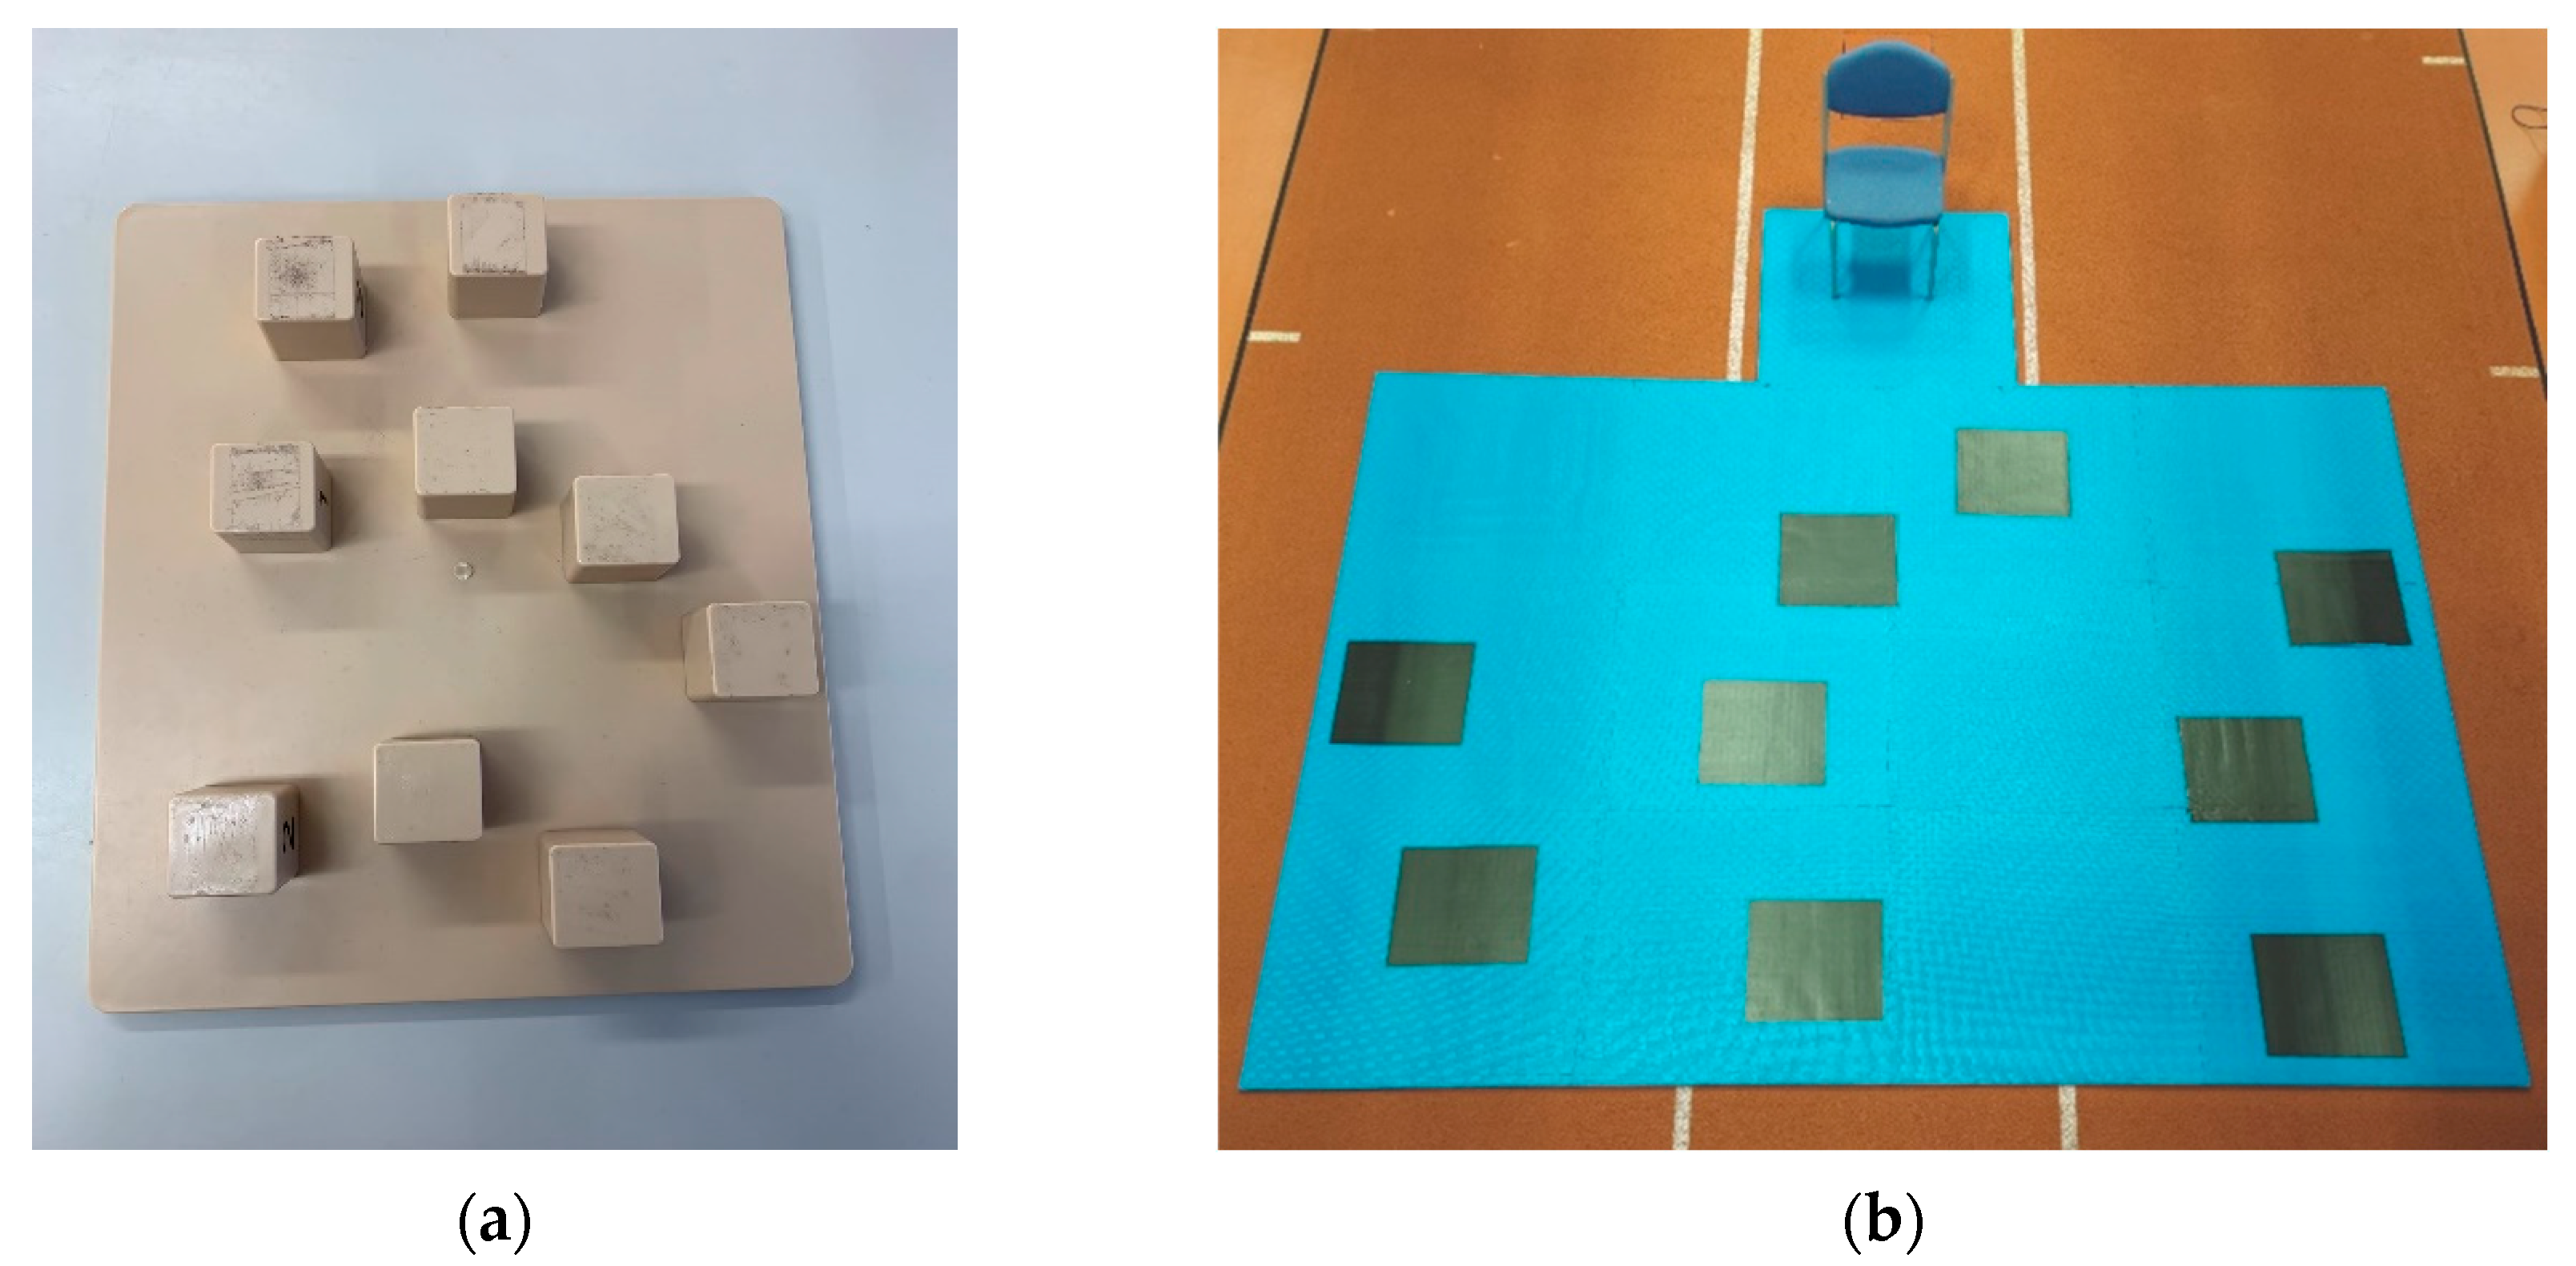
2.3. Data Collection
2.4. Data Processing
- Average double support (%)—proportion of the gait cycle spent on both feet;
- Average single support (%)—proportion of the gait cycle spent on either foot;
- Average stance time (s)—average time between heel strike and toe-off on each foot;
- Average step time (s)—average time between heel strike on one foot, and heel strike on the opposite foot;
- Average stride time (s)—average time between successive heel strikes on the same foot;
- Average stride velocity (cm/s)—average walking speed;
- Average swing time (s)—average time between toe-off and heel strike of the same foot;
- Cadence (steps/min)—average number of steps taken per minute;
- Time to stand (s)—time taken from initiating movement to first heel strike or toe-off on either foot.
2.5. Statistical Analysis
3. Results
3.1. Block Span
3.2. Gait Parameters
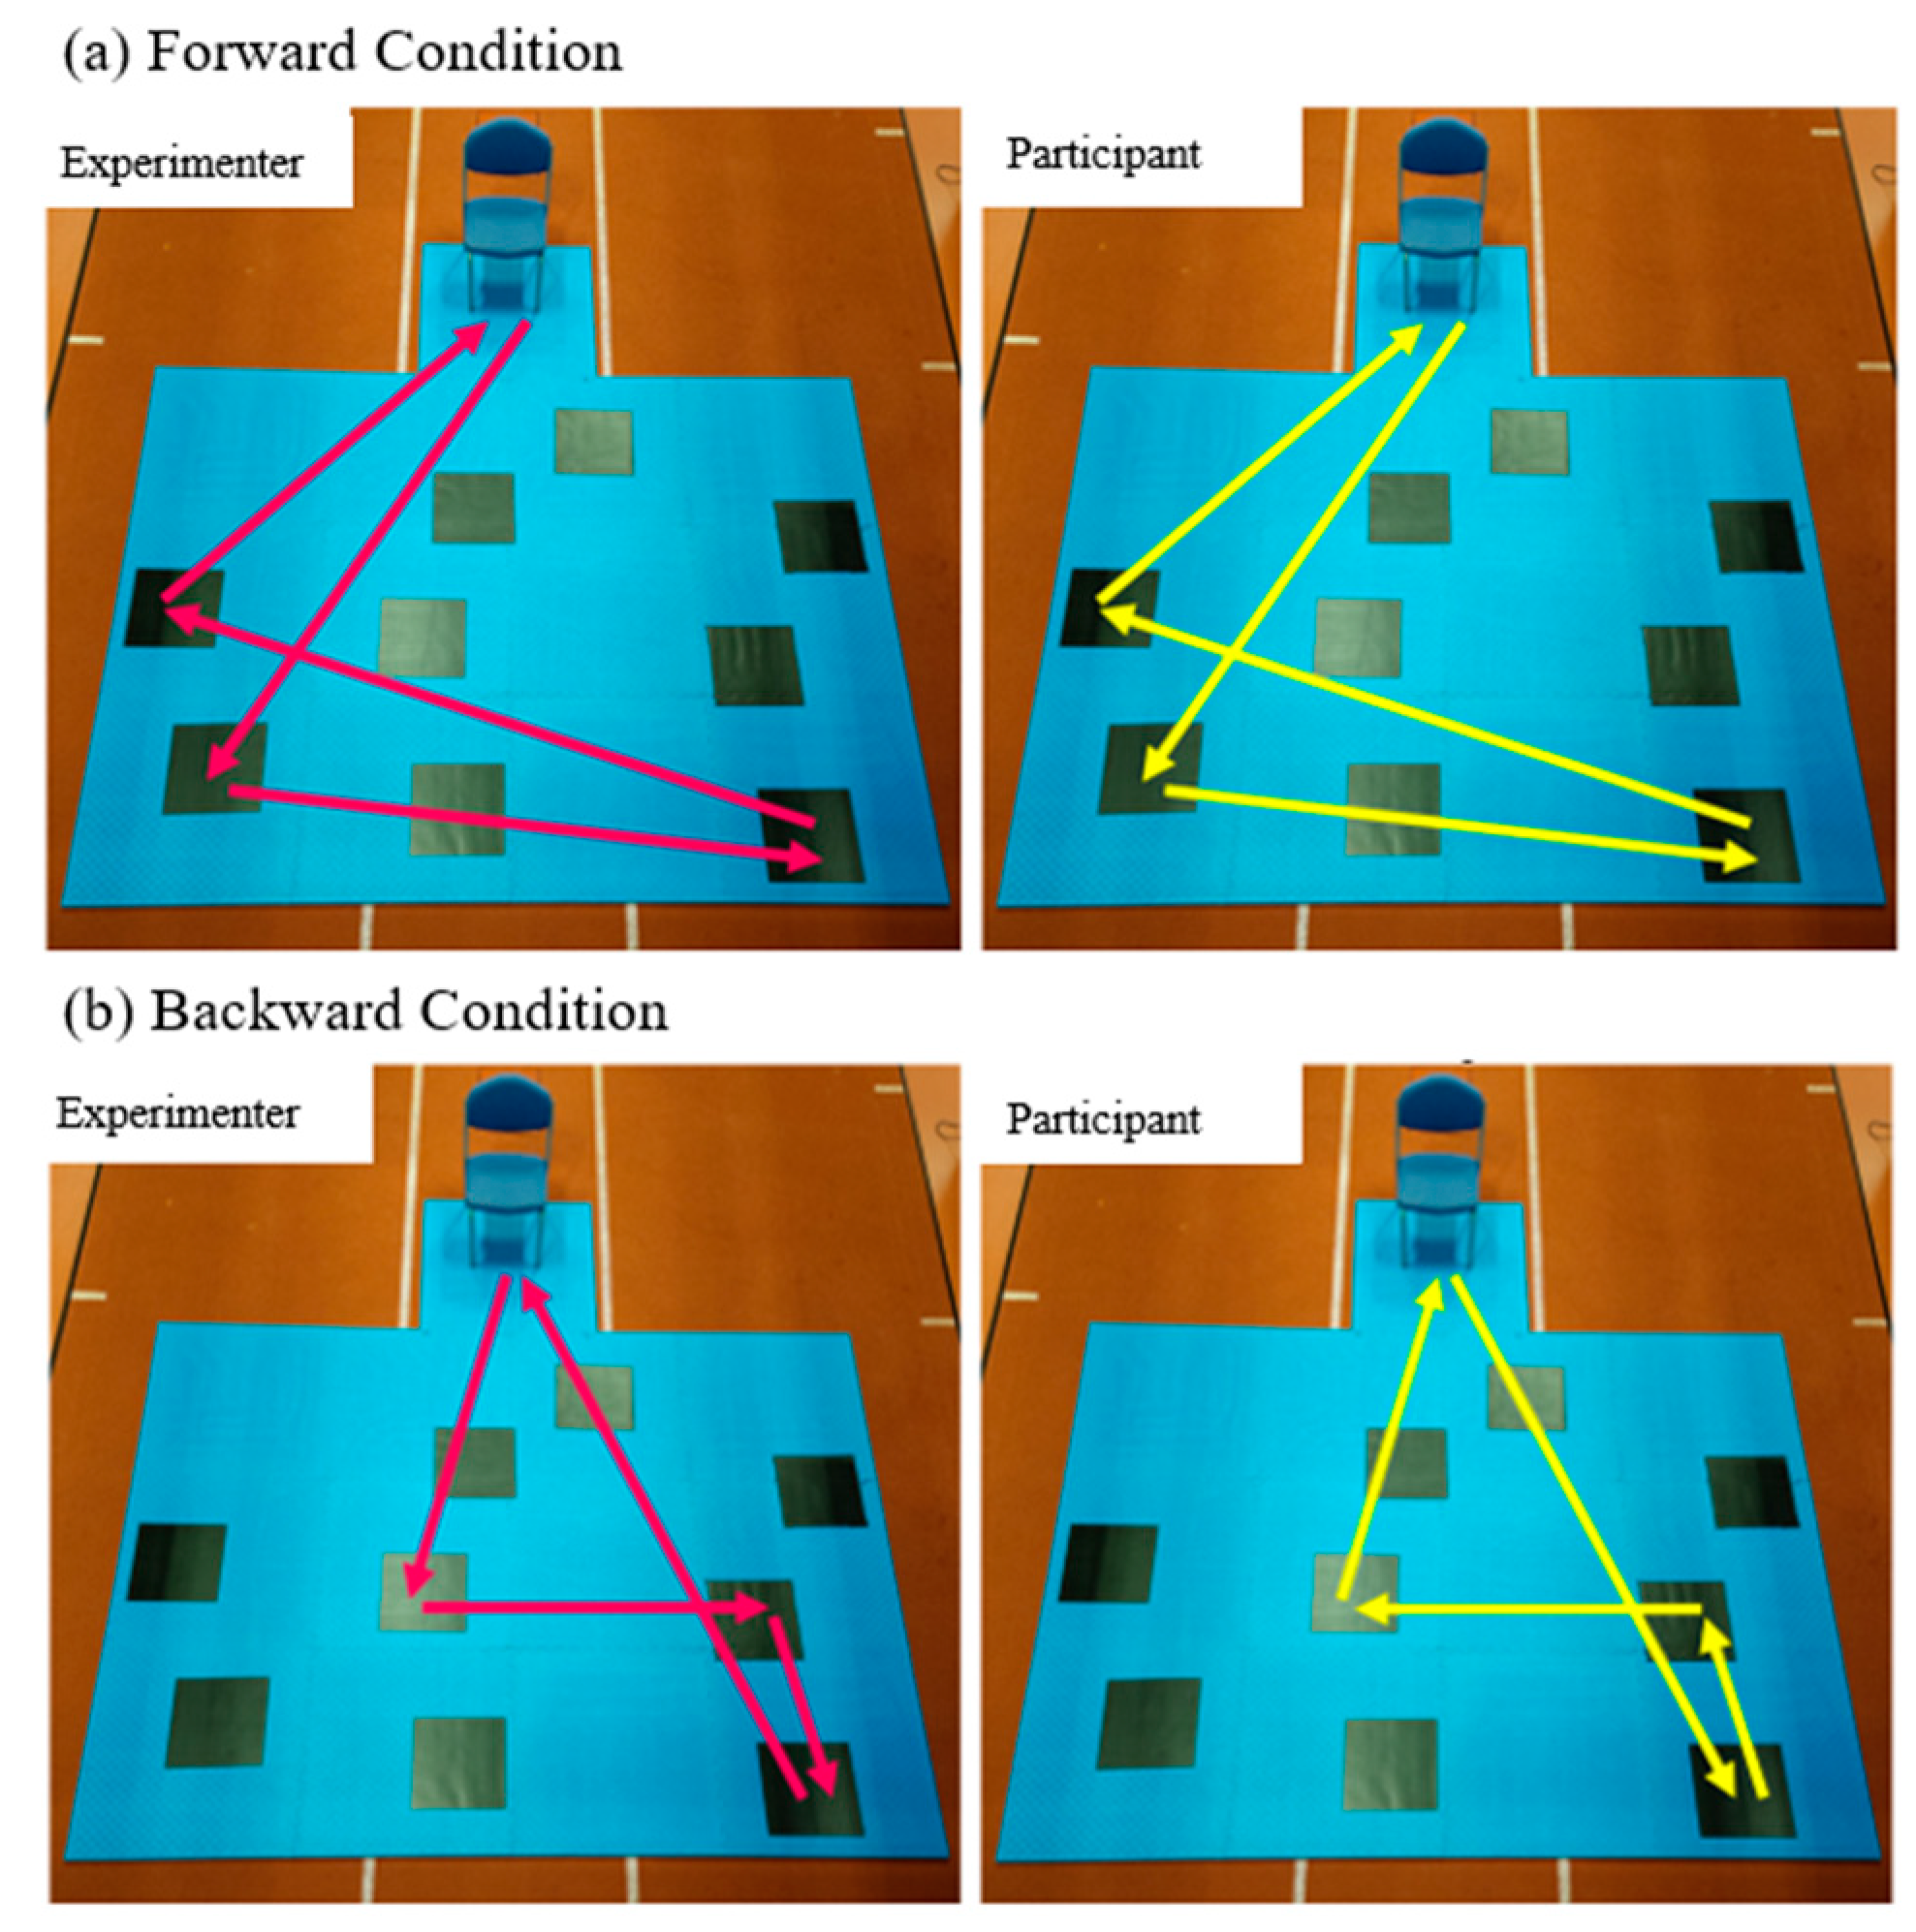
3.2.1. Forward Condition
3.2.2. Backward Condition
4. Discussion
5. Conclusions
Author Contributions
Funding
Institutional Review Board Statement
Informed Consent Statement
Data Availability Statement
Conflicts of Interest
Appendix A

References
- McAfoose, J.; Baune, B.T. Exploring Visual–Spatial Working Memory: A Critical Review of Concepts and Models. Neuropsychol. Rev. 2009, 19, 130–142. [Google Scholar] [CrossRef]
- Camp, N.; Lewis, M.; Hunter, K.; Johnston, J.; Zecca, M.; Di Nuovo, A.; Magistro, D. Technology Used to Recognize Activities of Daily Living in Community-Dwelling Older Adults. Int. J. Environ. Res. Public. Health 2021, 18, 163. [Google Scholar] [CrossRef]
- Camp, N.; Johnston, J.; Lewis, M.G.C.; Zecca, M.; Nuovo, A.D.; Hunter, K.; Magistro, D. Perceptions of In-Home Monitoring Technology for Activities of Daily Living: Semistructured Interview Study with Community-Dwelling Older Adults. JMIR Aging 2022, 5, e33714. [Google Scholar] [CrossRef]
- Wang, L.; Carr, M. Working Memory and Strategy Use Contribute to Gender Differences in Spatial Ability. Educ. Psychol. 2014, 49, 261–282. [Google Scholar] [CrossRef]
- Cowan, N. Working Memory Underpins Cognitive Development, Learning, and Education. Educ. Psychol. Rev. 2014, 26, 197–223. [Google Scholar] [CrossRef] [PubMed] [Green Version]
- Li, S.-C. Aging Mind: Facets and Levels of Analysis. In International Encyclopedia of the Social and Behavioral Sciences; Elsevier Science: Amsterdam, The Netherlands, 2001; pp. 310–317. [Google Scholar]
- Baddeley, A. Working Memory. Science 1992, 255, 556–559. [Google Scholar] [CrossRef]
- Qu, X. Age-Related Cognitive Task Effects on Gait Characteristics: Do Different Working Memory Components Make a Difference? J. NeuroEng. Rehabil. 2014, 11, 149. [Google Scholar] [CrossRef] [PubMed] [Green Version]
- Piccardi, L.; Bianchini, F.; Argento, O.; De Nigris, A.; Maialetti, A.; Palermo, L.; Guariglia, C. The Walking Corsi Test (WalCT): Standardization of the Topographical Memory Test in an Italian Population. Neurol. Sci. 2013, 34, 971–978. [Google Scholar] [CrossRef] [PubMed]
- Borella, E.; Carretti, B.; De Beni, R. Working Memory and Inhibition across the Adult Life-Span. Acta Psychol. 2008, 128, 33–44. [Google Scholar] [CrossRef] [PubMed]
- Carbone, E.; Meneghetti, C.; Mammarella, I.C.; Borella, E. Using the Walking Corsi Test to Explain Age-Related Differences between Young and Older Adults’ Rotation Performance. Neuropsychol. Rehabil. 2021, 31, 1028–1047. [Google Scholar] [CrossRef]
- Voyer, D.; Voyer, S.D.; Saint-Aubin, J. Sex Differences in Visual-Spatial Working Memory: A Meta-Analysis. Psychon. Bull. Rev. 2017, 24, 307–334. [Google Scholar] [CrossRef] [Green Version]
- Matsuda, Y.; Sugimoto, M.; Inami, M.; Kitazaki, M. Peripersonal Space in the Front, Rear, Left and Right Directions for Audio-Tactile Multisensory Integration. Sci. Rep. 2021, 11, 11303. [Google Scholar] [CrossRef] [PubMed]
- Piccardi, L.; Iaria, G.; Ricci, M.; Bianchini, F.; Zompanti, L.; Guariglia, C. Walking in the Corsi Test: Which Type of Memory Do You Need? Neurosci. Lett. 2008, 432, 127–131. [Google Scholar] [CrossRef] [PubMed]
- Piccardi, L.; Palermo, L.; Leonzi, M.; Risetti, M.; Zompanti, L.; D’Amico, S.; Guariglia, C. The Walking Corsi Test (WalCT): A Normative Study of Topographical Working Memory in a Sample of 4- to 11-Year-Olds. Clin. Neuropsychol. 2014, 28, 84–96. [Google Scholar] [CrossRef] [PubMed]
- Montello, D.R. Scale and Multiple Psychologies of Space. In Spatial Information Theory a Theoretical Basis for GIS; Lecture Notes in Computer Science; Frank, A.U., Campari, I., Eds.; Springer: Berlin/Heidelberg, Germany, 1993; pp. 312–321. [Google Scholar] [CrossRef]
- Bianchini, F.; Di Vita, A.; Palermo, L.; Piccardi, L.; Blundo, C.; Guariglia, C. A Selective Egocentric Topographical Working Memory Deficit in the Early Stages of Alzheimer’s Disease: A Preliminary Study. Am. J. Alzheimers Dis. Dement. 2014, 29, 749–754. [Google Scholar] [CrossRef]
- Boccia, M.; Vecchione, F.; Di Vita, A.; D’Amico, S.; Guariglia, C.; Piccardi, L. Effect of Cognitive Style on Topographical Learning Across Life Span: Insights from Normal Development. Child Dev. 2019, 90, 462–470. [Google Scholar] [CrossRef]
- Palmiero, M.; Nori, R.; Rogolino, C.; D’Amico, S.; Piccardi, L. Situated Navigational Working Memory: The Role of Positive Mood. Cogn. Process. 2015, 16, 327–330. [Google Scholar] [CrossRef]
- Palmiero, M.; Piccardi, L. The Role of Emotional Landmarks on Topographical Memory. Front. Psychol. 2017, 8, 763. [Google Scholar] [CrossRef] [Green Version]
- Verde, P.; Piccardi, L.; Bianchini, F.; Guariglia, C.; Carrozzo, P.; Morgagni, F.; Boccia, M.; Di Fiore, G.; Tomao, E. Gender Differences in Navigational Memory: Pilots vs. Nonpilots. Aerosp. Med. Hum. Perform. 2015, 86, 103–111. [Google Scholar] [CrossRef]
- Piccardi, L.; D’Antuono, G.; Marin, D.; Boccia, M.; Ciurli, P.; Incoccia, C.; Antonucci, G.; Verde, P.; Guariglia, C. New Evidence for Gender Differences in Performing the Corsi Test but Not the Digit Span: Data from 208 Individuals. Psychol. Stud. 2019, 64, 411–419. [Google Scholar] [CrossRef]
- Ellmers, T.J.; Cocks, A.J.; Doumas, M.; Williams, A.M.; Young, W.R. Gazing into Thin Air: The Dual-Task Costs of Movement Planning and Execution during Adaptive Gait. PLoS ONE 2016, 11, e0166063. [Google Scholar] [CrossRef] [PubMed] [Green Version]
- Stöckel, T.; Mau-Moeller, A. Cognitive Control Processes Associated with Successful Gait Performance in Dual-Task Walking in Healthy Young Adults. Psychol. Res. 2020, 84, 1766–1776. [Google Scholar] [CrossRef] [PubMed]
- Beurskens, R.; Steinberg, F.; Antoniewicz, F.; Wolff, W.; Granacher, U. Neural Correlates of Dual-Task Walking: Effects of Cognitive versus Motor Interference in Young Adults. Neural Plast. 2016, 2016, e8032180. [Google Scholar] [CrossRef] [PubMed] [Green Version]
- Kelly, V.E.; Janke, A.A.; Shumway-Cook, A. Effects of Instructed Focus and Task Difficulty on Concurrent Walking and Cognitive Task Performance in Healthy Young Adults. Exp. Brain Res. 2010, 207, 65–73. [Google Scholar] [CrossRef] [PubMed] [Green Version]
- Amboni, M.; Barone, P.; Hausdorff, J.M. Cognitive Contributions to Gait and Falls: Evidence and Implications. Mov. Disord. 2013, 28, 1520–1533. [Google Scholar] [CrossRef]
- Morris, R.; Lord, S.; Bunce, J.; Burn, D.; Rochester, L. Gait and Cognition: Mapping the Global and Discrete Relationships in Ageing and Neurodegenerative Disease. Neurosci. Biobehav. Rev. 2016, 64, 326–345. [Google Scholar] [CrossRef] [Green Version]
- Yogev-Seligmann, G.; Hausdorff, J.M.; Giladi, N. The Role of Executive Function and Attention in Gait. Mov. Disord. 2008, 23, 329–342. [Google Scholar] [CrossRef] [Green Version]
- Grabiner, M.D.; Troy, K.L. Attention Demanding Tasks during Treadmill Walking Reduce Step Width Variability in Young Adults. J. NeuroEng. Rehabil. 2005, 2, 25. [Google Scholar] [CrossRef] [Green Version]
- Shi, L.; Duan, F.; Yang, Y.; Sun, Z. The Effect of Treadmill Walking on Gait and Upper Trunk through Linear and Nonlinear Analysis Methods. Sensors 2019, 19, 2204. [Google Scholar] [CrossRef] [Green Version]
- Beckmann, J.F.; Birney, D.P.; Goode, N. Beyond Psychometrics: The Difference between Difficult Problem Solving and Complex Problem Solving. Front. Psychol. 2017, 8, 1739. [Google Scholar] [CrossRef] [PubMed] [Green Version]
- Smith, E.; Walsh, L.; Doyle, J.; Greene, B.; Blake, C. The Reliability of the Quantitative Timed up and Go Test (QTUG) Measured over Five Consecutive Days under Single and Dual-Task Conditions in Community Dwelling Older Adults. Gait Posture 2016, 43, 239–244. [Google Scholar] [CrossRef]
- Savica, R.; Wennberg, A.M.V.; Hagen, C.; Edwards, K.; Roberts, R.O.; Hollman, J.H.; Knopman, D.S.; Boeve, B.F.; Machulda, M.M.; Petersen, R.C.; et al. Comparison of Gait Parameters for Predicting Cognitive Decline: The Mayo Clinic Study of Aging. J. Alzheimers Dis. 2017, 55, 559–567. [Google Scholar] [CrossRef] [PubMed] [Green Version]
- Arlotti, J.S.; Carroll, W.O.; Afifi, Y.; Talegaonkar, P.; Albuquerque, L.; Burch, R.; Ball, J.E.; Chander, H.; Petway, A. Benefits of IMU-Based Wearables in Sports Medicine: Narrative Review. Int. J. Kinesiol. Sports Sci. 2022, 10, 36–43. [Google Scholar] [CrossRef]
- Murman, D.L. The Impact of Age on Cognition. Semin. Hear. 2015, 36, 111–121. [Google Scholar] [CrossRef] [PubMed]
- Schott, N.; El-Rajab, I.; Klotzbier, T. Cognitive-Motor Interference during Fine and Gross Motor Tasks in Children with Developmental Coordination Disorder (DCD). Res. Dev. Disabil. 2016, 57, 136–148. [Google Scholar] [CrossRef]
- Klotzbier, T.J.; Schott, N. Cognitive-Motor Interference during Walking in Older Adults with Probable Mild Cognitive Impairment. Front. Aging Neurosci. 2017, 9, 350. [Google Scholar] [CrossRef] [Green Version]
- Zhang, C.; Sun, W.; Song, Q.; Gu, H.; Mao, D. Performance of Older Adults under Dual Task during Stair Descent. J. Exerc. Sci. Fit. 2018, 16, 99–105. [Google Scholar] [CrossRef]
- Oliveira, A.S.; Reiche, M.S.; Vinescu, C.I.; Thisted, S.A.H.; Hedberg, C.; Castro, M.N.; Jørgensen, M.G. The Cognitive Complexity of Concurrent Cognitive-Motor Tasks Reveals Age-Related Deficits in Motor Performance. Sci. Rep. 2018, 8, 6094. [Google Scholar] [CrossRef] [Green Version]
- Bueno, G.A.S.; Gervásio, F.M.; Ribeiro, D.M.; Martins, A.C.; Lemos, T.V.; de Menezes, R.L. Fear of Falling Contributing to Cautious Gait Pattern in Women Exposed to a Fictional Disturbing Factor: A Non-Randomized Clinical Trial. Front. Neurol. 2019, 10, 283. [Google Scholar] [CrossRef]
- Racey, M.; Markle-Reid, M.; Fitzpatrick-Lewis, D.; Ali, M.U.; Gagne, H.; Hunter, S.; Ploeg, J.; Sztramko, R.; Harrison, L.; Lewis, R.; et al. Fall Prevention in Community-Dwelling Adults with Mild to Moderate Cognitive Impairment: A Systematic Review and Meta-Analysis. BMC Geriatr. 2021, 21, 689. [Google Scholar] [CrossRef]
- Persad, C.C.; Jones, J.L.; Ashton-Miller, J.A.; Alexander, N.B.; Giordani, B. Executive Function and Gait in Older Adults with Cognitive Impairment. J. Gerontol. Ser. A 2008, 63, 1350–1355. [Google Scholar] [CrossRef] [PubMed] [Green Version]


| Trial Condition (M; SD) (Median; IQR) | ANCOVA | Pairwise Comparison | |||
|---|---|---|---|---|---|
| Forward CBT | Forward WalCT | Backward CBT | Backward WalCT | ||
| 6;1 (6;1) | 4;1 (4;1) | 5;1 (5;2) | 4;1 (4;1) | F = 5.45; p < 0.01; η2 = 0.117 | ForwCBT > ForwWalCT * ForwCBT > BackWalCT * BackCBT > ForwWalCT * BackCBT > BackWalCT * |
| Gait Variable | Trial Level (M; SD) | ANCOVA | Pairwise Comparison (p-Value) d | |||
|---|---|---|---|---|---|---|
| Successful 1 (S1) | Successful 2 (S2) | Successful 3 (S3) | Unsuccessful (Fail) | |||
| Forward Trials | ||||||
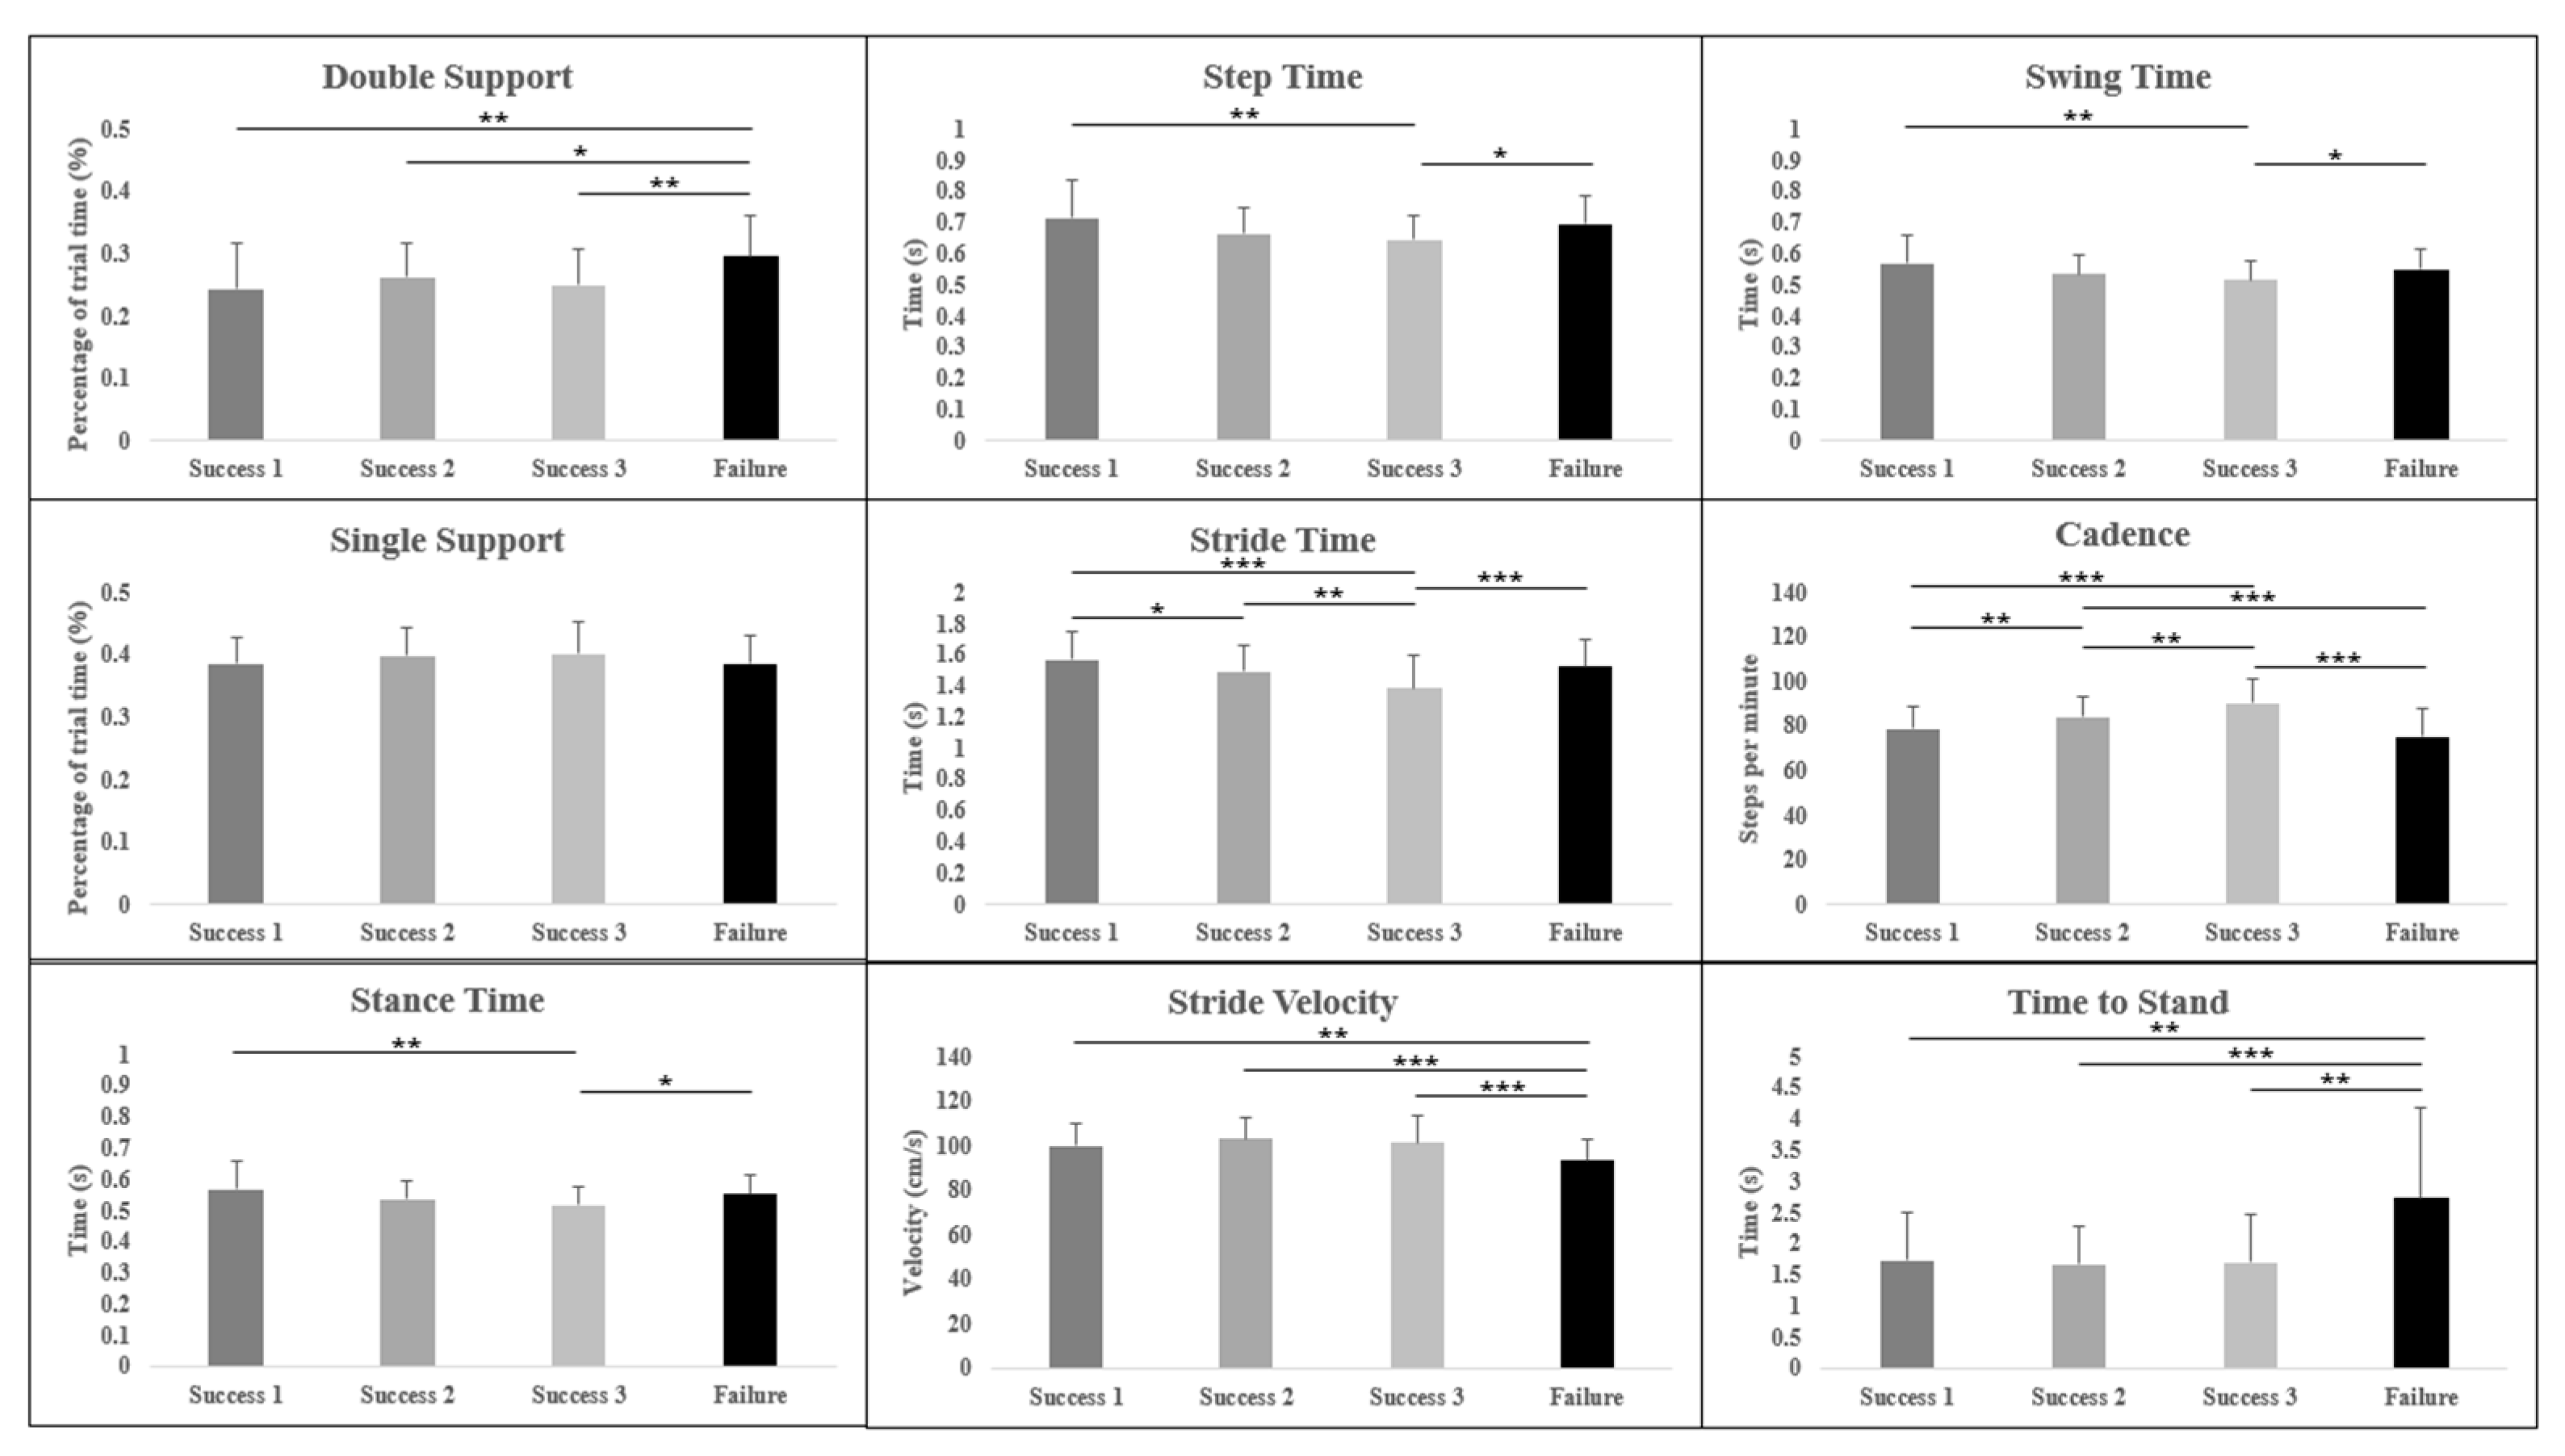
| Average Double Support (%) | 0.24; 0.07 | 0.26; 0.05 | 0.25; 0.06 | 0.29; 0.07 | F = 8.50 p < 0.001 * η2 = 0.168 | S1-fail * (0.001) 0.7 S2-fail * (0.047) 0.5 S3-fail * (0.002) 0.6 |
| Average Single Support (%) | 0.39; 0.04 | 0.40; 0.05 | 0.40; 0.05 | 0.39; 0.57 | F = 1.96 p > 0.05 η2 = 0.045 | - |
| Average Stance Time (s) | 0.57; 0.09 | 0.54; 0.06 | 0.52; 0.06 | 0.55; 0.06 | F = 6.57 p = 0.002 * η2 = 0.135 | S1-S3 * (0.001) 0.7 S3-fail * (0.013) 0.5 |
| Average Step Time (s) | 0.72; 0.12 | 0.66; 0.09 | 0.65; 0.08 | 0.70; 0.09 | F = 6.52 p < 0.001 * η2 = 0.134 | S1-S3 * (0.001) 0.7 S3-fail * (0.012) 0.6 |
| Average Stride Time (s) | 1.57; 0.19 | 1.49; 0.17 | 1.39; 0.21 | 1.53; 0.18 | F = 15.51 p < 0.001 * η2 = 0.270 | S1-S2 * (0.013) 0.4 S1-S3 * (<0.001) 0.9 S2-S3 * (0.002) 0.5 S3-fail * (<0.001) 0.7 |
| Average Stride Velocity (cm/s) | 99.80; 10.09 | 103.20; 9.01 | 101.32; 12.57 | 93.41; 9.82 | F = 13.38 p < 0.001 * η2 = 0.242 | S1-fail * (0.006) 0.6 S2-fail * (<0.001) 1.0 S3-fail * (<0.001) 0.7 |
| Average Swing Time (s) | 0.57; 0.09 | 0.54; 0.06 | 0.52; 0.06 | 0.55; 0.06 | F = 6.57 p < 0.002 * η2 = 0.135 | S1-S3 * (0.001) 0.7 S3-fail* (0.013) 0.5 |
| Cadence (steps/min) | 78.96; 9.45 | 84.01; 9.48 | 90.40; 11.25 | 75.24; 12.48 | F = 31.96 p < 0.001 * η2 = 0.432 | S1-S2 * (0.009) 0.5 S1-S3 * (<0.001) 1.1 S2-S3 * (0.001) 0.6 S2-fail * (<0.001) 0.8 S3-fail * (<0.001) 1.3 |
| Time Taken to Stand (s) | 1.74; 0.77 | 1.67; 0.62 | 1.70; 0.77 | 2.73; 1.45 | F = 14.53 p < 0.001 * η2 = 0.257 | S1-fail * (0.003) 0.9 S2-fail * (<0.001) 1.0 S3-fail * (0.001) 0.9 |
| Gait Variable | Trial Level (M; SD) | ANCOVA | Pairwise Comparison (p-Value) d | |||
|---|---|---|---|---|---|---|
| Successful 1 (S1) | Successful 2 (S2) | Successful 3 (S3) | Unsuccessful (Fail) | |||
| Backward Trials | ||||||
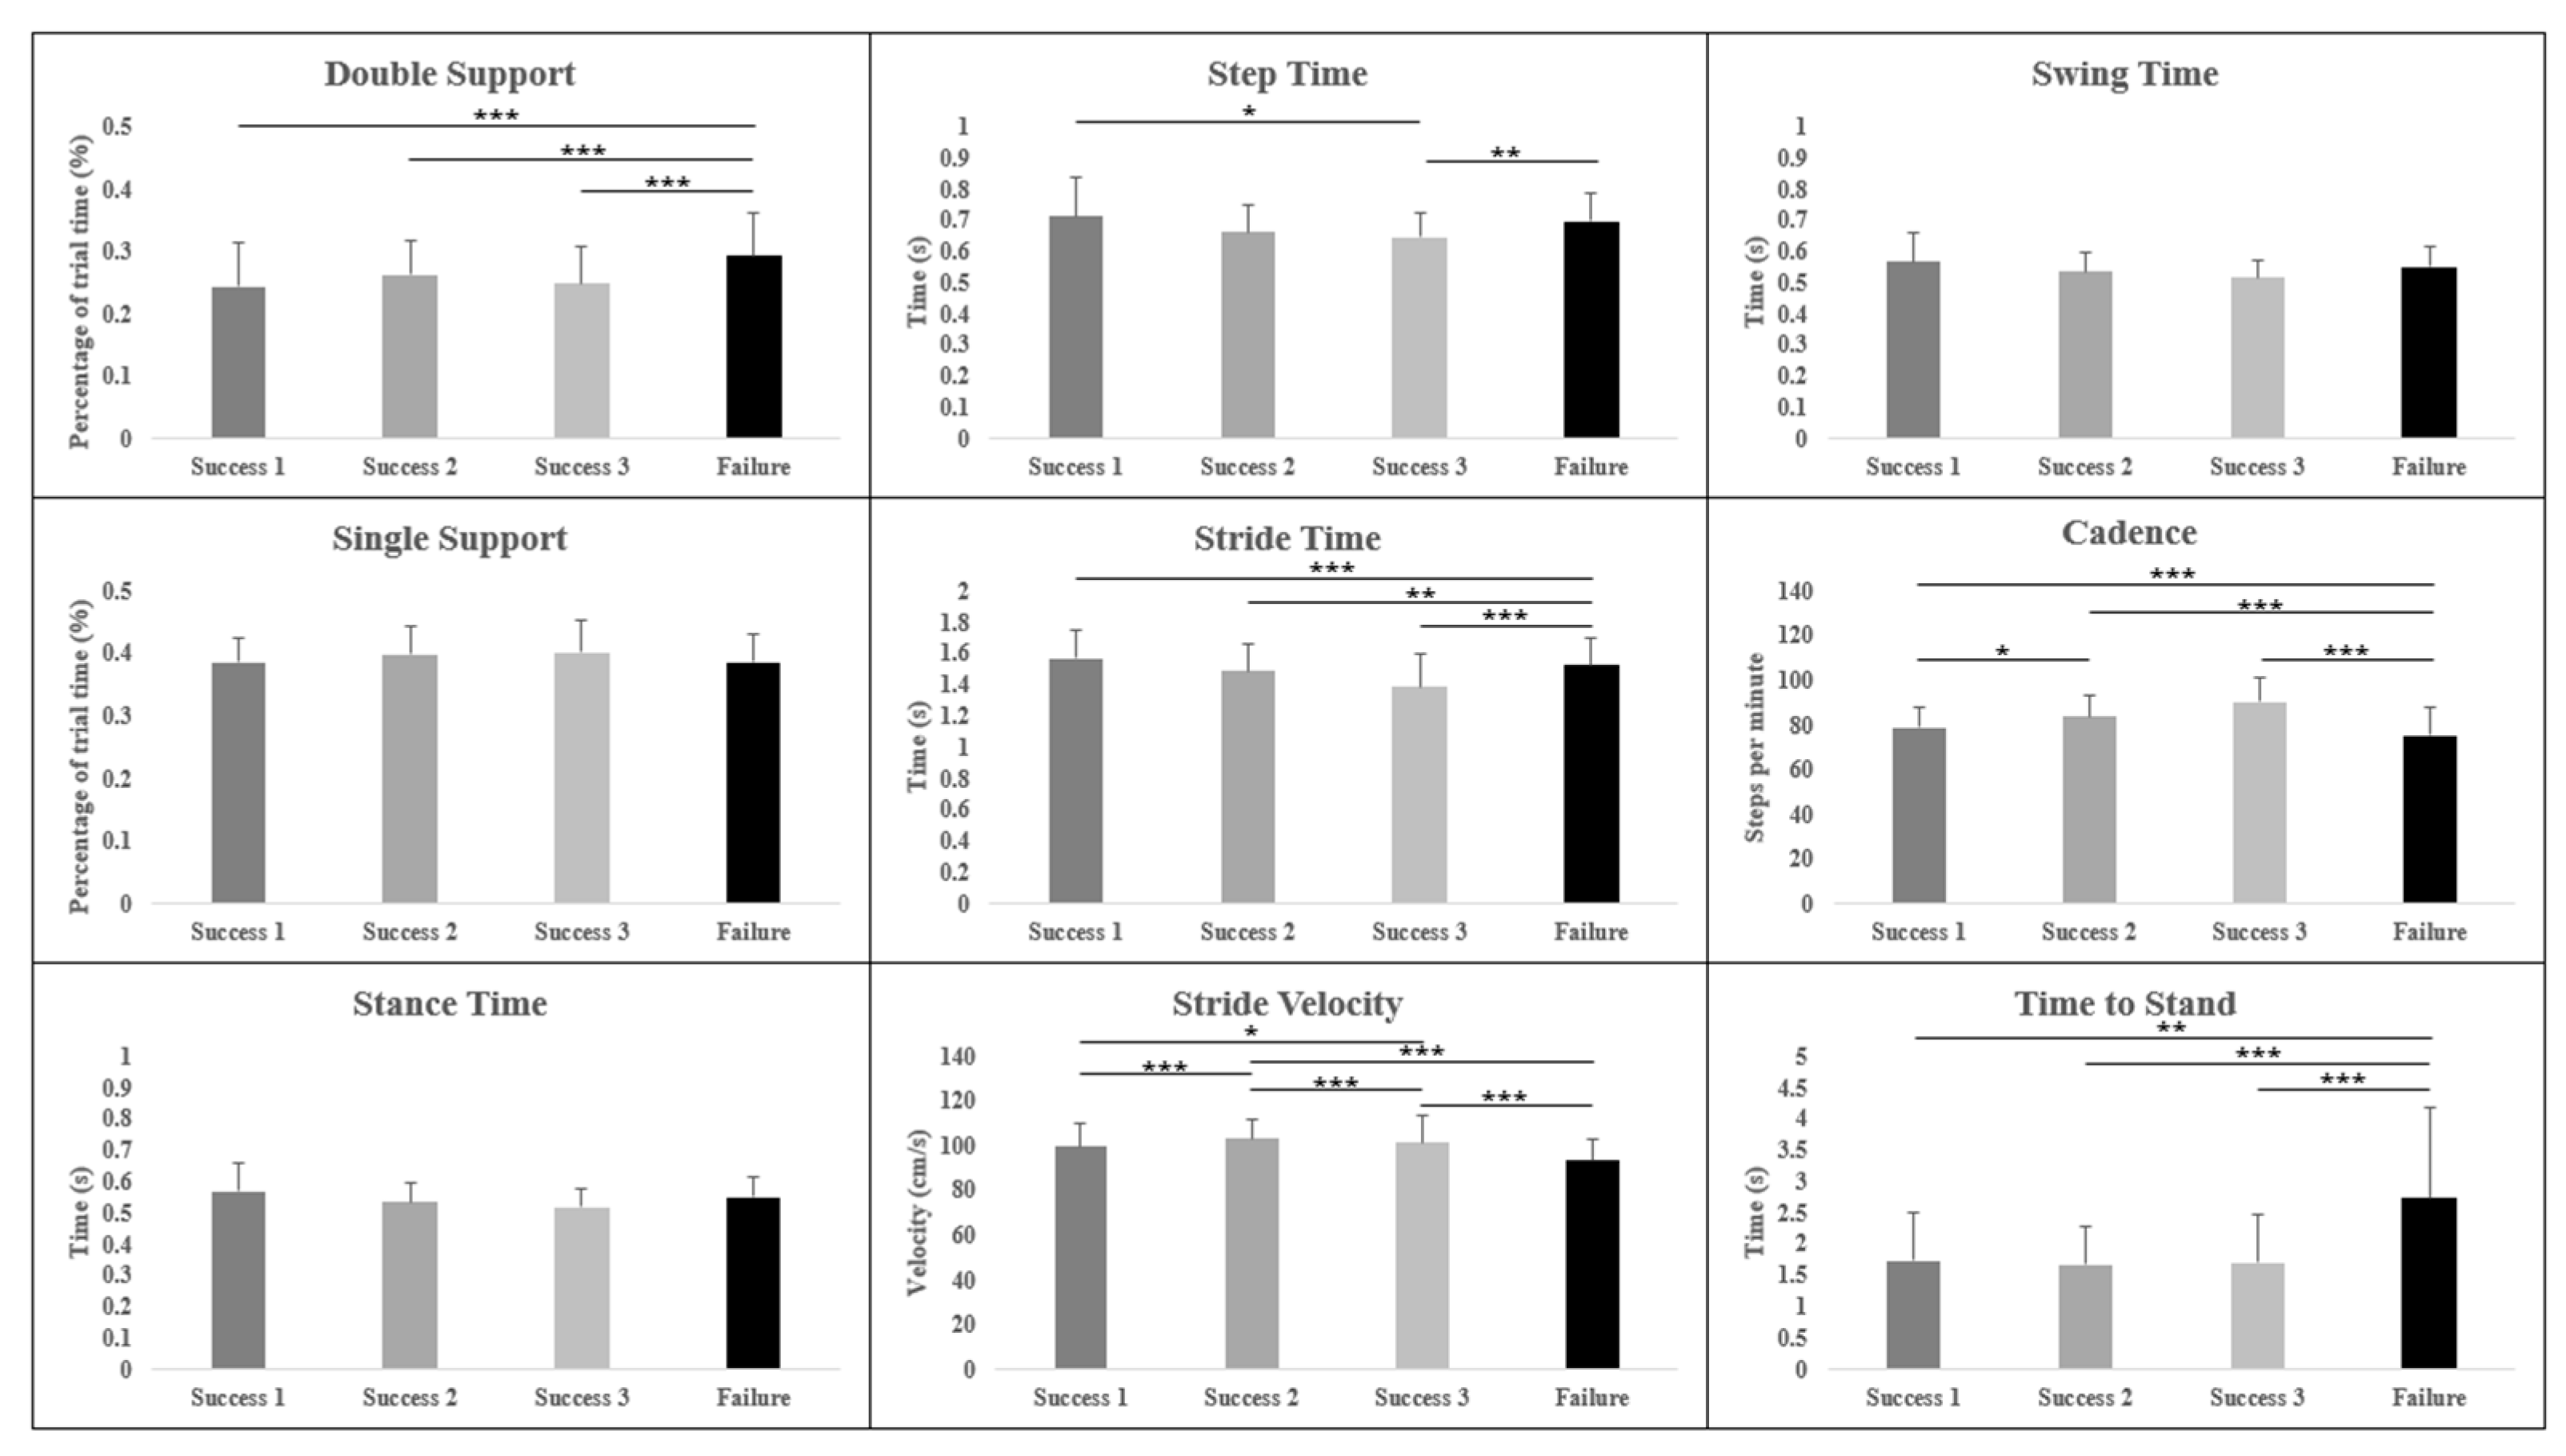
| Average Double Support (%) | 0.22; 0.08 | 0.23; 0.05 | 0.24; 0.08 | 0.31; 0.06 | F = 22.04 p < 0.001 * η2 = 0.361 | S1-fail * (<0.001) 1.3 S2-fail * (<0.001) 1.4 S3-fail * (<0.001) 1.0 |
| Average Single Support (%) | 0.41; 0.05 | 0.40; 0.05 | 0.41; 0.06 | 0.39; 0.04 | F = 1.98 p > 0.05 η2 = 0.048 | - |
| Average Stance Time (s) | 0.54; 0.08 | 0.55; 0.07 | 0.53; 0.07 | 0.56; 0.06 | F = 6.57 p > 0.05 η2 = 0.135 | - |
| Average Step Time (s) | 0.65; 0.09 | 0.67; 0.09 | 0.65; 0.08 | 0.71; 0.09 | F = 6.28 p < 0.001 * η2 = 0.139 | S1-fail * (0.013) 0.7 S3-fail * (0.007) 0.7 |
| Average Stride Time (s) | 1.37; 0.19 | 1.42; 0.18 | 1.37; 0.24 | 1.57; 0.18 | F = 17.80 p < 0.001 * η2 = 0.313 | S1-fail * (<0.001) 1.1 S2-fail * (0.001) 0.8 S3-fail * (<0.001) 0.9 |
| Average Stride Velocity (cm/s) | 93.82; 13.34 | 108.99; 10.20 | 100.43; 11.00 | 89.57; 11.51 | F = 33.82 p < 0.001 * η2 = 0.464 | S1-S2 * (<0.001) 1.3 S1-S3 * (0.011) 1.3 S2 -S3 (<0.001) 0.8 S2- fail * (<0.001)1.8 S3-fail * (<0.001) 1.0 |
| Average Swing Time (s) | 0.54; 0.08 | 0.55; 0.07 | 0.53; 0.07 | 0.56; 0.06 | F = 1.90 p > 0.05 η2 = 0.047 | - |
| Cadence (steps/min) | 93.34; 11.35 | 88.92; 10.09 | 91.85; 13.34 | 73.47; 13.77 | F = 34.78 p < 0.001 * η2 = 0.471 | S1-S2 * (0.014) 0.4 S1-fail * (<0.001) 1.6 S2-fail * (<0.001) 1.3 S3-fail * (<0.001) 1.4 |
| Time Taken to Stand (s) | 1.42; 0.48 | 1.33; 0.54 | 1.34; 0.58 | 2.85; 2.27 | F = 18.54 p < 0.001 * η2 = 0.322 | S1-fail * (0.001) 0.9 S2-fail * (<0.001) 0.9 S3-fail * (<0.001) 0.9 |
Disclaimer/Publisher’s Note: The statements, opinions and data contained in all publications are solely those of the individual author(s) and contributor(s) and not of MDPI and/or the editor(s). MDPI and/or the editor(s) disclaim responsibility for any injury to people or property resulting from any ideas, methods, instructions or products referred to in the content. |
© 2023 by the authors. Licensee MDPI, Basel, Switzerland. This article is an open access article distributed under the terms and conditions of the Creative Commons Attribution (CC BY) license (https://creativecommons.org/licenses/by/4.0/).
Share and Cite
Camp, N.; Vagnetti, R.; Bisele, M.; Felton, P.; Hunter, K.; Magistro, D. The Effect of Cognitive Task Complexity on Healthy Gait in the Walking Corsi Test. Brain Sci. 2023, 13, 1019. https://doi.org/10.3390/brainsci13071019
Camp N, Vagnetti R, Bisele M, Felton P, Hunter K, Magistro D. The Effect of Cognitive Task Complexity on Healthy Gait in the Walking Corsi Test. Brain Sciences. 2023; 13(7):1019. https://doi.org/10.3390/brainsci13071019
Chicago/Turabian StyleCamp, Nicola, Roberto Vagnetti, Maria Bisele, Paul Felton, Kirsty Hunter, and Daniele Magistro. 2023. "The Effect of Cognitive Task Complexity on Healthy Gait in the Walking Corsi Test" Brain Sciences 13, no. 7: 1019. https://doi.org/10.3390/brainsci13071019