
Auditory Discrimination—A Missing Piece of Speech and Language Development: A Study on 6–9-Year-Old Children with Auditory Processing Disorder

Abstract
:1. Introduction
2. Materials and Methods
- -
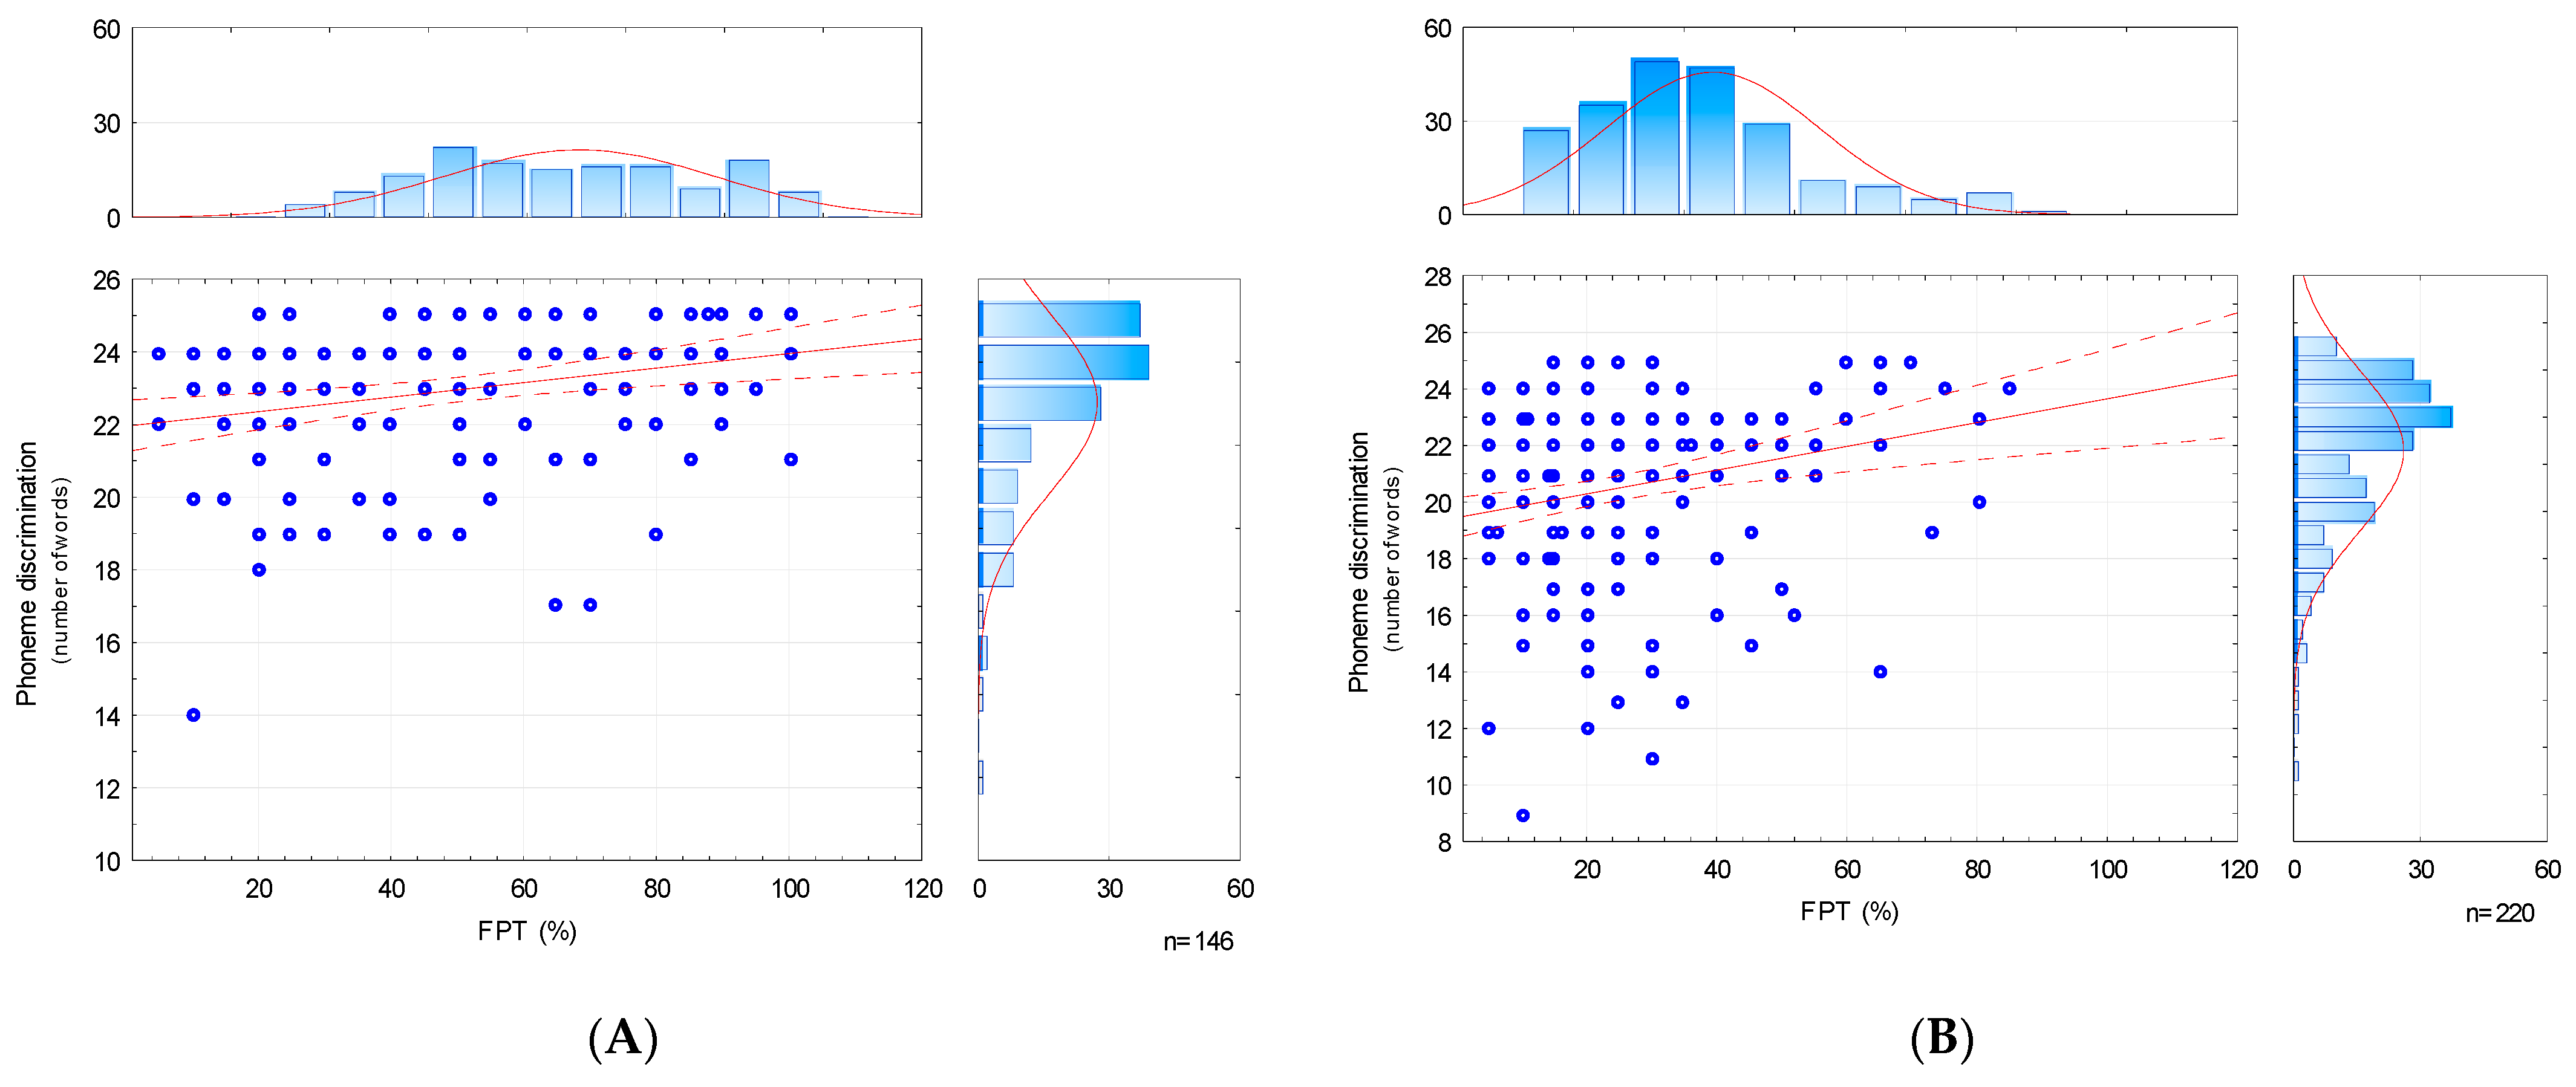
- The APD group: included 220 participants with APD (with more than 1 result of the psychoacoustic tests below the norm);
- -
- The TD (typically developing) group: comprised 146 typically developing participants, not diagnosed with APD (each child obtained a maximum of 1 result below the norm in the psychoacoustic tests). This was considered a control group.
- 1.
- Hearing status was assessed with pure-tone audiometry (PTA), speech audiometry (AC40, Interacoustics, Denmark, with TDH39 headphones), tympanometry and otoacoustic emissions (Titan, Interacoustics, Denmark). Normal hearing sensitivity was diagnosed when the hearing thresholds in PTA were below 20 dB for the tested frequency range (125–8000 Hz). The result of the type A tympanometry curve was understood as confirmation of the correct function of the middle ear, according to Jerger’s [23] criteria. The regular inner ear condition was determined with the registration of the otoacoustic emissions signal from both ears. Clinical Distortion Product Otoacoustic Emissions (DPOAEs) were used for the diagnostics;
- 2.
- Higher auditory functions were assessed with a battery of psychoacoustic tests available online on the ATS Neuroflow platform. The battery of tests includes:
- Adaptive Speech in Noise Test (ASPN), a test assessing understanding of speech in noise (the presented study used multitalker babble);
- Dichotic Digits Test with distracted attention (DDT), which assesses the maturity of the auditory system in its central part and enables identification of the cerebral hemisphere dominance in terms of verbal stimuli;
- The Frequency Pattern Test (FPT), which assesses the ability to discriminate sound frequencies, the level of auditory short-term memory, and the level of functioning of the right cerebral hemisphere [24];
- 1.
- The testing procedure was always conducted by the same certified Neuroflow provider specialist in an acoustically treated room, using an AC40 audiometer (Interacoustics, Denmark) and TDH39 headphones (Interacoustics, Denmark). Auditory stimuli were presented for both ears at a comfortable volume level of 60 dB for both ears. One complete examination procedure lasted about 20 min. The tests were carried out in the same order for each subject. Each participant’s caregiver completed a symptom questionnaire (constituting part of the battery used in the study). The study was conducted according to the procedure already described [24] (Appendix A);
- 2.
- The assessment of phoneme discrimination was carried out using a standardized test included in the battery of phonological tests of the Educational Research Institute [25]. The test consists of 25 pairs of nonsense words with the same syllable structure. Among these words, 18 pairs differ with 1 distinctive feature (1 phoneme), and in the remaining 7 pairs, the nonsense words are the same (constituting control samples, according to the authors of the test). Phonological oppositions concern voicing (5 pairs), manner of articulation (4 pairs), place of articulation (7 pairs) and nasality (2 pairs of vowels), which are a contrastive feature of the Polish language. Nonsense words used in this study allowed us to eliminate the influence of the semantic factor. The full list of the pairs of words used, together with their phonetic notation, is presented in Table A1 in Appendix B. One speech-language pathologist—a female—conducted the phoneme discrimination test for each child: pairs of words were pronounced in the same order, with the natural speaking rate and intonation. Having heard the words, participants were required to assess whether they were the same or different, scoring 1 point for each correctly identified pair. The maximum test score was then 25 points. The test’s duration was approximately 5 min.
3. Results
4. Discussion
5. Limitations and Future Directions
6. Conclusions
- The development of phoneme discrimination does not end with the acquisition of phonemes (around 6 years of age) but continues during school age;
- The depth of the deficits observed through the results of the FPT test corresponds to the occurrence of auditory processing disorders. The participants with APD obtained results twice as low in the FPT test as their typically developing peers.
Author Contributions
Funding
Institutional Review Board Statement
Informed Consent Statement
Data Availability Statement
Conflicts of Interest
Appendix A
- „ASPN-S test: a test assessing understanding of speech in noise. It involves presenting monosyllabic words in the presence of noise (the presented study used a multitalker babble). Monosyllabic words were presented binaurally with variable signal intensity, together with multitalker babble, which was presented with a constant intensity of 60 dB. The task of the listener was to repeat the heard word. The correct answer was considered to be a precise repetition of the word, while the incorrect—no repetition or inaccurate repetition (e.g., saying a different word). The first two words were given with a large difference between the intensity of the signal and the noise (14 dB), which allowed the test participant to answer with confidence. Each subsequent word was delivered 4 dB lower until the listener answered incorrectly. Following the incorrect response, the intensity of the ”word” stimulus was increased by 4 dB, and the stimulus was continued until the correct response was obtained. Subsequently, the intensity of the stimulus was decreased by 2 dB. These changes in intensity were repeated 5 times. The mean signal-to-noise ratio (SNR) threshold was determined based on the 4 lowest values at which the participant gave the correct answers [45].
- DDT: a test of dichotic listening with distracted attention. It involves presenting 20 sequences of two different pairs of numbers (1–10) to the left and right ear at the same time. The participant’s task is to repeat all four numbers heard in a sequence; the order of the numbers is not relevant. The result is presented as a percentage of correctly recognized sequences for each ear, respectively. This test assesses the maturity of the auditory system in its central part and enables the identification of cerebral hemisphere dominance in terms of verbal stimuli;
- FPT: a test checking the frequency pattern of sequences. It involves the determination of the sequence of the sounds heard. Twenty sequences of three-element tones of two frequencies (high tone: 1020 Hz, low tone: 880 Hz) were presented. The participant’s task was to recognize and name the heard sounds in the presented order, e.g., when the sounds of the high, low, and high pitch were presented, the child was expected to answer: high, low, high. The result of the test was the percentage of correctly recognized sequences. FPT can be used for assessing the ability to discriminate sound frequencies, level of auditory short-term memory and level of functioning of the right cerebral hemisphere.”
Appendix B

| No. | Oppositive Phonemes Orthographic Polish Transcription | Oppositive Phonemes Slavistic Phonetic Alphabet (SPA) | Oppositive Phonemes International Phonetic Alphabet (IPA) | Phonological Opposition | ||
|---|---|---|---|---|---|---|
| 1 | Lasia–lacia | [laśa]–[laća] | [ś–ć] | [laɕa]–[laʨ̑a] | [ɕ–ʨ̑] | manner of articulation |
| 2 | zela–żela | [zela–žela] | [z–ž] | [zɛla]–[ʒɛla] | [z–ʒ] | place of articulation |
| 3 | abo–abo * | [abo–abo] * | – | [abɔ–abɔ] * | – | – |
| 4 | dzal–zal | [ʒal–zal] | [ʒ–z] | [ʣ̑al–zal] | [ʣ̑–z] | place of articulation |
| 5 | pecul–pesul | [pecul–pesul] | [c–s] | [pɛcul–pɛsul] | [c–s] | manner of articulation |
| 6 | ogat–ogat * | [ogat–ogat] * | – | [ɔgat–ɔgat] * | – | – |
| 7 | esak–eszak | [esak–ešak] | [s–š] | [ɛsak–ɛʃak] | [s–ʃ] | place of articulation |
| 8 | furi–wuri | [furi–vuri] | [f–v] | [furi–vuri] | [f–v] | voicing |
| 9 | taso–taso * | [taso–taso] * | – | [tasɔ–tasɔ] * | – | – |
| 10 | naś–niaś |  | [n–ń] |  | [n–ˈɲ] | place of articulation |
| 11 | poj–boj | [poi̯–boi̯] | [p–b] | [pɔj–bɔj] | [p–b] | voicing |
| 12 | dzek–dzek * | [ʒek–ʒek] * | – | [ʣ̑ɛk–ʣ̑ɛk] * | – | – |
| 13 | kocz–koć | [koč–koć] | [č–ć] | [kɔʧ̑–kɔʨ̑] | [ʧ̑–ʨ̑] | place of articulation |
| 14 | sełe–zełe | [seu̯e–zeu̯e] | [s–z] | [sɛwɛ–zɛwɛ] | [s–z] | voicing |
| 15 | tech–tęch | [teχ–teŋχ] | [e–eŋ] | [tɛx–tɛŋx] | [ɛ–ɛŋ] | vowels / nasalization |
| 16 | simo–simo * | [śĩmo–śĩmo] * | – | [ɕĩmo–ɕĩmo] * | – | – |
| 17 | inej–imej | [ˈinei̯–ˈimei̯] | [n–m] | [ˈinɛj–ˈimɛj] | [n–m] | place of articulation |
| 18 | cape–cate | [cape–cate] | [p–t] | [ʦ̑apɛ–ʦ̑atɛ] | [p–t] | place of articulation |
| 19 | olit–olit * | [olʹit–olʹit] * | – | [oˈlʲit–oˈlʲit] | – | – |
| 20 | pofa–pąfa | [pofa–poŋfa] | [o–oŋ] | [pofa–pɔȵfa] | [o–ɔȵ] | vowels / nasalization |
| 21 | siepi–ziepi | [śepi–źepi] | [ś–ź] | [ɕĩɛpi –ˈʑĩɛpi] | [ɕĩ –ˈʑĩ] | voicing |
| 22 | tąsy–tąsy * | [toų̯sy–toų̯sy] * | – |  | – | – |
| 23 | koczy–kodży | [kočy–koǯy] | [č–ǯ] | [kɔʧ̑ɨ–kɔʤ̑ɨ] | [ʧ̑–ʤ̑] | voicing |
| 24 | zurka–zulka | [zurka–zulka] | [r–l] | [zurka–zulka] | [r–l] | manner of articulation |
| 25 | praki–plaki | [praḱi–plaḱi] | [r–l] | [praci–placi] | [r–l] | manner of articulation |
Appendix C
| Group APD: Kolmogorov–Smirnov Test and Lilliefors Test | ||||||||||
|---|---|---|---|---|---|---|---|---|---|---|
| Age | Total | Age: 6 | Age: 7 | Age: 8 | Age: 9 | |||||
| Test | KS | LF | KS | LF | KS | LF | KS | LF | KS | LF |
| FPT | <0.01 | <0.01 | <0.10 | <0.01 | >0.20 | <0.05 | >0.20 | >0.20 | <0.20 | <0.01 |
| FPT (%) | <0.05 | <0.01 | <0.10 | <0.01 | >0.20 | <0.05 | >0.20 | >0.20 | <0.20 | <0.01 |
| PDT | <0.01 | <0.01 | <0.15 | <0.01 | <0.05 | <0.01 | <0.10 | <0.01 | <0.10 | <0.01 |
| Group TD: Kolmogorov–Smirnov test and Lilliefors test | ||||||||||
| Age | Total | Age: 6 | Age: 7 | Age: 8 | Age: 9 | |||||
| Test | KS | LF | KS | LF | KS | LF | KS | LF | KS | LF |
| FPT | <0.20 | <0.01 | >0.20 | <0.20 | >0.20 | >0.20 | >0.20 | >0.20 | >0.20 | <0.05 |
| FPT (%) | >0.20 | >0.20 | >0.20 | <0.20 | >0.20 | >0.20 | >0.20 | >0.20 | >0.20 | <0.05 |
| PDT | <0.01 | <0.01 | <0.05 | <0.01 | <0.05 | <0.01 | <0.05 | <0.01 | <0.05 | <0.01 |
| Group APD and TD: Shapiro-Wilk test | ||||||||||
| Age | Total | Age: 6 | Age: 7 | Age: 8 | Age: 9 | |||||
| Test | Group APD | Group TD | Group APD | Group TD | Group APD | Group TD | Group APD | Group TD | Group APD | Group TD |
| FPT | 0.000 | 0.001 | 0.000 | 0.160 | 0.000 | 0.094 | 0.105 | 0.418 | 0.006 | 0.020 |
| FPT (%) | 0.000 | 0.004 | 0.000 | 0.160 | 0.000 | 0.094 | 0.105 | 0.418 | 0.006 | 0.020 |
| PDT | 0.000 | 0.000 | 0.000 | 0.009 | 0.002 | 0.000 | 0.001 | 0.003 | 0.000 | 0.000 |
Appendix D
| Age | DDT RE | DDT LE | ASPN-S | FPT |
|---|---|---|---|---|
| 6 | 65% | 45% | SNR 0 dB | 35% |
| 7 | 65% | 50% | SNR −1 dB | 50% |
| 8 | 75% | 60% | SNR −2 dB | 55% |
| 9 | 75% | 60% | SNR −2 dB | 60% |
- − DDT RE, DDT LE, FPT: the value was considered to be normative when the result obtained was higher than the reference value for the age group,
- − ASPN-S: the value was considered to be normative when the result obtained was lower than the reference value for the age group.
References
- ASHA. American Speech-Language—Hearing Association. (Central) Auditory Processing Disorders. 2015. Available online: http://www.ak-aw.de/sites/default/files/2016-12/ASHA_CAPD_2005.pdf (accessed on 15 January 2023).
- Virtala, P.; Talola, S.; Partanen, E.; Kujala, T. Poor neural and perceptual phoneme discrimination during acoustic variation in dyslexia. Sci. Rep. 2020, 10, 8646. [Google Scholar] [CrossRef]
- Grube, M.; Cooper, F.E.; Griffiths, T.D. Auditory temporal-regularity processing correlates with language and literacy skill in early adulthood. Cogn. Neurosci. 2013, 4, 225–230. [Google Scholar] [CrossRef] [PubMed] [Green Version]
- Attoni, T.M.; Quintas, V.G.; Mota, H.B. Evaluation of auditory processing and phonemic discrimination in children with normal and disordered phonological development. Braz. J. Otorhinolaryngol. 2010, 76, 762–768. [Google Scholar] [CrossRef] [PubMed] [Green Version]
- Oliveira, K.L.C.; Costa, R.C.C. Phonemic discrimination and its relation to phonological disorder. Rev. CEFAC 2012, 14, 1209–1214. [Google Scholar] [CrossRef] [Green Version]
- Banai, K.; Kraus, N. Neurobiology of (central) auditory processing disorder and language-based learning disability. In Handbook of Central Auditory Processing Disorder: Volume I: Auditory Neuroscience and Diagnosis; Chermak, G.D., Musiek, F.E., Eds.; Plural Publishing Inc.: San Diego, CA, USA, 2006; pp. 89–116. [Google Scholar]
- Hazan, V.; Barrett, S. The development of phonemic categorization in children aged 6–12. J. Phon. 2000, 28, 377–396. [Google Scholar] [CrossRef] [Green Version]
- Kuhl, P. Cracking the speech code: How infants learn language. Acoust. Sci. Technol. 2007, 28, 71–83. [Google Scholar] [CrossRef] [Green Version]
- Kurkowski, Z.M. Audiogenne Uwarunkowania Zaburzeń Komunikacji Językowej; Wydawnictwo UMCS: Lublin, Poland, 2013; ISBN 978-83-7784-396-3. [Google Scholar]
- Rocławski, B. Słuch Fonemowy i Fonetyczny. Teoria i Praktyka, 4th ed.; Wydawnictwo Glottispol: Gdańsk, Poland, 2010; ISBN 978-83-86804-66-5. [Google Scholar]
- Rota-Donahue, C. Neurophysiological bases of frequency discrimination in children with Auditory Processing Disorder or Specific Language Impairment. CUNY Academic Works. 2014. Available online: https://academicworks.cuny.edu/gc_etds/102 (accessed on 14 March 2023).
- Guzzetta, F.; Conti, G.; Mercuri, E. Auditory processing in infancy: Do early abnormalities predict disorders of language and cognitive development? Dev. Med. Child Neurol. 2011, 53, 1085–1090. [Google Scholar] [CrossRef] [PubMed]
- Szpilman, M.; Morawski, K.; Lewandowska, I.; Jerzak, K.; Sosnowska-Wieczorek, I. Ocena słuchu fonemowego u dzieci jedno- i dwujęzycznych w wieku przedszkolnym. Otolaryngologia 2016, 15, 77–87. Available online: https://scholar.google.com/scholar?hl=en&as_sdt=0%2C5&q=Szpilman%2C+M.%3B+Morawski%2C+K.%3B+Lewandowska+I.%3B+Jerzak%2C+K.%3B+Sosnowska-Wieczorek%2C+I.+Ocena+słuchu+fonemowego+u+dzieci+jedno-+i+dwujęzycznych+w+wieku+przedszkolnym.+Otolaryngologia+2016%2C+ (accessed on 15 March 2023).
- Hearnshaw, S.; Baker, E.; Munro, N. Speech Perception Skills of Children With Speech Sound Disorders: A Systematic Review and Meta-Analysis. J. Speech Lang Hear. Res. 2019, 62, 3771–3789. [Google Scholar] [CrossRef] [PubMed]
- Freitas, C.R.; Mezzomo, C.L.; Vidor, D.C. Phonemic discrimination and the relationship with other linguistic levels in children with typical phonological development and phonological disorder. Codas 2015, 27, 236–241. [Google Scholar] [CrossRef] [PubMed] [Green Version]
- Bellis, T.J. When the Brain Can’t Hear: Unraveling the Mystery of Auditory Processing Disorder, 1st ed.; Atria Books: New York, NY, USA, 2002; ISBN 978-0-7434-2863-7. [Google Scholar]
- British Society of Audiology. Position Statement and Practice Guidance for Auditory Processing Disorder. 2018. Available online: https://www.thebsa.org.uk/wp-content/uploads/2018/02/Position-Statement-and-Practice-Guidance-APD-2018.pdf (accessed on 15 January 2023).
- AAA. Clinical Practice Guidelines: Diagnosis, Treatment and Management of Children and Adults with Central Auditory Processing Disorder. 24 August 2010. Available online: https://audiology-web.s3.amazonaws.com/migrated/CAPD%20Guidelines%208-2010.pdf_539952af956c79.73897613.pdf (accessed on 15 January 2023).
- Katz, J. The Buffalo CAPD Model: The Importance of Phonemes in Evaluation and Remediation. J. Phon. Audiol. 2016, 2, 111. [Google Scholar] [CrossRef] [Green Version]
- Rouillon, I.; de Lamaze, A.; Ribot, M.; Collet, G.; de Bollardière, T.; Elmir, R.; Parodi, M.; Achard, S.; Denoyelle, F.; Loundon, N. Auditory processing disorder in children: The value of a multidisciplinary assessment. Eur. Arch. Otorhinolaryngol. 2021, 278, 4749–4756. [Google Scholar] [CrossRef]
- Stollman, M.H.; van Velzen, E.C.; Simkens, H.M.; Snik, A.F.; van den Broek, P. Development of auditory processing in 6-12-year-old children: A longitudinal study. Int. J. Audiol. 2004, 43, 34–44. [Google Scholar] [CrossRef] [PubMed]
- Neijenhuis, K.; Snik, A.; Priester, G.; van Kordenoordt, S.; van den Broek, P. Age effects and normative data on a Dutch test battery for auditory processing disorders. Int. J. Audiol. 2002, 41, 334–346. [Google Scholar] [CrossRef]
- Jerger, J. Clinical experience with impedance audiometry. Arch. Otolaryngol. 1970, 92, 311–324. [Google Scholar] [CrossRef] [PubMed]
- Guzek, A.; Iwanicka-Pronicka, K. Analysis of the auditory processing skills in 1012 children aged 6-9 confirms the adequacy of APD testing in 6-year-olds. PLoS ONE 2022, 17, e0272723. [Google Scholar] [CrossRef]
- Krasowicz-Kupis, G.; Wiejak, K.; Bogdanowicz, K.M. Bateria Testów Fonologicznych BTF IBE. Podręcznik; Instytut Badań Edukacyjnych: Warszawa, Poland, 2015; ISBN 978-83-65115-2. [Google Scholar]
- Rovetta, A. Raiders of the Lost Correlation: A Guide on Using Pearson and Spearman Coefficients to Detect Hidden Correlations in Medical Sciences. Cureus 2020, 12, e11794. [Google Scholar] [CrossRef] [PubMed]
- Akoglu, H. User’s guide to correlation coefficients. Turk. J. Emerg. Med. 2018, 18, 91–93. [Google Scholar] [CrossRef] [PubMed]
- Grube, M.; Kumar, S.; Cooper, F.E.; Turton, S.; Griffiths, T.D. Auditory sequence analysis and phonological skill. Proc. Biol. Sci. 2012, 279, 4496–4504. [Google Scholar] [CrossRef]
- Quintas, V.G.; Attoni, T.M.; Keske-Soares, M.; Mezzomo, C.L. Auditory processing in children with normal and disordered speech. Braz. J. Otorhinolaryngol. 2010, 76, 718–722. [Google Scholar] [CrossRef] [Green Version]
- Origlia, A.; Rodà, A.; Zmarich, C.; Cosi, P.; Nigris, S.; Colavolpe, B.; Brai, I. Gamified discrimination tests for speech therapy applications. In Il Parlato Nel Contesto Naturale [Speech in the Natural Context]; AISV: Milano, Italy, 2018; pp. 195–216. [Google Scholar] [CrossRef]
- Tamashige, E.; Nishizawa, N.; Itoda, H.; Kasai, S.; Igawa, H.H.; Fukuda, S. Development of phonemic distinction in Japanese preschool children. Folia. Phoniatr. Logop. 2008, 60, 318–322. [Google Scholar] [CrossRef] [PubMed]
- Feng, Y.; Peng, G. Development of categorical speech perception in Mandarin-speaking children and adolescents. Child Dev. 2023, 94, 28–43. [Google Scholar] [CrossRef] [PubMed]
- Edwards, J.; Fox, R.A.; Rogers, C.L. Final consonant discrimination in children: Effects of phonological disorder, vocabulary size, and articulatory accuracy. J. Speech Lang Hear. Res. 2002, 45, 231–242. [Google Scholar] [CrossRef] [PubMed]
- Neijenhuis, C.A.M.; Crul, T.; Maassen, B.; Groenen, P. Validation of a central auditory speech perception test for children. In Pathologies of Speech and Language; Advances in Clinical Phonetics and Linguistics; Maassen, B., Groenen, P., Eds.; Whurr: London, UK, 1999; pp. 151–156. [Google Scholar]
- Cheyney, M.N.; Moncrieff, D.W. A Nonsense Consonant-Vowel-Consonant Word Test to Assess Auditory Processing. J. Am. Acad. Audiol. 2018, 29, 675–684. [Google Scholar] [CrossRef]
- Kurkowska, E. Centralne Procesy Przetwarzania Słuchowego u Dzieci z Zaburzeniami Mowy w Wieku Szkolnym. Ph.D. Thesis, Medical University of Lublin (UML), Lublin, Poland, 2019. Available online: https://ppm.edu.pl/info/phd/UML2bcdd21f43e7470ba06a0bf0fa279839/ (accessed on 15 January 2023).
- Meteyard, L.; Davies, R. Best practice guidance for linear mixed-effects models in psychological science. J. Mem. Lang. 2020, 112, 104092. [Google Scholar] [CrossRef] [Green Version]
- Ahmmed, A.U.; Clarke, E.M.; Adams, C. Mismatch negativity and frequency representational width in children with specific language impairment. Dev. Med. Child Neurol. 2008, 50, 938–944. [Google Scholar] [CrossRef]
- Hill, P.R.; Hogben, J.H.; Bishop, D.M.V. Auditory frequency discrimination in children with specific language impairment: A longitudinal study. J. Speech Lang. Hear. Res. 2005, 48, 1136–1146. [Google Scholar] [CrossRef] [Green Version]
- McArthur, G.M.; Bishop, D.V. Speech and non-speech processing in people with specific language impairment: A behavioural and electrophysiological study. Brain Lang 2005, 94, 260–273. [Google Scholar] [CrossRef]
- Nickisch, A.; Massinger, C. Auditory processing in children with specific language impairments: Are there deficits in frequency discrimination, temporal auditory processing or general auditory processing? Folia Phoniat. Logop. 2009, 6, 323–328. [Google Scholar] [CrossRef] [Green Version]
- Rinker, T.; Kohls, G.; Richter, C.; Maas, V.; Schulz, E.; Schecker, M. Abnormal frequency discrimination in children with SLI as indexed by mismatch negativity (MMN). Neurosci. Lett. 2007, 413, 99–104. [Google Scholar] [CrossRef]
- Rota-Donahue, C.; Schwartz, R.G.; Shafer, V.; Sussman, E.S. Perception of small frequency differences in children with auditory processing disorder or specific language impairment. J. Am. Acad. Audiol. 2016, 27, 489–497. [Google Scholar] [CrossRef] [PubMed] [Green Version]
- Uwer, R.; Albrecht, R.; von Suchodoletz, W. Automatic processing of tones and speech stimuli in children with specific language impairment. Dev. Med. Child. Neurol. 2002, 44, 527–532. [Google Scholar] [CrossRef] [PubMed]
- Senderski, A.; Iwanicka-Pronicka, K.; Majak, J.; Walkowiak, M.; Dajos, K. Wartości normatywne przesiewowych testów wyższych funkcji słuchowych platformy diagnostyczno-terapeutycznej APD-Medical. Otolaryngologia 2016, 15, 99–106. Available online: https://scholar.google.com/scholar?hl=en&as_sdt=0%2C5&q=Senderski%2C+A.%3B+Iwanicka-Pronicka%2C+K.%3B+Majak%2C+J.%3B+Walkowiak%2C+M.%3B+Dajos%2C+K.+Wartości+normatywne+przesiewowych+testów+wyższych+funkcji+słuchowych+platformy+diagnostyczno-+terapeutyczne (accessed on 15 March 2023).
- Senderski, A.; Iwanicka-Pronicka, K.; Majak, J.; Walkowiak, M.; Dajos-Krawczyńska, K. Wartości normatywne przesiewowych adaptacyjnych testów dyskryminacji częstotliwość dźwięków i rozdzielczości czasowej układu słuchowego. Otolaryngologia 2017, 16, 109–118. Available online: https://scholar.google.com/scholar?hl=en&as_sdt=0%2C5&q=Senderski%2C+A.%3B+Iwanicka-Pronicka%2C+K.%3B+Majak%2C+J.%3B+Walkowiak%2C+M.%3B+Dajos-Krawczyńska%2C+K.+Wartości+normatywne+przesiewowych+adaptacyjnych+testów+dyskryminacji+częstotliwość+dźwięków+i+r (accessed on 15 March 2023).


| Group | APD | TD | |||||
|---|---|---|---|---|---|---|---|
| Age (Years) | Females | Males | Total | Females | Males | Total | |
| 6 | 20 (34%) | 39 (66%) | 59 | 9 (26%) | 25 (74%) | 34 | |
| 7 | 17 (31%) | 37 (69%) | 54 | 15 (38%) | 24 (62%) | 39 | |
| 8 | 14 (27%) | 38 (73%) | 52 | 7 (22%) | 25 (78%) | 32 | |
| 9 | 18 (33%) | 37 (67%) | 55 | 20 (49%) | 21 (51%) | 41 | |
| Total | 69 (31%) | 151 (69%) | 220 | 51 (35%) | 95 (65%) | 146 | |
| Correlation Coefficient Value | Dependence Interpretation |
|---|---|
| below 0.3 | poor |
| 0.3–0.5 | fair |
| 0.6–0.8 | moderately strong |
| min. 0.8 | very strong |
| FPT Results (%) | |||||||||||
|---|---|---|---|---|---|---|---|---|---|---|---|
| N | Mean (SD) | Median | Min | Max | |||||||
| Group | APD | TD | APD | TD | APD | TD | APD | TD | APD | TD | |
| Age | |||||||||||
| 6 | 59 | 34 | 19.32 (19.87) | 42.94 (27.94) | 15 | 40 | 0 | 0 | 80 | 100 | |
| 7 | 54 | 39 | 22.65 (18.49) | 50.77 (26.55) | 20 | 50 | 0 | 10 | 80 | 100 | |
| 8 | 52 | 32 | 25.44 (15.39) | 52.66 (25.34) | 25 | 58 | 0 | 5 | 65 | 100 | |
| 9 | 55 | 41 | 32.64 (20.48) | 53.61 (28.71) | 30 | 60 | 0 | 0 | 85 | 100 | |
| Total | 220 | 146 | 24.91 (19.25) | 50.16 (27.27) | 20 | 50 | 0 | 0 | 85 | 100 | |
| FPT Results (as a Percentage of Age Standard) | |||||||||||
|---|---|---|---|---|---|---|---|---|---|---|---|
| N | Mean (SD) | Median | Min | Max | |||||||
| Group | APD | TD | APD | TD | APD | TD | APD | TD | APD | TD | |
| Age | |||||||||||
| 6 | 59 | 34 | 55 (57) | 123 (80) | 43 | 114 | 0 | 0 | 229 | 286 | |
| 7 | 54 | 39 | 45 (37) | 102 (53) | 40 | 100 | 0 | 20 | 160 | 200 | |
| 8 | 52 | 32 | 46 (28) | 96 (46) | 45 | 105 | 0 | 9 | 118 | 182 | |
| 9 | 55 | 41 | 54 (34) | 89 (48) | 50 | 100 | 0 | 0 | 142 | 167 | |
| Total | 220 | 146 | 50 (41) | 102 (59) | 45 | 100 | 0 | 0 | 229 | 286 | |
| Phoneme Discrimination Test Results | |||||||||||
|---|---|---|---|---|---|---|---|---|---|---|---|
| N | Mean (SD) | Median | Min | Max | |||||||
| Group | APD | TD | APD | TD | APD | TD | APD | TD | APD | TD | |
| Age | |||||||||||
| 6 | 59 | 34 | 18.86 (3.9) | 22.24 (2.5) | 20 | 23 | 7 | 16 | 24 | 25 | |
| 7 | 54 | 39 | 20.59 (3.1) | 22.54 (2.6) | 21 | 23 | 12 | 14 | 25 | 25 | |
| 8 | 52 | 32 | 21.46 (2.5) | 23.16 (1.5) | 22 | 24 | 15 | 19 | 25 | 25 | |
| 9 | 55 | 41 | 21.22 (3.2) | 23.80 (1.3) | 22 | 24 | 11 | 20 | 25 | 25 | |
| Total | 220 | 146 | 20.4 (3.37) | 23 (2.1) | 21 | 24 | 7 | 14 | 25 | 25 | |
| Group | APD | TD |
|---|---|---|
| Significance level | p < 0.000 | p = 0.025 |
| Differences between age groups | 6 and 8-year-olds (p = 0.000) 6 and 9-year-olds (p = 0.000) | 6 and 9-year-olds (p = 0.029) |
| Spearman’s Correlation Coefficient | Pearson’s Correlation Coefficient | ||
|---|---|---|---|
| TD | APD | TD | APD |
| r = 0.27 | r = 0.23 | r = 0.26 p = 0.002 r2 = 0.07 | r = 0.24 p = 0.000 r2 = 0.09 |
| Studies | Sample Size | Age of Participants | Number of Phonemes | Language |
|---|---|---|---|---|
| 1. Attoni, T.M. et al., 2010 [4] | TOTAL: 46 control group: 24 (TD) study group: 22 (with phonological disorders) | 5–7 | 30 | Portuguese |
| 2. Tamashige, E. et al., 2008 [31] | TOTAL: 211 (TD) | 2;6–5;11 | 16 | Japanese |
| 3. Freitas, C.R. et al., 2015 [15] | TOTAL: 36 (including TD and phonological disorders) | 5;3–7;11 | 30 | Portuguese |
| 4. Neijenhuis, K. et al., 2002 [22] | TOTAL: 105 (TD) | 8;6–16;4 | 2 | Dutch |
| 5. Rouillon, I. et al., 2021 [20] | TOTAL: 38 APD: 17 no APD: 17 uncertain diagnosis: 4 | 6–17 (average and median: 9) | 1 | French |
| 6. Guzek, A.; Iwanicka-Pronicka, K. | TOTAL: 366 APD: 220 TD: 146 | 6;0–8;11 | 18 | Polish |
Disclaimer/Publisher’s Note: The statements, opinions and data contained in all publications are solely those of the individual author(s) and contributor(s) and not of MDPI and/or the editor(s). MDPI and/or the editor(s) disclaim responsibility for any injury to people or property resulting from any ideas, methods, instructions or products referred to in the content. |
© 2023 by the authors. Licensee MDPI, Basel, Switzerland. This article is an open access article distributed under the terms and conditions of the Creative Commons Attribution (CC BY) license (https://creativecommons.org/licenses/by/4.0/).
Share and Cite
Guzek, A.; Iwanicka-Pronicka, K. Auditory Discrimination—A Missing Piece of Speech and Language Development: A Study on 6–9-Year-Old Children with Auditory Processing Disorder. Brain Sci. 2023, 13, 606. https://doi.org/10.3390/brainsci13040606
Guzek A, Iwanicka-Pronicka K. Auditory Discrimination—A Missing Piece of Speech and Language Development: A Study on 6–9-Year-Old Children with Auditory Processing Disorder. Brain Sciences. 2023; 13(4):606. https://doi.org/10.3390/brainsci13040606
Chicago/Turabian StyleGuzek, Anna, and Katarzyna Iwanicka-Pronicka. 2023. "Auditory Discrimination—A Missing Piece of Speech and Language Development: A Study on 6–9-Year-Old Children with Auditory Processing Disorder" Brain Sciences 13, no. 4: 606. https://doi.org/10.3390/brainsci13040606