
Derivation and Validation of a New Visceral Adiposity Index for Predicting Short-Term Mortality of Patients with Acute Ischemic Stroke in a Chinese Population
Abstract
:1. Introduction
2. Materials and Methods
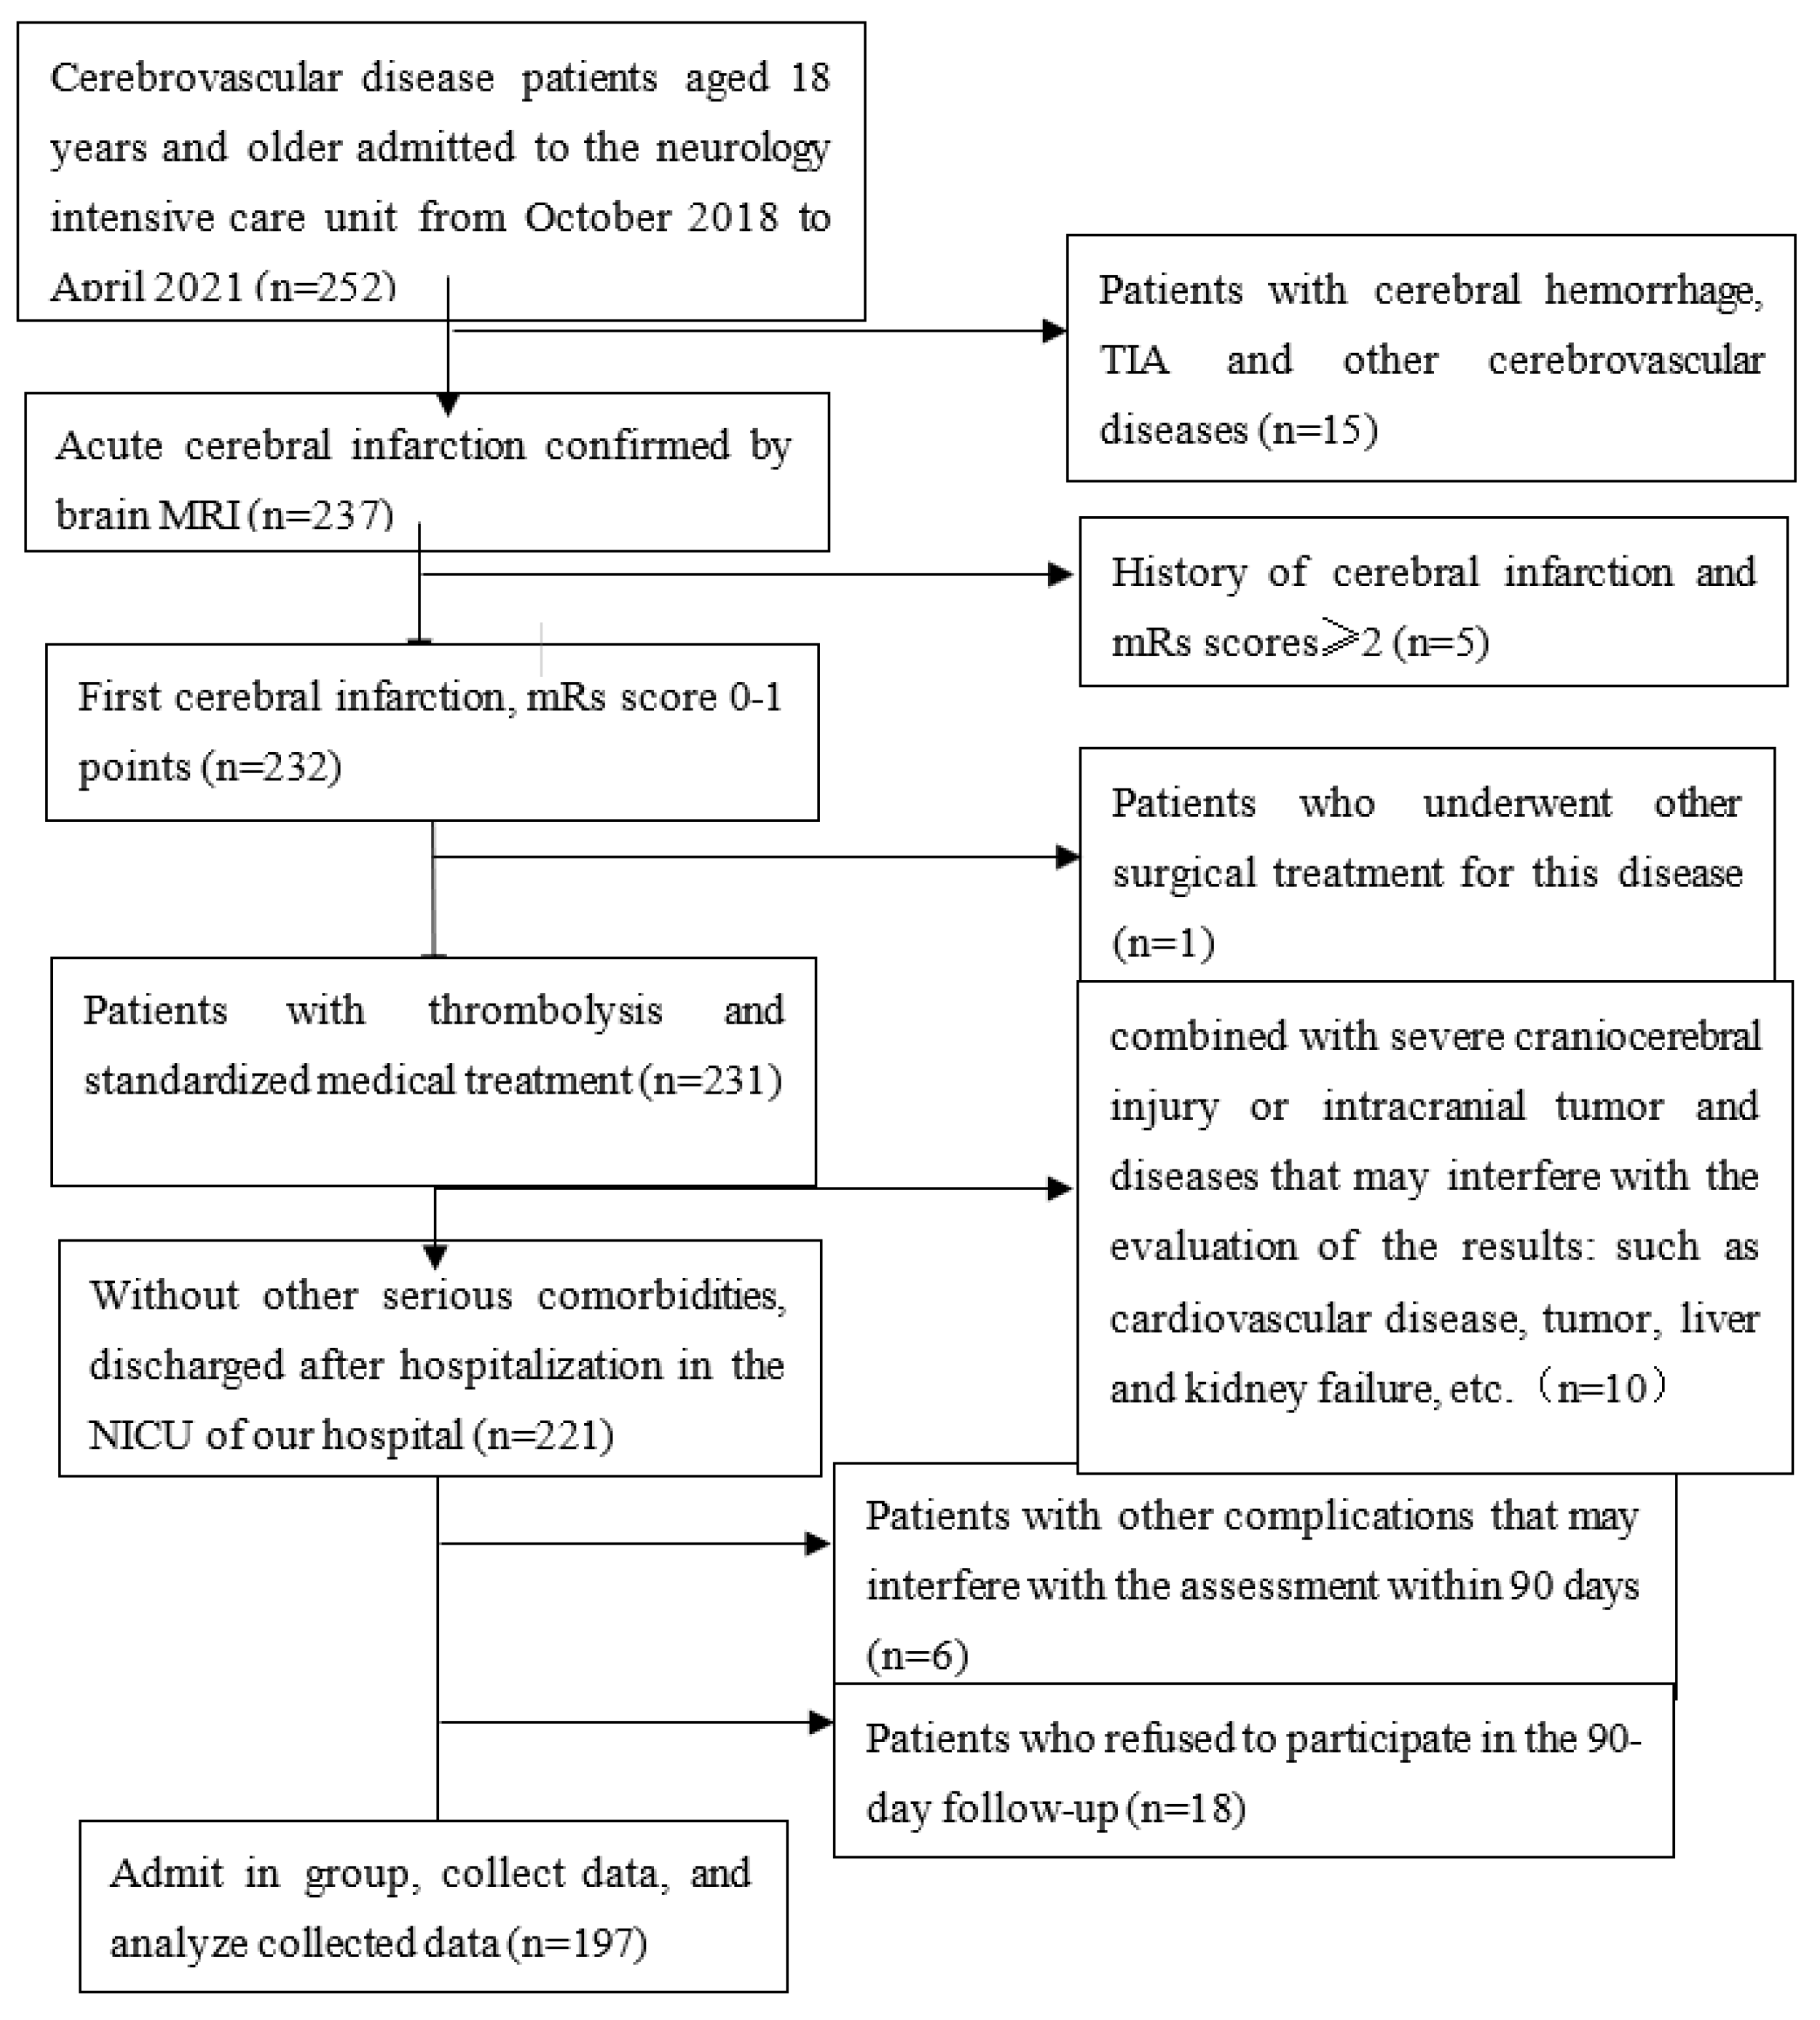
2.1. Participant Enrollment
2.2. Data Collection
2.3. Statistical Analysis
3. Results
4. Discussion
5. Conclusions
Author Contributions
Funding
Institutional Review Board Statement
Informed Consent Statement
Data Availability Statement
Acknowledgments
Conflicts of Interest
References
- Wang, W.; Jiang, B.; Sun, H.; Ru, X.; Sun, D.; Wang, L.; Wang, L.; Jiang, Y.; Li, Y.; Wang, Y.; et al. Prevalence, incidence, and mortality of stroke in China: Results from a nationwide population-based survey of 480,687 adults. Circulation 2017, 135, 759–771. [Google Scholar] [CrossRef] [PubMed]
- Ashtari, F.; Salari, M.; Aminoroaya, A.; Deljoo, B.K.; Moeini, M. Metabolic syndrome in ischemic stroke: A case control study. J. Res. Med. Sci. 2012, 17, 167–170. [Google Scholar] [PubMed]
- Hinnouho, G.M.; Czernichow, S.; Dugravot, A.; Batty, G.D.; Kivimaki, M.; Singh-Manoux, A. Metabolically healthy obesity and risk of mortality: Does the definition of metabolic health matter? Diabetes Care 2013, 36, 2294–2300. [Google Scholar] [CrossRef] [PubMed]
- Randrianarisoa, E.; Lehn-Stefan, A.; Hieronimus, A.; Rietig, R.; Fritsche, A.; Machann, J.; Balletshofer, B.; Häring, H.U.; Stefan, N.; Rittig, K. Visceral adiposity index as an independent marker of subclinical atherosclerosis in individuals prone to diabetes mellitus. J. Atheroscler. Thromb. 2019, 26, 821–834. [Google Scholar] [CrossRef]
- Nam, K.W.; Kwon, H.; Kwon, H.M.; Park, J.H.; Jeong, H.Y.; Kim, S.H.; Jeong, S.M.; Kim, H.J.; Hwang, S.S. Abdominal fatness and cerebral white matter hyperintensity. J. Neurol. Sci. 2019, 404, 52–57. [Google Scholar] [CrossRef]
- Alberti, K.G.; Eckel, R.H.; Grundy, S.M.; Zimmet, P.Z.; Cleeman, J.I.; Donato, K.A.; Fruchart, J.C.; James, W.P.; Loria, C.M.; Smith, S.C.; et al. Harmonizing the metabolic syndrome: A joint interim statement of the International Diabetes Federation Task Force on Epidemiology and Prevention; National Heart, Lung, and Blood Institute; American Heart Association; World Heart Federation; International Atherosclerosis Society; and International Association for the Study of Obesity; National Heart, Lung, and Blood Institute; American Heart Association; World Heart Federation; International Atherosclerosis Society; and International Association for the Study of Obesity. Circulation 2009, 120, 1640–1645. [Google Scholar] [CrossRef]
- Borruel, S.; Moltó, J.F.; Alpañés, M.; Fernández-Durán, E.; Álvarez-Blasco, F.; Luque-Ramírez, M.; Escobar-Morreale, H.F. Surrogate markers of visceral adiposity in young adults: Waist circumference and body mass index are more accurate than waist hip ratio, model of adipose distribution and visceral adiposity index. PLoS ONE 2014, 9, e114112. [Google Scholar] [CrossRef]
- Amato, M.C.; Giordano, C.; Galia, M.; Criscimanna, A.; Vitabile, S.; Midiri, M.; Galluzzo, A.; AlkaMeSy Study Group. Visceral Adiposity Index: A reliable indicator of visceral fat function associated with cardiometabolic risk. Diabetes Care 2010, 33, 920–922. [Google Scholar] [CrossRef]
- Bodenant, M.; Kuulasmaa, K.; Wagner, A.; Kee, F.; Palmieri, L.; Ferrario, M.M.; Montaye, M.; Amouyel, P.; Dallongeville, J.; MORGAM Project. Measures of abdominal adiposity and the risk of stroke: The Monica Risk, Genetics, Archiving and Monograph (MORGAM) study. Stroke 2011, 42, 2872–2877. [Google Scholar] [CrossRef]
- Muuronen, A.T.; Taina, M.; Hedman, M.; Marttila, J.; Kuusisto, J.; Onatsu, J.; Vanninen, R.; Jäkälä, P.; Sipola, P.; Mustonen, P. Increased visceral adipose tissue as a potential risk factor in patients with embolic stroke of undetermined source (ESUS). PLoS ONE 2015, 10, e0120598. [Google Scholar] [CrossRef] [Green Version]
- Amato, M.C.; Giordano, C.; Pitrone, M.; Galluzzo, A. Cut-off points of the visceral adiposity index (VAI) identifying a visceral adipose dysfunction associated with cardiometabolic risk in a Caucasian Sicilian population. Lipids Health Dis. 2011, 10, 183. [Google Scholar] [CrossRef]
- Han, L.; Fu, K.L.; Zhao, J.; Wang, Z.H.; Tang, M.X.; Wang, J.; Wang, H.; Zhang, Y.; Zhang, W.; Zhong, M. Visceral adiposity index score indicated the severity of coronary heart disease in Chinese adults. Diabetol. Metab. Syndr. 2014, 6, 143. [Google Scholar] [CrossRef]
- Park, H.J.; Kim, J.; Park, S.E.; Park, C.Y.; Lee, W.Y.; Oh, K.W.; Park, S.W.; Rhee, E.J. Increased risk of subclinical atherosclerosis associated with high visceral adiposity index in apparently healthy Korean adults: The Kangbuk Samsung Health Study. Ann. Med. 2016, 48, 410–416. [Google Scholar] [CrossRef]
- Li, R.; Li, Q.; Cui, M.; Ying, Z.; Li, L.; Zhong, T.; Huo, Y.; Xie, P. Visceral adiposity index, lipid accumulation product and intracranial atherosclerotic stenosis in middle-aged and elderly Chinese. Sci. Rep. 2017, 7, 7951. [Google Scholar] [CrossRef]
- Dereziński, T.; Zozulińska-Ziółkiewicz, D.; Uruska, A.; Dąbrowski, M. Visceral adiposity index as a useful tool for the assessment of cardiometabolic disease risk in women aged 65 to 74. Diabetes Metab. Res. Rev. 2018, 34, e3052. [Google Scholar] [CrossRef]
- Yu, Y.; Zhang, F.L.; Yan, X.L.; Zhang, P.; Guo, Z.N.; Yang, Y. Visceral adiposity index and cervical arterial atherosclerosis in northeast China: A population based cross-sectional survey. Eur. J. Neurol. 2021, 28, 161–171. [Google Scholar] [CrossRef]
- Nam, K.W.; Kwon, H.M.; Jeong, H.Y.; Park, J.H.; Kwon, H.; Jeong, S.M.; Kim, H.J. Visceral adiposity index is associated with silent brain infarct in a healthy population. Sci. Rep. 2020, 10, 17271. [Google Scholar] [CrossRef]
- Cui, C.; He, C.; Sun, Q.; Xu, Z.; Li, Q.; Yue, S.; Liu, J.; Wang, L.; Wang, H. Association between visceral adiposity index and incident stroke: Data from the China Health and Retirement Longitudinal Study. Nutr. Metab. Cardiovasc. Dis. 2022, 32, 1202–1209. [Google Scholar] [CrossRef]
- Zhao, Y.; Zhang, J.; Chen, C.; Qin, P.; Zhang, M.; Shi, X.; Yang, Y.; Lu, J.; Sun, L.; Hu, D. Comparison of six surrogate insulin resistance indexes for predicting the risk of incident stroke: The Rural Chinese Cohort Study. Diabetes Metab. Res. Rev. 2022, 38, e3567. [Google Scholar] [CrossRef]
- Kim, J.H.; Choi, K.H.; Kang, K.W.; Kim, J.T.; Choi, S.M.; Lee, S.H.; Park, M.S.; Kim, B.C.; Kim, M.K.; Cho, K.H. Impact of visceral adipose tissue on clinical outcomes after acute ischemic stroke. Stroke 2019, 50, 448–454. [Google Scholar] [CrossRef]
- Xia, M.F.; Chen, Y.; Lin, H.D.; Ma, H.; Li, X.M.; Aleteng, Q.; Li, Q.; Wang, D.; Hu, Y.; Pan, B.S.; et al. A indicator of visceral adipose dysfunction to evaluate metabolic health in adult Chinese. Sci. Rep. 2016, 6, 38214. [Google Scholar] [CrossRef] [PubMed]
- Vemmos, K.; Ntaios, G.; Spengos, K.; Savvari, P.; Vemmou, A.; Pappa, T.; Manios, E.; Georgiopoulos, G.; Alevizaki, M. Association between obesity and mortality after acute first-ever stroke: The obesity-stroke paradox. Stroke 2011, 6, 30–36. [Google Scholar] [CrossRef] [PubMed]
- Olsen, T.S.; Dehlendorff, C.; Petersen, H.G.; Andersen, K.K. Body mass index and poststroke mortality. Neuroepidemiology 2008, 30, 93–100. [Google Scholar] [CrossRef] [PubMed]
- Bell, C.L.; LaCroix, A.; Masaki, K.; Hade, E.M.; Manini, T.; Mysiw, W.J.; Curb, J.D.; Wassertheil-Smoller, S. Prestroke factors associated with poststroke mortality and recovery in older women in the Women’s Health Initiative. J. Am. Geriatr. Soc. 2013, 61, 1324–1330. [Google Scholar] [CrossRef] [PubMed]
- Dehlendorff, C.; Andersen, K.K.; Olsen, T.S. Body mass index and death by stroke: No obesity paradox. JAMA Neurol. 2014, 71, 978–984. [Google Scholar] [CrossRef]
- Forlivesi, S.; Cappellari, M.; Bonetti, B. Obesity paradox and stroke: A narrative review. Eat. Weight Disord. 2021, 26, 417–423. [Google Scholar] [CrossRef]
- Wang, L.; Yi, Z. Obesity paradox and aging: Visceral Adiposity Index and all-cause mortality in older individuals: A prospective cohort study. Front. Endocrinol. 2022, 13, 975209. [Google Scholar] [CrossRef]
- Han, B.; Han, K.; Yoon, K.; Kim, M.K.; Lee, S. Impact of Mean and Variability of High-Density Lipoprotein-Cholesterol on the Risk of Myocardial Infarction, Stroke, and Mortality in the General Population. J. Am. Heart Assoc. 2020, 9, e015493. [Google Scholar] [CrossRef]
- Tziomalos, K.; Giampatzis, V.; Bouziana, S.D.; Spanou, M.; Kostaki, S.; Papadopoulou, M.; Angelopoulou, S.-M.; Tsopozidi, M.; Savopoulos, C.; Hatzitolios, A.I. Prognostic significance of major lipids in patients with acute ischemic stroke. Metab. Brain Dis. 2017, 32, 395–400. [Google Scholar] [CrossRef]
- Li, W.; Liu, M.; Wu, B.; Liu, H.; Wang, L.C.; Tan, S. Serum lipid levels and 3-month prognosis in Chinese patients with acute stroke. Adv. Ther. 2008, 25, 329–341. [Google Scholar] [CrossRef]
- Penson, P.E.; Long, D.L.; Howard, G.; Toth, P.P.; Muntner, P.; Howard, V.J.; Safford, M.M.; Jones, S.R.; Martin, S.S.; Mazidi, M.; et al. Associations between very low concentrations of low density lipoprotein cholesterol, high sensitivity C-reactive protein, and health outcomes in the Reasons for Geographical and Racial Differences in Stroke (REGARDS) study. Eur. Heart J. 2018, 39, 3641–3653. [Google Scholar] [CrossRef]
- Zhang, F.; Liu, L.; Zhang, C.; Ji, S.; Mei, Z.; Li, T. Association of metabolic syndrome and its components with risk of stroke recurrence and mortality: A meta-analysis. Neurology 2021, 97, e695–e705. [Google Scholar] [CrossRef]
- Gattringer, T.; Posekany, A.; Niederkorn, K.; Knoflach, M.; Poltrum, B.; Mutzenbach, S.; Haring, H.P.; Ferrari, J.; Lang, W.; Willeit, J.; et al. Predicting early mortality of acute ischemic stroke. Stroke 2019, 50, 349–356. [Google Scholar] [CrossRef]
- Adams, H.P., Jr.; Davis, P.H.; Leira, E.C.; Chang, K.C.; Bendixen, B.H.; Clarke, W.R.; Woolson, R.F.; Hansen, M.D. Baseline NIH Stroke Scale score strongly predicts outcome after stroke: A report of the Trial of Org 10172 in Acute Stroke Treatment (TOAST). Neurology 1999, 53, 126–131. [Google Scholar] [CrossRef]
- Karnes, J.H.; Arora, A.; Feng, J.; Steiner, H.E.; Sulieman, L.; Boerwinkle, E.; Clark, C.; Cicek, M.; Cohn, E.; Gebo, K.; et al. Racial, ethnic, and gender differences in obesity and body fat distribution: An All of US Research Program demonstration project. PLoS ONE 2021, 16, e0255583. [Google Scholar] [CrossRef]
- Iceta, S.; Dadar, M.; Daoust, J.; Scovronec, A.; Leblanc, V.; Pelletier, M.; Biertho, L.; Tchernof, A.; Bégin, C.; Michaud, A. Association between visceral adiposity index, binge eating behavior, and grey matter density in caudal anterior cingulate cortex in severe obesity. Brain Sci. 2021, 11, 1158. [Google Scholar] [CrossRef]
- Yamashiro, K.; Tanaka, R.; Tanaka, Y.; Miyamoto, N.; Shimada, Y.; Ueno, Y.; Urabe, T.; Hattori, N. Visceral fat accumulation is associated with cerebral small vessel disease. Eur. J. Neurol. 2014, 21, 667–673. [Google Scholar] [CrossRef]
- Al-Kuraishy, H.M.; Al-Gareeb, A.I.; Alsayegh, A.A.; Hakami, Z.H.; Khamjan, N.A.; Saad, H.M.; Batiha, G.E.; De Waard, M. A potential link between visceral obesity and risk of Alzheimer’s disease. Neurochem. Res. 2022, 10, 1007. [Google Scholar] [CrossRef]
- Isaac, V.; Sim, S.; Zheng, H.; Zagorodnov, V.; Tai, E.S.; Chee, M. Adverse associations between visceral adiposity, brain structure, and cognitive performance in healthy elderly. Front. Aging Neurosci. 2011, 3, 12. [Google Scholar] [CrossRef]
- Celik, E.; Kizildag Yirgin, I.; Goksever Celik, H.; Engin, G.; Sozen, H.; Ak, N.; Saip, P.; Onder, S.; Topuz, S.; Salihoglu, M.Y. Does visceral adiposity have an effect on the survival outcomes of the patients with endometrial cancer? J. Obstet. Gynaecol. Res. 2021, 47, 560–569. [Google Scholar] [CrossRef]
- Fujiwara, N.; Nakagawa, H.; Kudo, Y.; Tateishi, R.; Taguri, M.; Watadani, T.; Nakagomi, R.; Kondo, M.; Nakatsuka, T.; Minami, T.; et al. Sarcopenia, intramuscular fat deposition, and visceral adiposity independently predict the outcomes of hepatocellular carcinoma. J. Hepatol. 2015, 63, 131–140. [Google Scholar] [CrossRef] [PubMed]
- Pranata, R.; Lim, M.A.; Huang, I.; Yonas, E.; Henrina, J.; Vania, R.; Lukito, A.A.; Nasution, S.A.; Alwi, I.; Siswanto, B.B. Visceral adiposity, subcutaneous adiposity, and severe coronavirus disease-2019 (COVID-19): Systematic review and meta-analysis. Clin. Nutr. ESPEN. 2021, 43, 163–168. [Google Scholar] [CrossRef] [PubMed]
- Okumura, S.; Kaido, T.; Hamaguchi, Y.; Kobayashi, A.; Shirai, H.; Yao, S.; Yagi, S.; Kamo, N.; Hatano, E.; Okajima, H.; et al. Visceral adiposity and sarcopenic visceral obesity are associated with poor prognosis after resection of pancreatic cancer. Ann. Surg. Oncol. 2017, 24, 3732–3740. [Google Scholar] [CrossRef] [PubMed]
- Zhao, Q.; Cheng, Y.-J.; Xu, Y.-K.; Zhao, Z.-W.; Liu, C.; Sun, T.-N.; Zhou, Y.-J. Visceral Adiposity Index Plays an Important Role in Prognostic Prediction in Patients with Non-ST-Segment Elevation Acute Coronary Syndrome and Type 2 Diabetes Mellitus Undergoing Percutaneous Coronary Intervention. Front. Cardiovasc. Med. 2021, 8, 735637. [Google Scholar] [CrossRef]
- Yan, L.-J.; Zeng, Y.-R.; Ma, R.C.-S.; Zheng, Y. J-shaped association between the visceral adiposity index and all-cause mortality in patients with chronic kidney disease. Nutrition 2022, 103–104, 111832. [Google Scholar] [CrossRef]
- Zhang, Y.; He, Q.; Zhang, W.; Xiong, Y.; Shen, S.; Yang, J.; Ye, M. Non-linear Associations between Visceral Adiposity Index and Cardiovascular and Cerebrovascular Diseases: Results From the NHANES (1999–2018). Front. Cardiovasc. Med. 2022, 9, 908020. [Google Scholar] [CrossRef]
- Serhat Tokgoz, O.; Guney, F.; Kaya, A.; Bugrul, A.; Eruyar, E.; Buyukgol, H.; Seyithanoglu, A.; Sinan Iyisoy, M. Acute-phase stroke outcome and lipids. Med. Bull. Sisli Etfal Hosp. 2021, 55, 538–544. [Google Scholar] [CrossRef]
- Deng, Q.; Li, S.; Zhang, H.; Wang, H.; Gu, Z.; Zuo, L.; Wang, L.; Yan, F. Association of serum lipids with clinical outcome in acute ischaemic stroke: A systematic review and meta-analysis. J. Clin. Neurosci. 2019, 59, 236–244. [Google Scholar] [CrossRef]
- Chen, L.; Xu, J.; Sun, H.; Wu, H.; Zhang, J. The total cholesterol to high-density lipoprotein cholesterol as a predictor of poor outcomes in a Chinese population with acute ischaemic stroke. J. Clin. Lab. Anal. 2017, 31, e22139. [Google Scholar] [CrossRef]
- de Heredia, F.P.; Gómez-Martínez, S.; Marcos, A. Obesity, inflammation and the immune system. Proc. Nutr. Soc. 2012, 71, 332–338. [Google Scholar] [CrossRef] [Green Version]
- Tchernof, A.; Després, J.P. Pathophysiology of human visceral obesity: An update. Physiol. Rev. 2013, 93, 359–404. [Google Scholar] [CrossRef]
- Yang, C.; Hawkins, K.E.; Doré, S.; Candelario-Jalil, E. Neuroinflammatory mechanisms of blood-brain barrier damage in ischemic stroke. Am. J. Physiol. Cell Physiol. 2019, 316, C135–C153. [Google Scholar] [CrossRef]
- Ramiro, L.; Simats, A.; García-Berrocoso, T.; Montaner, J. Inflammatory molecules might become both biomarkers and therapeutic targets for stroke management. Ther. Adv. Neurol. Disord. 2018, 11, 1756286418789340. [Google Scholar] [CrossRef]
- Rodríguez-Yáñez, M.; Castillo, J. Role of inflammatory markers in brain ischemia. Curr. Opin. Neurol. 2008, 21, 353–357. [Google Scholar] [CrossRef]
- Wilkins, H.M.; Swerdlow, R.H. TNFα in cerebral ischemia: Another stroke against you? J. Neurochem. 2015, 132, 369–372. [Google Scholar] [CrossRef]
- Bokhari, F.A.; Shakoori, T.A.; Butt, A.; Ghafoor, F. TNF-alpha: A risk factor for ischemic stroke. J. Ayub Med. Coll. Abbottabad 2014, 26, 111–114. [Google Scholar]
- Fahmi, R.M.; Elsaid, A.F. Infarction size, interleukin-6, and their interaction are predictors of short-term stroke outcome in young Egyptian adults. J. Stroke Cerebrovasc. Dis. 2016, 25, 2475–2481. [Google Scholar] [CrossRef]
- Brough, D.; Tyrrell, P.J.; Allan, S.M. Regulation of interleukin-1 in acute brain injury. Trends Pharmacol. Sci. 2011, 32, 617–622. [Google Scholar] [CrossRef]
- Murray, K.N.; Parry-Jones, A.R.; Allan, S.M. Interleukin-1 and acute brain injury. Front. Cell. Neurosci. 2015, 9, 18. [Google Scholar] [CrossRef]
- Suárez-Cuenca, J.A.; Ruíz-Hernández, A.S.; Mendoza-Castañeda, A.A.; Domínguez-Pérez, G.A.; Hernández-Patricio, A.; Vera-Gómez, E.; De la Peña-Sosa, G.; Banderas-Lares, D.Z.; Montoya-Ramírez, J.; Blas-Azotla, R.; et al. Neutrophil-to-lymphocyte ratio and its relation with pro-inflammatory mediators, visceral adiposity and carotid intima-media thickness in population with obesity. Eur. J. Clin. Investig. 2019, 49, e13085. [Google Scholar] [CrossRef]
- Park, H.S.; Park, J.Y.; Yu, R. Relationship of obesity and visceral adiposity with serum concentrations of CRP, TNF-alpha and IL-6. Diabetes Res. Clin. Pract. 2005, 69, 29–35. [Google Scholar] [CrossRef] [PubMed]
- Hou, D.; Wang, C.; Ye, X.; Zhong, P.; Wu, D. Persistent inflammation worsens short-term outcomes in massive stroke patients. BMC Neurol. 2021, 21, 62. [Google Scholar] [CrossRef] [PubMed]
- Vizzuso, S.; Del Torto, A.; Dilillo, D.; Calcaterra, V.; Di Profio, E.; Leone, A.; Gilardini, L.; Bertoli, S.; Battezzati, A.; Zuccotti, G.V.; et al. Visceral adiposity index (VAI) in children and adolescents with obesity: No association with daily energy intake but promising tool to identify metabolic syndrome (MetS). Nutrients 2021, 13, 413. [Google Scholar] [CrossRef] [PubMed]
- Jung, J.Y.; Ryoo, J.H.; Oh, C.M.; Choi, J.M.; Chung, P.W.; Hong, H.P.; Park, S.K. Visceral adiposity index and longitudinal risk of incident metabolic syndrome: Korean genome and epidemiology study (KoGES). Endocr. J. 2020, 67, 45–52. [Google Scholar] [CrossRef]
- López-González, A.A.; Jover, A.M.; Martínez, C.S.; Artal, P.M.; Bote, S.A.; Jané, B.A.; Ramírez-Manent, J.I. The CUN-BAE, Deurenberg Fat Mass, and visceral adiposity index as confident anthropometric indices for early detection of metabolic syndrome components in adults. Sci. Rep. 2022, 12, 15486. [Google Scholar] [CrossRef] [PubMed]
- Norrving, B. Long-term prognosis after lacunar infarction. Lancet Neurol. 2003, 2, 238–245. [Google Scholar] [CrossRef]
- Rudilosso, S.; Rodríguez-Vázquez, A.; Urra, X.; Arboix, A. The Potential Impact of Neuroimaging and Translational Research on the Clinical Management of Lacunar Stroke. Int. J. Mol. Sci. 2022, 23, 1497. [Google Scholar] [CrossRef]
- Li, B.; Lai, X.; Yan, C.; Jia, X.; Li, Y. The associations between neutrophil-to-lymphocyte ratio and the Chinese Visceral Adiposity Index, and carotid atherosclerosis and atherosclerotic cardiovascular disease risk. Exp. Gerontol. 2020, 139, 111019. [Google Scholar] [CrossRef]


| Characteristics | Men | Women | ||||||
|---|---|---|---|---|---|---|---|---|
| VAI Tertiles1 (<1.12) | 2 (1.12–1.90) | 3 (>1.90) | p-Value | VAI Tertiles1 (<1.55) | 2 (1.55–2.40) | 3 (>2.40) | p-Value | |
| Number | 41 | 41 | 40 | 25 | 25 | 25 | ||
| Age (years) | 70.73 ± 9.86 | 70.98 ± 12.71 | 72.15 ± 16.31 | 0.875 | 74.12 ± 10.50 | 65.88 ± 13.87 | 71.64 ± 11.25 | 0.05 |
| WC (cm) | 75.85 ± 7.61 | 78.37 ± 8.01 | 77.86 ± 9.16 | 0.351 | 71.20 ± 9.82 | 78.04 ± 11.37 | 80.80 ± 10.41 | 0.006 * |
| BMI (m/kg2) | 22.25 ± 3.21 | 23.25 ± 3.23 | 23.43 ± 3.08 | 0.201 | 23.85 ± 4.50 | 23.34 ± 4.23 | 21.71 ± 3.78 | 0.174 |
| BFMI | 6.76 ± 2.15 | 7.49 ± 2.56 | 7.62 ± 1.86 | 0.171 | 10.22 ± 2.74 | 9.78 ± 2.48 | 8.06 ± 2.14 | 0.007 * |
| Hypertension, n (%) | 31 (75.6%) | 31 (75.6%) | 30 (75.0%) | 0.997 | 20 (80.0%) | 20 (80.0%) | 14 (56.0%) | 0.092 |
| DM, n (%) | 10 (24.4%) | 14 (34.1%) | 15 (37.5%) | 0.420 | 5 (20.0%) | 5 (20.0%) | 12 (48.0%) | 0.043 * |
| AF, n (%) | 12 (29.3%) | 6 (14.6%) | 5 (12.5%) | 0.129 | 6 (24.0%) | 9 (36.0%) | 4 (16.0%) | 0.262 |
| CHD, n (%) | 6 (14.6%) | 5 (12.2%) | 3 (7.5%) | 0.540 | 2 (8.0%) | 2 (8.0%) | 2 (8.0%) | 0.571 |
| Smoker, n (%) | 6 (14.6%) | 5 (12.2%) | 7 (17.5%) | 0.569 | 0 (0%) | 0 (0%) | 0 (0%) | - |
| NIH Stroke Scale | 13.66 ± 6.98 | 13.90 ± 9.05 | 10.33 ± 7.71 | 0.083 | 13.80 ± 7.12 | 15.32 ± 9.91 | 12.96 ± 4.94 | 0.541 |
| Systolic Blood Pressure (mmHg) | 154.41 ± 18.12 | 144.07 ± 20.53 | 143.45 ± 20.12 | 0.020 * | 146.20 ± 22.04 | 146.92 ± 24.50 | 143.04 ± 24.56 | 0.827 |
| Diastolic Blood Pressure (mmHg) | 82.39 ± 15.00 | 81.83 ± 12.24 | 80.25 ± 15.31 | 0.783 | 79.84 ± 12.62 | 79.80 ± 9.38 | 76.88 ± 11.93 | 0.577 |
| HDL-C (mmol/L) | 1.23 ± 0.28 | 0.92 ± 0.21 | 0.76 ± 0.18 | 0.000 ** | 1.30 ± 0.28 | 1.00 ± 1.46 | 0.90 ± 0.18 | 0.000 ** |
| LDL-C (mmol/L) | 2.30 ± 0.82 | 3.00 ± 1.34 | 2.73 ± 1.14 | 0.021 * | 2.34 ± 0.79 | 3.00 ± 1.03 | 2.73 ± 0.91 | 0.043 * |
| Triglyceride (mmol/L) | 0.84 ± 0.20 | 1.13 ± 0.23 | 1.75 ± 0.51 | 0.000 ** | 0.88 ± 0.20 | 1.14 ± 0.25 | 1.64 ± 0.48 | 0.000 ** |
| Total Cholesterol (mmol/L) | 3.93 ± 1.00 | 4.42 ± 1.44 | 4.21 ± 1.35 | 0.232 | 4.17 ± 0.95 | 4.49 ± 1.02 | 4.36 ± 1.22 | 0.576 |
| Creatinine (μmol/L) | 104.66 ± 55.26 | 72.94 ± 29.32 | 73.07 ± 29.01 | 0.212 | 62.40 ± 24.68 | 69.62 ± 37.32 | 60.58 ± 20.90 | 0.499 |
| Uric Acid (μmol/L) | 312.02 ± 162.91 | 297.73 ± 130.29 | 291.58 ± 101.16 | 0.780 | 256.72 ± 110.76 | 268.80 ± 127.89 | 235.80 ± 103.57 | 0.590 |
| Fasting Blood Glucose (μmol/L) | 8.72 ± 4.18 | 7.30 ± 3.00 | 6.71 ± 2.43 | 0.554 | 6.69 ± 2.73 | 7.39 ± 2.75 | 8.34 ± 3.34 | 0.148 |
| Homocysteine (μmol/L) | 15.95 ± 7.33 | 17.38 ± 14.32 | 13.56 ± 5.83 | 0.292 | 21.31 ± 3.88 | 12.52 ± 3.79 | 13.54 ± 7.54 | 0.380 |
| Fibrinogen (g/L) | 4.31 ± 1.64 | 3.91 ± 1.99 | 4.51 ± 3.09 | 0.510 | 3.38 ± 1.45 | 3.90 ± 1.17 | 3.59 ± 1.25 | 0.387 |
| Hypersensitive C-reactive Protein (mg/L) | 13.22 ± 4.29 | 12.99 ± 4.45 | 11.89 ± 5.23 | 0.397 | 10.68 ± 5.07 | 12.52 ± 3.79 | 13.54 ± 7.54 | 0.459 |
| ALT (U/L) | 23.37 ± 19.74 | 26.81 ± 50.99 | 41.30 ± 87.89 | 0.359 | 20.32 ± 15.92 | 16.51 ± 9.16 | 23.49 ± 22.72 | 0.347 |
| AST (U/L) | 30.32 ± 14.64 | 30.02 ± 28.50 | 47.69 ± 126.80 | 0.481 | 25.52 ± 11.63 | 24.62 ± 14.24 | 27.00 ± 13.17 | 0.810 |
| Total Bilirubin (μmol/L) | 21.35 ± 12.97 | 19.26 ± 8.96 | 16.66 ± 9.05 | 0.136 | 18.21 ± 10.59 | 15.70 ± 9.83 | 15.09 ± 8.11 | 0.477 |
| Prealbumin (g/L) | 178.77 ± 55.66 | 179.06 ± 58.82 | 205.34 ± 71.76 | 0.094 | 169.81 ± 58.16 | 172.08 ± 51.97 | 196.39 ± 56.35 | 0.179 |
| Albumin (g/L) | 37.97 ± 5.01 | 36.95 ± 6.16 | 36.40 ± 5.58 | 0.444 | 38.13 ± 5.38 | 36.63 ± 6.71 | 35.90 ± 4.01 | 0.345 |
| WBC (109/L) | 11.25 ± 4.38 | 9.72 ± 2.89 | 10.04 ± 4.31 | 0.185 | 8.30 ± 3.57 | 9.60 ± 3.62 | 9.01 ± 2.85 | 0.395 |
| Hemoglobin A1c (%) | 6.62 ± 1.60 | 6.98 ± 2.00 | 6.88 ± 1.64 | 0.669 | 6.50 ± 1.37 | 6.83 ± 2.33 | 15.04 ± 2.78 | 0.175 |
| TOAST Classification | 21/11/8/1 | 27/4/7/2 | 26/3/10/1 | 0.226 | 11/7/6/0 | 16/6/3/0 | 15/4/5/1 | 0.570 |
| Thrombolytic, n (%) | 5 (12.2%) | 7 (17.1%) | 8 (20.0%) | 0.631 | 9 (36.0%) | 3 (12.0%) | 5 (20.0%) | 0.119 |
| Embolectomy, n (%) | 4 (9.8%) | 7 (17.1%) | 2 (5.0%) | 0.207 | 2 (8.0%) | 1 (4.0%) | 4 (16.0%) | 0.332 |
| Intracerebral Hemorrhage, n (%) | 9 (21.95%) | 5 (12.20%) | 4 (10.0%) | 0.285 | 6 (24.00%) | 3 (12.00%) | 2 (8.0%) | 0.206 |
| Characteristics | Death after 90-Day Follow-Up (n = 28) | Without Death After 90-Day Follow-Up (n = 169) | t/χ2/Z | p-Value |
|---|---|---|---|---|
| Gender male, n (%) | 14 (50%) | 108 (63.9%) | t = 1.824 | 0.076 |
| Age (years) | 74.79 ± 11.68 | 70.37 ± 12.87 | χ2 = 1.970 | 0.160 |
| WC (cm) | 77.41 ± 10.32 | 77.05 ± 9.35 | t = 0.188 | 0.851 |
| BMI (m/kg2) | 22.36 ± 3.22 | 23.07 ± 3.67 | t = −0.962 | 0.337 |
| BFMI | 7.88 ± 1.77 | 8.10 ± 2.69 | t = −0.574 | 0.569 |
| Hypertension, n (%) | 18 (64.3%) | 128 (75.7%) | χ2 = 1.642 | 0.200 |
| DM, n (%) | 7 (25.0%) | 54 (32.0%) | χ2 = 0.543 | 0.461 |
| AF, n (%) | 8 (28.6%) | 34 (20.1%) | χ2 = 1.328 | 0.515 |
| CHD, n (%) | 1 (3.6%) | 21 (12.4%) | z = −1.377 | 0.168 |
| Smoker, n (%) | 3 (10.7%) | 15 (8.9%) | χ2 = 0.098 | 0.754 |
| NIH Stroke Scale | 18.18 ± 9.21 | 12.34 ± 7.35 | t = 3.746 | 0.000 ** |
| Systolic Blood Pressure (mmHg) | 141.07 ± 21.04 | 147.51 ± 21.34 | t = −1.483 | 0.140 |
| Diastolic Blood Pressure (mmHg) | 77.36 ± 12.85 | 81.01 ± 13.20 | t = −1.360 | 0.176 |
| HDL-C (mmol/L) | 0.78 ± 0.18 | 1.05 ± 0.29 | t = −6.590 | 0.000 ** |
| LDL-C (mmol/L) | 2.70 ± 0.96 | 2.70 ± 1.09 | t = 0.111 | 0.912 |
| Triglyceride (mmol/L) | 1.43 ± 0.50 | 1.20 ± 0.48 | t = 2.348 | 0.020 * |
| Total Cholesterol (mmol/L) | 4.04 ± 0.98 | 4.28 ± 1.24 | t = −0.949 | 0.344 |
| Creatinine (μmol/L) | 59.80 ± 19.35 | 78.96 ± 81.54 | t = −1.235 | 0.218 |
| Uric Acid (μmol/L) | 244.63 ± 143.11 | 289.03 ± 124.60 | t = −1.709 | 0.089 |
| Fasting Glucose (μmol/L) | 7.51 ± 3.18 | 7.55 ± 7.36 | t = −0.025 | 0.980 |
| Homocysteine (μmol/L) | 14.52 ± 7.17 | 16.04 ± 17.45 | t = −0.410 | 0.683 |
| Fibrinogen (g/L) | 4.44 ± 3.30 | 3.94 ± 1.71 | t = 1.156 | 0.249 |
| Hypersensitive C-reactive Protein (mg/L) | 10.65 ± 5.35 | 12.07 ± 4.91 | t = −1.401 | 0.163 |
| ALT (U/L) | 38.90 ± 62.56 | 31.27 ± 62.64 | t = 1.175 | 0.249 |
| AST (U/L) | 36.61 ± 35.27 | 31.27 ± 62.63 | t = 0.439 | 0.661 |
| Total Bilirubin (μmol/L) | 15.08 ± 6.19 | 18.55 ± 10.73 | t = −1660 | 0.098 |
| Prealbumin (g/L) | 190.25 ± 63.21 | 183.52 ± 60.21 | t = 0.544 | 0.587 |
| Albumin (g/L) | 35.47 ± 5.34 | 37.28 ± 5.55 | t = −1.608 | 0.109 |
| WBC (109/L) | 8.93 ± 3.26 | 9.96 ± 3.86 | t = 0.443 | 0.185 |
| Hemoglobin A1c (%) | 11.40 ± 24.78 | 7.35 ± 5.83 | t = 0.781 | 0.443 |
| TOAST Classification † | 19/6/3/0 | 97/29/36/5 | χ2 = 2.835 | 0.415 |
| Thrombolytic, n (%) | 5 (17.9%) | 32 (18.9%) | χ2 = 0.018 | 0.892 |
| Embolectomy, n (%) | 2 (7.1%) | 18 (10.7%) | χ2 = 0.324 | 0.569 |
| Intracerebral Hemorrhage, n (%) | 1 (3.6%) | 28 (16.6%) | z = −1.793 | 0.073 |
| VAI | 2.93 ± 1.35 | 1.73 ± 0.92 | t = 5.945 | 0.000 ** |
| CVAI | 99.10 ± 35.58 | 85.67 ± 34.88 | t = 1.882 | 0.061 |
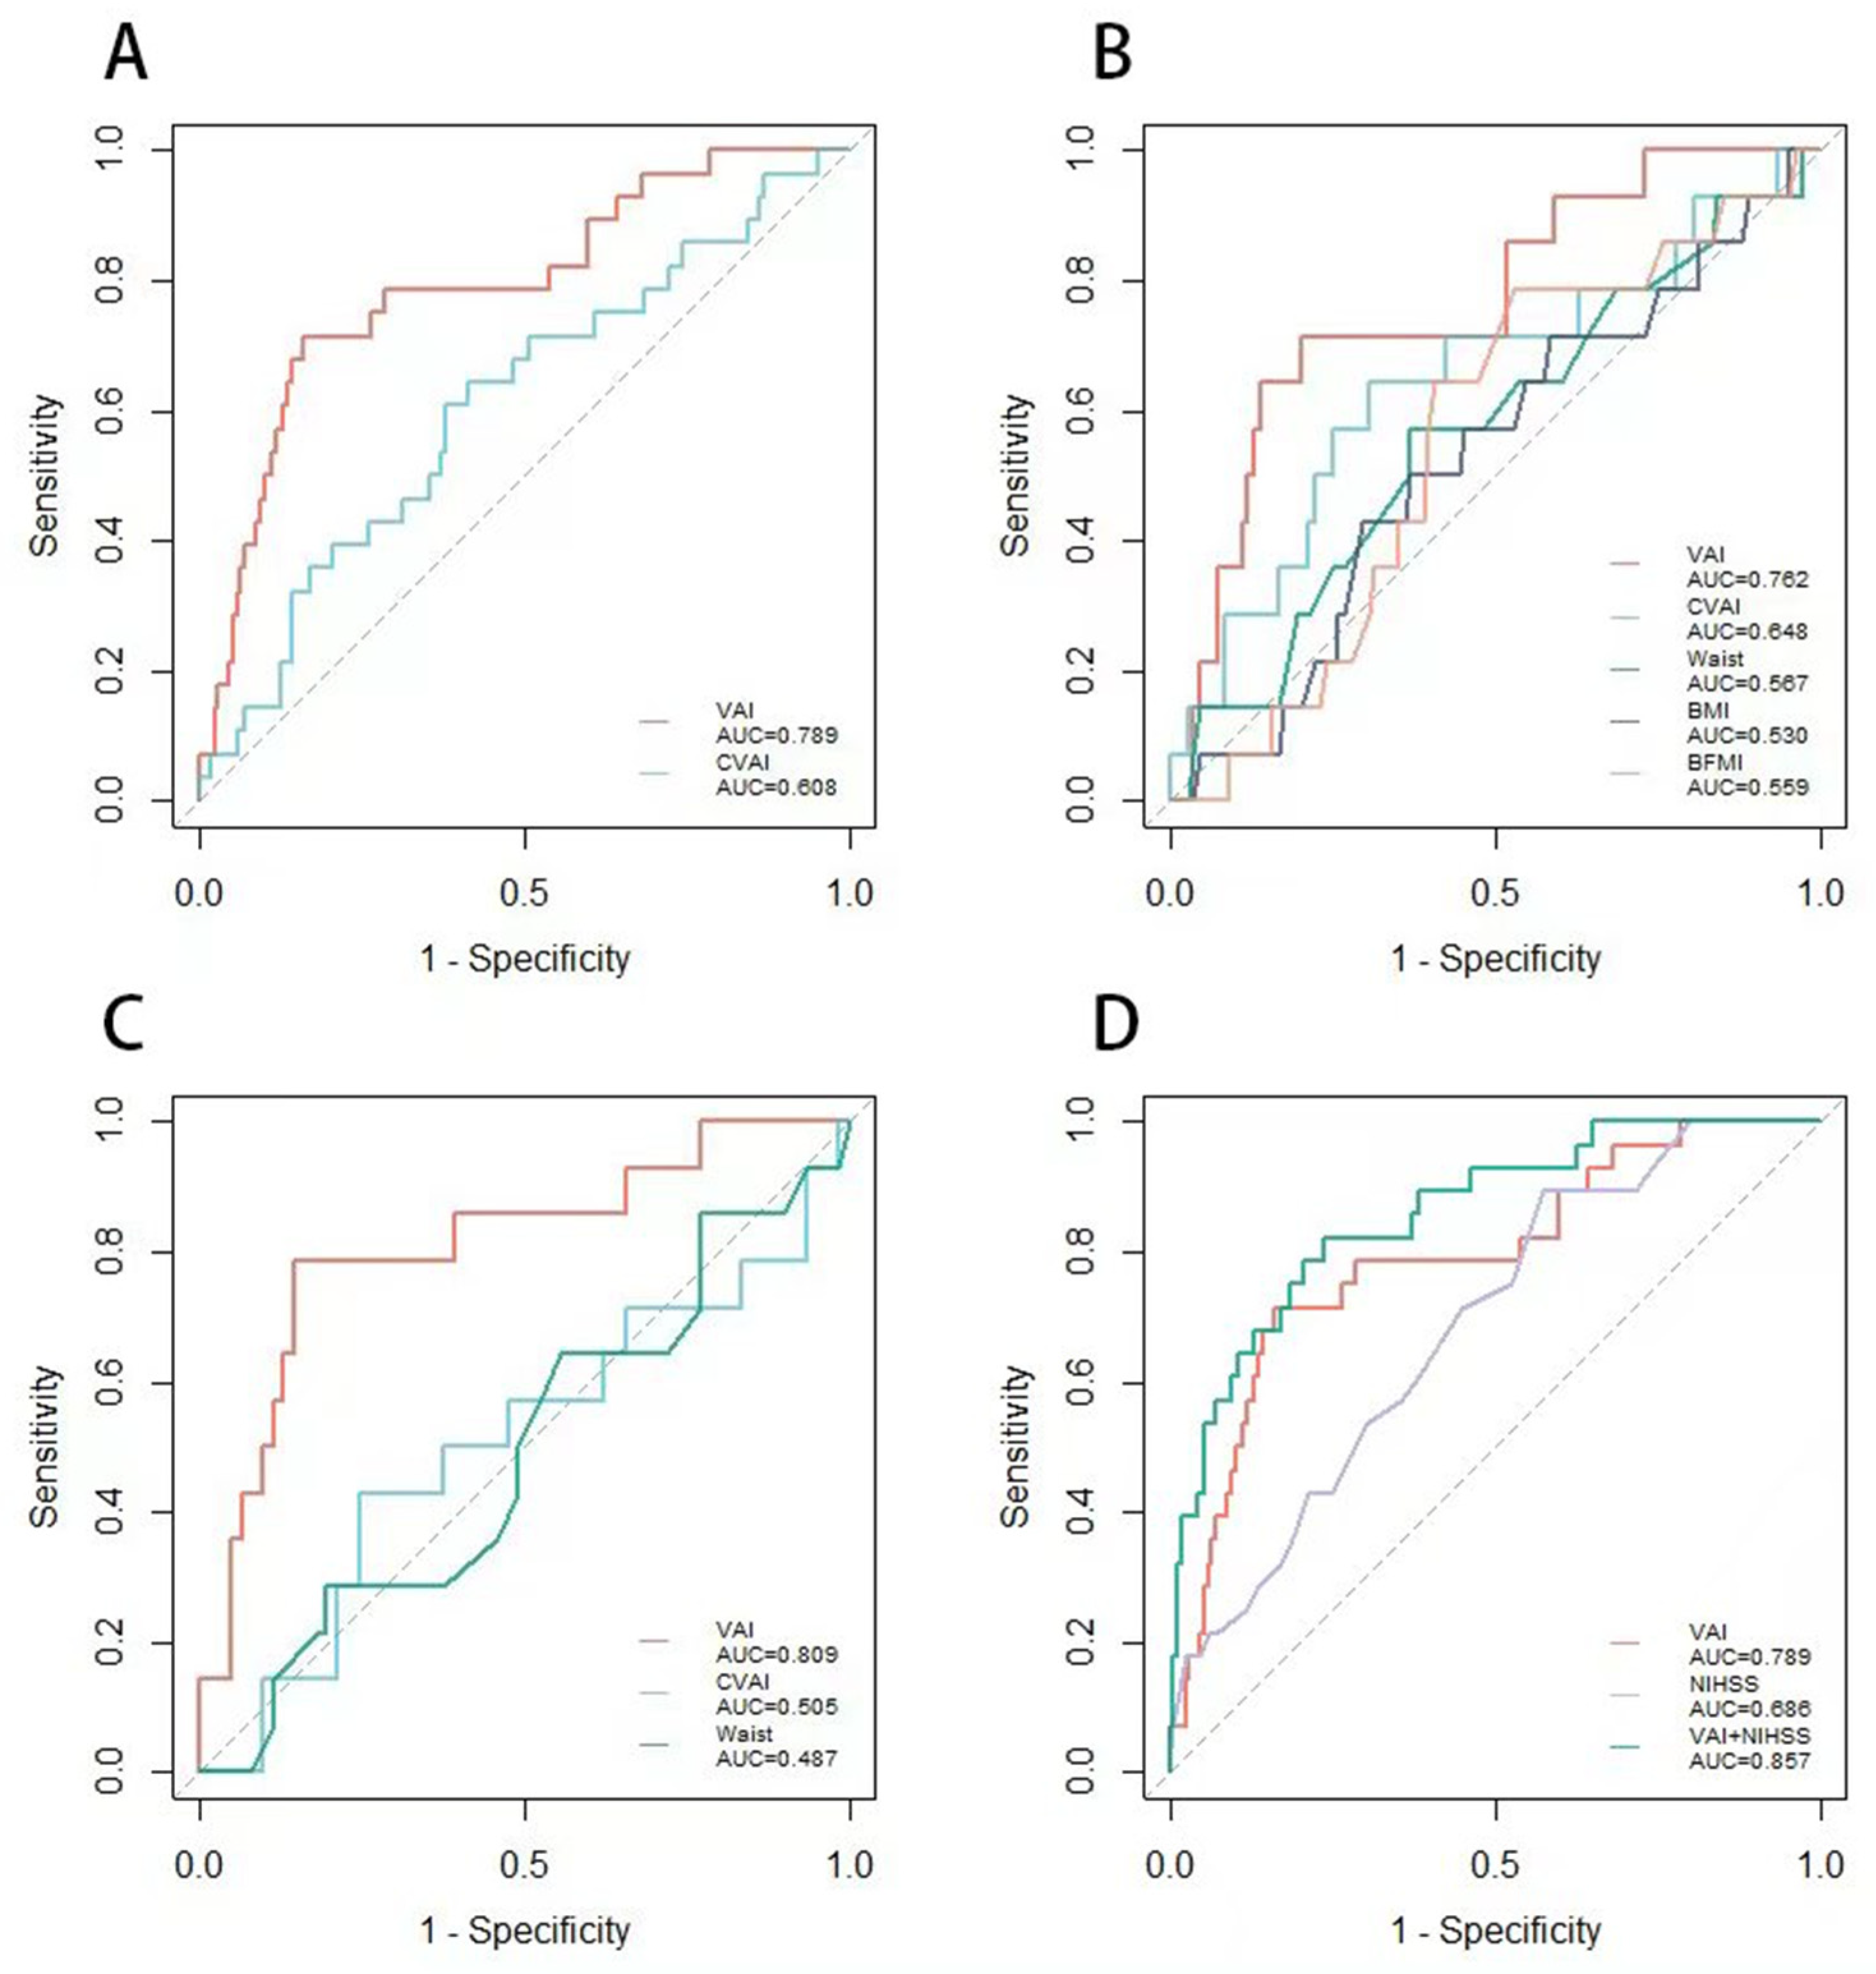
| Markers | All (n = 197) | Men (n = 122) | Women (m = 75) | |||
|---|---|---|---|---|---|---|
| AUC | 95% CI | AUC | 95% CI | AUC | 95% CI | |
| WC (cm) | 0.520 | 0.401–0.640 | 0.567 | 0.405–0.729 | 0.487 | 0.318–0.655 |
| BMI (m/kg2) | 0.445 | 0.334–0.556 | 0.530 | 0.374–0.687 | 0.484 | 0.230–0.538 |
| BFMI | 0.487 | 0.389–0.585 | 0.559 | 0.416–0.702 | 0.328 | 0.187–0.470 |
| CVAI | 0.608 | 0.494–0.723 | 0.648 | 0.483–0.813 | 0.505 | 0.325–0.684 |
| VAI | 0.789 | 0.695–0.883 | 0.762 | 0.631–0.893 | 0.809 | 0.675–0.943 |
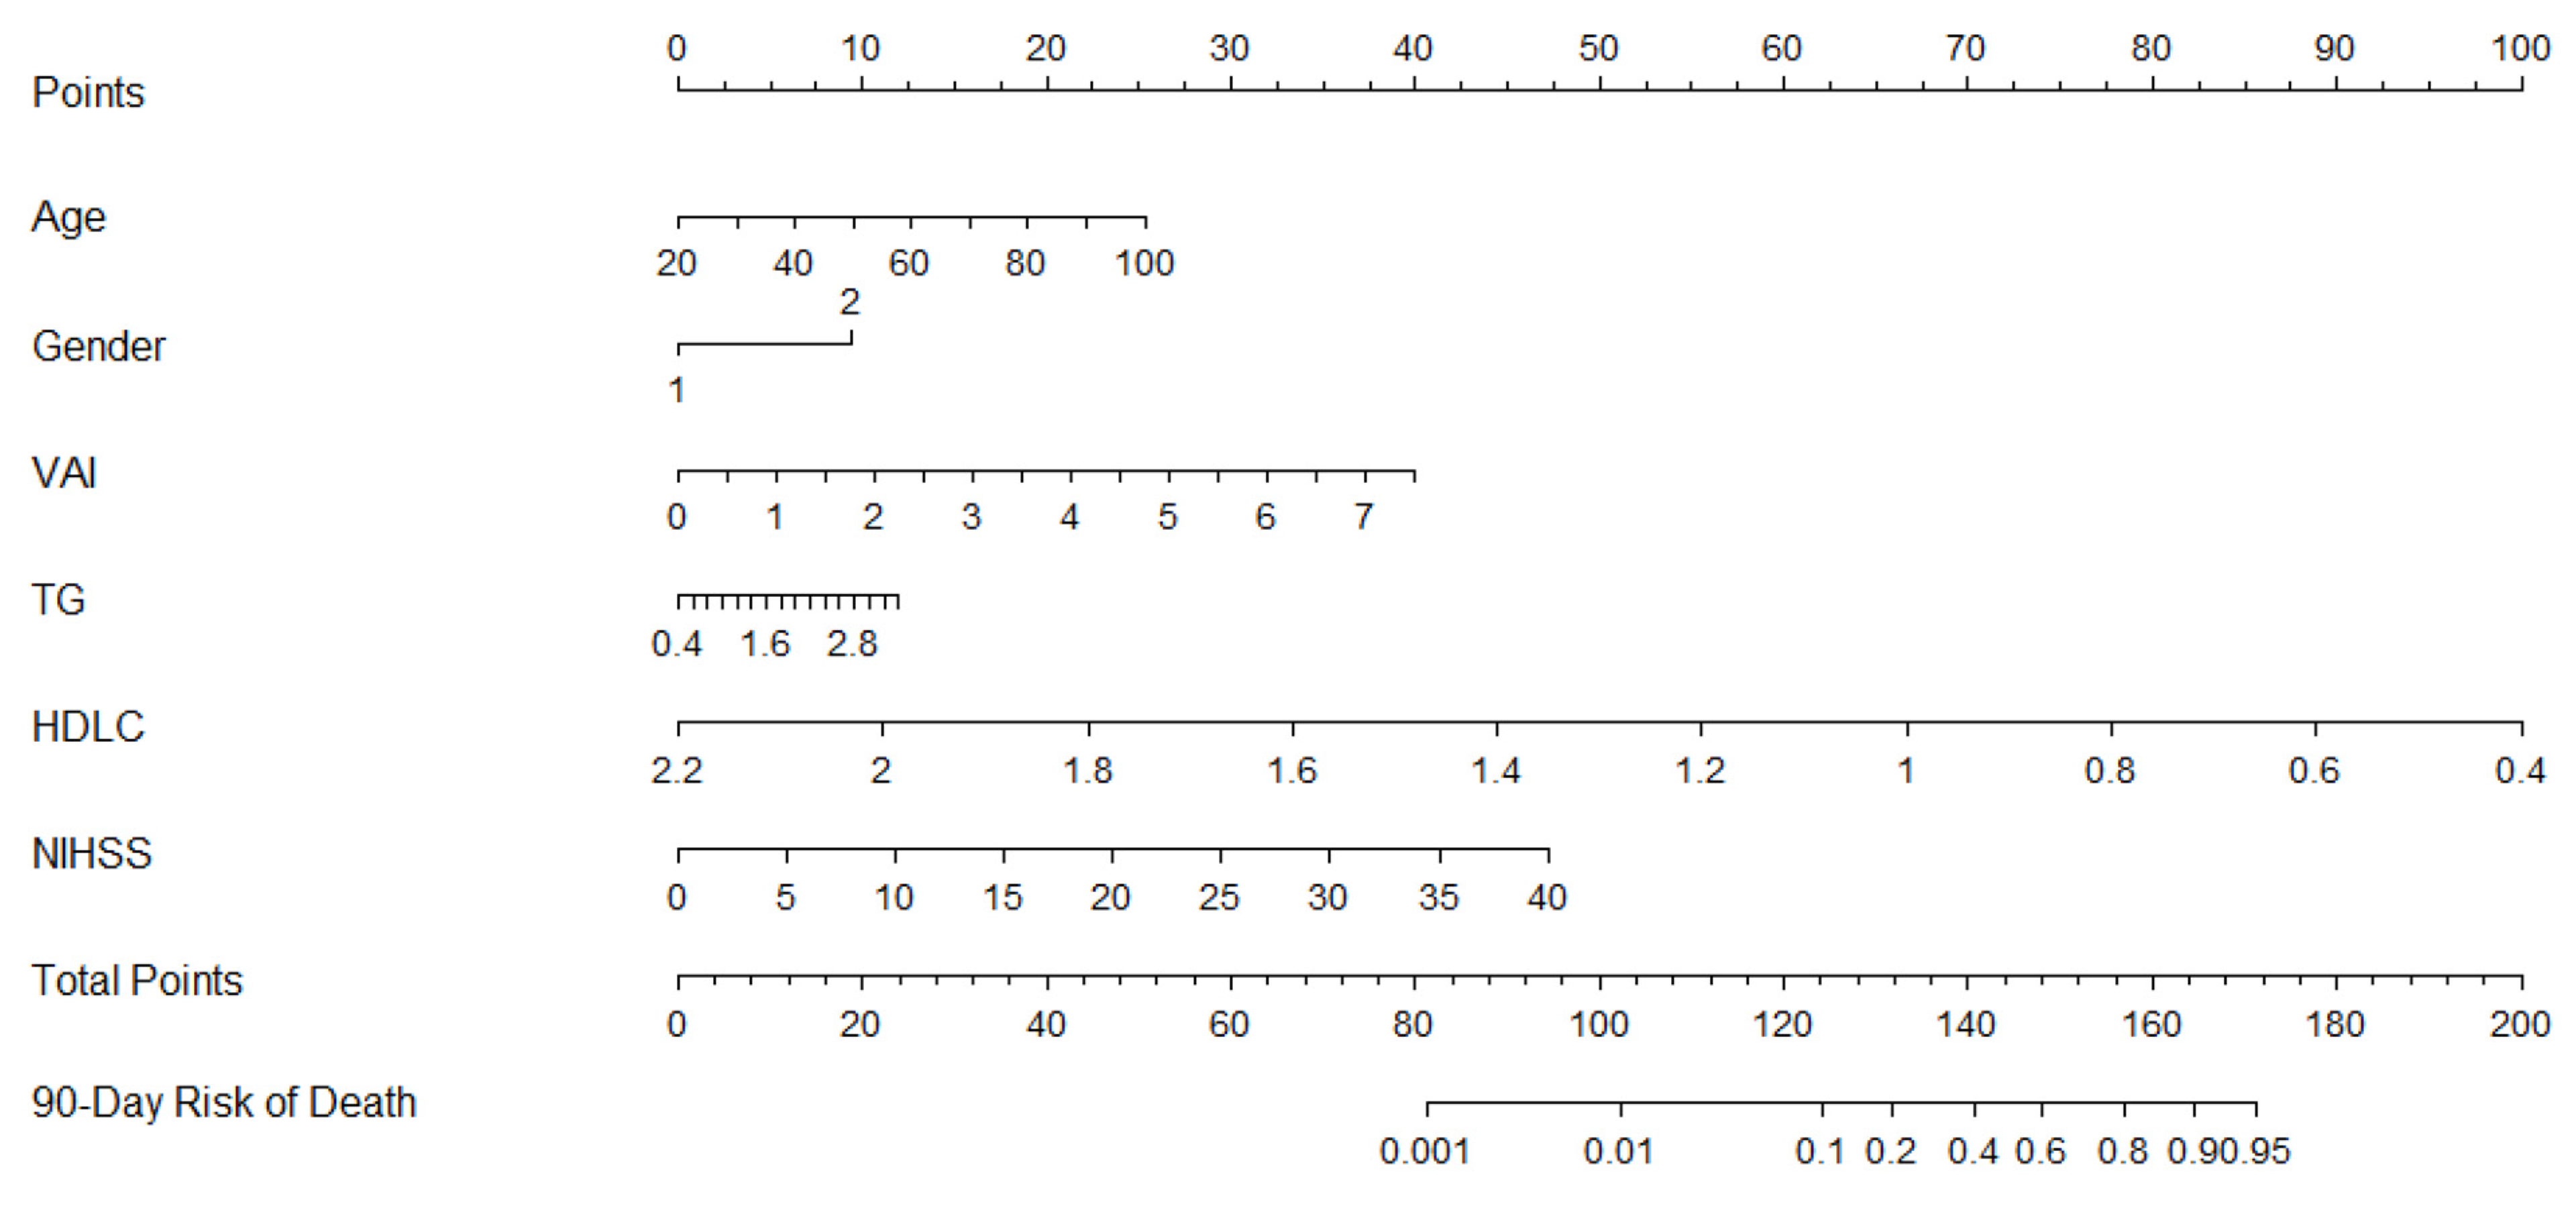
| Variables | Odds Ratio | 95% CI | t | p-Value |
|---|---|---|---|---|
| Age | 1.034 | 0.992–1.077 | 0.033 | 0.111 |
| Gender | 1.868 | 0.625–5.587 | 0.625 | 0.263 |
| TG | 0.236 | 0.047–1.182 | −1.444 | 0.079 |
| NIHSS | 1.136 | 1.068–1.207 | 0.127 | 0.000 |
| VAI | 5.944 | 2.752–12.837 | 1.782 | 0.000 |
Disclaimer/Publisher’s Note: The statements, opinions and data contained in all publications are solely those of the individual author(s) and contributor(s) and not of MDPI and/or the editor(s). MDPI and/or the editor(s) disclaim responsibility for any injury to people or property resulting from any ideas, methods, instructions or products referred to in the content. |
© 2023 by the authors. Licensee MDPI, Basel, Switzerland. This article is an open access article distributed under the terms and conditions of the Creative Commons Attribution (CC BY) license (https://creativecommons.org/licenses/by/4.0/).
Share and Cite
Chang, Y.; Zhang, L.; Li, Y.; Wang, D.; Fang, Q.; Tang, X. Derivation and Validation of a New Visceral Adiposity Index for Predicting Short-Term Mortality of Patients with Acute Ischemic Stroke in a Chinese Population. Brain Sci. 2023, 13, 297. https://doi.org/10.3390/brainsci13020297
Chang Y, Zhang L, Li Y, Wang D, Fang Q, Tang X. Derivation and Validation of a New Visceral Adiposity Index for Predicting Short-Term Mortality of Patients with Acute Ischemic Stroke in a Chinese Population. Brain Sciences. 2023; 13(2):297. https://doi.org/10.3390/brainsci13020297
Chicago/Turabian StyleChang, Yuhong, Lulu Zhang, Yidan Li, Dapeng Wang, Qi Fang, and Xiang Tang. 2023. "Derivation and Validation of a New Visceral Adiposity Index for Predicting Short-Term Mortality of Patients with Acute Ischemic Stroke in a Chinese Population" Brain Sciences 13, no. 2: 297. https://doi.org/10.3390/brainsci13020297