
Transfer Learning-Based Model for Diabetic Retinopathy Diagnosis Using Retinal Images


Abstract
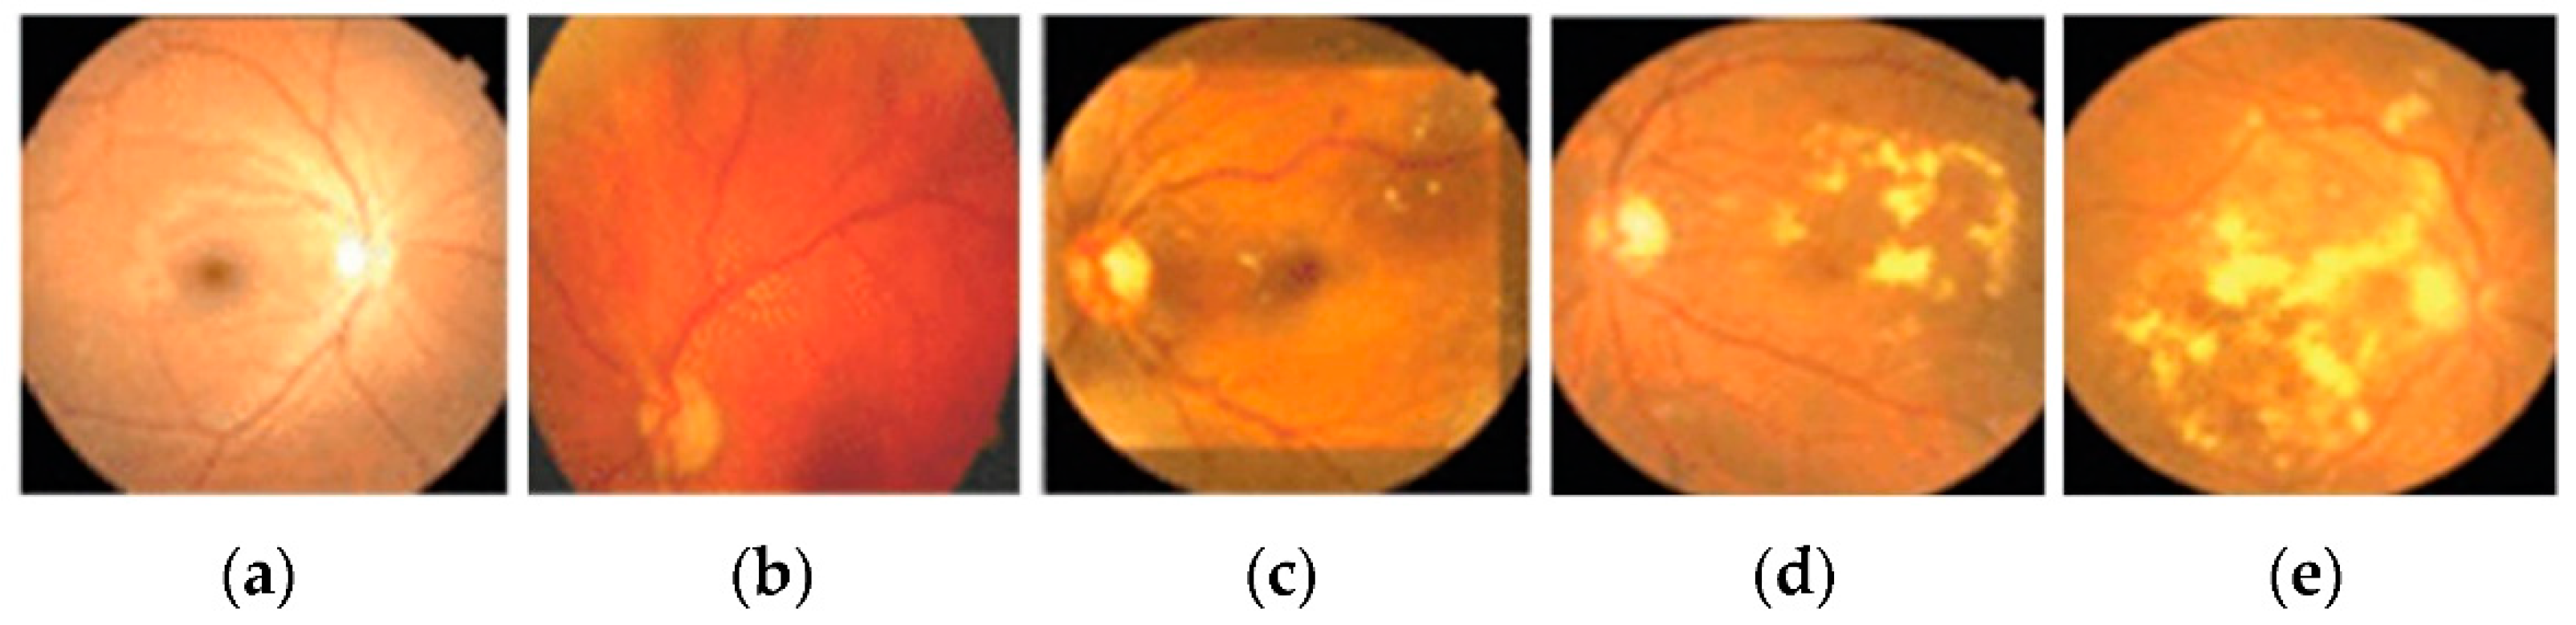
:1. Introduction
- A VGGNet model based on transfer learning is proposed for detecting and classifying diabetic retinopathy.
- Implementation of various preprocessing techniques such as interpolation image resizing, weighted Gaussian blur, and CLAHE for improving the value and visibility of retinal images.
- Performed data augmentation operations on each grade of DR individually to overcome annotated data insufficiency and to make a balanced dataset.
- A comprehensive DR classification system is developed with accuracy and robustness.
- Evaluation of the proposed model is performed on a large dataset, EyePACS, with 35,126 retinal fundus images.
- Various performance measures are implemented, such as accuracy, sensitivity, specificity, and the AUC to verify the analytical skill.
2. Methodology
2.1. The Kaggle EyePACS Dataset
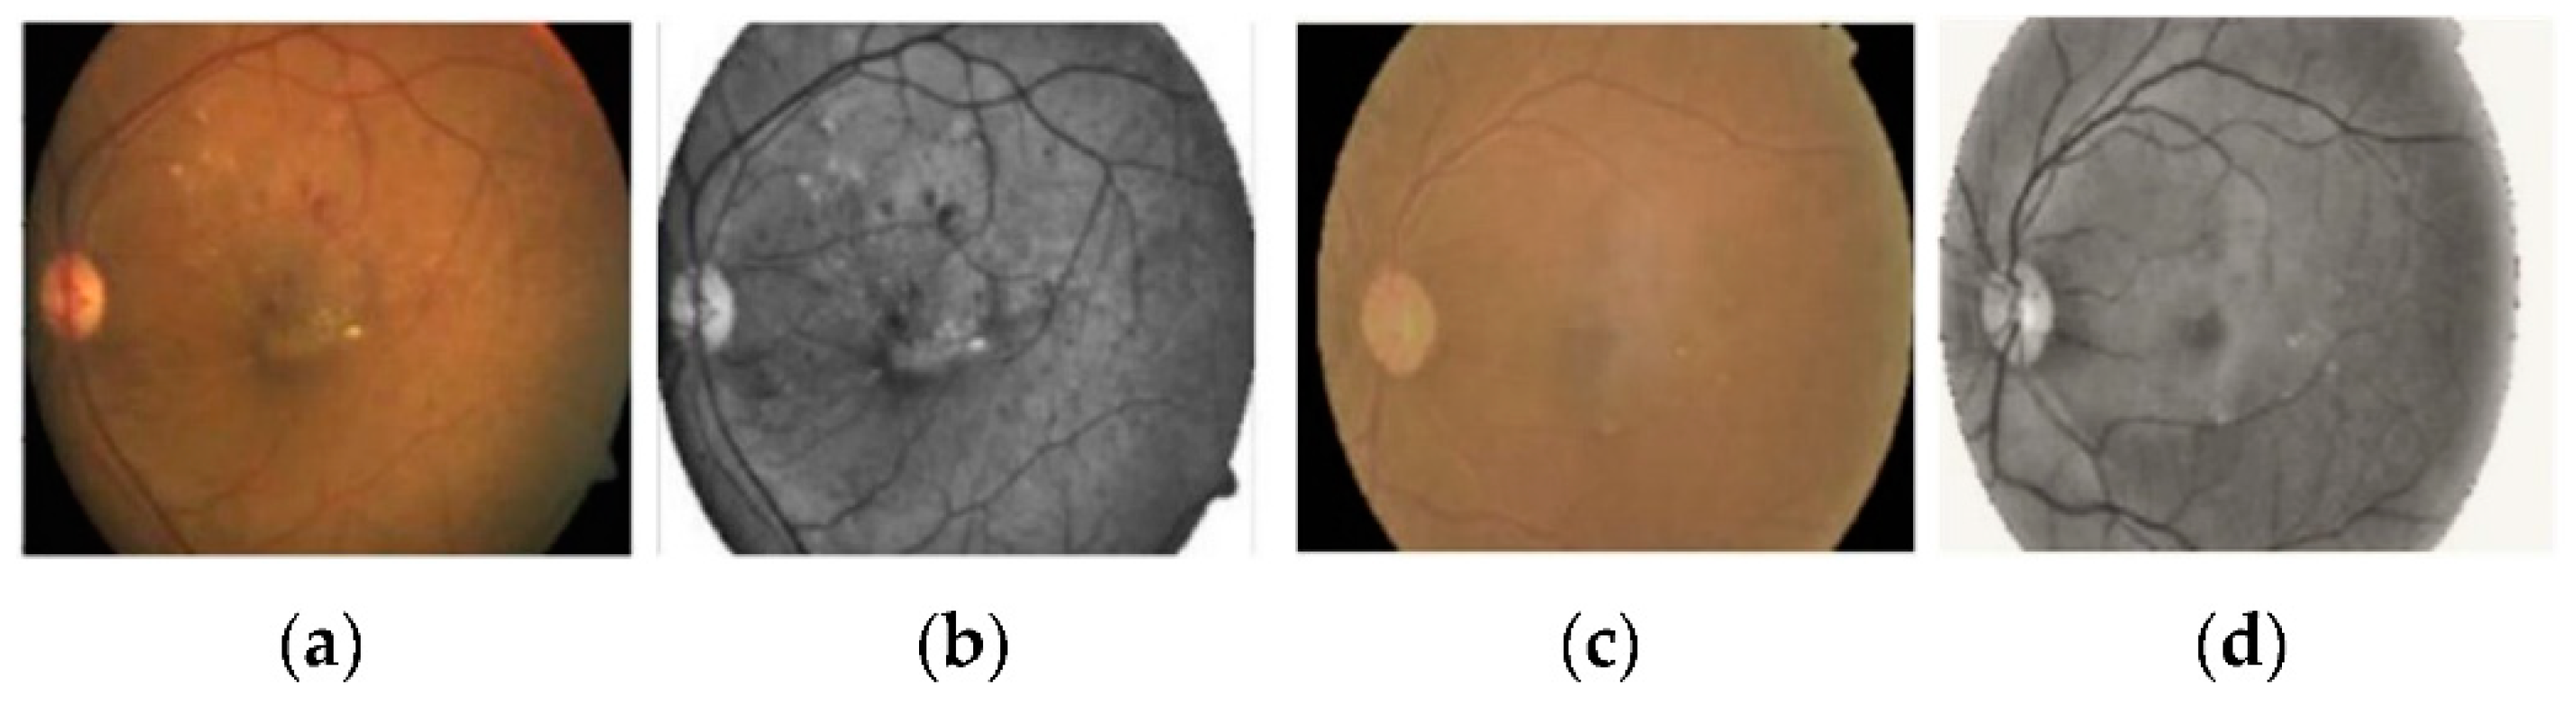
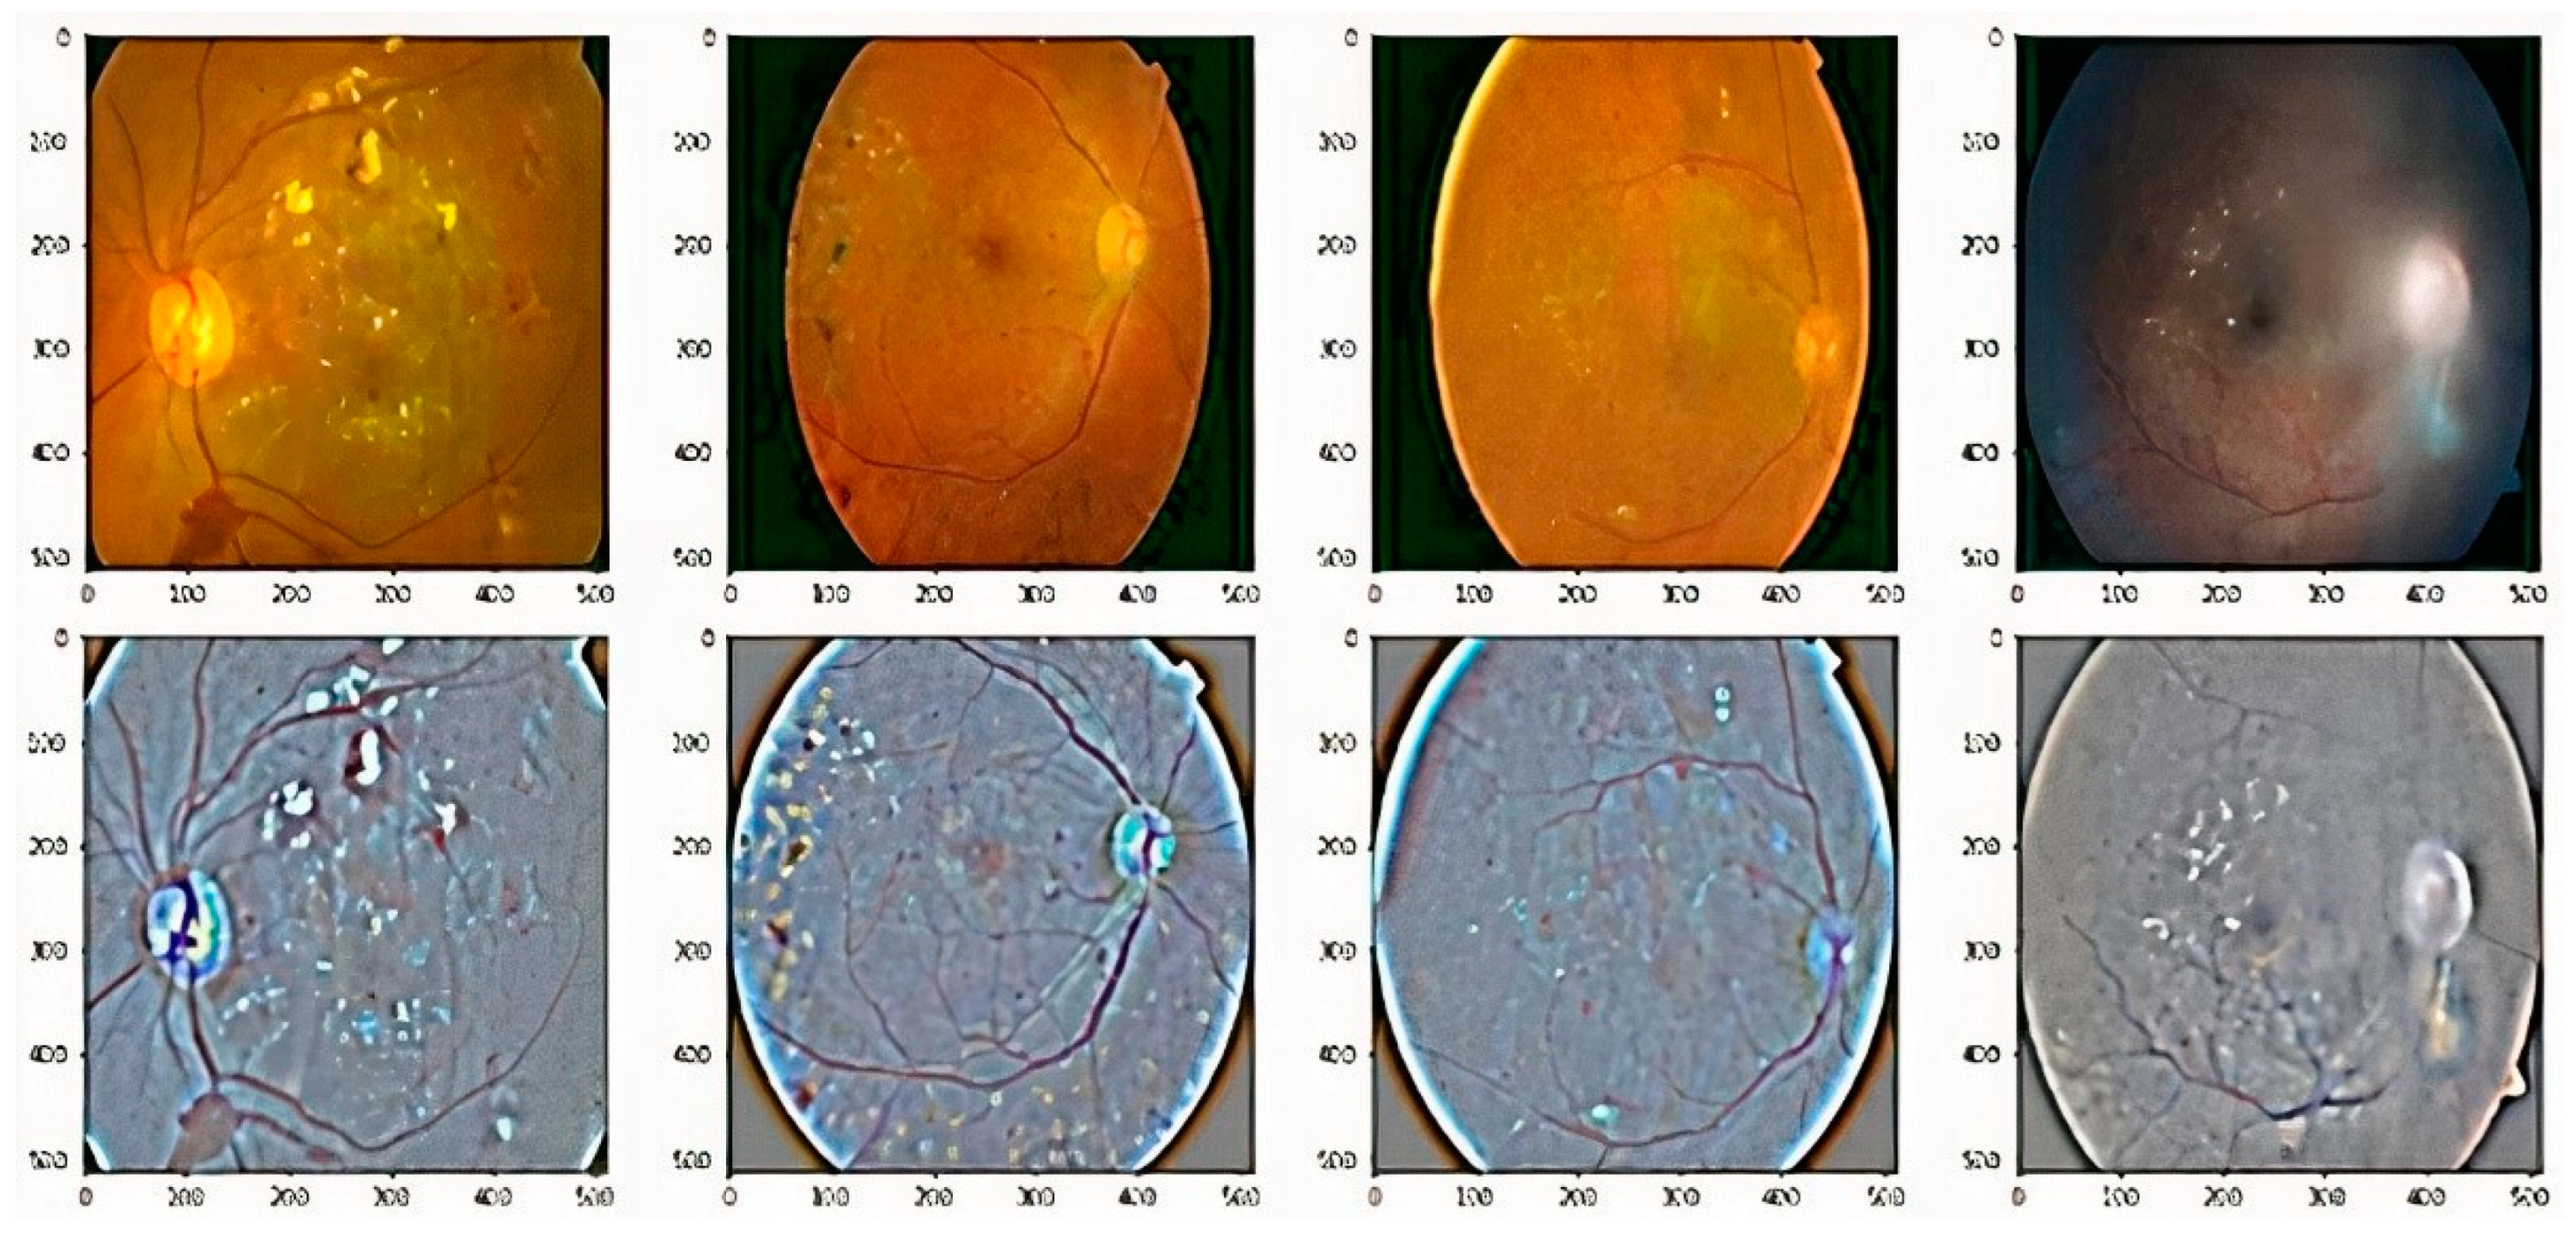
2.2. Image Preprocessing
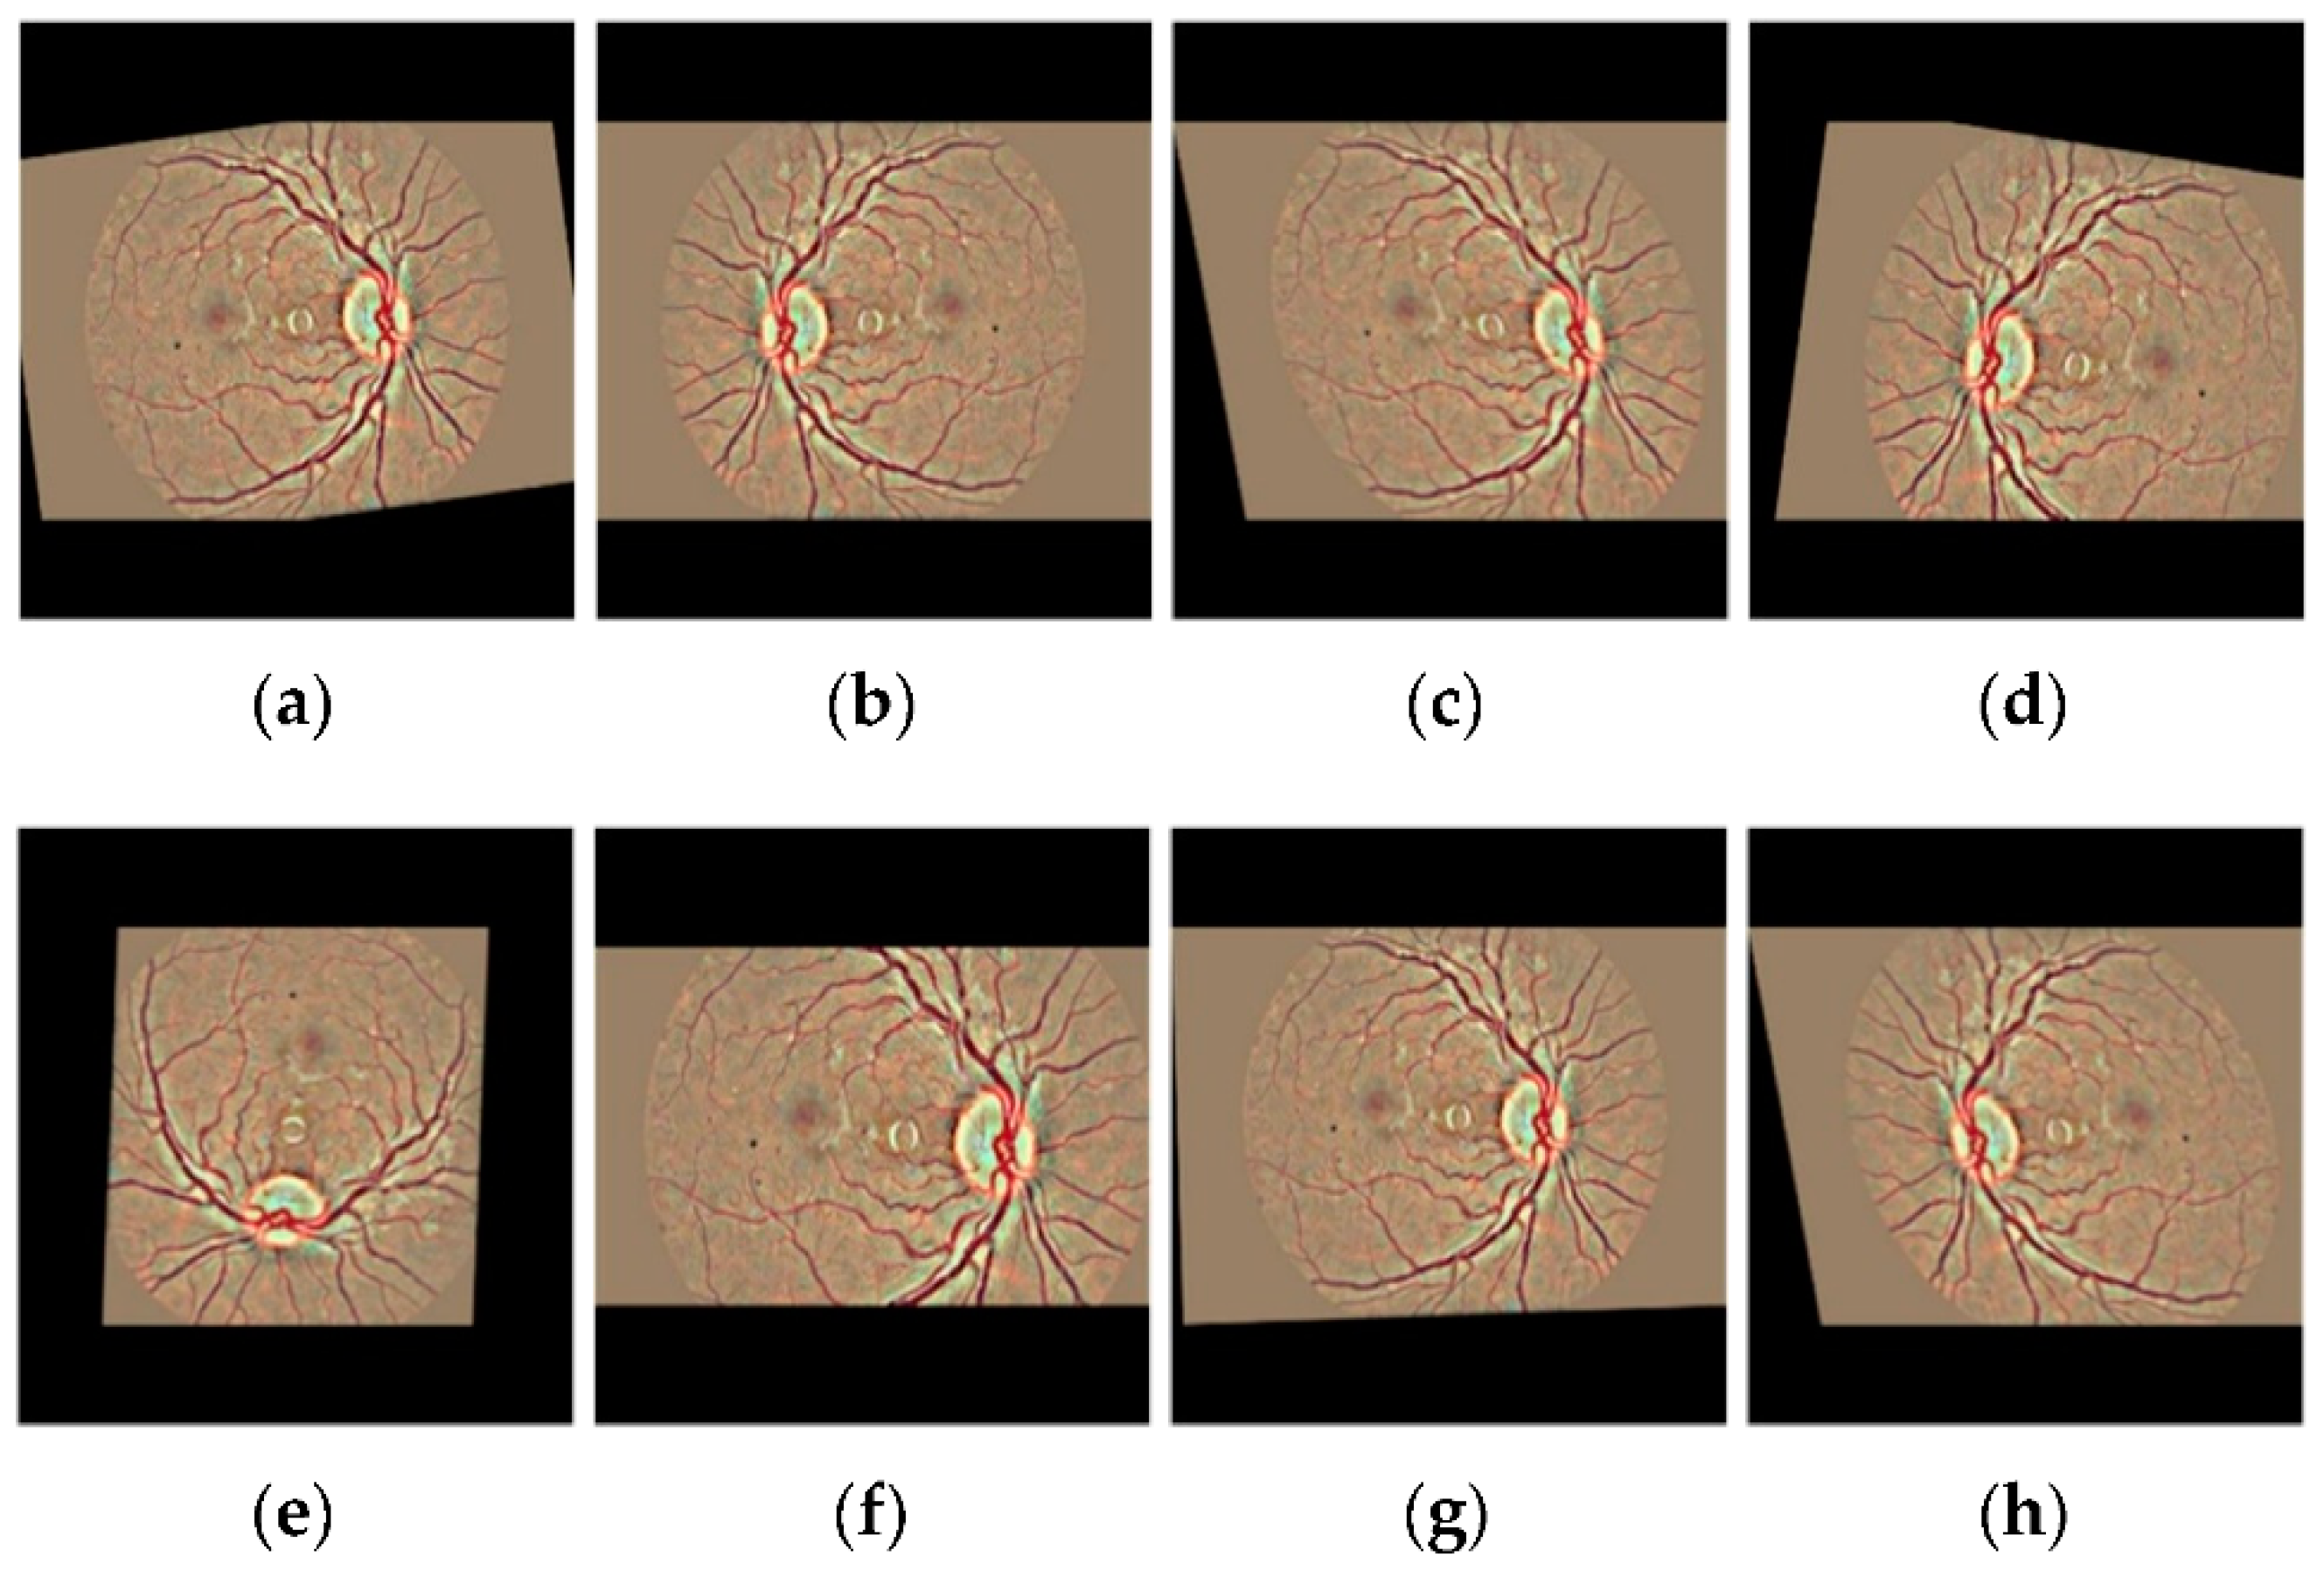
2.3. Data Augmentation
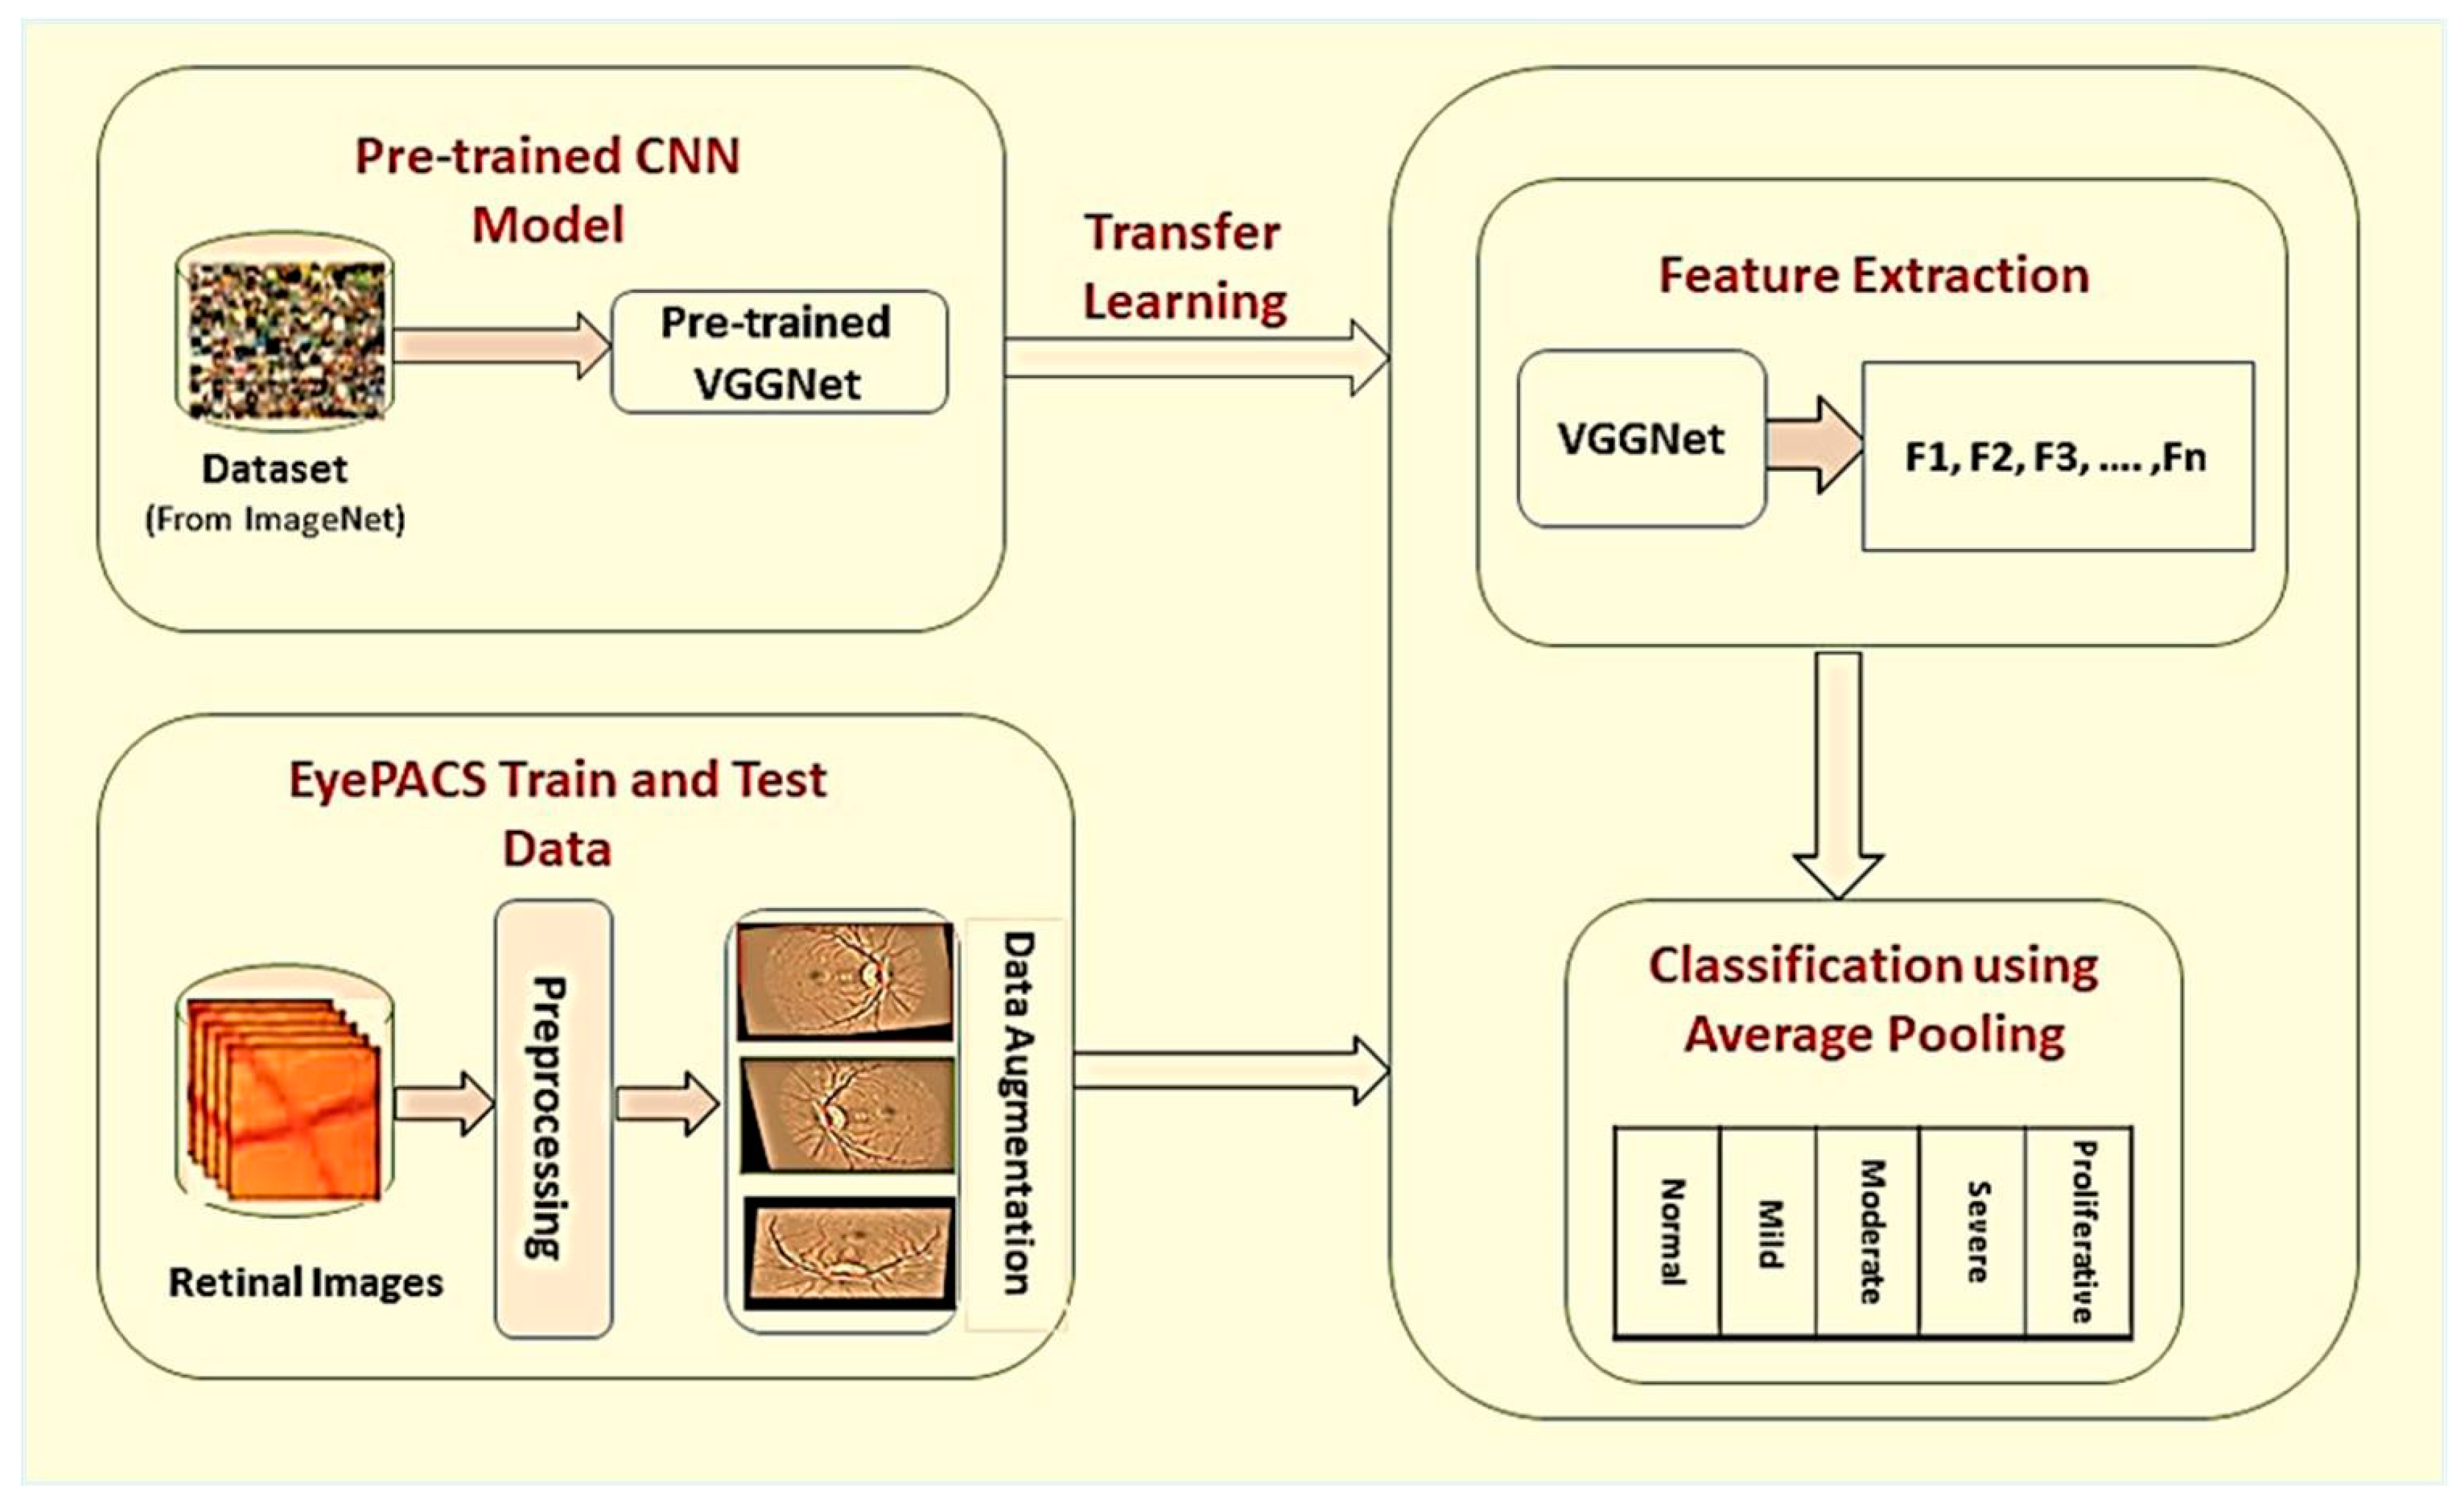
2.4. Proposed Architecture
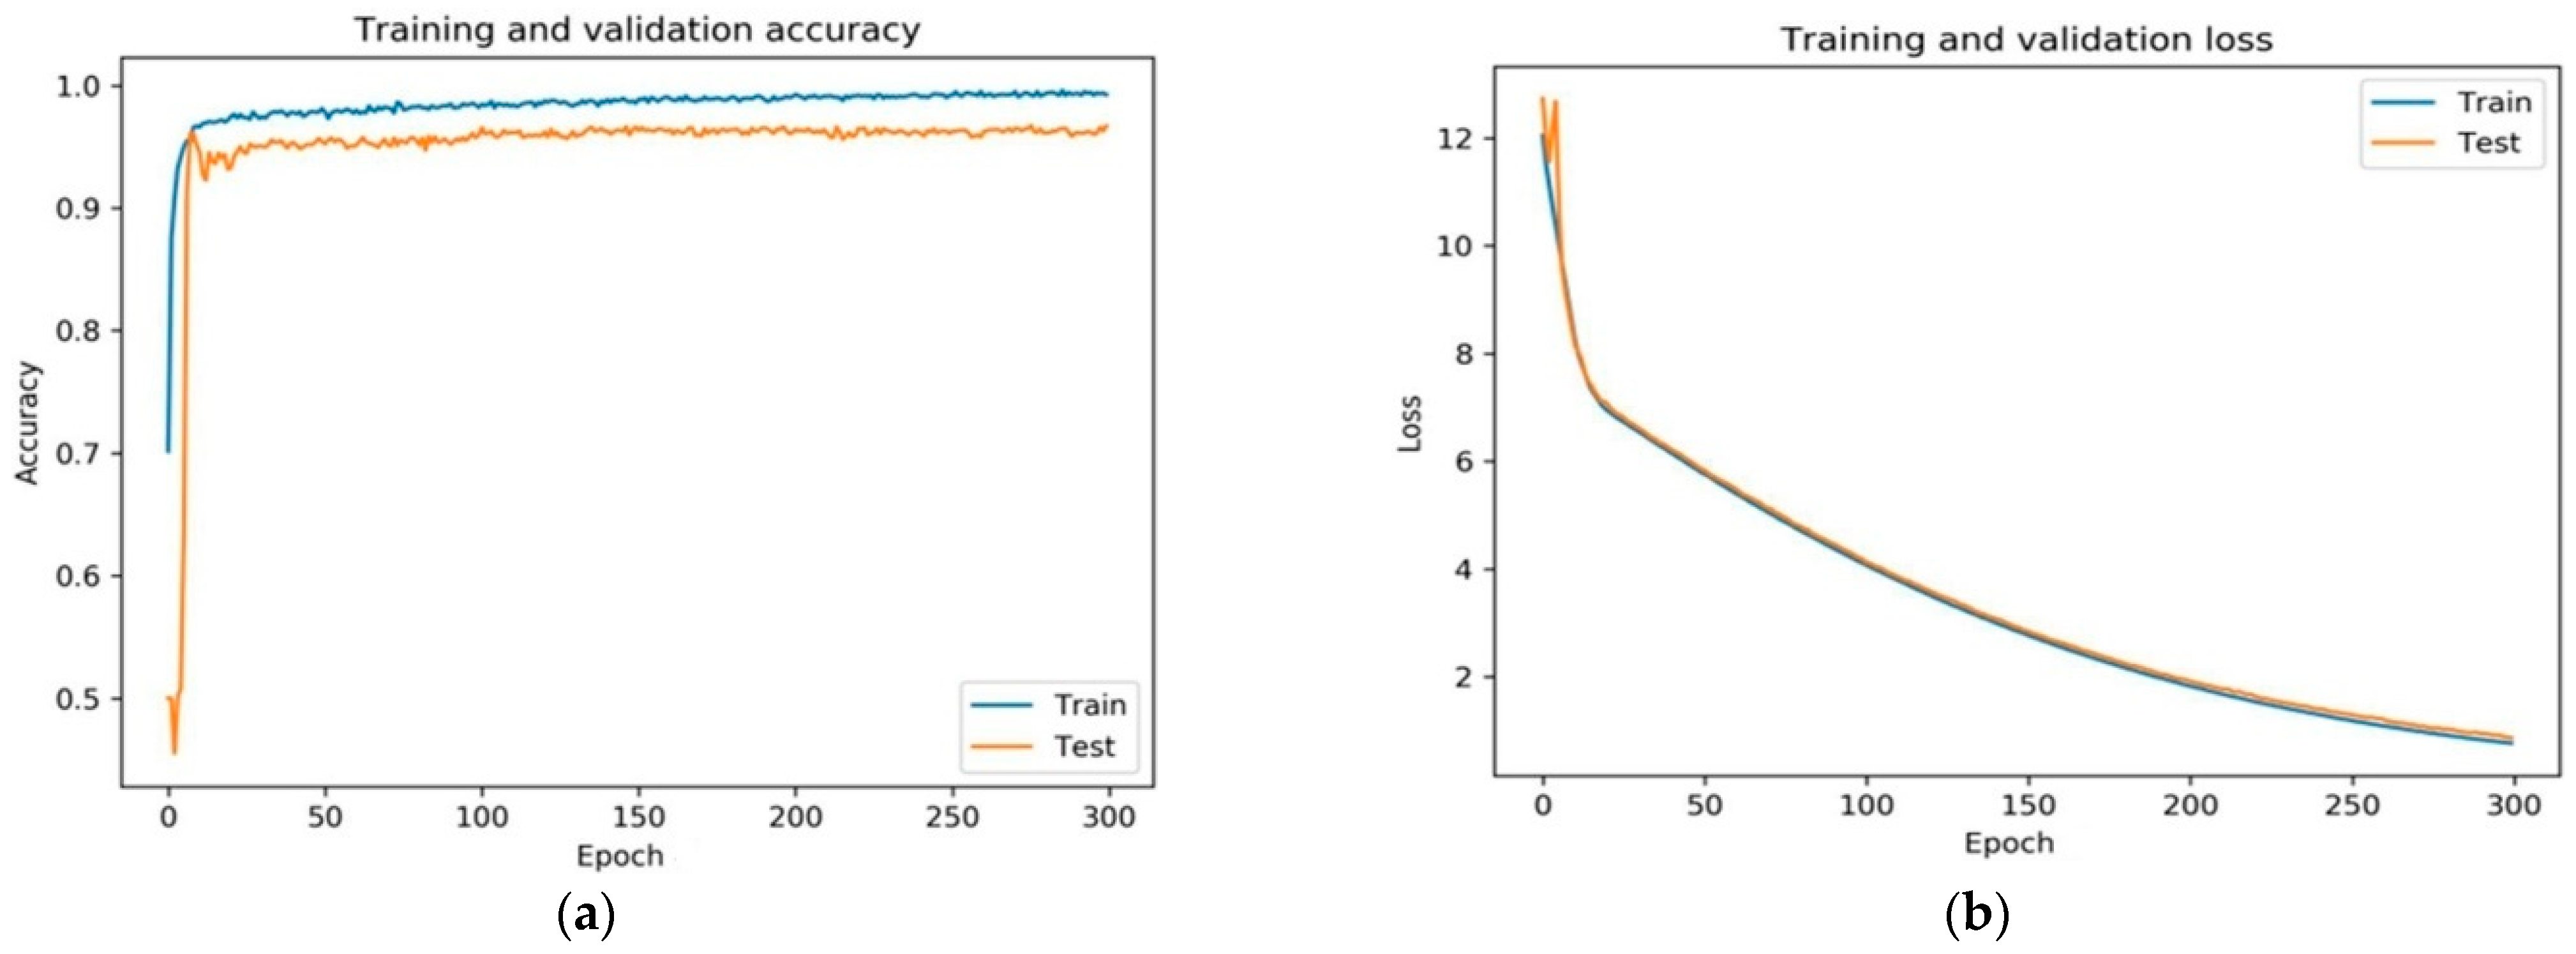
2.5. Training
3. Results and Discussion
3.1. The System Configurations
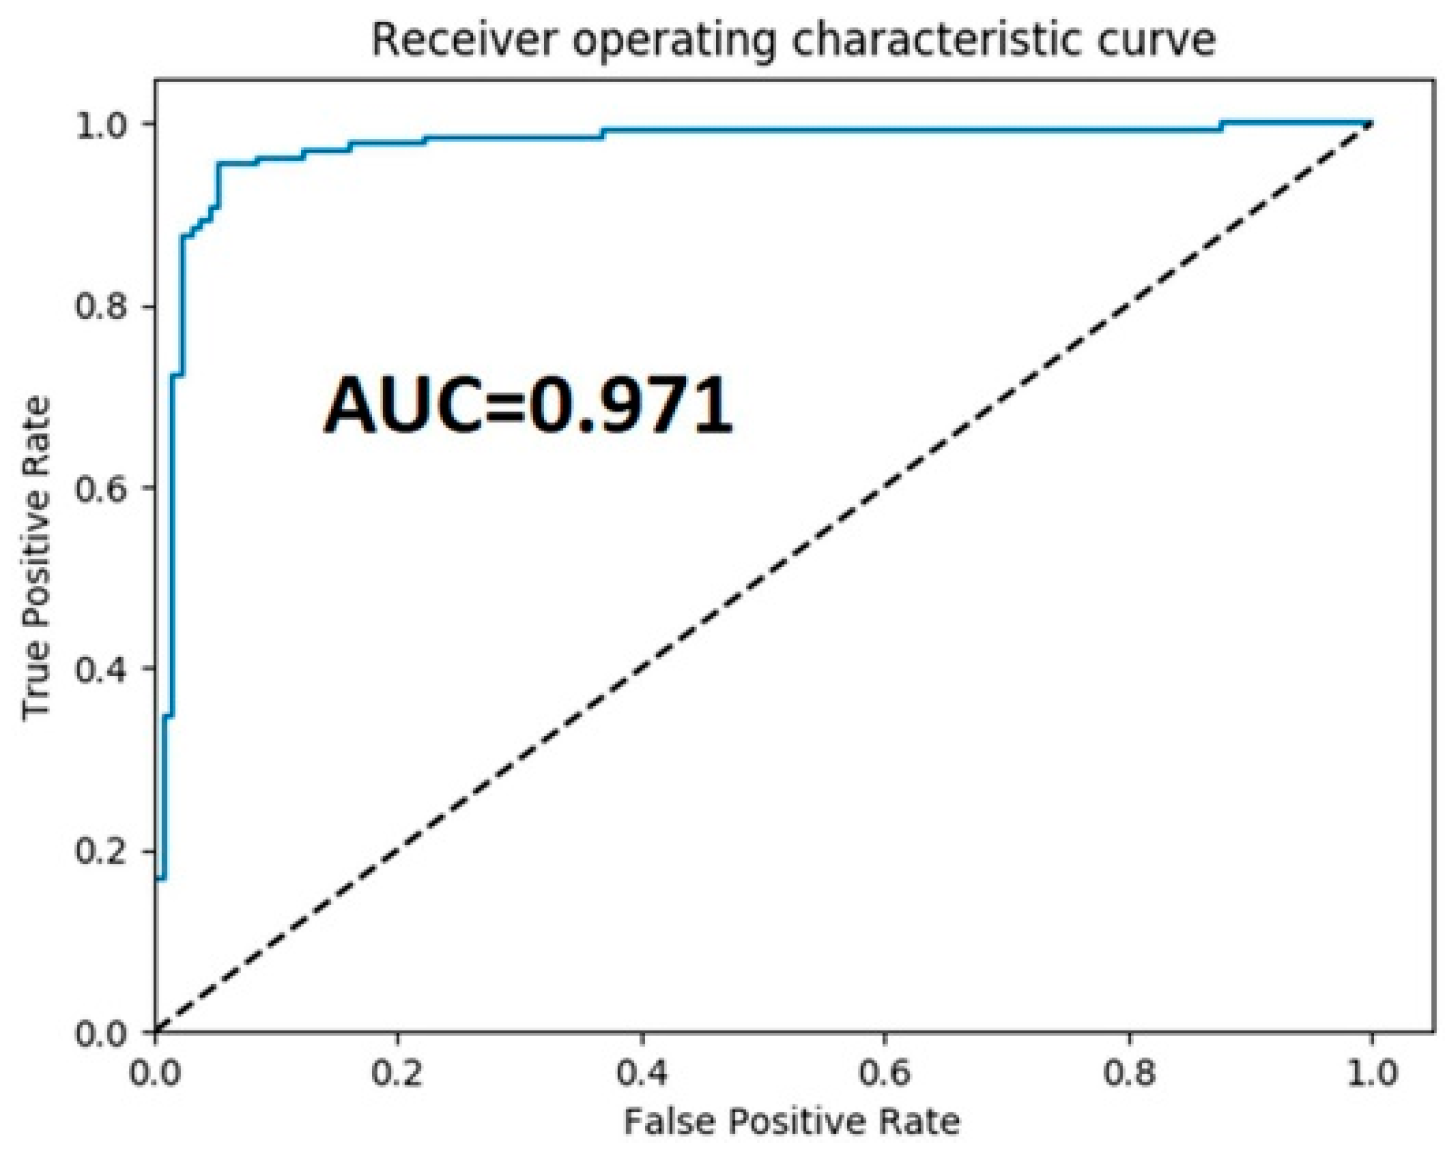
3.2. The Performance Metrics
3.3. Result Analysis
4. Conclusions
Author Contributions
Funding
Informed Consent Statement
Data Availability Statement
Acknowledgments
Conflicts of Interest
References
- Zhang, W.; Liu, H.; Al-Shabrawey, M.; Caldwell, R.W.; Caldwell, R.B. Inflammation and diabetic retinal microvascular complications. J. Cardiovasc. Dis. Res. 2011, 2, 96–103. [Google Scholar] [CrossRef] [PubMed] [Green Version]
- Krug, E.G. Trends in diabetes: Sounding the alarm. Lancet 2016, 387, 1485–1486. [Google Scholar] [CrossRef] [Green Version]
- Chen, T.-H.; Tsai, M.-J.; Fu, Y.-S.; Weng, C.-F. The Exploration of Natural Compounds for Anti-Diabetes from Distinctive Species Garcinia linii with Comprehensive Review of the Garcinia Family. Biomolecules 2019, 9, 641. [Google Scholar] [CrossRef] [Green Version]
- Saeedi, P.; Salpea, P.; Karuranga, S.; Petersohn, I.; Malanda, B.; Gregg, E.W.; Unwin, N.; Wild, S.H.; Williams, R. Mortality attributable to diabetes in 20–79 years old adults, 2019 estimates: Results from the International Diabetes Federation Diabetes Atlas. Diabetes Res. Clin. Pract. 2020, 162, 108086. [Google Scholar] [CrossRef] [Green Version]
- Grzybowski, A.; Brona, P.; Lim, G.; Ruamviboonsuk, P.; Tan, G.S.W.; Abramoff, M.; Ting, D.S.W. Artificial intelligence for diabetic retinopathy screening: A review. Eye 2020, 34, 451–460. [Google Scholar] [CrossRef] [PubMed]
- Lam, C.; Yi, D.; Guo, M.; Lindsey, T. Automated Detection of Diabetic Retinopathy using Deep Learning. AMIA Jt. Summits Transl. Sci. Proc. 2018, 2018, 147–155. [Google Scholar]
- Alyoubi, W.L.; Shalash, W.M.; Abulkhair, M.F. Diabetic retinopathy detection through deep learning techniques: A review. Inform. Med. Unlocked 2020, 20, 100377. [Google Scholar] [CrossRef]
- Ishtiaq, U.; Kareem, S.A.; Abdullah, E.R.M.F.; Mujtaba, G.; Jahangir, R.; Ghafoor, H.Y. Diabetic retinopathy detection through artificial intelligent techniques: A review and open issues. Multimed. Tools Appl. 2020, 79, 15209–15252. [Google Scholar] [CrossRef]
- Abràmoff, M.D.; Lou, Y.; Erginay, A.; Clarida, W.; Amelon, R.; Folk, J.C.; Niemeijer, M. Improved automated detection of diabetic retinopathy on a publicly available dataset through integration of deep learning. Investig. Ophthalmol. Vis. Sci. 2016, 57, 5200–5206. [Google Scholar] [CrossRef] [Green Version]
- Nentwich, M.M.; Ulbig, M.W. Diabetic retinopathy-ocular complications of diabetes mellitus. World J. Diabetes 2015, 6, 489. [Google Scholar] [CrossRef]
- Nagy, M.; Radakovich, N.; Nazha, A. Machine learning in oncology: What should clinicians know? JCO Clin. Cancer Inform. 2020, 4, 799–810. [Google Scholar] [CrossRef]
- Ting, D.S.W.; Cheung, C.M.G.; Wong, T.Y. Diabetic retinopathy: Global prevalence, major risk factors, screening practices and public health challenges: A review. Clin. Exp. Ophthalmol. 2016, 44, 260–277. [Google Scholar] [CrossRef] [PubMed] [Green Version]
- Gulshan, V.; Rajan, R.; Widner, K.; Wu, D.; Wubbels, P.; Rhodes, T.; Whitehouse, K.; Coram, M.; Corrado, G.; Ramasamy, K.; et al. Performance of a Deep-Learning Algorithm vs Manual Grading for Detecting Diabetic Retinopathy in India. JAMA Ophthalmol. 2019, 137, 987–993. [Google Scholar] [CrossRef] [PubMed] [Green Version]
- ElTanboly, A.; Ismail, M.; Shalaby, A.; Switala, A.; El-Baz, A.; Schaal, S.; Gimel’Farb, G.; El-Azab, M.; Switala, A.; El-Bazy, A. A computer-aided diagnostic system for detecting diabetic retinopathy in optical coherence tomography images. Med. Phys. 2017, 44, 914–923. [Google Scholar] [CrossRef] [PubMed]
- Jadhav, A.S.; Patil, P.B.; Biradar, S. Computer-aided diabetic retinopathy diagnostic model using optimal thresholding merged with neural network. Int. J. Intell. Comput. Cybern. 2020, 13, 283–310. [Google Scholar] [CrossRef]
- Asiri, N.; Hussain, M.; Al Adel, F.; Alzaidi, N. Deep learning based computer-aided diagnosis systems for diabetic retinopathy: A survey. Artif. Intell. Med. 2019, 99, 101701. [Google Scholar] [CrossRef] [Green Version]
- Suma, K.G.; Kumar, V.S. A Quantitative Analysis of Histogram Equalization-Based Methods on Fundus Images for Diabetic Retinopathy Detection. In Computational Intelligence and Big Data Analytics; Springer: Singapore, 2019; pp. 55–63. [Google Scholar] [CrossRef]
- Graham, B. Kaggle Diabetic Retinopathy Detection Competition Report; University of Warwick: Coventry, UK, 2015. [Google Scholar]
- Kornblith, S.; Shlens, J.; Le, Q.V. Do better imagenet models transfer better? In Proceedings of the IEEE/CVF Conference on Computer Vision and Pattern Recognition, Long Beach, CA, USA, 15–20 June 2019; pp. 2661–2671. [Google Scholar]
- Imran, A.; Li, J.; Pei, Y.; Mokbal, F.M.; Yang, J.J.; Wang, Q. Enhanced intelligence using collective data augmentation for CNN based cataract detection. In Proceedings of the International Conference on Frontier Computing, Kyushu, Japan, 9–12 July 2019; Springer: Berlin/Heidelberg, Germany, 2019; pp. 148–160. [Google Scholar]
- Krizhevsky, A.; Sutskever, I.; Hinton, G.E. Imagenet classification with deep convolutional neural networks. Adv. Neural Inf. Process. Syst. 2012, 25, 1097–1105. [Google Scholar] [CrossRef]
- Townsend, J.T. Theoretical analysis of an alphabetic confusion matrix. Percept. Psychophys. 1971, 9, 40–50. [Google Scholar] [CrossRef]
- Rakhlin, A. Diabetic Retinopathy detection through integration of Deep Learning classification framework. BioRxiv 2018, 163, 225508. [Google Scholar]
- Sengupta, S.; Singh, A.; Zelek, J.; Lakshminarayanan, V. Cross-domain diabetic retinopathy detection using deep learning. Appl. Mach. Learn. Int. Soc. Opt. Photonics 2019, 11139, 111390V. [Google Scholar] [CrossRef]
- Gulshan, V.; Peng, L.; Coram, M.; Stumpe, M.C.; Wu, D.; Narayanaswamy, A.; Venugopalan, S.; Widner, K.; Madams, T.; Cuadros, J.; et al. Development and validation of a deep learning algorithm for detection of diabetic retinopathy in retinal fundus photographs. JAMA 2016, 316, 2402–2410. [Google Scholar] [CrossRef] [PubMed]
- Chang, K.; Balachandar, N.; Lam, C.K.; Yi, D.; Brown, J.; Beers, A.; Rosen, B.R.; Rubin, D.L.; Kalpathy-Cramer, J. Distributed deep learning networks among institutions for medical imaging. J. Am. Med. Inform. Assoc. 2018, 25, 945–954. [Google Scholar] [CrossRef] [Green Version]
- Wan, S.; Liang, Y.; Zhang, Y. Deep convolutional neural networks for diabetic retinopathy detection by image classification. Comput. Electr. Eng. 2018, 72, 274–282. [Google Scholar] [CrossRef]
- Gargeya, R.; Leng, T. Automated Identification of Diabetic Retinopathy Using Deep Learning. Ophthalmology 2017, 124, 962–969. [Google Scholar] [CrossRef] [PubMed]
- Zeng, X.; Chen, H.; Luo, Y.; Ye, W. Automated Diabetic Retinopathy Detection Based on Binocular Siamese-Like Convolutional Neural Network. IEEE Access 2019, 7, 30744–30753. [Google Scholar] [CrossRef]
- Zhang, W.; Zhong, J.; Yang, S.; Gao, Z.; Hu, J.; Chen, Y.; Yi, Z. Automated identification and grading system of diabetic reti-nopathy using deep neural networks. Knowl. Based Syst. 2019, 175, 12–25. [Google Scholar] [CrossRef]
- Lin, G.M.; Chen, M.J.; Yeh, C.H.; Lin, Y.Y.; Kuo, H.Y.; Lin, M.H.; Chen, M.C.; Lin, S.D.; Gao, Y.; Ran, A.; et al. Transforming retinal photographs to entropy images in deep learning to improve automated detection for diabetic retinopathy. J. Ophthalmol. 2018, 2018, 2159702. [Google Scholar] [CrossRef] [PubMed] [Green Version]
- Li, Z.; Keel, S.; Liu, C.; He, Y.; Meng, W.; Scheetz, J.; Lee, P.Y.; Shaw, J.; Ting, D.; Wong, T.Y.; et al. An automated grading system for detection of vision-threatening referable diabetic retinopathy on the basis of color fundus photographs. Diabetes Care 2018, 41, 2509–2516. [Google Scholar] [CrossRef] [PubMed] [Green Version]
- Seth, S.; Agarwal, B. A hybrid deep learning model for detecting diabetic retinopathy. J. Stat. Manag. Syst. 2018, 21, 569–574. [Google Scholar] [CrossRef]
- Keel, S.; Lee, P.Y.; Scheetz, J.; Li, Z.; Kotowicz, M.A.; MacIsaac, R.J.; He, M. Feasibility and patient acceptability of a novel artificial intelligence-based screening model for diabetic retinopathy at endocrinology outpatient ser-vices: A pilot study. Sci. Rep. 2018, 8, 4330. [Google Scholar] [CrossRef]


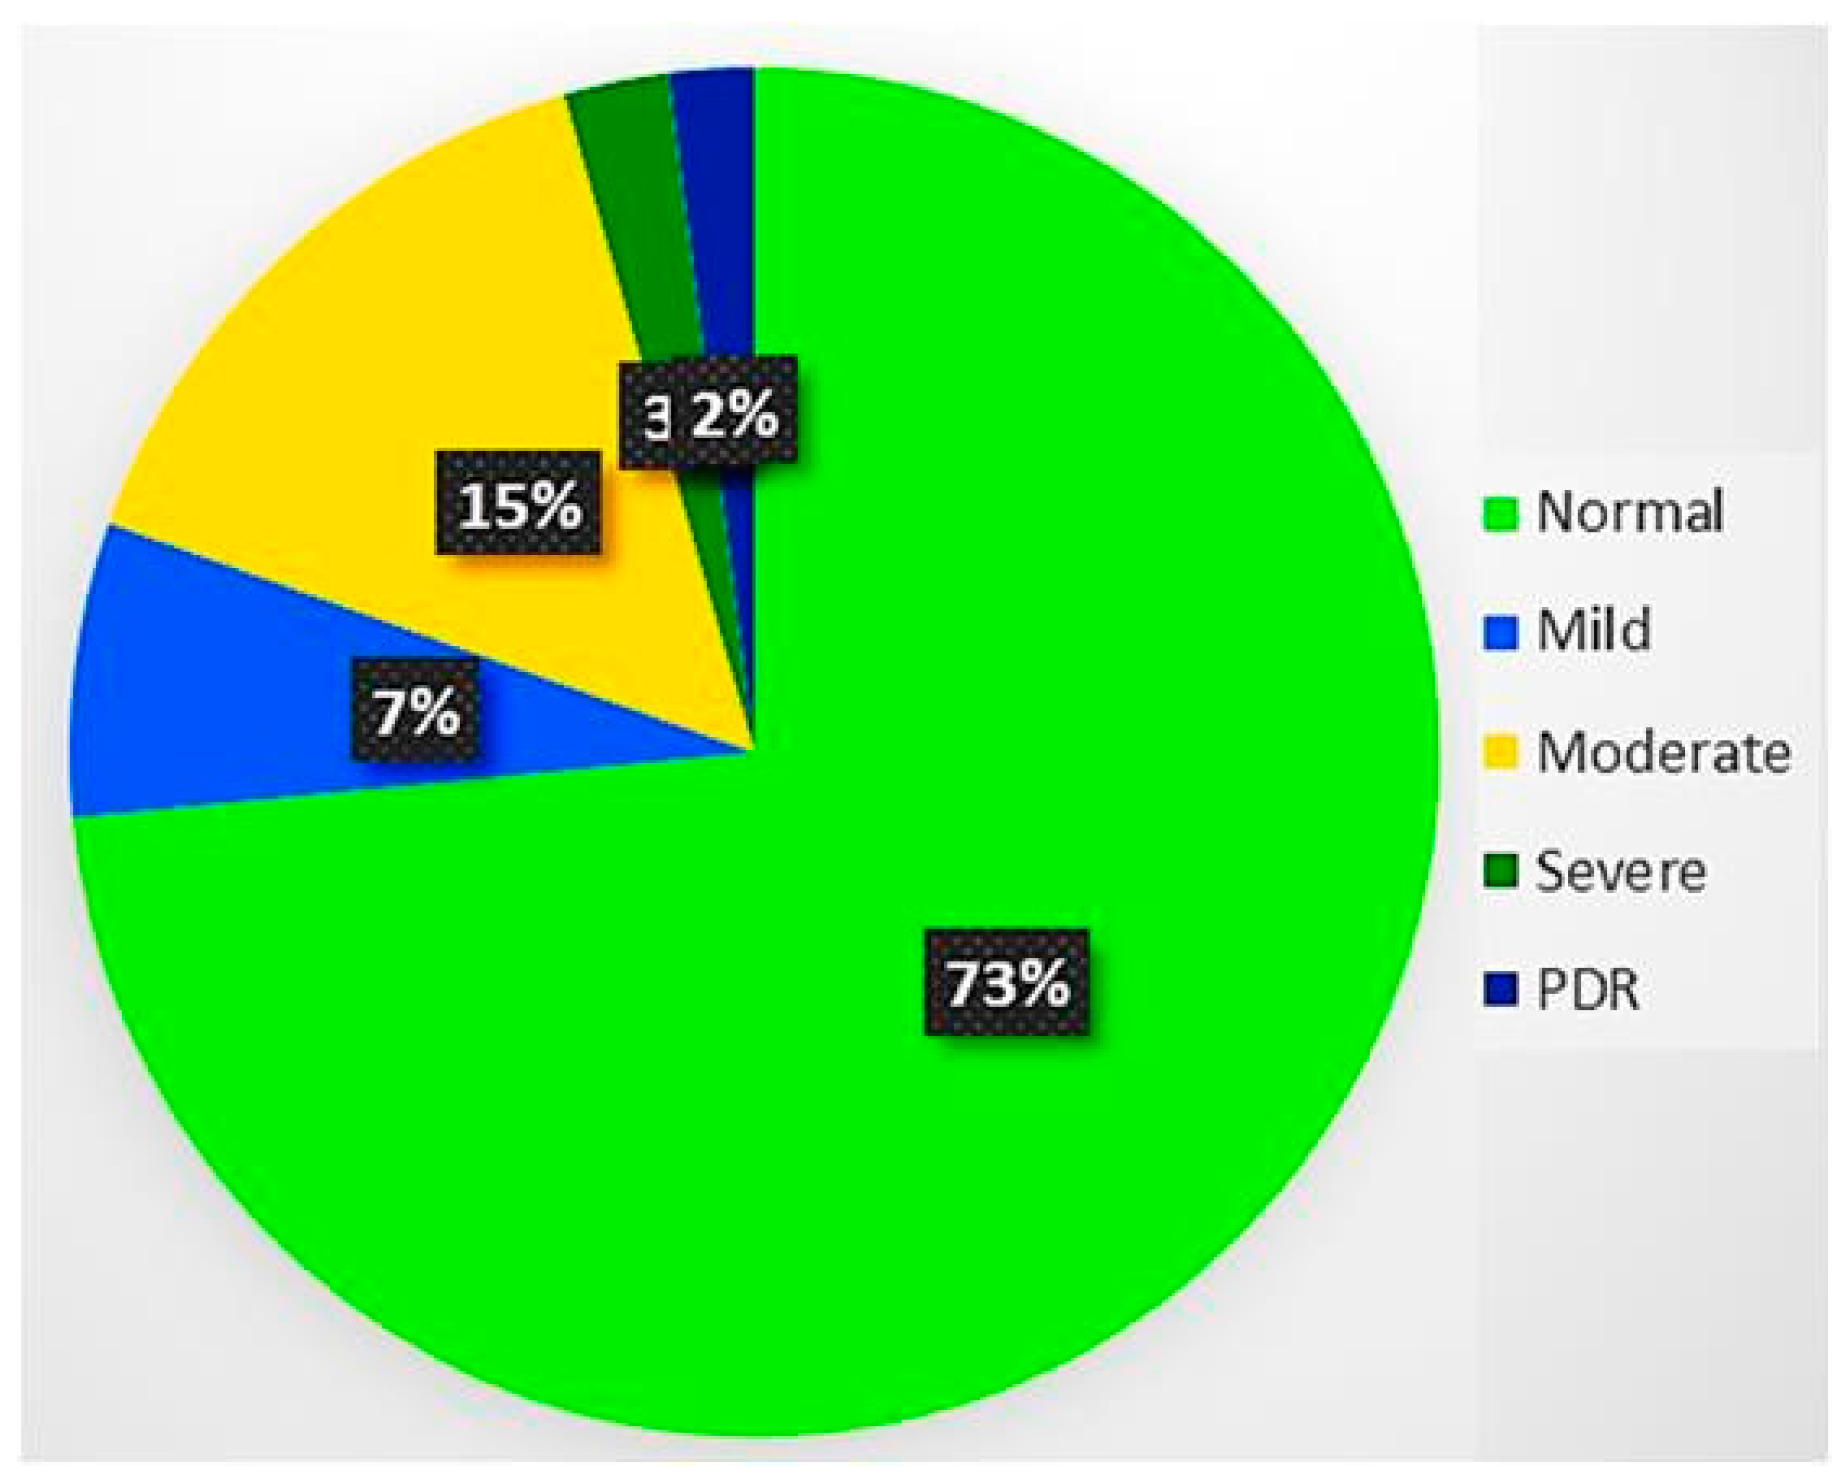
| Grade | Severity | No. of Images | % of Total Images |
|---|---|---|---|
| 0 | Normal | 25,810 | 73.15 |
| 1 | Mild | 2443 | 6.96 |
| 2 | Moderate | 5292 | 15.07 |
| 3 | Severe | 873 | 2.81 |
| 4 | PDR | 708 | 2.01 |
| Total | 35,126 | 100% |
| Grade | Severity | No. of Images | Operations | Augmented Images |
|---|---|---|---|---|
| 0 | Normal | 25,810 | 0 | 25,810 |
| 1 | Mild | 2443 | 11 | 24,430 |
| 2 | Moderate | 5292 | 5 | 26,460 |
| 3 | Severe | 873 | 29 | 25,317 |
| 4 | PDR | 708 | 36 | 25,488 |
| Total | 35,126 | 127,505 |
| Sr. No. | Layer Type | Kernel Size and Number | Stride | Output |
|---|---|---|---|---|
| 1 | input | — | — | (512,512,3) |
| 2 | conv 1_1 | 3 × 3 × 32 | 2 | (256,256,32) |
| 3 | conv 1_2 | 3 × 3 × 32 | 1 | (255,255,32) |
| 4 | max-pooling | 2 × 2 | 2 | (127,127,32) |
| 5 | conv 2_1 | 3 × 3 × 64 | 1 | (63,63,64) |
| 6 | conv 2_2 | 3 × 3 × 64 | 1 | (64,64,64) |
| 7 | max-pooling | 2 × 2 | 2 | (32,32,64) |
| 8 | conv 3_1 | 3 × 3 × 128 | 1 | (32,32,128) |
| 9 | conv 3_2 | 3 × 3 × 128 | 1 | (33,33,128) |
| 10 | conv 3_3 | 3 × 3 × 128 | 1 | (34,34,128) |
| 11 | max-pooling | 2 × 2 | 2 | (17,17,128) |
| 12 | conv 4_1 | 3 × 3 × 256 | 1 | (9,9,256) |
| 13 | conv 4_2 | 3 × 3 × 256 | 1 | (10,10,256) |
| 14 | conv 4_3 | 3 × 3 × 256 | 1 | (11,11,256) |
| 15 | max-pooling | 2 × 2 | 2 | (6,6,256) |
| 16 | conv 5_1 | 3 × 3 × 512 | 1 | (6,6,512) |
| 17 | conv 5_2 | 3 × 3 × 512 | 1 | (5,5,512) |
| 18 | conv 5_3 | 3 × 3 × 512 | 1 | (4,4,512) |
| 19 | max-pooling | 2 × 2 | 2 | (2,2,512) |
| 20 | fully connected | 1024 | — | −1024 |
| 21 | fully connected | 1024 | — | −1024 |
| 22 | fully connected | 1 | — | −1 |
| Sr. No. | Hyperparameters | Value |
|---|---|---|
| 1 | Learning Rate | 0.0001 |
| 2 | Batch Size | 32 |
| 3 | Activation Function | ReLU |
| 4 | Epochs | 300 |
| 5 | Optimizer | Adam |
| 6 | Momentum | 0.9 |
| 7 | Loss Function | Categorical Cross-Entropy |
| Sr. No | Architecture | Sensitivity | Specificity | Accuracy | Precision | F1-Score | AUC |
|---|---|---|---|---|---|---|---|
| 1 | ResNet | 0.854 | 0.943 | 0.924 | 0.977 | 0.918 | 0.924 |
| 2 | GoogLeNet | 0.895 | 0.989 | 0.937 | 0.99 | 0.939 | 0.935 |
| 3 | AlexNet | 0.953 | 0.938 | 0.946 | 0.937 | 0.945 | 0.949 |
| 4 | VGGNet | 0.949 | 0.984 | 0.966 | 0.985 | 0.967 | 0.971 |
| Sr. No. | Dataset | Accuracy | AUC |
|---|---|---|---|
| 1 | Original | 0.936 | 0.954 |
| 2 | Augmented | 0.966 | 0.971 |
| Sr. No. | Grade | Severity | Original Images | Augmented Images | Training | Validation |
|---|---|---|---|---|---|---|
| 1 | 0 | Normal | 25,810 | 25,810 | 20,648 | 5162 |
| 2 | 1 | Mild | 2443 | 24,430 | 19,544 | 4886 |
| 3 | 2 | Moderate | 5292 | 26,460 | 21,168 | 5292 |
| 4 | 3 | Severe | 873 | 25,317 | 20,254 | 5063 |
| 5 | 4 | PDR | 708 | 25,488 | 20,390 | 5098 |
| Total | 35,126 | 127,505 | 102,004 | 25,501 |
| DR | Normal | |
|---|---|---|
| Identified as having DR | TP | FP |
| Identified as having no DR | FN | TN |
| Reference # | Author | Year | Model | Target | Accuracy |
|---|---|---|---|---|---|
| [23] | Rakhlin | 2018 | CNN | DR | 85.3 |
| [24] | Sengupta et al. | 2019 | CNN | DR | 90.4 |
| [25] | Gulshan et al. | 2016 | CNN | DR | 91.7 |
| [26] | Chang | 2018 | CNN | DR | 78.7 |
| [27] | Wan | 2018 | CNN | rDR | 95.68 |
| [28] | Gargeya | 2017 | CNN | DR | 95.03 |
| [29] | Zeng | 2019 | CNN | rDR | 82.2 |
| [30] | Zhang | 2019 | CNN | rDR | 87.06 |
| [31] | Lin | 2018 | CNN | DR | 86.10 |
| [32] | Li | 2018 | DCNN | vtDR | 86.04 |
| [33] | Seth | 2018 | CNN | rDR | 84.36 |
| [34] | Keel | 2018 | Third-party DL algorithm | rDR | 89.08 |
| Proposed Method | CNN | DR | 96.6 |
Publisher’s Note: MDPI stays neutral with regard to jurisdictional claims in published maps and institutional affiliations. |
© 2022 by the authors. Licensee MDPI, Basel, Switzerland. This article is an open access article distributed under the terms and conditions of the Creative Commons Attribution (CC BY) license (https://creativecommons.org/licenses/by/4.0/).
Share and Cite
Jabbar, M.K.; Yan, J.; Xu, H.; Ur Rehman, Z.; Jabbar, A. Transfer Learning-Based Model for Diabetic Retinopathy Diagnosis Using Retinal Images. Brain Sci. 2022, 12, 535. https://doi.org/10.3390/brainsci12050535
Jabbar MK, Yan J, Xu H, Ur Rehman Z, Jabbar A. Transfer Learning-Based Model for Diabetic Retinopathy Diagnosis Using Retinal Images. Brain Sciences. 2022; 12(5):535. https://doi.org/10.3390/brainsci12050535
Chicago/Turabian StyleJabbar, Muhammad Kashif, Jianzhuo Yan, Hongxia Xu, Zaka Ur Rehman, and Ayesha Jabbar. 2022. "Transfer Learning-Based Model for Diabetic Retinopathy Diagnosis Using Retinal Images" Brain Sciences 12, no. 5: 535. https://doi.org/10.3390/brainsci12050535