
Relationship between Behavioral and Objective Measures of Sound Intensity in Normal-Hearing Listeners and Hearing-Aid Users: A Pilot Study

Abstract
:1. Introduction
2. Methods
2.1. Participants
2.2. Hearing Aids
2.3. Procedure
2.3.1. Categorical Loudness Scaling
2.3.2. Cortical Auditory Evoked Potentials (CAEPs)
Stimuli
Electroencephalogram (EEG) Data Recording
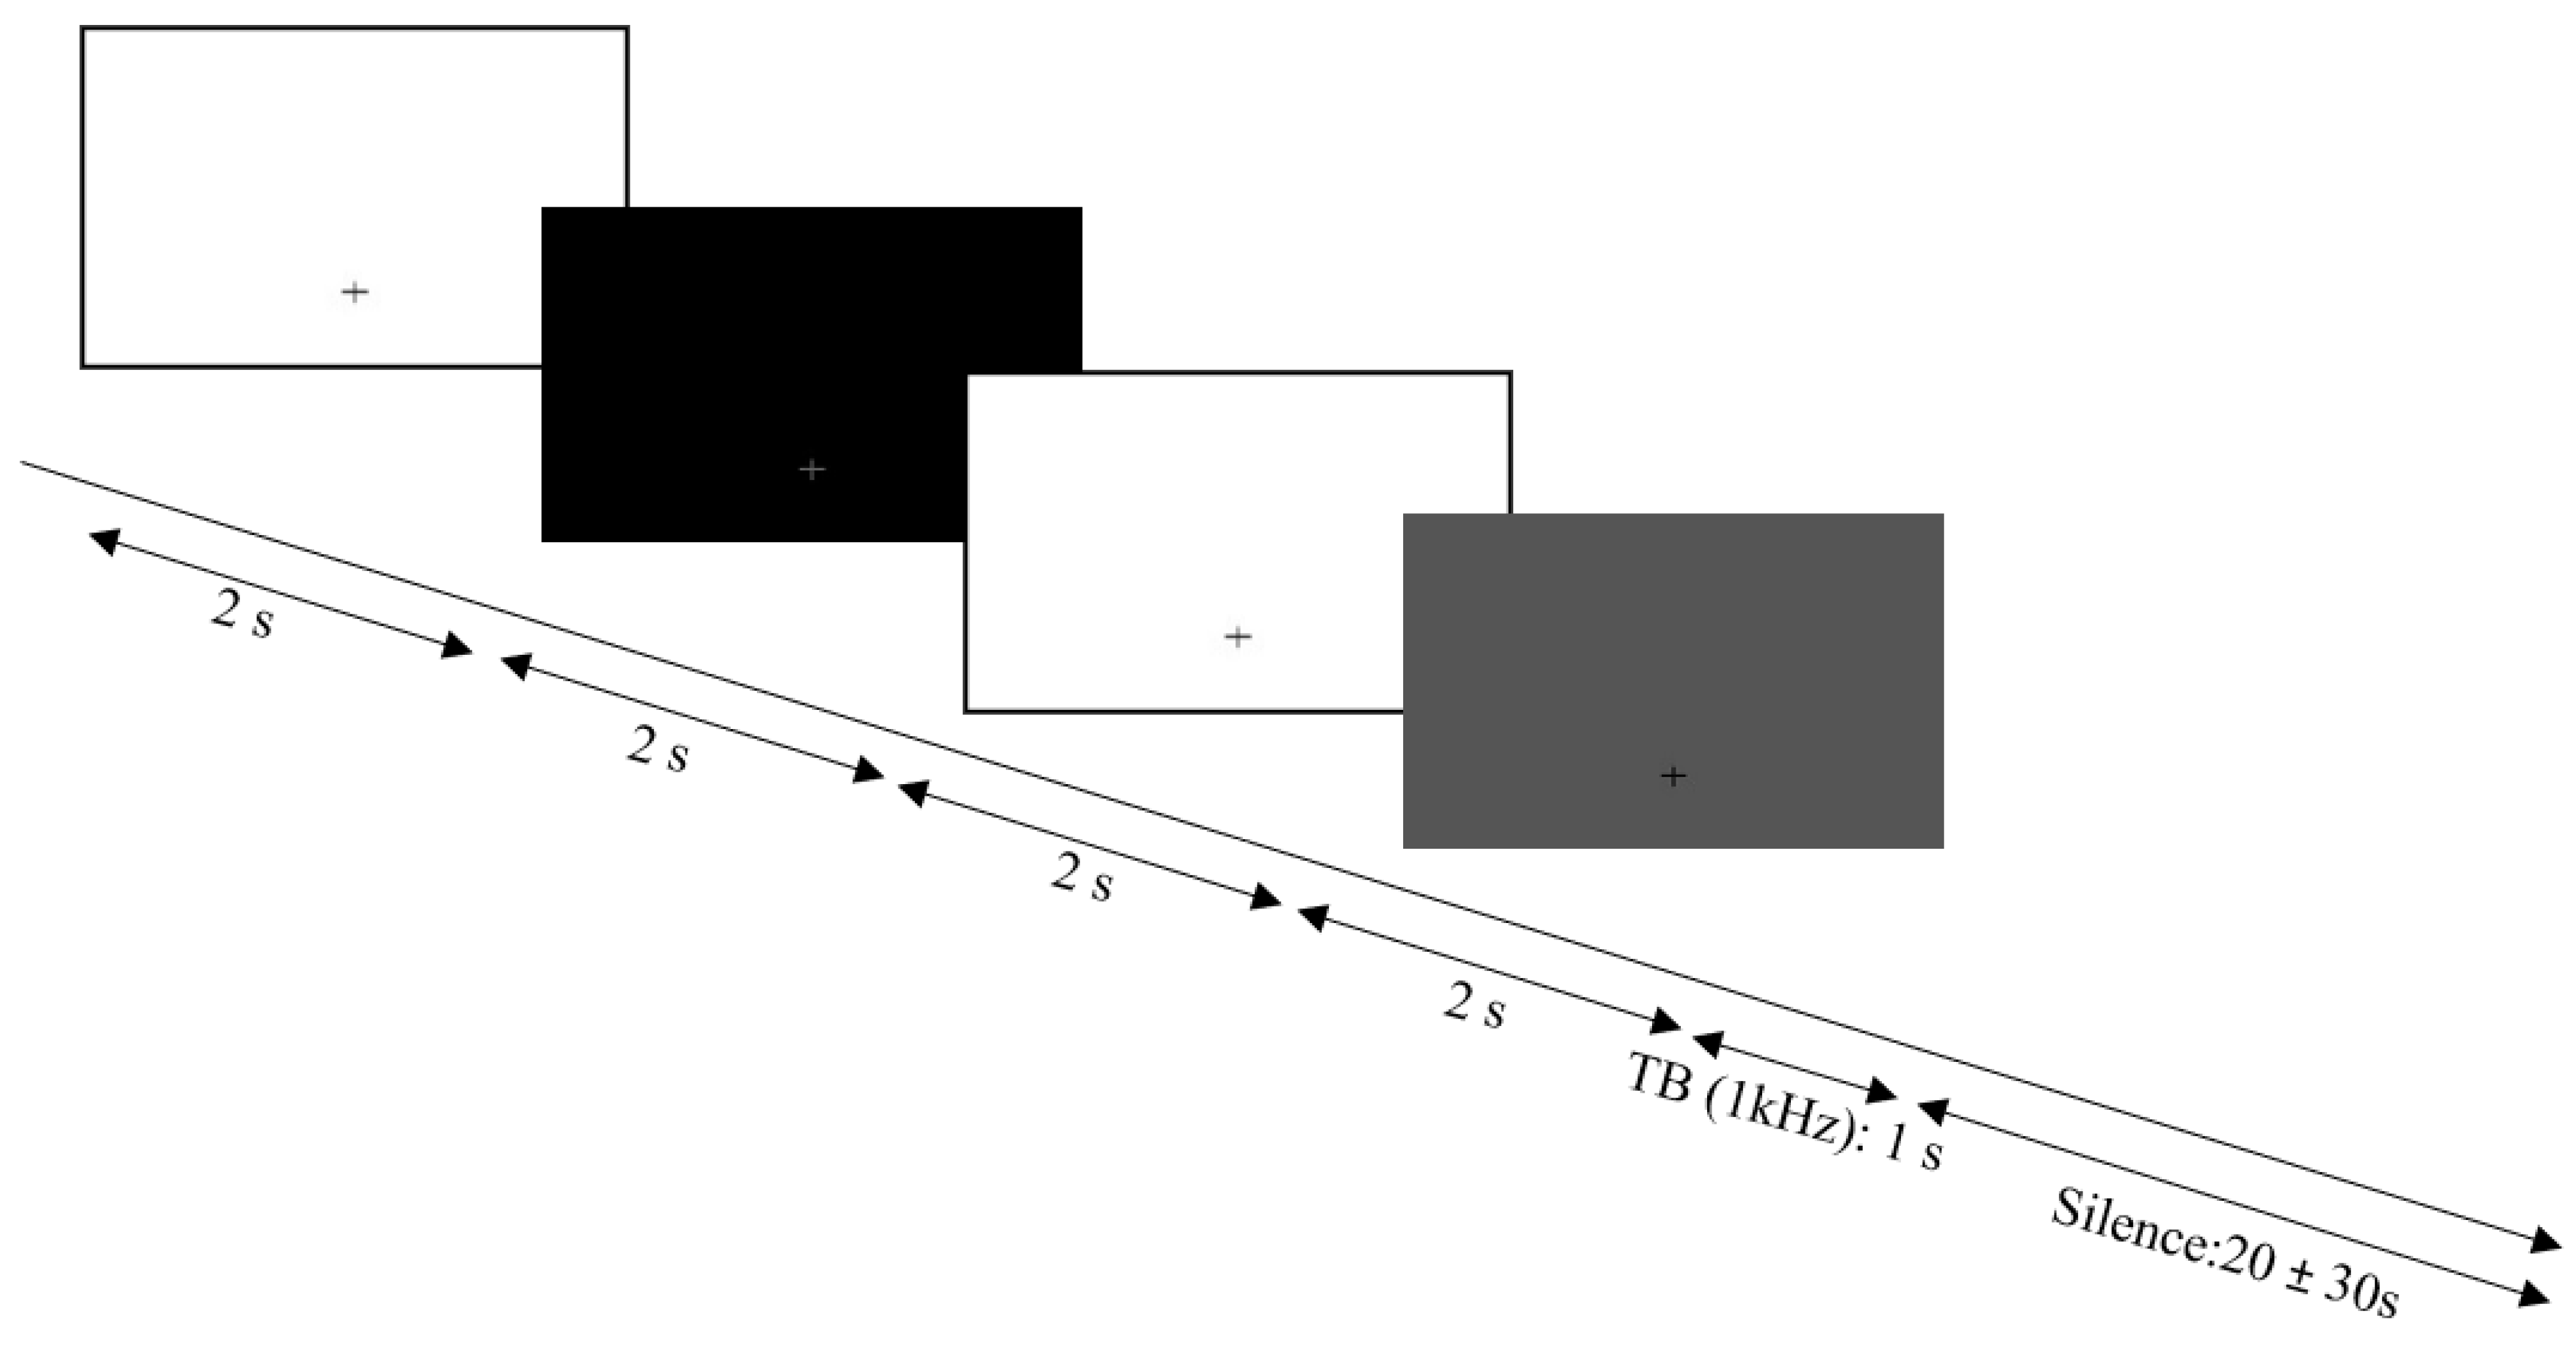
2.4. Pupillometry
2.4.1. Stimuli
2.4.2. Data Recording
2.5. Analysis
Statistical Analyses
3. Results
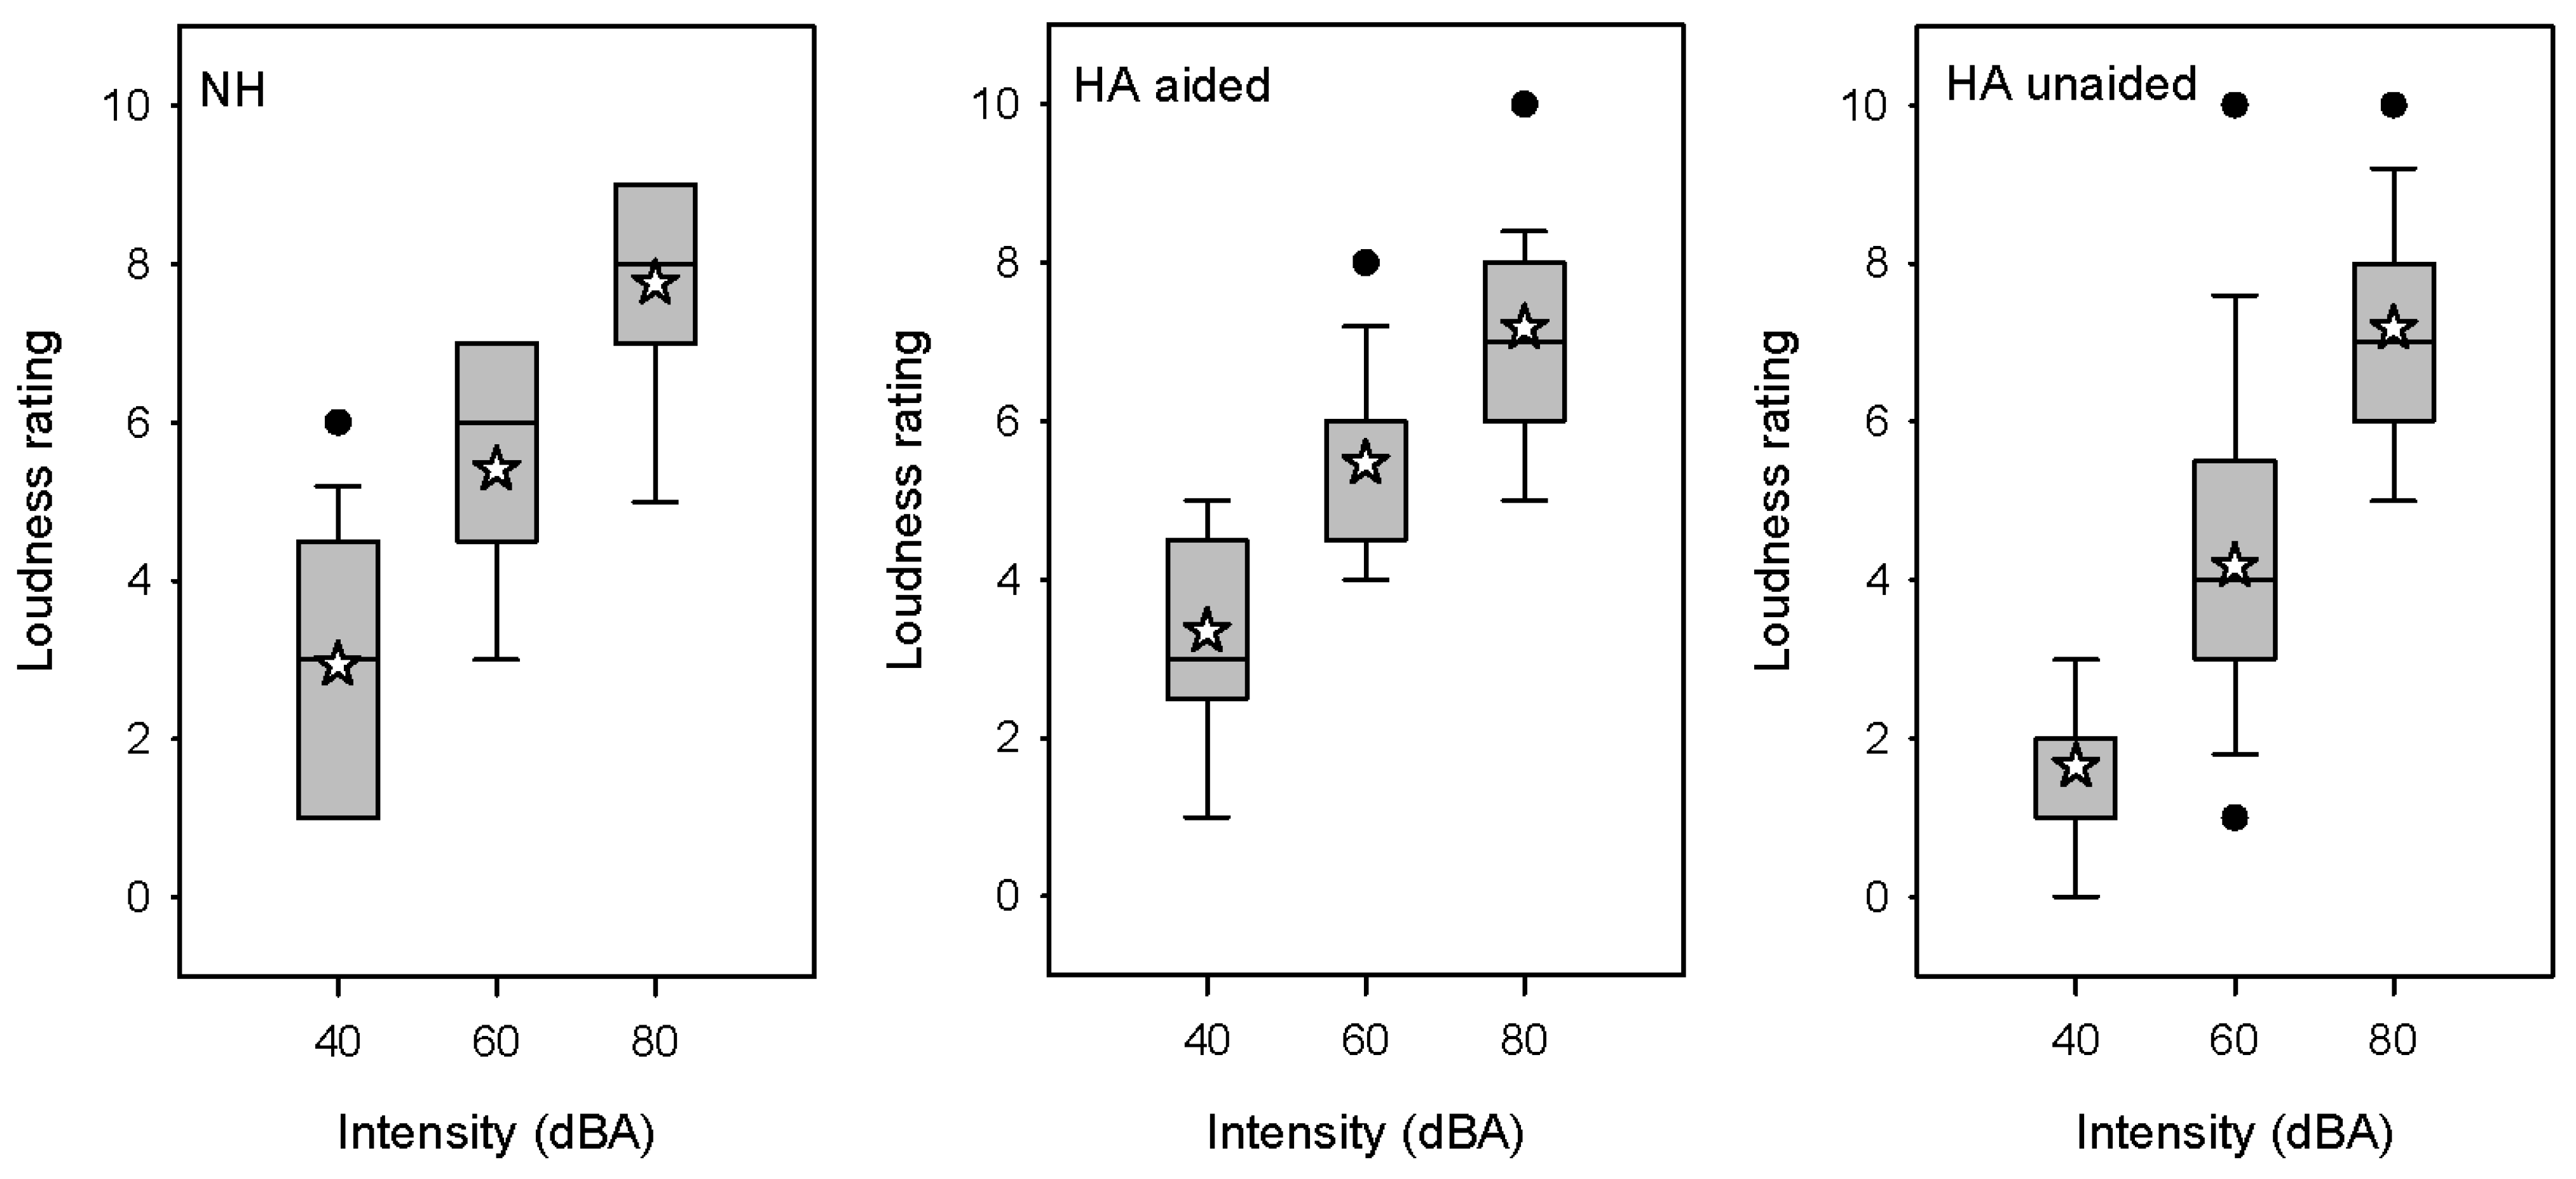
3.1. Categorical Loudness Scaling
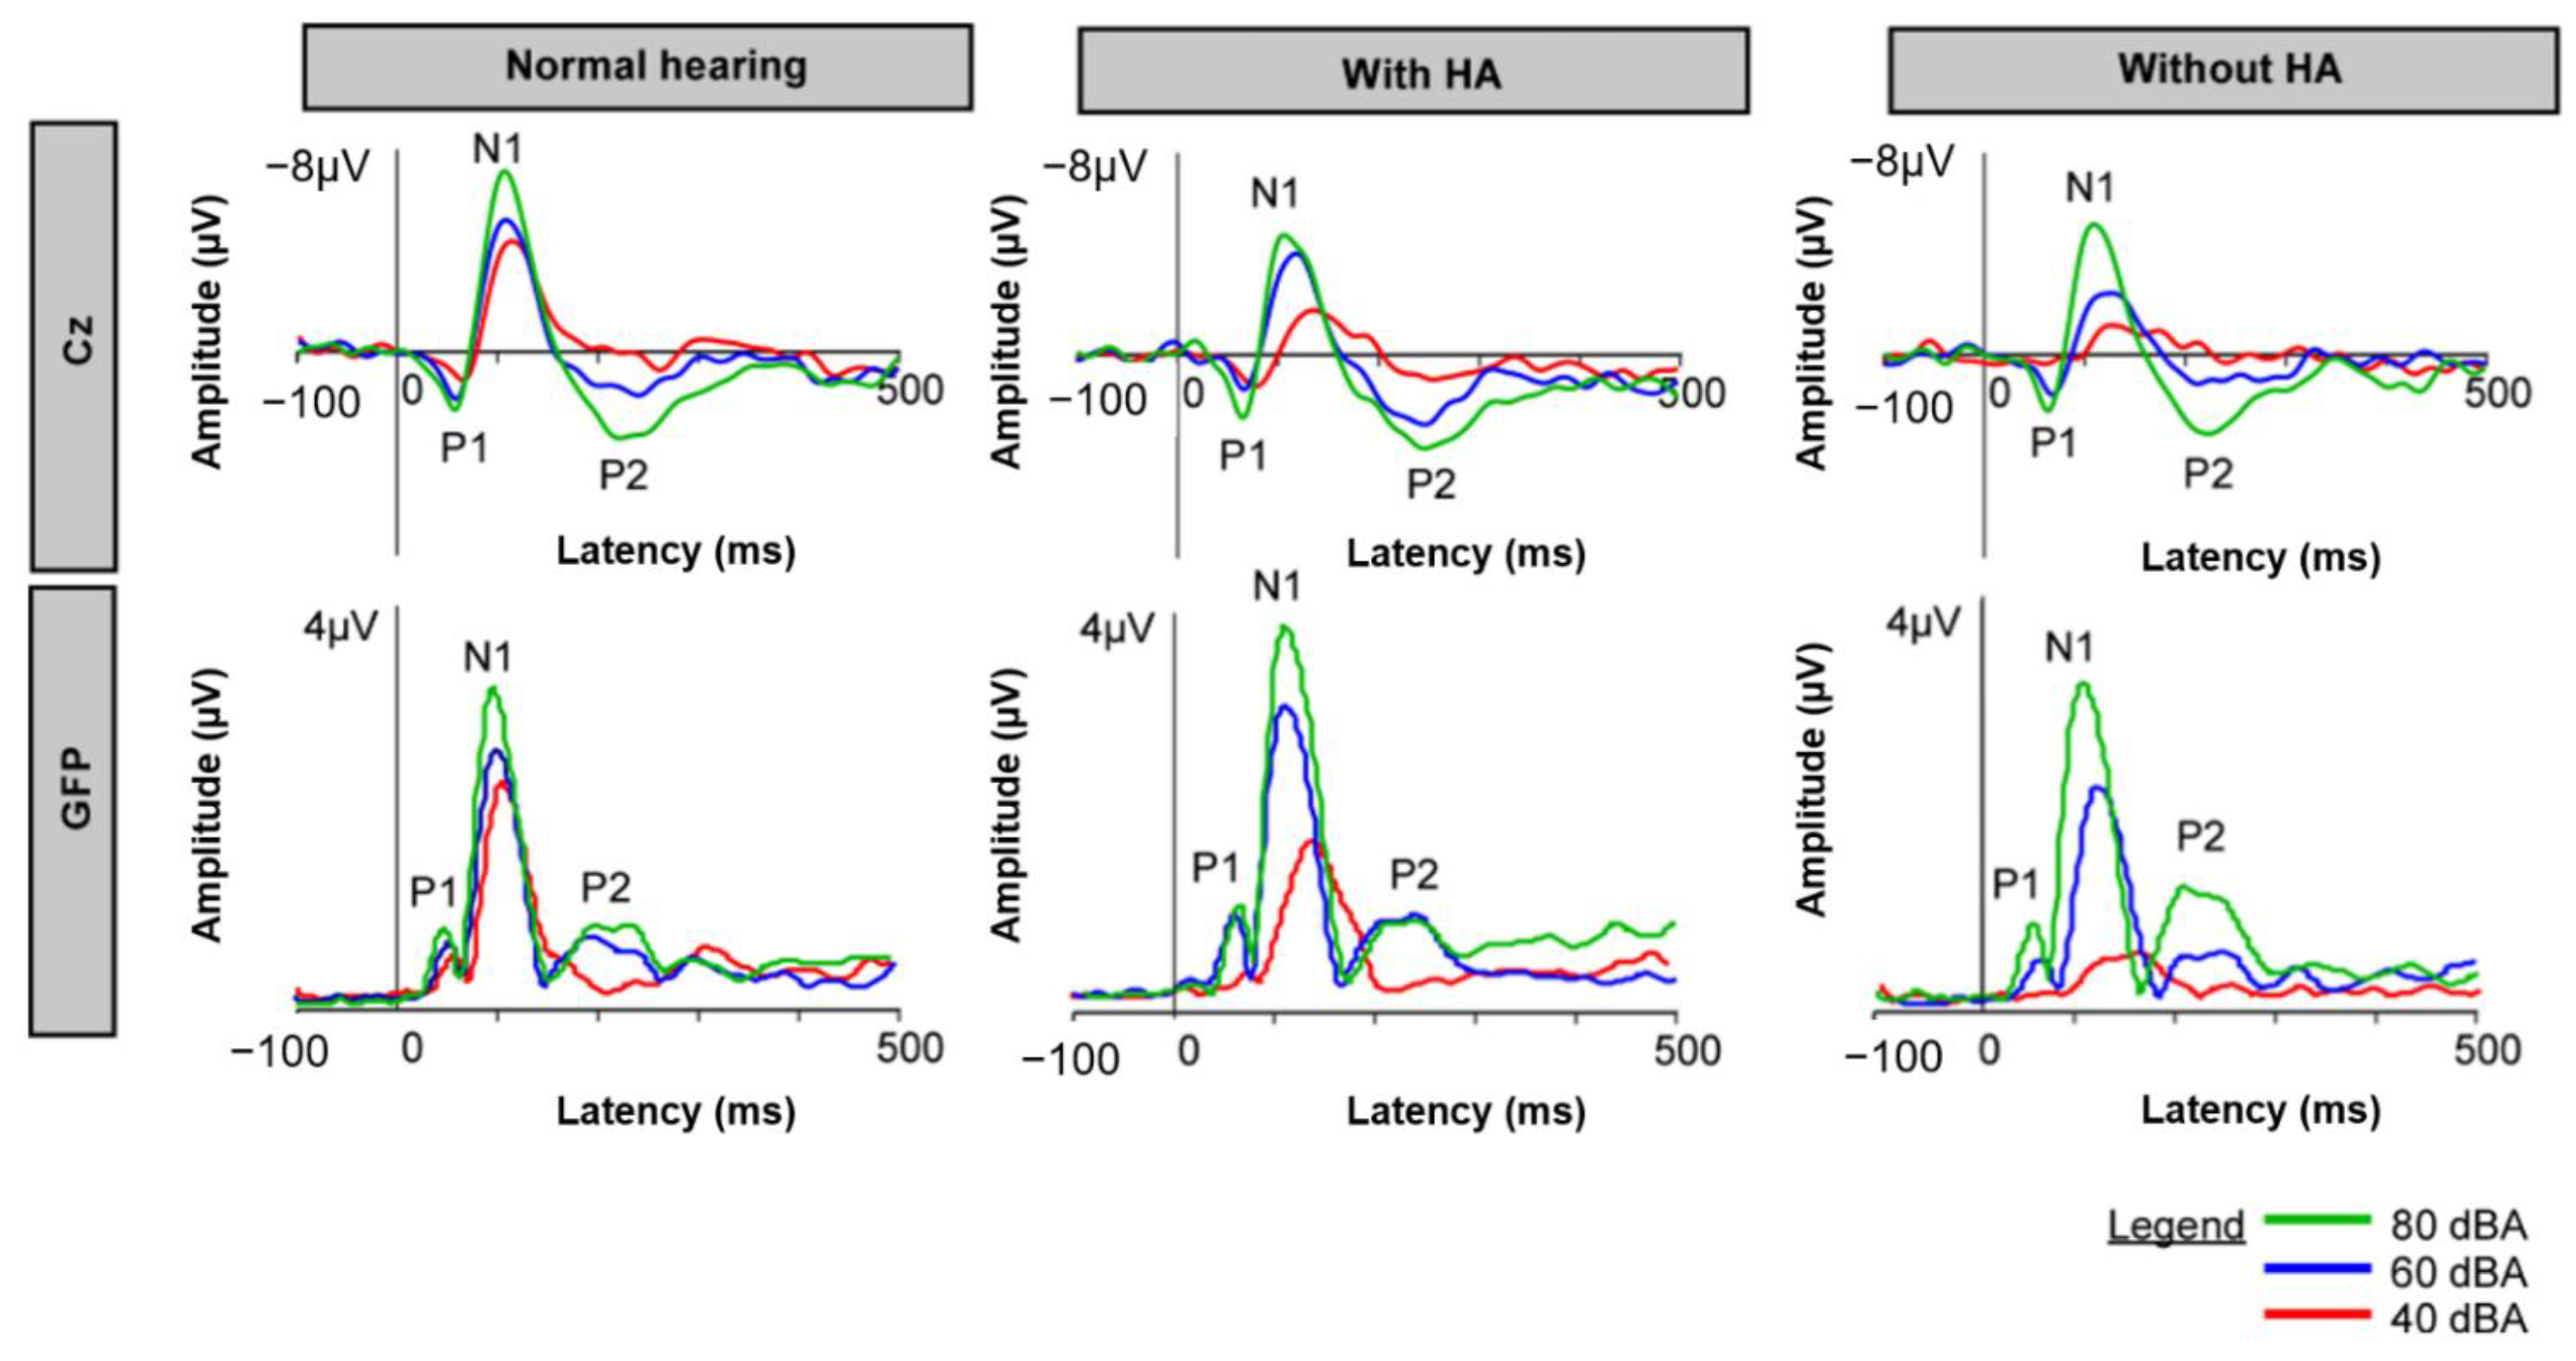
3.2. CAEPs
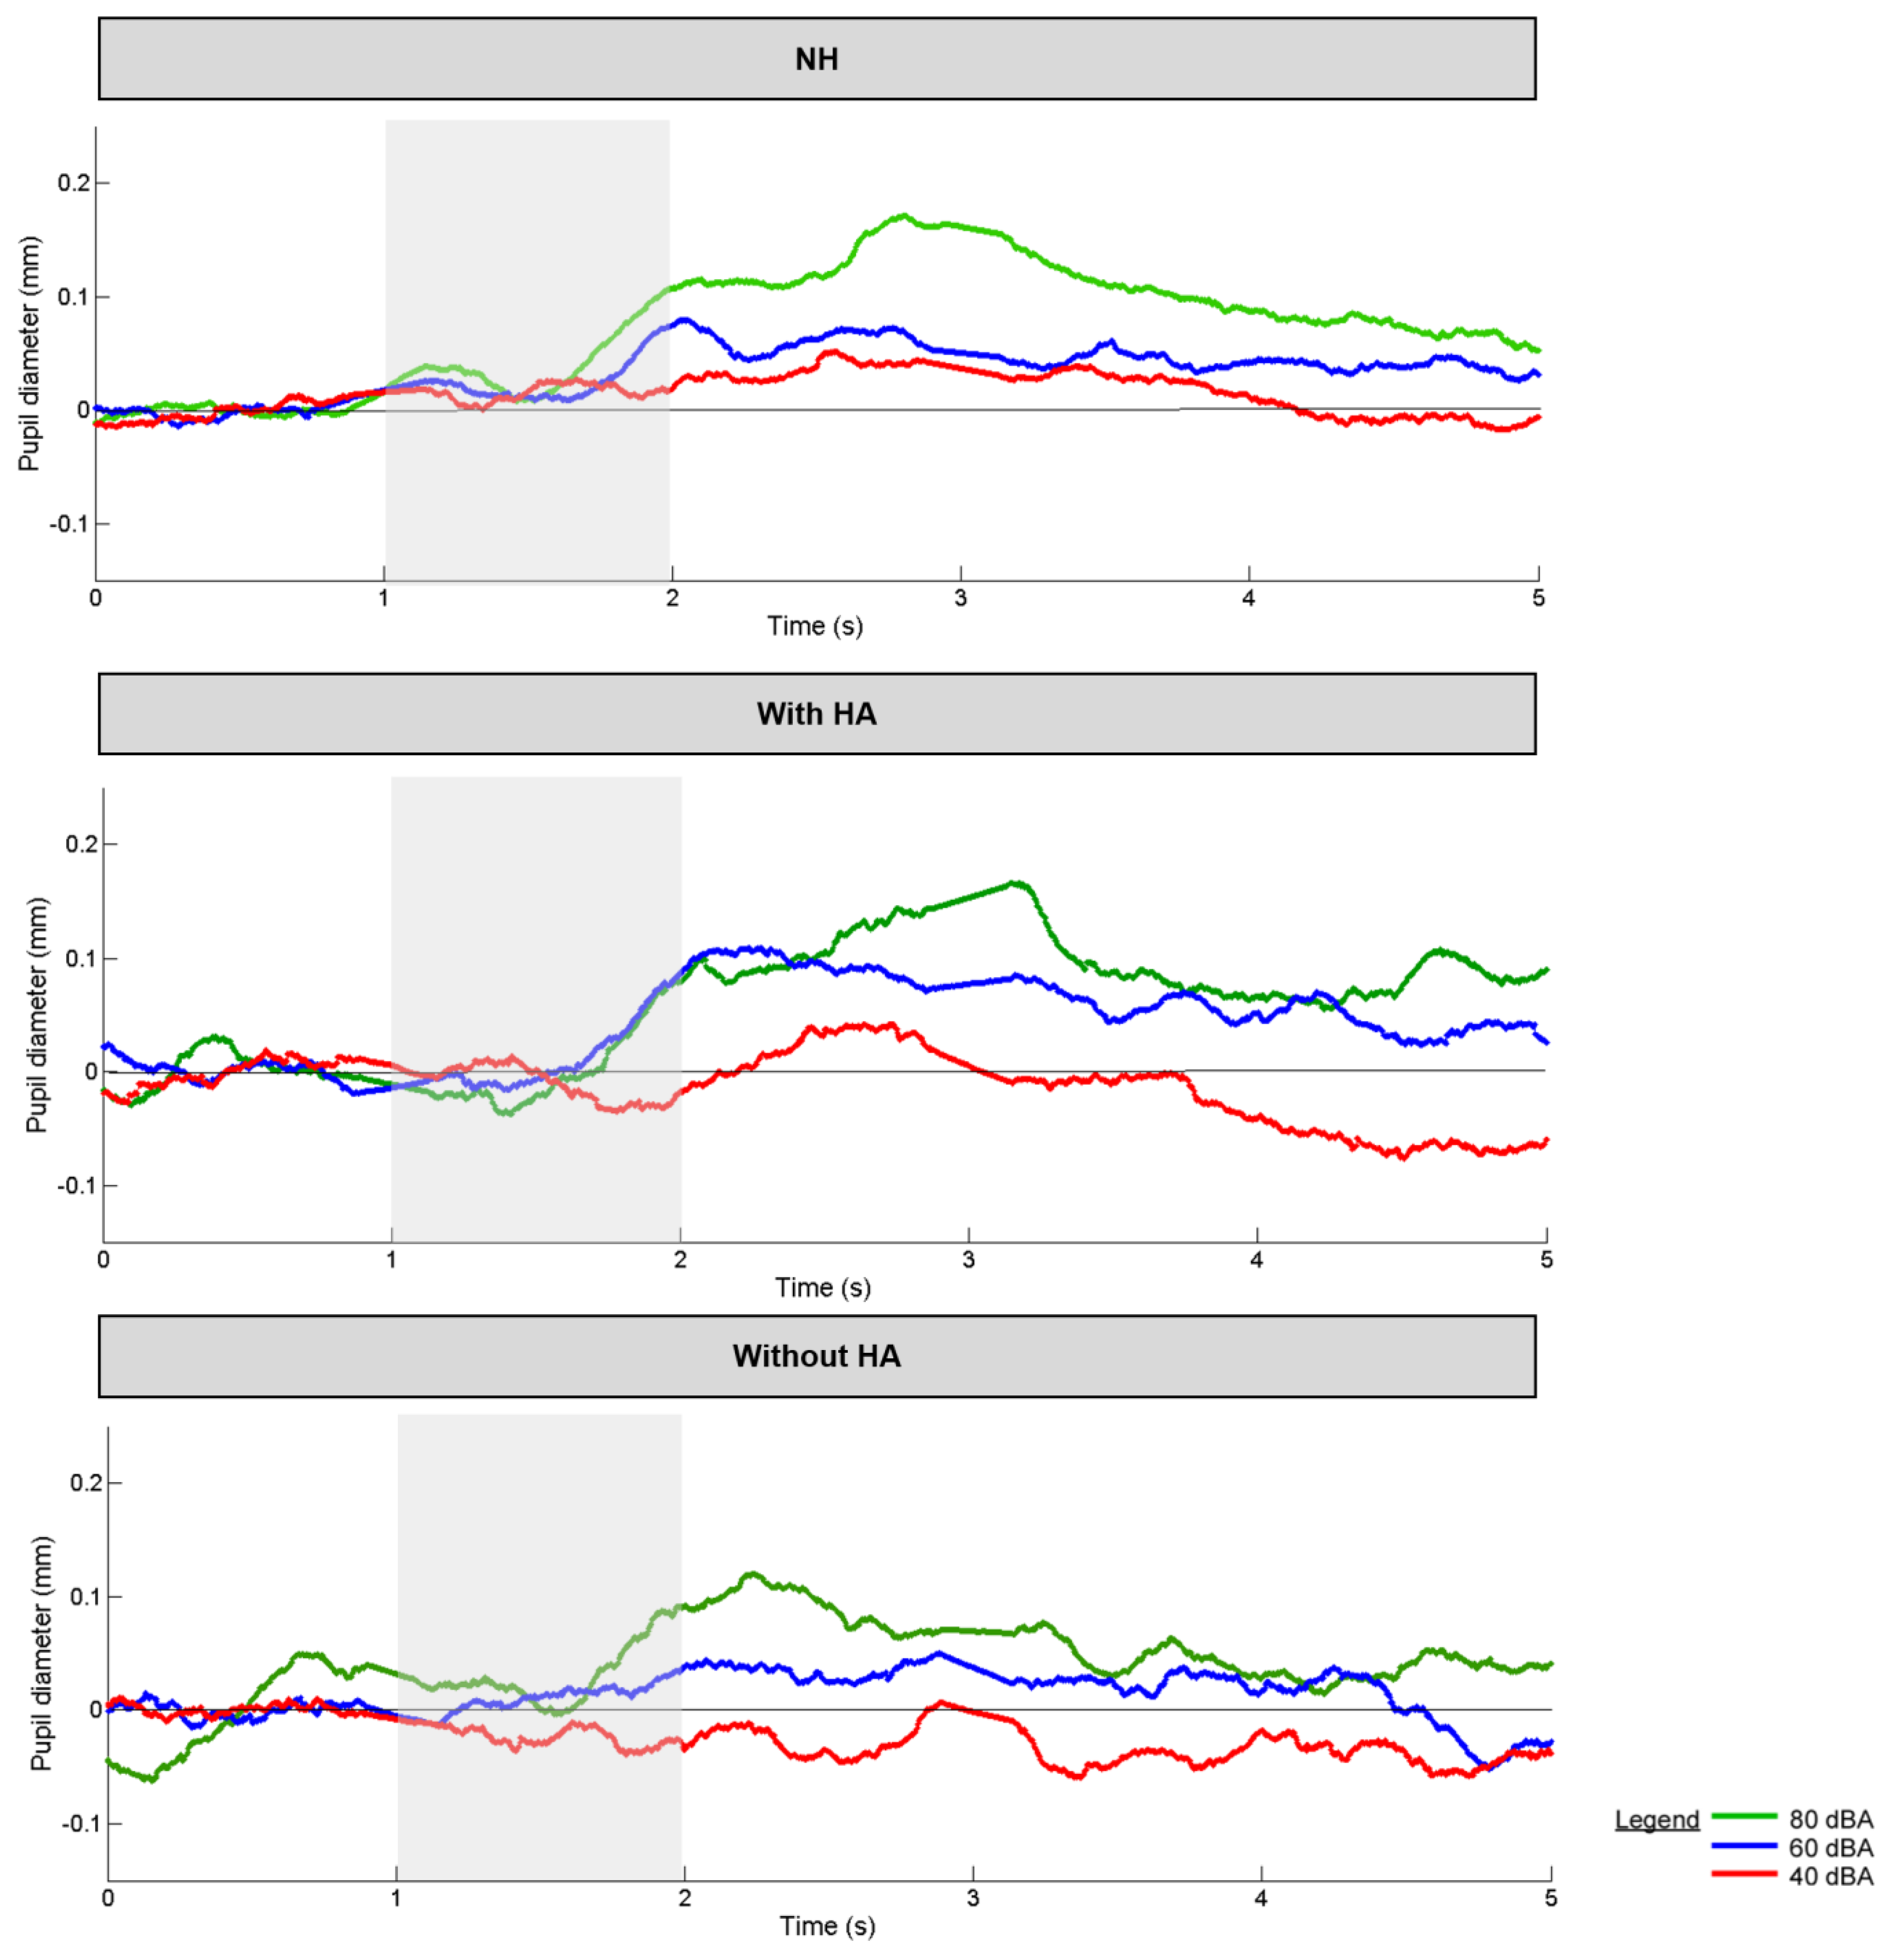
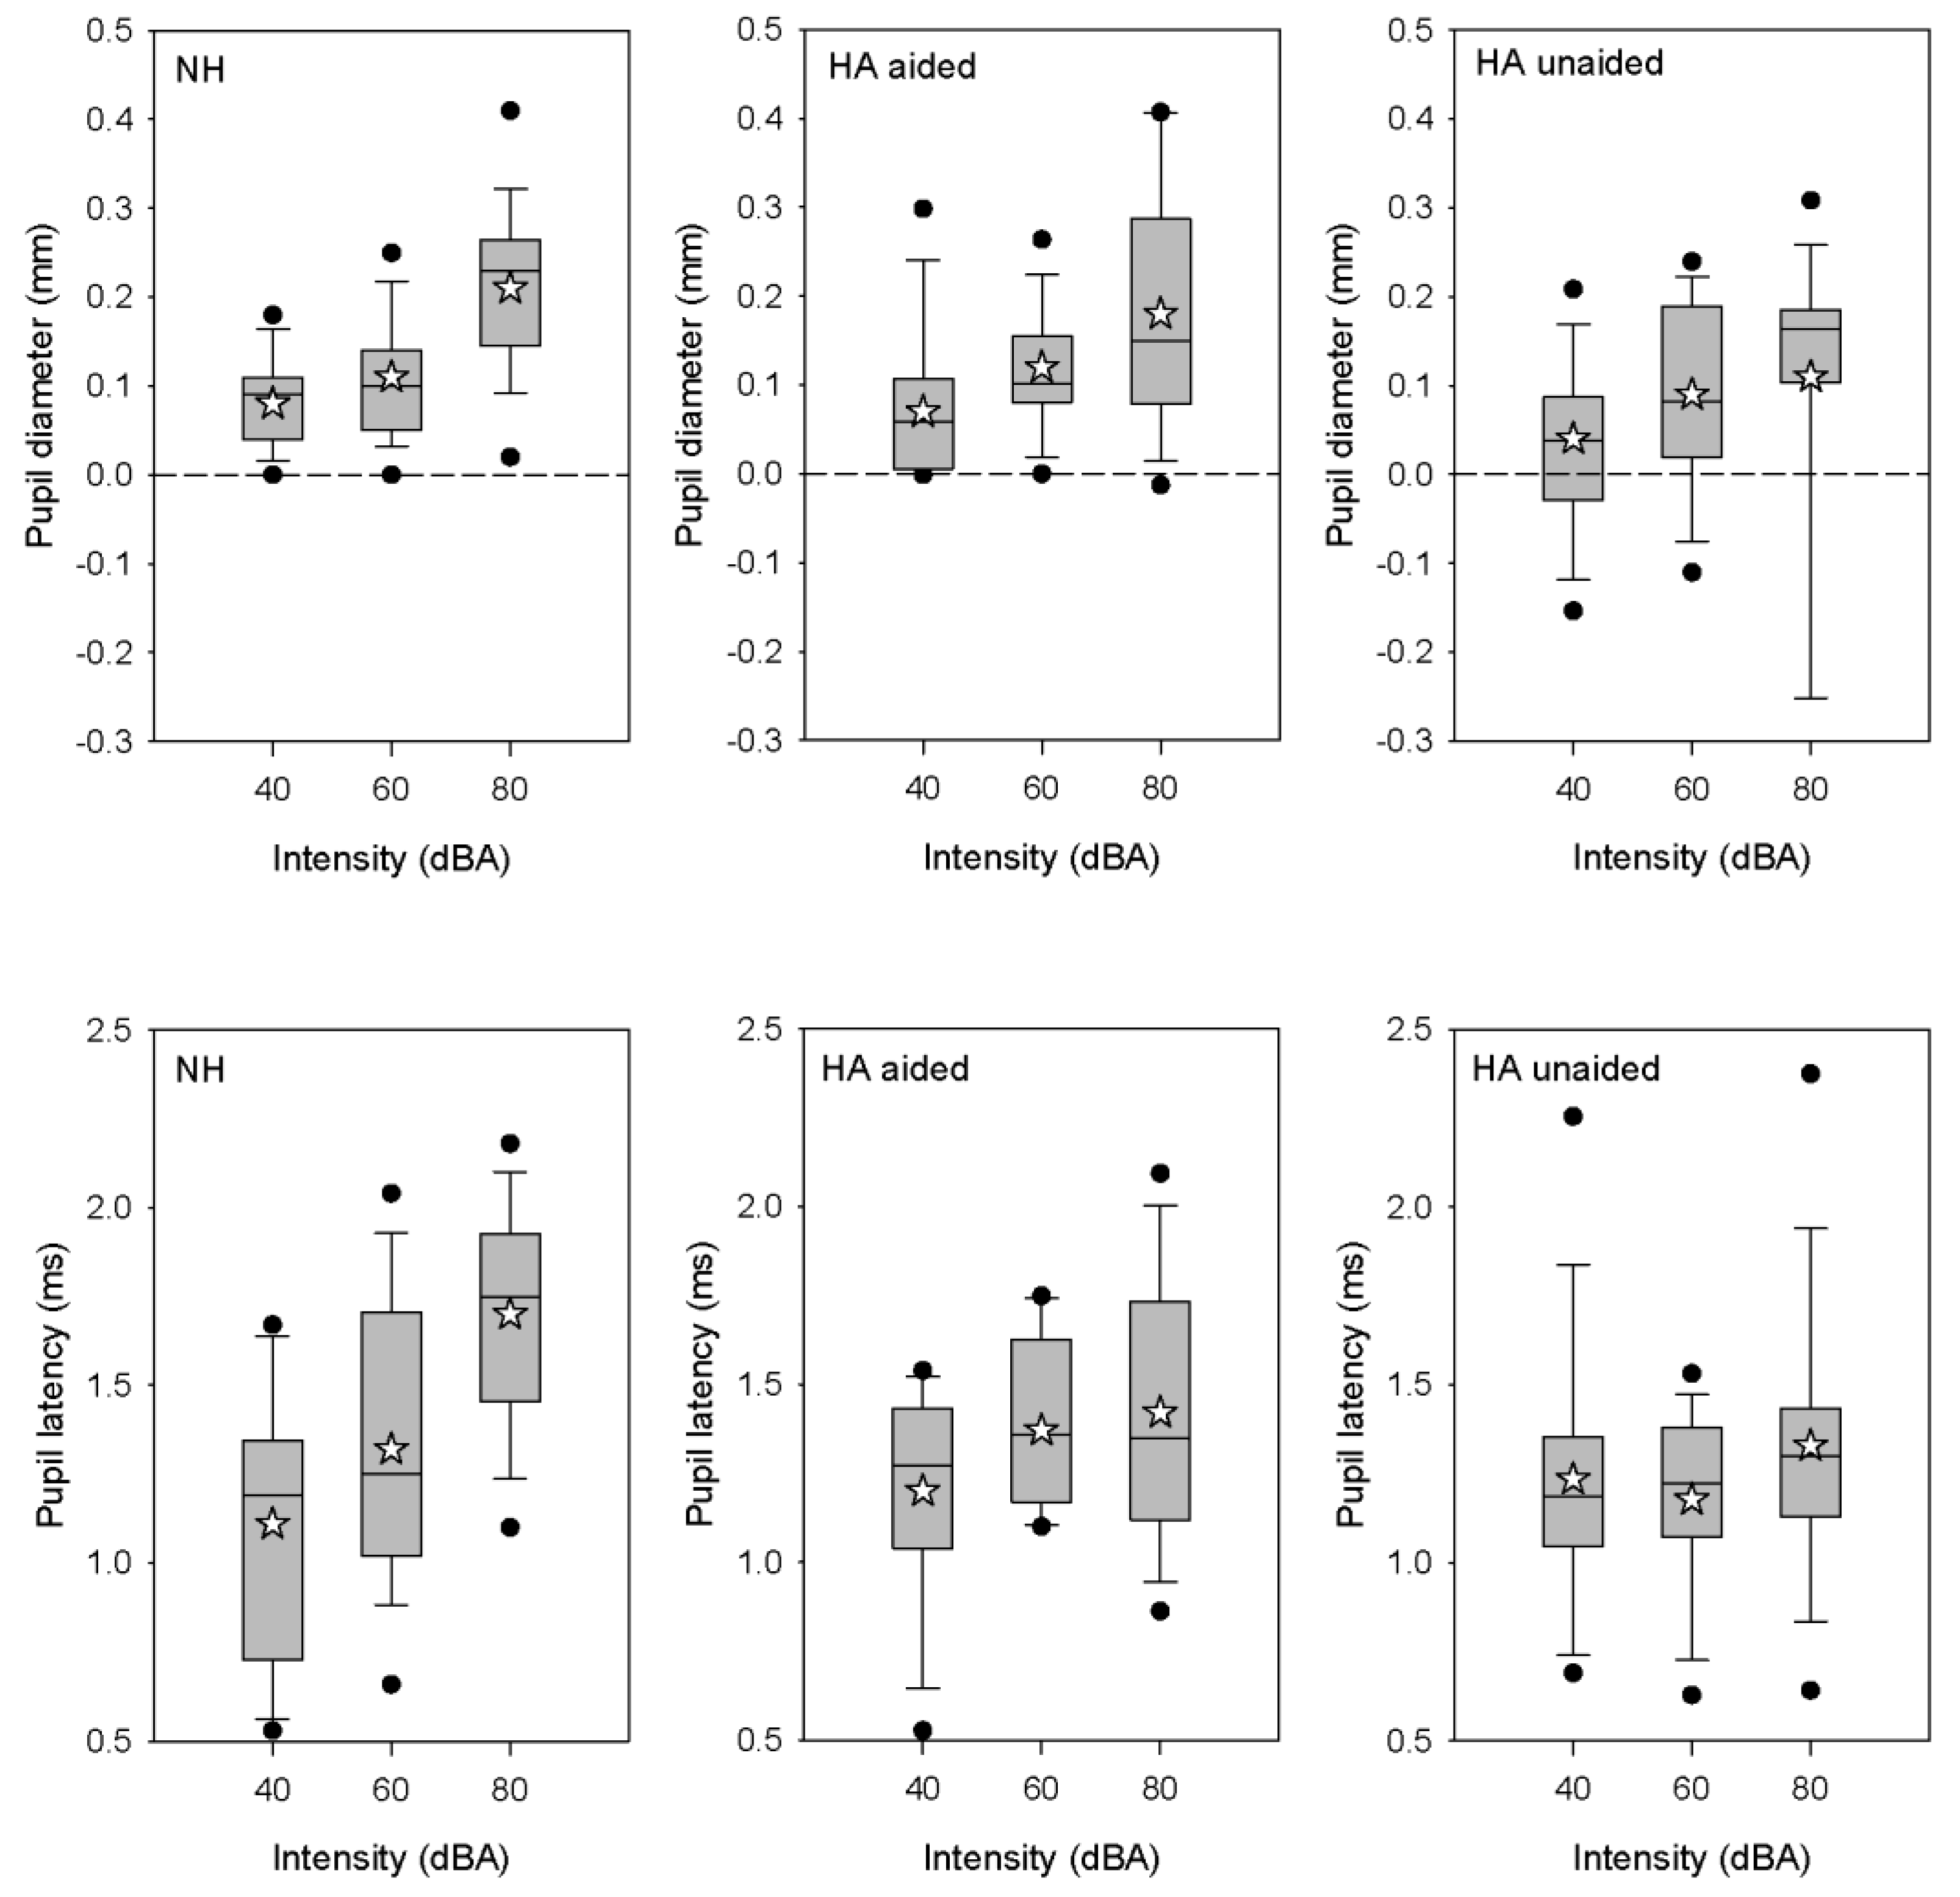
3.3. Pupillometry
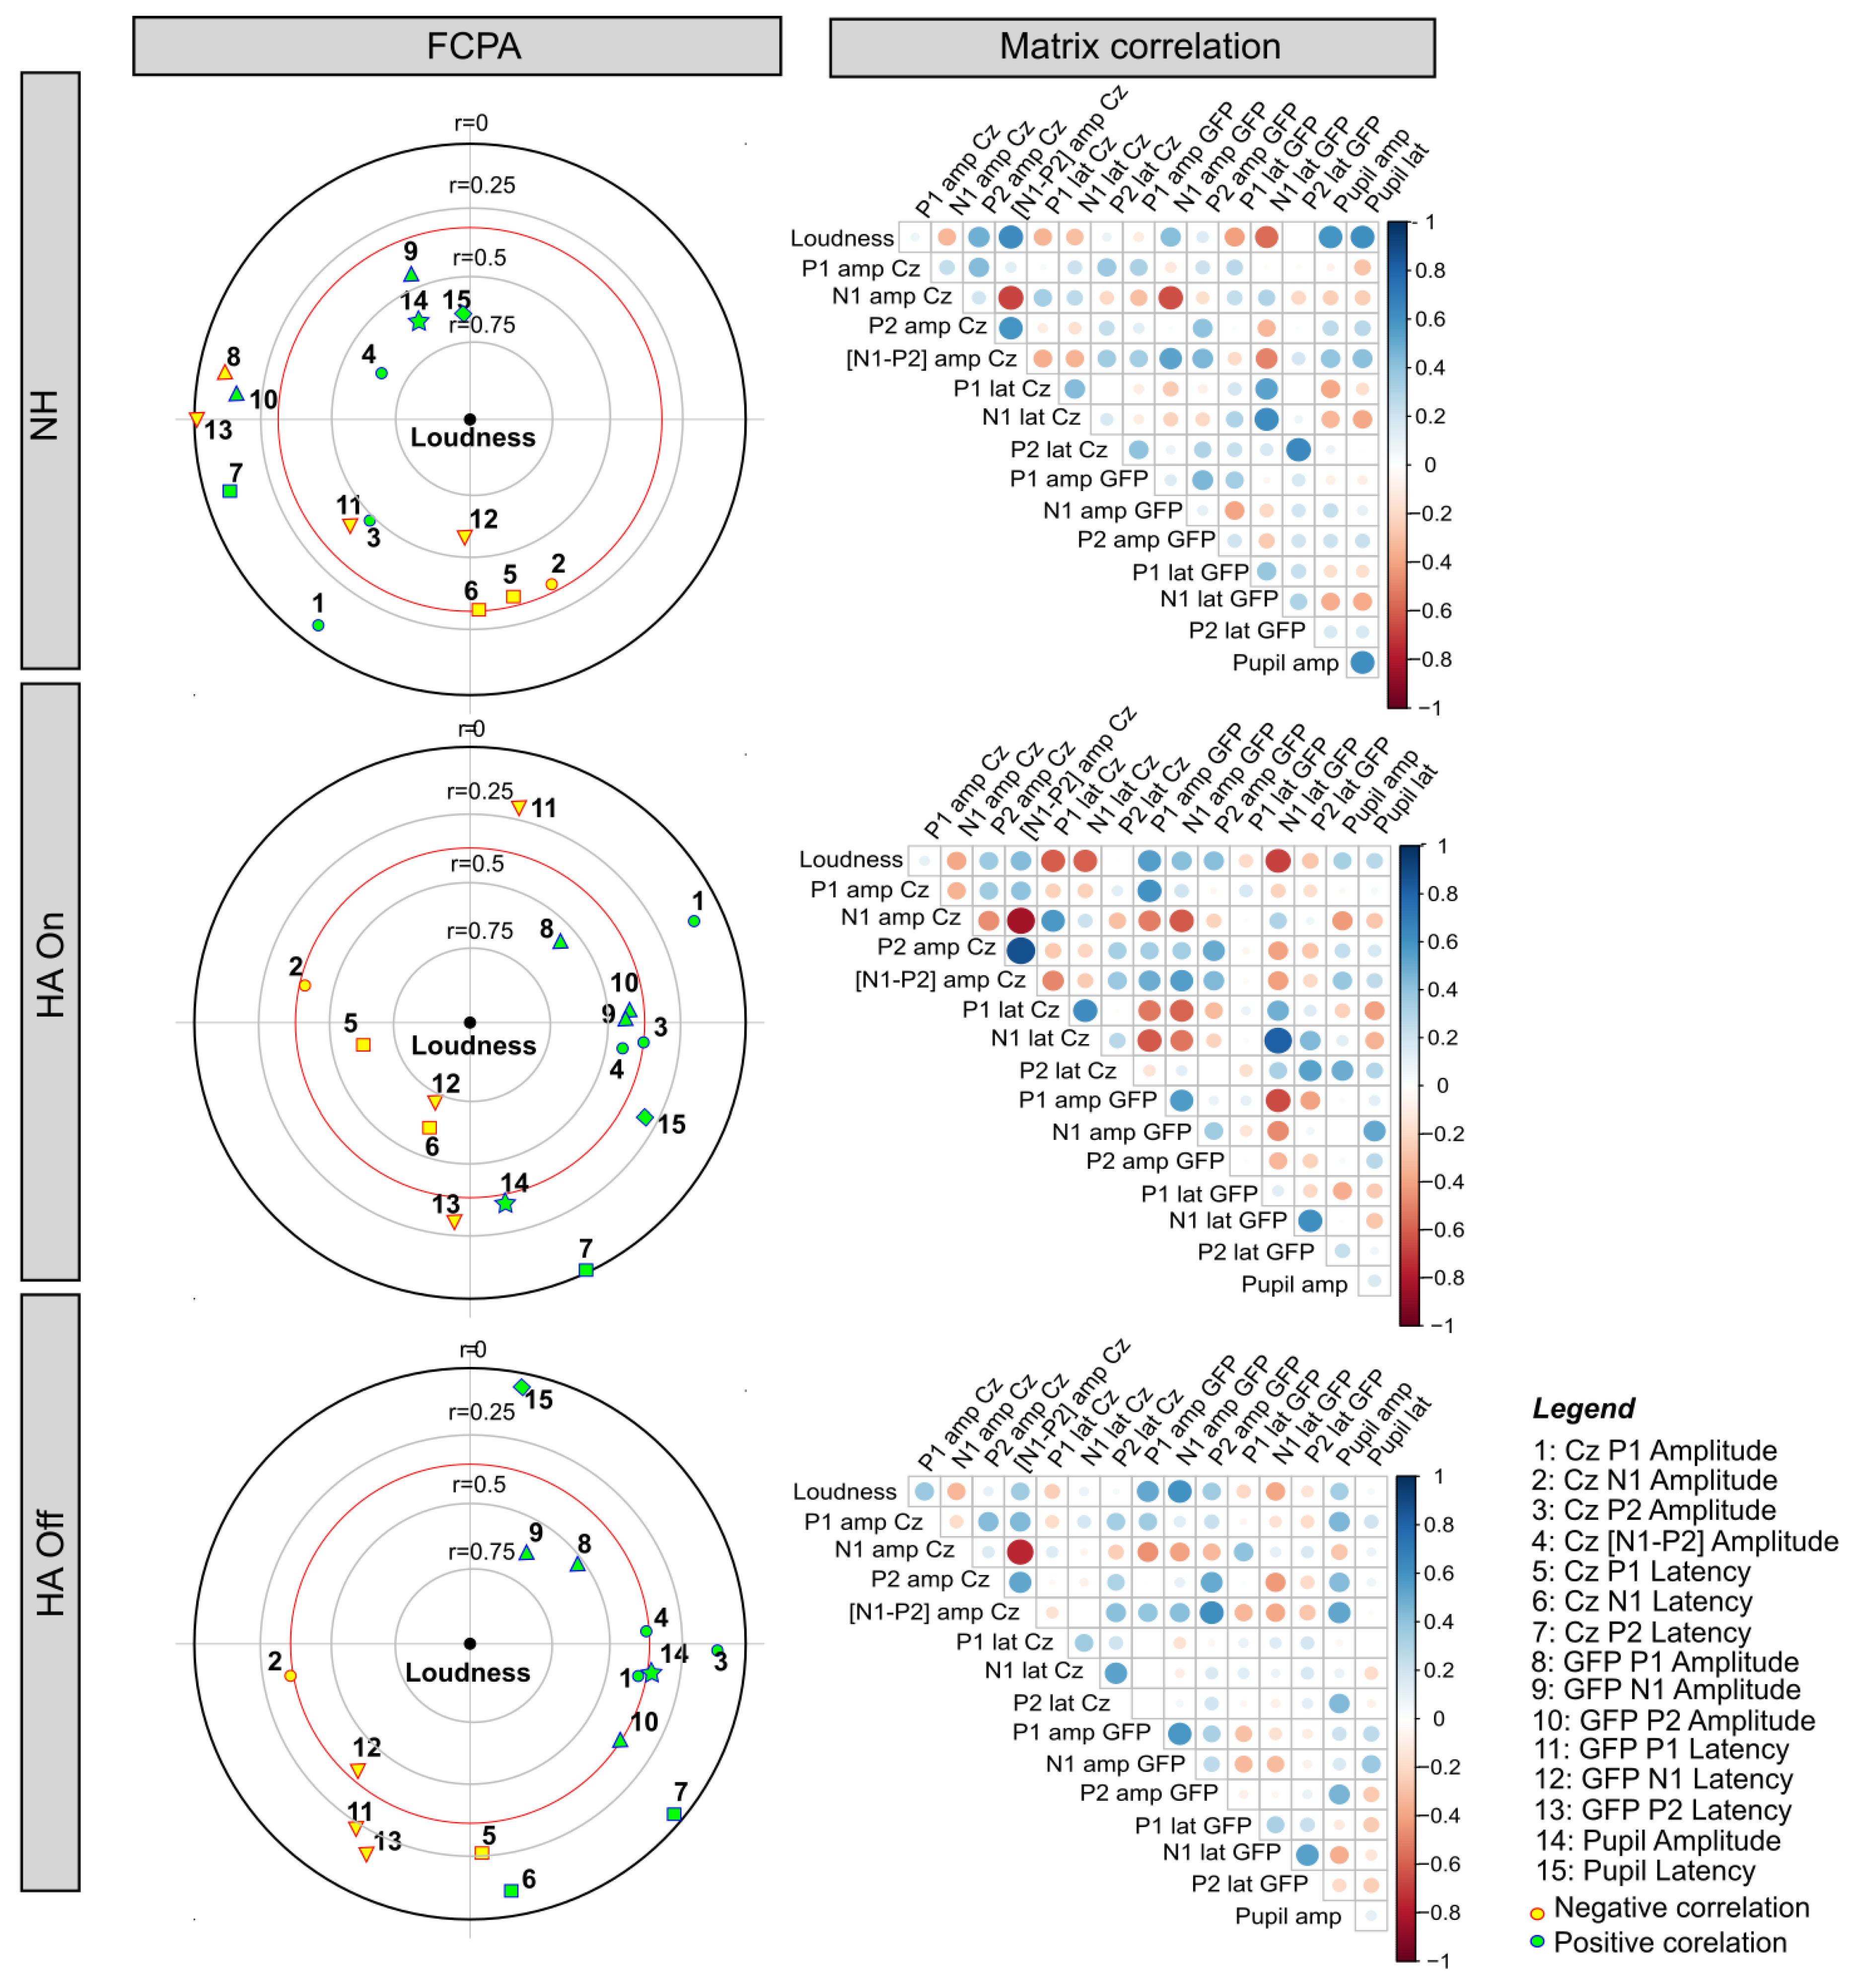
3.4. Relationships among Behavioral and Objective Measures Using FCPA
4. Discussion
4.1. Effect of Intensity Level on Loudness Perception, CAEP, and Pupillometry
4.2. Effect of HA Amplification on Loudness Perception, CAEP, and Pupillometry Responses
4.3. Relationships between Subjective and Objective Measures of Auditory Intensity
4.4. Limits to Study
5. Summary of the Results
Supplementary Materials
Author Contributions
Funding
Institutional Review Board Statement
Informed Consent Statement
Data Availability Statement
Acknowledgments
Conflicts of Interest
References
- Marozeau, J.; Florentine, M. Loudness Growth in Individual Listeners with Hearing Losses: A Review. J. Acoust. Soc. Am. 2007, 122, EL81–EL87. [Google Scholar] [CrossRef] [PubMed] [Green Version]
- Robles, L.; Ruggero, M.A. Mechanics of the Mammalian Cochlea. Physiol. Rev. 2001, 81, 1305–1352. [Google Scholar] [CrossRef] [PubMed]
- Ruggero, M.A.; Rich, N.C.; Recio, A. The Effect of Intense Acoustic Stimulation on Basilar-Membrane Vibrations. Audit. Neurosci. 1996, 2, 329–345. [Google Scholar]
- Lopez-Poveda, E.A. Why Do I Hear but Not Understand? Stochastic Undersampling as a Model of Degraded Neural Encoding of Speech. Front. Neurosci. 2014, 8, 348. [Google Scholar] [CrossRef]
- Lopez-Poveda, E.A.; Johannesen, P.T. Behavioral Estimates of the Contribution of Inner and Outer Hair Cell Dysfunction to Individualized Audiometric Loss. JARO J. Assoc. Res. Otolaryngol. 2012, 13, 485–504. [Google Scholar] [CrossRef] [PubMed] [Green Version]
- Keidser, G.; Dillon, H.; Flax, M.; Ching, T.; Brewer, S. The NAL-NL2 Prescription Procedure. Audiol. Res. 2011, 1, 88–90. [Google Scholar] [CrossRef] [Green Version]
- Scollie, S.; Seewald, R.; Cornelisse, L.; Moodie, S.; Bagatto, M.; Laurnagaray, D.; Beaulac, S.; Pumford, J. The Desired Sensation Level Multistage Input/Output Algorithm. Trends Amplif. 2005, 9, 159–197. [Google Scholar] [CrossRef] [Green Version]
- Beck, D. Programmable Instruments and Successive Approximations. Hear. Rev. 1997, 4, 21–26. [Google Scholar]
- Jenstad, L.M.; Van Tasell, D.J.; Ewert, C. Hearing Aid Troubleshooting Based on Patients’ Descriptions. J. Am. Acad. Audiol. 2003, 14, 347–360. [Google Scholar] [CrossRef]
- Kuk, F. How Flow Charts Can Help You Troubleshoot Hearing Aid Problems. Hear. J. 1999, 52, 46–52. [Google Scholar] [CrossRef]
- Kuk, F. Using the i/o Curve to Help Solve Subjective Complaints with WDRC Hearing Instruments. Hear. Rev. 1998, 5, 8–59. [Google Scholar]
- Schum, D.J.; Burton, C.; Christensen, J. The Use of Advanced Fitting Software in the Counseling Process. Hear. Rev. 1997, 4, 59–62. [Google Scholar]
- Schweitzer, C.; Mortz, M.; Vaughan, N. Perhaps Not by Prescription—But by Perception. High Perform. Hear. Solut. 1999, 3, 58–62. [Google Scholar]
- Abrams, H.B.; Kihm, J. An Introduction to MarkeTrak IX: A New Baseline for the Hearing Aid Market. Hear. Rev. 2015, 22, 16. [Google Scholar]
- Artières, F.; Vieu, A.; Mondain, M.; Uziel, A.; Venail, F. Impact of Early Cochlear Implantation on the Linguistic Development of the Deaf Child. Otol. Neurotol. 2009, 30, 736–742. [Google Scholar] [CrossRef]
- Nikolopoulos, T.P.; Gibbin, K.P.; Dyar, D. Predicting Speech Perception Outcomes Following Cochlear Implantation Using Nottingham Children’s Implant Profile (NChIP). Int. J. Pediatric Otorhinolaryngol. 2004, 68, 137–141. [Google Scholar] [CrossRef] [PubMed]
- Niparko, J.K.; Tobey, E.A.; Thal, D.J.; Eisenberg, L.S.; Wang, N.-Y.; Quittner, A.L.; Fink, N.E.; CI Investigative Team. Spoken Language Development in Children Following Cochlear Implantation. JAMA 2010, 303, 1498–1506. [Google Scholar] [CrossRef] [Green Version]
- O’Donoghue, G.M.; Nikolopoulos, T.P.; Archbold, S.M. Determinants of Speech Perception in Children after Cochlear Implantation. Lancet 2000, 356, 466–468. [Google Scholar] [CrossRef]
- Lazard, D.S.; Lee, H.J.; Gaebler, M.; Kell, C.A.; Truy, E.; Giraud, A.L. Phonological Processing in Post-Lingual Deafness and Cochlear Implant Outcome. NeuroImage 2010, 49, 3443–3451. [Google Scholar] [CrossRef] [Green Version]
- Purdy, S.; Katsch, R.; Dillon, H.; Storey, L.; Sharma, M.; Agung, K. Aided Cortical Auditory Evoked Potentials for Hearing Instrument Evaluation in Infants; Phonak AG: Stäfa, Switzerland, 2005; pp. 115–128. [Google Scholar]
- Mehta, K.; Mahon, M.; Van Dun, B.; Marriage, J.; Vickers, D. Clinicians’ Views of Using Cortical Auditory Evoked Potentials (CAEP) in the Permanent Childhood Hearing Impairment Patient Pathway. Int. J. Audiol. 2020, 59, 81–89. [Google Scholar] [CrossRef]
- Carter, L.; Golding, M.; Dillon, H.; Seymour, J. The Detection of Infant Cortical Auditory Evoked Potentials (CAEPs) Using Statistical and Visual Detection Techniques. J. Am. Acad. Audiol. 2010, 21, 347–356. [Google Scholar] [CrossRef] [PubMed] [Green Version]
- McPherson, D.L. Late Potentials of the Auditory System; Singular Publishing Group: San Diego, CA, USA, 1996. [Google Scholar]
- Kosaner, J. Generating Speech Processor Programmes for Children Using ESRT Measurements. Cochlear Implant. Int. 2010, 11, 20–24. [Google Scholar] [CrossRef]
- Kosaner, J.; Anderson, I.; Turan, Z.; Deibl, M. The Use of ESRT in Fitting Children with Cochlear Implants. J. Int. Adv. Otol. 2009, 5, 70–79. [Google Scholar]
- Bertrand, A.L.; Garcia, J.B.S.; Viera, E.B.; Santos, A.M.; Bertrand, R.H. Pupillometry: The Influence of Gender and Anxiety on the Pain Response. Pain Physician 2013, 16, E257–E266. [Google Scholar] [PubMed]
- Connelly, M.A.; Brown, J.T.; Kearns, G.L.; Anderson, R.A.; St Peter, S.D.; Neville, K.A. Pupillometry: A Non-Invasive Technique for Pain Assessment in Paediatric Patients. Arch. Dis. Child. 2014, 99, 1125–1131. [Google Scholar] [CrossRef] [PubMed] [Green Version]
- Kahneman, D.; Beatty, J. Pupil Diameter and Load on Memory. Science 1966, 154, 1583–1585. [Google Scholar] [CrossRef]
- Tursky, B.; Shapiro, D.; Crider, A.; Kahneman, D. Pupillary, Heart Rate, and Skin Resistance Changes during a Mental Task. J. Exp. Psychol. 1969, 79, 164–167. [Google Scholar] [CrossRef]
- Hillyard, S.A.; Hink, R.F.; Schwent, V.L.; Picton, T.W. Electrical Signs of Selective Attention in the Human Brain. Science 1973, 182, 177–180. [Google Scholar] [CrossRef] [Green Version]
- Kahneman, D.; Onuska, L.; Wolman, R.E. Effects of Grouping on the Pupillary Response in a Short-Term Memory Task. Q. J. Exp. Psychol. 1968, 20, 309–311. [Google Scholar] [CrossRef]
- Schluroff, M.; Zimmermann, T.E.; Freeman, R.B.; Hofmeister, K.; Lorscheid, T.; Weber, A. Pupillary Responses to Syntactic Ambiguity of Sentences. Brain Lang 1986, 27, 322–344. [Google Scholar] [CrossRef]
- Samuels, E.R.; Szabadi, E. Functional Neuroanatomy of the Noradrenergic Locus Coeruleus: Its Roles in the Regulation of Arousal and Autonomic Function Part II: Physiological and Pharmacological Manipulations and Pathological Alterations of Locus Coeruleus Activity in Humans. Curr. Neuropharmacol. 2008, 6, 254–285. [Google Scholar] [CrossRef] [PubMed] [Green Version]
- Steinhauer, S.R.; Siegle, G.J.; Condray, R.; Pless, M. Sympathetic and Parasympathetic Innervation of Pupillary Dilation during Sustained Processing. Int. J. Psychophysiol. Off. J. Int. Organ. Psychophysiol. 2004, 52, 77–86. [Google Scholar] [CrossRef] [PubMed]
- Hess, E.H. Review of Pupillometry: The Psychology of the Pupillary Response. Am. J. Psychol. 1978, 91, 547–549. [Google Scholar] [CrossRef]
- Beatty, J. Phasic Not Tonic Pupillary Responses Vary with Auditory Vigilance Performance. Psychophysiology 1982, 19, 167–172. [Google Scholar] [CrossRef]
- Zekveld, A.A.; Kramer, S.E.; Festen, J.M. Cognitive Load during Speech Perception in Noise: The Influence of Age, Hearing Loss, and Cognition on the Pupil Response. Ear Hear. 2011, 32, 498–510. [Google Scholar] [CrossRef] [PubMed]
- Zekveld, A.A.; Kramer, S.E.; Festen, J.M. Pupil Response as an Indication of Effortful Listening: The Influence of Sentence Intelligibility. Ear Hear. 2010, 31, 480–490. [Google Scholar] [CrossRef]
- Ahern, S.; Beatty, J. Pupillary Responses during Information Processing Vary with Scholastic Aptitude Test Scores. Science 1979, 205, 1289–1292. [Google Scholar] [CrossRef]
- McGarrigle, R.; Dawes, P.; Stewart, A.J.; Kuchinsky, S.E.; Munro, K.J. Pupillometry Reveals Changes in Physiological Arousal during a Sustained Listening Task. Psychophysiology 2017, 54, 193–203. [Google Scholar] [CrossRef] [Green Version]
- Wagner, A.E.; Nagels, L.; Toffanin, P.; Opie, J.M.; Başkent, D. Individual Variations in Effort: Assessing Pupillometry for the Hearing Impaired. Trends Hear. 2019, 23, 1–18. [Google Scholar] [CrossRef]
- Bianchi, F.; Wendt, D.; Wassard, C.; Maas, P.; Lunner, T.; Rosenbom, T.; Holmberg, M. Benefit of Higher Maximum Force Output on Listening Effort in Bone-Anchored Hearing System Users: A Pupillometry Study. Ear Hear. 2019, 40, 1220–1232. [Google Scholar] [CrossRef] [Green Version]
- Fiedler, L.; Seifi Ala, T.; Graversen, C.; Alickovic, E.; Lunner, T.; Wendt, D. Hearing Aid Noise Reduction Lowers the Sustained Listening Effort During Continuous Speech in Noise-A Combined Pupillometry and EEG Study. Ear Hear. 2021, 42, 1590–1601. [Google Scholar] [CrossRef] [PubMed]
- Micula, A.; Rönnberg, J.; Fiedler, L.; Wendt, D.; Jørgensen, M.C.; Larsen, D.K.; Ng, E.H.N. The Effects of Task Difficulty Predictability and Noise Reduction on Recall Performance and Pupil Dilation Responses. Ear Hear. 2021, 42, 1668–1679. [Google Scholar] [CrossRef] [PubMed]
- Slugocki, C.; Kuk, F.; Korhonen, P. Effects of Directional Microphone and Noise Reduction on Subcortical and Cortical Auditory-Evoked Potentials in Older Listeners with Hearing Loss. Ear Hear. 2020, 41, 1282–1293. [Google Scholar] [CrossRef] [PubMed]
- Nunnally, J.C.; Knott, P.D.; Duchnowski, A.; Parker, R. Pupillary Response as a General Measure of Activation. Percept. Psychophys. 1967, 2, 149–155. [Google Scholar] [CrossRef]
- Antikainen, J.; Niemi, P. Neuroticism and the Pupillary Response to a Brief Exposure to Noise. Biol. Psychol. 1983, 17, 131–135. [Google Scholar] [CrossRef]
- Jones, P.D.; Loeb, M.; Cohen, A. Effects of Intense Continuous- and Impact-Type Noise on Pupil Size and Visual Acuity. J. Am. Audiol. Soc. 1977, 2, 202–207. [Google Scholar]
- Adler, G.; Adler, J. Influence of Stimulus Intensity on AEP Components in the 80- to 200-Millisecond Latency Range. Audiology 1989, 28, 316–324. [Google Scholar] [CrossRef]
- Beagley, H.A.; Knight, J.J. Changes in Auditory Evoked Response with Intensity. J. Laryngol. Otol. 1967, 81, 861–873. [Google Scholar] [CrossRef]
- Boothroyd, A. Recovery of Speech Perception Performance after Prolonged Auditory Deprivation: Case Study. J. Am. Acad. Audiol. 1993, 4, 331–336. [Google Scholar]
- Bruneau, N.; Roux, S.; Garreau, B.; Lelord, G. Frontal Auditory Evoked Potentials and Augmenting-Reducing. Electroencephalogr. Clin. Neurophysiol. Potentials Sect. 1985, 62, 364–371. [Google Scholar] [CrossRef]
- Khechinashvili, S.N.; Kevanishvili, Z.S.; Kajaia, O.A. Amplitude and Latency Studies of the Averaged Auditory Evoked Responses to Tones of Different Intensities. Acta Otolaryngol. 1973, 76, 395–401. [Google Scholar] [CrossRef] [PubMed]
- Martin, B.A.; Boothroyd, A. Cortical, Auditory, Evoked Potentials in Response to Changes of Spectrum and Amplitude. J. Acoust. Soc. Am. 2000, 107, 2155–2161. [Google Scholar] [CrossRef] [PubMed]
- McCandless, G.A.; Best, L. Summed Evoked Responses Using Pure-Tone Stimuli. J. Speech Lang. Hear. Res. 1966, 9, 266–272. [Google Scholar] [CrossRef]
- Moore, E.J.; Rose, D.E. Variability of Latency and Amplitude of Acoustically Evoked Responses to Pure Tones of Moderate to High Intensity. Int. Audiol. 1969, 8, 172–181. [Google Scholar] [CrossRef]
- Polich, J.; Aung, M.; Dalessio, D.J. Long Latency Auditory Evoked Potentials: Intensity, Inter-Stimulus Interval, and Habituation. Pavlov. J. Biol. Sci. 1988, 23, 35–40. [Google Scholar] [CrossRef] [PubMed]
- Potter, T.; Li, S.; Nguyen, T.; Nguyen, T.; Ince, N.; Zhang, Y. Characterization of Volume-Based Changes in Cortical Auditory Evoked Potentials and Prepulse Inhibition. Sci. Rep. 2017, 7, 11098. [Google Scholar] [CrossRef]
- Prakash, H.; Abraham, A.; Rajashekar, B.; Yerraguntla, K. The Effect of Intensity on the Speech Evoked Auditory Late Latency Response in Normal Hearing Individuals. J. Int. Adv. Otol. 2016, 12, 67–71. [Google Scholar] [CrossRef]
- Rapin, I.; Schimmel, H.; Tourk, L.M.; Krasnegor, N.A.; Pollak, C. Evoked Responses to Clicks and Tones of Varying Intensity in Waking Adults. Electroencephalogr. Clin. Neurophysiol. 1966, 21, 335–344. [Google Scholar] [CrossRef]
- Roth, W.T.; Dorato, K.H.; Kopell, B.S. Intensity and Task Effects on Evoked Physiological Responses to Noise Bursts. Psychophysiology 1984, 21, 466–481. [Google Scholar] [CrossRef]
- Billings, C.J.; Tremblay, K.L.; Souza, P.E.; Binns, M.A. Effects of Hearing Aid Amplification and Stimulus Intensity on Cortical Auditory Evoked Potentials. Audiol. Neurotol. 2007, 12, 234–246. [Google Scholar] [CrossRef]
- Billings, C.J.; Tremblay, K.L.; Miller, C.W. Aided Cortical Auditory Evoked Potentials in Response to Changes in Hearing Aid Gain. Int. J. Audiol. 2011, 50, 459–467. [Google Scholar] [CrossRef] [PubMed] [Green Version]
- Tremblay, K.L.; Kalstein, L.; Billings, C.J.; Souza, P.E. The Neural Representation of Consonant-Vowel Transitions in Adults Who Wear Hearing Aids. Trends Amplif. 2006, 10, 155–162. [Google Scholar] [CrossRef] [PubMed] [Green Version]
- Biap Classification Audiométrique Des Déficiences Auditives. Available online: https://www.biap.org/en/component/content/article/65-recommendations/ct-2-classification/5-biap-recommendation-021-bis (accessed on 10 March 2022).
- Lafon, J.C. Audiometry with the phonetic test. Acta Otorhinolaryngol. Belg. 1964, 18, 619–633. [Google Scholar] [PubMed]
- Aguera, P.-E.; Jerbi, K.; Caclin, A.; Bertrand, O. ELAN: A Software Package for Analysis and Visualization of MEG, EEG, and LFP Signals. Comput. Intell. Neurosci. 2011, 2011, 158970. [Google Scholar] [CrossRef]
- Beatty, J.; Lucero-Wagoner, B. The Pupillary System. In Handbook of Psychophysiology, 2nd ed.; Cambridge University Press: New York, NY, USA, 2000; pp. 142–162. ISBN 978-0-521-62634-7. [Google Scholar]
- Falissard, B. Focused Principal Component Analysis: Looking at a Correlation Matrix with a Particular Interest in a Given Variable. J. Comput. Graph. Stat. 1999, 8, 906–912. [Google Scholar] [CrossRef]
- Falissard, B. A Spherical Representation of a Correlation Matrix. J. Classif. 1996, 13, 267–280. [Google Scholar] [CrossRef]
- Korczak, P.A.; Kurtzberg, D.; Stapells, D.R. Effects of Sensorineural Hearing Loss and Personal Hearing AIDS on Cortical Event-Related Potential and Behavioral Measures of Speech-Sound Processing. Ear Hear. 2005, 26, 165–185. [Google Scholar] [CrossRef] [Green Version]
- Smadja, D.; Mas, J.L.; de Recondo, J. Anatomie Des Voies Sympathiques et Parasympathiques Oculaires. EMC–Ophtalmologie 1988, 21 007 A 50, 4. [Google Scholar]
- Kahneman, D. Attention and Efforts; Engelwood Cliffs: New Jersey, NJ, USA, 1973. [Google Scholar]
- Laeng, B.; Sirois, S.; Gredebäck, G. Pupillometry: A Window to the Preconscious? Perspect. Psychol. Sci. J. Assoc. Psychol. Sci. 2012, 7, 18–27. [Google Scholar] [CrossRef]
- Dillon, H. Hearing Aids; Hodder Arnold: London, UK, 2008. [Google Scholar]
- Eggermont, J. Electric and Magnetic Fields of Synchronous Neural Activity. In Auditory Evoked Potentials: Basic Principles and Clinical Application; Lippincott Williams & Wilkins: Baltimore, MD, USA, 2007; Volume 1, pp. 2–21. [Google Scholar]
- Dawes, P.; Munro, K.J.; Kalluri, S.; Edwards, B. Auditory Acclimatization and Hearing Aids: Late Auditory Evoked Potentials and Speech Recognition Following Unilateral and Bilateral Amplification. J. Acoust. Soc. Am. 2014, 135, 3560–3569. [Google Scholar] [CrossRef] [Green Version]
- Karawani, H.; Jenkins, K.; Anderson, S. Restoration of Sensory Input May Improve Cognitive and Neural Function. Neuropsychologia 2018, 114, 203–213. [Google Scholar] [CrossRef] [PubMed]
- Piquado, T.; Isaacowitz, D.; Wingfield, A. Pupillometry as a Measure of Cognitive Effort in Younger and Older Adults. Psychophysiology 2010, 47, 560–569. [Google Scholar] [CrossRef] [PubMed] [Green Version]
- Wetzel, N.; Buttelmann, D.; Schieler, A.; Widmann, A. Infant and Adult Pupil Dilation in Response to Unexpected Sounds. Dev. Psychobiol. 2016, 58, 382–392. [Google Scholar] [CrossRef] [PubMed]
- Bakhos, D.; Delage, H.; Galvin, J.; Lescanne, E.; Roux, S.; Bonnet-Brilhault, F.; Bruneau, N. Cortical Electrophysiological Markers of Language Abilities in Children with Hearing AIDS: A Pilot Study. BioMed Res. Int. 2014, 2014, 198153. [Google Scholar] [CrossRef]
- Anne-Kristin, A.; Verhey, J.L. Spectral Loudness Summation for Short and Long Signals as a Function of Level|Researcher Information|J-GLOBAL. J. Acoust. Soc. Am. 2006, 119, 2919–2928. [Google Scholar] [CrossRef]
- Garnier, S.; Micheyl, C.; Arthaud, P.; Collet, L. Effect of Frequency Content on Categorical Loudness Normalization. Scand. Audiol. 2000, 29, 253–259. [Google Scholar] [CrossRef]
- Leibold, L.J.; Tan, H.; Khaddam, S.; Jesteadt, W. Contributions of Individual Components to the Overall Loudness of a Multitone Complex. J. Acoust. Soc. Am. 2007, 121, 2822–2831. [Google Scholar] [CrossRef]
- Florentine, M.; Buus, S.; Poulsen, T. Temporal Integration of Loudness as a Function of Level. J. Acoust. Soc. Am. 1996, 99, 1633–1644. [Google Scholar] [CrossRef]
- Stéphane Garnier, L.C.; Micheyl, C.; Arthaud, P.; Berger-Vachon, C. Temporal Loudness Integration and Spectral Loudness Summation in Normal-Hearing and Hearing-Impaired Listeners. Acta Otolaryngol. 1999, 119, 154–157. [Google Scholar] [CrossRef]
- Zwislocki, J.J. Temporal Summation of Loudness: An Analysis. J. Acoust. Soc. Am. 1969, 46, 431–441. [Google Scholar] [CrossRef]
- Gorga, M.P.; Kaminski, J.R.; Beauchaine, K.L.; Bergman, B.M. A Comparison of Auditory Brain Stem Response Thresholds and Latencies Elicited by Air- and Bone-Conducted Stimuli. Ear Hear. 1993, 14, 85. [Google Scholar] [CrossRef] [PubMed]


| Age | Unaided PTA (dB HL) | Tone HA Gain | Unaided SAT (dB SPL) | Speech HA Gain | ||||
|---|---|---|---|---|---|---|---|---|
| Participant | Sex | (yrs.) | Left | Right | (dB) | Left | Right | (dB) |
| HA-1 | M | 62 | 26.3 | 27.5 | 5.0 | 50.0 | 55.0 | 7.0 |
| HA-2 | F | 75 | 53.8 | 50.0 | 16.3 | 65.0 | 40.0 | 16.0 |
| HA-3 | F | 76 | 42.5 | 57.5 | 8.8 | 60.0 | 48.0 | 3.0 |
| HA-4 | F | 74 | 21.3 | 27.5 | 13.8 | 61.0 | 50.0 | 16.0 |
| HA-5 | M | 76 | 31.3 | 42.5 | 8.8 | 47.0 | 50.0 | 5.0 |
| HA-6 | F | 65 | 70.0 | 61.3 | 18.8 | 38.0 | 38.0 | 4.0 |
| HA-7 | F | 80 | 55.0 | 52.5 | 21.3 | 35.0 | 54.0 | 20.0 |
| HA-8 | M | 81 | 57.5 | 65.0 | 33.8 | 62.0 | 57.0 | 28.0 |
| HA-9 | M | 88 | 51.3 | 50.0 | 28.8 | 80.0 | 70.0 | 19.0 |
| HA-10 | M | 72 | 70.0 | 62.5 | 11.3 | 40.0 | 52.0 | 6.0 |
| HA-11 | M | 81 | 56.3 | 61.3 | 31.3 | 67.0 | 67.0 | 25.0 |
| HA-12 | F | 83 | 48.8 | 41.3 | 11.3 | 55.0 | 50.0 | 7.0 |
| HA-13 | M | 82 | 52.5 | 48.8 | 20.0 | 60.0 | 55.0 | 21.0 |
| HA-14 | F | 76 | 46.3 | 45.0 | 18.8 | 52.0 | 55.0 | 14.0 |
| HA-15 | M | 66 | 36.3 | 37.5 | 16.3 | 37.0 | 47.0 | 6.0 |
| HA-16 | F | 73 | 40.0 | 36.3 | 8.8 | 40.0 | 40.0 | 9.0 |
| HA-17 | F | 83 | 48.8 | 41.3 | 6.3 | 50.0 | 50.0 | 6.0 |
| Mean | 8 M, 9 F | 76.1 | 47.7 | 47.5 | 16.4 | 52.9 | 51.7 | 12.5 |
| SD | 7.0 | 14.0 | 11.7 | 8.6 | 12.5 | 8.5 | 8.0 | |
| Intensity | Peak | NH | HA Aided | HA Unaided | ||
|---|---|---|---|---|---|---|
| 40 dBA | P1 | Amplitude (µV) | Cz | 1.4 ± 1.2 | 1.5 ± 1.3 | 0.9 ± 1.2 |
| GFP | 0.9 ± 0.5 | 0.8 ± 0.3 | 0.7 ± 0.2 | |||
| Latency (ms) | Cz | 64.8 ± 10.7 | 78.4 ± 19.4 | 77.7 ± 23.3 | ||
| GFP | 58.8 ± 14.1 | 76.1 ± 12.2 | 71.9 ± 20.7 | |||
| N1 | Amplitude (µV) | Cz | −4.9 ± 2 | −2.1 ± 2.4 | −1.8 ± 2.7 | |
| GFP | 2.4 ± 0.7 | 2.0 ± 0.9 | 0.8 ± 0.3 | |||
| Latency (ms) | Cz | 116.8 ± 10.3 | 138.9 ± 29.9 | 128.7 ± 29.8 | ||
| GFP | 114.8 ± 15.3 | 136.1 ± 18.5 | 129.9 ± 16.4 | |||
| P2 | Amplitude (µV) | Cz | 0.7 ± 1.5 | 1.0 ± 1.7 | 0.8 ± 1.2 | |
| GFP | 1.0 ± 0.4 | 1.1 ± 0.4 | 0.9 ± 0.4 | |||
| Latency (ms) | Cz | 183.5 ± 30.7 | 192.2 ± 42.9 | 181.2 ± 40.2 | ||
| GFP | 188.3 ± 19.9 | 208.2 ± 28 | 204.2 ± 24.9 | |||
| N1-P2 | Amplitude (µV) | Cz | 5.6 ± 1.8 | 3.2 ± 2.6 | 3.0 ± 2 | |
| 60 dBA | P1 | Amplitude (µV) | Cz | 2.1 ± 1.7 | 1.6 ± 1.8 | 1.4 ± 1.9 |
| GFP | 1.0 ± 0.4 | 1.2 ± 0.4 | 1.1 ± 0.3 | |||
| Latency (ms) | Cz | 58.7 ± 8 | 69.9 ± 8.6 | 72.9 ± 11.6 | ||
| GFP | 53.0 ± 8.6 | 63.1 ± 8.2 | 62.6 ± 15.9 | |||
| N1 | Amplitude (µV) | Cz | −5.6 ± 2.7 | −4.5 ± 2.1 | −3.0 ± 2.9 | |
| GFP | 2.9 ± 0.9 | 3.3 ± 0.9 | 2.7 ± 1.1 | |||
| Latency (ms) | Cz | 110.4 ± 7.7 | 120.4 ± 10.3 | 132 ± 20.7 | ||
| GFP | 102 ± 6.9 | 113.9 ± 11.7 | 120.1 ± 15.1 | |||
| P2 | Amplitude (µV) | Cz | 2.5 ± 1.9 | 2.6 ± 2.6 | 1.8 ± 1.6 | |
| GFP | 1.4 ± 0.6 | 1.3 ± 0.5 | 1.3 ± 0.5 | |||
| Latency (ms) | Cz | 199.7 ± 40.7 | 194.8 ± 29.2 | 201.8 ± 30.8 | ||
| GFP | 191.6 ± 25.7 | 198.1 ± 25.8 | 199.9 ± 22 | |||
| N1-P2 | Amplitude (µV) | Cz | 8.1 ± 2.4 | 7.1 ± 2.9 | 5.0 ± 2.2 | |
| 80 dBA | P1 | Amplitude (µV) | Cz | 2.6 ± 2.6 | 3.1 ± 2.4 | 2.7 ± 1.1 |
| GFP | 1.2 ± 0.4 | 1.5 ± 0.5 | 1.3 ± 0.5 | |||
| Latency (ms) | Cz | 56.9 ± 5.4 | 62.4 ± 9.1 | 64.5 ± 15.9 | ||
| GFP | 51.4 ± 6.4 | 61.1 ± 6.9 | 58.5 ± 8.2 | |||
| N1 | Amplitude (µV) | Cz | −7.8 ± 2.7 | −5.5 ± 3 | −5.8 ± 3.3 | |
| GFP | 3.5 ± 1.2 | 4.2 ± 1.1 | 3.7 ± 1.5 | |||
| Latency (ms) | Cz | 107.1 ± 7.4 | 114.5 ± 12.8 | 116 ± 15.9 | ||
| GFP | 101.9 ± 5.6 | 107.8 ± 10.6 | 109.8 ± 11.4 | |||
| P2 | Amplitude (µV) | Cz | 4.1 ± 2.9 | 2.8 ± 3.3 | 2.7 ± 2.9 | |
| GFP | 1.6 ± 0.9 | 1.4 ± 0.7 | 1.9 ± 1.1 | |||
| Latency (ms) | Cz | 200.8 ± 31.1 | 184.1 ± 31.3 | 185.7 ± 29.9 | ||
| GFP | 196.8 ± 22.3 | 194.9 ± 20.7 | 204 ± 29.8 | |||
| N1-P2 | Amplitude (µV) | Cz | 11.9 ± 3.3 | 8.4 ± 4.1 | 8.2 ± 4.7 |
| RM ANOVA | |||||
|---|---|---|---|---|---|
| Peak | Factor | dF, res | F | p | Post Hoc Bonferroni |
| N1 amp Cz | Intensity | 2, 32 | 18.2 | <0.001 * | 60, 40 > 80 |
| P2 amp Cz | Intensity | 2, 32 | 14.5 | <0.001 * | 80, 60 > 40 |
| N1-P2 amp Cz | Intensity | 2, 32 | 61.9 | <0.001 * | 80 > 60 > 40 |
| N1 lat Cz | Intensity | 2, 32 | 14.5 | <0.001 * | 40 > 60, 80 |
| P1 amp GFP | Intensity | 2, 32 | 3.3 | 0.049 * | 80 > 40 |
| N1 amp GFP | Intensity | 2, 32 | 24.0 | <0.001 * | 80 > 60 > 40 |
| P2 lat GFP | Intensity | 2, 32 | 1.7 | 0.196 | |
| Kruskal–Wallis ANOVA on ranked data | |||||
| Peak | Factor | dF | χ2 | p | Post Hoc Tukey |
| P1 amp Cz | Intensity | 2 | 4.6 | 0.101 | |
| P1 lat Cz | Intensity | 2 | 13.6 | 0.001 * | 80 > 40 |
| P2 lat Cz | Intensity | 2 | 4.4 | 0.113 | |
| P2 amp GFP | Intensity | 2 | 19.2 | <0.001 * | 80 > 60, 40 |
| P1 lat GFP | Intensity | 2 | 8.9 | 0.012 * | 40 > 80 |
| N1 lat GFP | Intensity | 2 | 23.7 | <0.001 * | 40 > 60, 80 |
| RM ANOVA | |||||
|---|---|---|---|---|---|
| Peak | Factor | dF, res | F | p | Post Hoc Bonferroni |
| P1 amp Cz | HA | 1, 32 | 1.4 | 0.260 | |
| Intensity | 2, 32 | 8.7 | <0.001 * | 80 > 60, 40 | |
| HA x intensity | 2, 32 | 0.1 | 0.872 | ||
| P2 amp Cz | HA | 1, 32 | 1.3 | 0.275 | |
| Intensity | 2, 32 | 5.8 | 0.007 | 80, 60 > 40 | |
| HA x intensity | 2, 32 | 0.5 | 0.619 | ||
| P1 lat Cz | HA | 1, 32 | 0.1 | 0.818 | |
| Intensity | 2, 32 | 11.0 | <0.001 * | 40 > 80 | |
| HA x intensity | 2, 32 | 0.2 | 0.804 | ||
| P2 lat Cz | HA | 1, 32 | <0.1 | 0.857 | |
| Intensity | 2, 32 | 1.4 | 0.260 | ||
| HA x intensity | 2, 32 | 0.8 | 0.458 | ||
| P1 amp GFP | HA | 1, 32 | 5.0 | 0.039 * | HA on > HA off |
| Intensity | 2, 32 | 27.4 | <0.001 * | 80 > 60 > 40 | |
| HA x intensity | 2, 32 | 0.3 | 0.769 | ||
| N1 amp GFP | HA | 1, 32 | 32.1 | <0.001 * | HA-a > HA-un |
| Intensity | 2, 32 | 56.6 | <0.001 * | 80 > 60 > 40 | |
| HA x intensity | 2, 32 | 3.0 | 0.063 | ||
| P2 amp GFP | HA | 1, 32 | 0.8 | 0.391 | |
| Intensity | 2, 32 | 10.8 | <0.001 * | 80 > 40 | |
| HA x intensity | 2, 32 | 5.9 | 0.007 * | HA on: 80 > 60 > 40; 80: HA on > HA off | |
| P1 lat GFP | HA | 1, 32 | 2.0 | 0.179 | |
| Intensity | 2, 32 | 10.7 | <0.001 * | 40 > 60, 80 | |
| HA x intensity | 2, 32 | 0.2 | 0.800 | ||
| N1 lat GFP | HA | 1, 32 | 0.1 | 0.783 | |
| Intensity | 2, 32 | 31.0 | <0.001 * | 40 > 60 > 80 | |
| HA x intensity | 2, 32 | 1.9 | 0.163 | ||
| P2 lat GFP | HA | 1, 32 | 0.3 | 0.583 | |
| Intensity | 2, 32 | 0.9 | 0.432 | ||
| HA x intensity | 2, 32 | 0.8 | 0.452 | ||
| Kruskal–Wallis ANOVA on ranked data | |||||
| Peak | Factor | dF | χ2 | P | Post Hoc Tukey |
| N1 amp Cz | HA, intensity | 5 | 51.2 | <0.001 * | 60, 40 > 80 |
| N1-P2 amp Cz | HA, intensity | 5 | 44.9 | <0.001 * | 80, 60 > 40 |
| N1 lat Cz | HA, intensity | 5 | 21.7 | <0.001 * | HA on: 40 > 60, 80 |
| CAEP | Intensity | dF | H | p | Post Hoc Dunn’s |
|---|---|---|---|---|---|
| P1 amp Cz | 40 | 2 | 1.7 | 0.423 | |
| 60 | 2 | 1.2 | 0.554 | ||
| 80 | 2 | 1.6 | 0.557 | ||
| N1 amp Cz | 40 | 2 | 19 | <0.001 * | NH < HA off |
| 60 | 2 | 8.1 | 0.018 * | NH < HA off | |
| 80 | 2 | 7.1 | 0.029 * | NH < HA off | |
| P2 amp Cz | 40 | 2 | 1.1 | 0.569 | |
| 60 | 2 | 1.4 | 0.504 | ||
| 80 | 2 | 1.7 | 0.437 | ||
| N1-P2 amp Cz | 40 | 2 | 14.1 | <0.001 * | NH > Ha off, HA on |
| 60 | 2 | 12.4 | 0.002 * | NH > HA off | |
| 80 | 2 | 7.3 | 0.027 * | NH > HA off | |
| P1 lat Cz | 40 | 2 | 6.5 | 0.039 * | NH < HA on |
| 60 | 2 | 17 | <0.001 * | NH < HA off, HA on | |
| 80 | 2 | 7.5 | 0.024 * | NH < HA on | |
| N1 lat Cz | 40 | 2 | 8.5 | 0.014 * | NH < HA on |
| 60 | 2 | 16.2 | <0.001 * | NH < HA off, HA on | |
| 80 | 2 | 4.1 | 0.132 | ||
| P2 lat Cz | 40 | 2 | 1.1 | 0.570 | |
| 60 | 2 | 0.5 | 0.779 | ||
| 80 | 2 | 3 | 0.223 | ||
| P1 amp GFP | 40 | 2 | 1.1 | 0.586 | |
| 60 | 2 | 2.2 | 0.328 | ||
| 80 | 2 | 4 | 0.135 | ||
| N1 amp GFP | 40 | 2 | 30.3 | <0.001 * | NH > HA off |
| 60 | 2 | 4.8 | 0.093 | ||
| 80 | 2 | 3 | 0.218 | ||
| P2 amp GFP | 40 | 2 | 2.8 | 0.243 | |
| 60 | 2 | 0.4 | 0.803 | ||
| 80 | 2 | 1 | 0.592 | ||
| P1 lat GFP | 40 | 2 | 10.9 | 0.004 * | NH < HA on |
| 60 | 2 | 7.8 | 0.020 * | NH < HA on | |
| 80 | 2 | 13.9 | <0.001 * | NH < HA on, HA off | |
| N1 lat GFP | 40 | 2 | 13.2 | 0.001 * | NH < HA on, HA off |
| 60 | 2 | 14.7 | <0.001 * | NH < HA on, HA off | |
| 80 | 2 | 3.5 | 0.170 | ||
| P2 lat GFP | 40 | 2 | 4.2 | 0.123 | |
| 60 | 2 | 0.5 | 0.760 | ||
| 80 | 2 | 0.9 | 0.645 |
| Intensity | NH | HA Aided | HA Unaided | |
|---|---|---|---|---|
| Peak dilation (mm) | 40 dBA | 0.08 ± 0.05 | 0.07 ± 0.08 | 0.04 ± 0.09 |
| 60 dBA | 0.11 ± 0.07 | 0.07 ± 0.08 | 0.09 ± 0.10 | |
| 80 dBA | 0.21 ± 0.09 | 0.18 ± 0.13 | 0.11 ± 0.18 | |
| Peak latency (ms) | 40 dBA | 1.11 ± 0.36 | 1.20 ± 0.29 | 1.23 ± 0.36 |
| 60 dBA | 1.32 ± 0.38 | 1.37 ± 0.23 | 1.18 ± 0.25 | |
| 80 dBA | 1.70 ± 0.31 | 1.42 ± 0.37 | 1.33 ± 0.38 |
Publisher’s Note: MDPI stays neutral with regard to jurisdictional claims in published maps and institutional affiliations. |
© 2022 by the authors. Licensee MDPI, Basel, Switzerland. This article is an open access article distributed under the terms and conditions of the Creative Commons Attribution (CC BY) license (https://creativecommons.org/licenses/by/4.0/).
Share and Cite
Legris, E.; Galvin, J.; Mofid, Y.; Aguillon-Hernandez, N.; Roux, S.; Aoustin, J.-M.; Gomot, M.; Bakhos, D. Relationship between Behavioral and Objective Measures of Sound Intensity in Normal-Hearing Listeners and Hearing-Aid Users: A Pilot Study. Brain Sci. 2022, 12, 392. https://doi.org/10.3390/brainsci12030392
Legris E, Galvin J, Mofid Y, Aguillon-Hernandez N, Roux S, Aoustin J-M, Gomot M, Bakhos D. Relationship between Behavioral and Objective Measures of Sound Intensity in Normal-Hearing Listeners and Hearing-Aid Users: A Pilot Study. Brain Sciences. 2022; 12(3):392. https://doi.org/10.3390/brainsci12030392
Chicago/Turabian StyleLegris, Elsa, John Galvin, Yassine Mofid, Nadia Aguillon-Hernandez, Sylvie Roux, Jean-Marie Aoustin, Marie Gomot, and David Bakhos. 2022. "Relationship between Behavioral and Objective Measures of Sound Intensity in Normal-Hearing Listeners and Hearing-Aid Users: A Pilot Study" Brain Sciences 12, no. 3: 392. https://doi.org/10.3390/brainsci12030392