
Validation of a Light EEG-Based Measure for Real-Time Stress Monitoring during Realistic Driving

 , ,
, ,  , , ,
, , ,  , and
, and
Abstract
:1. Introduction
2. Materials and Methods
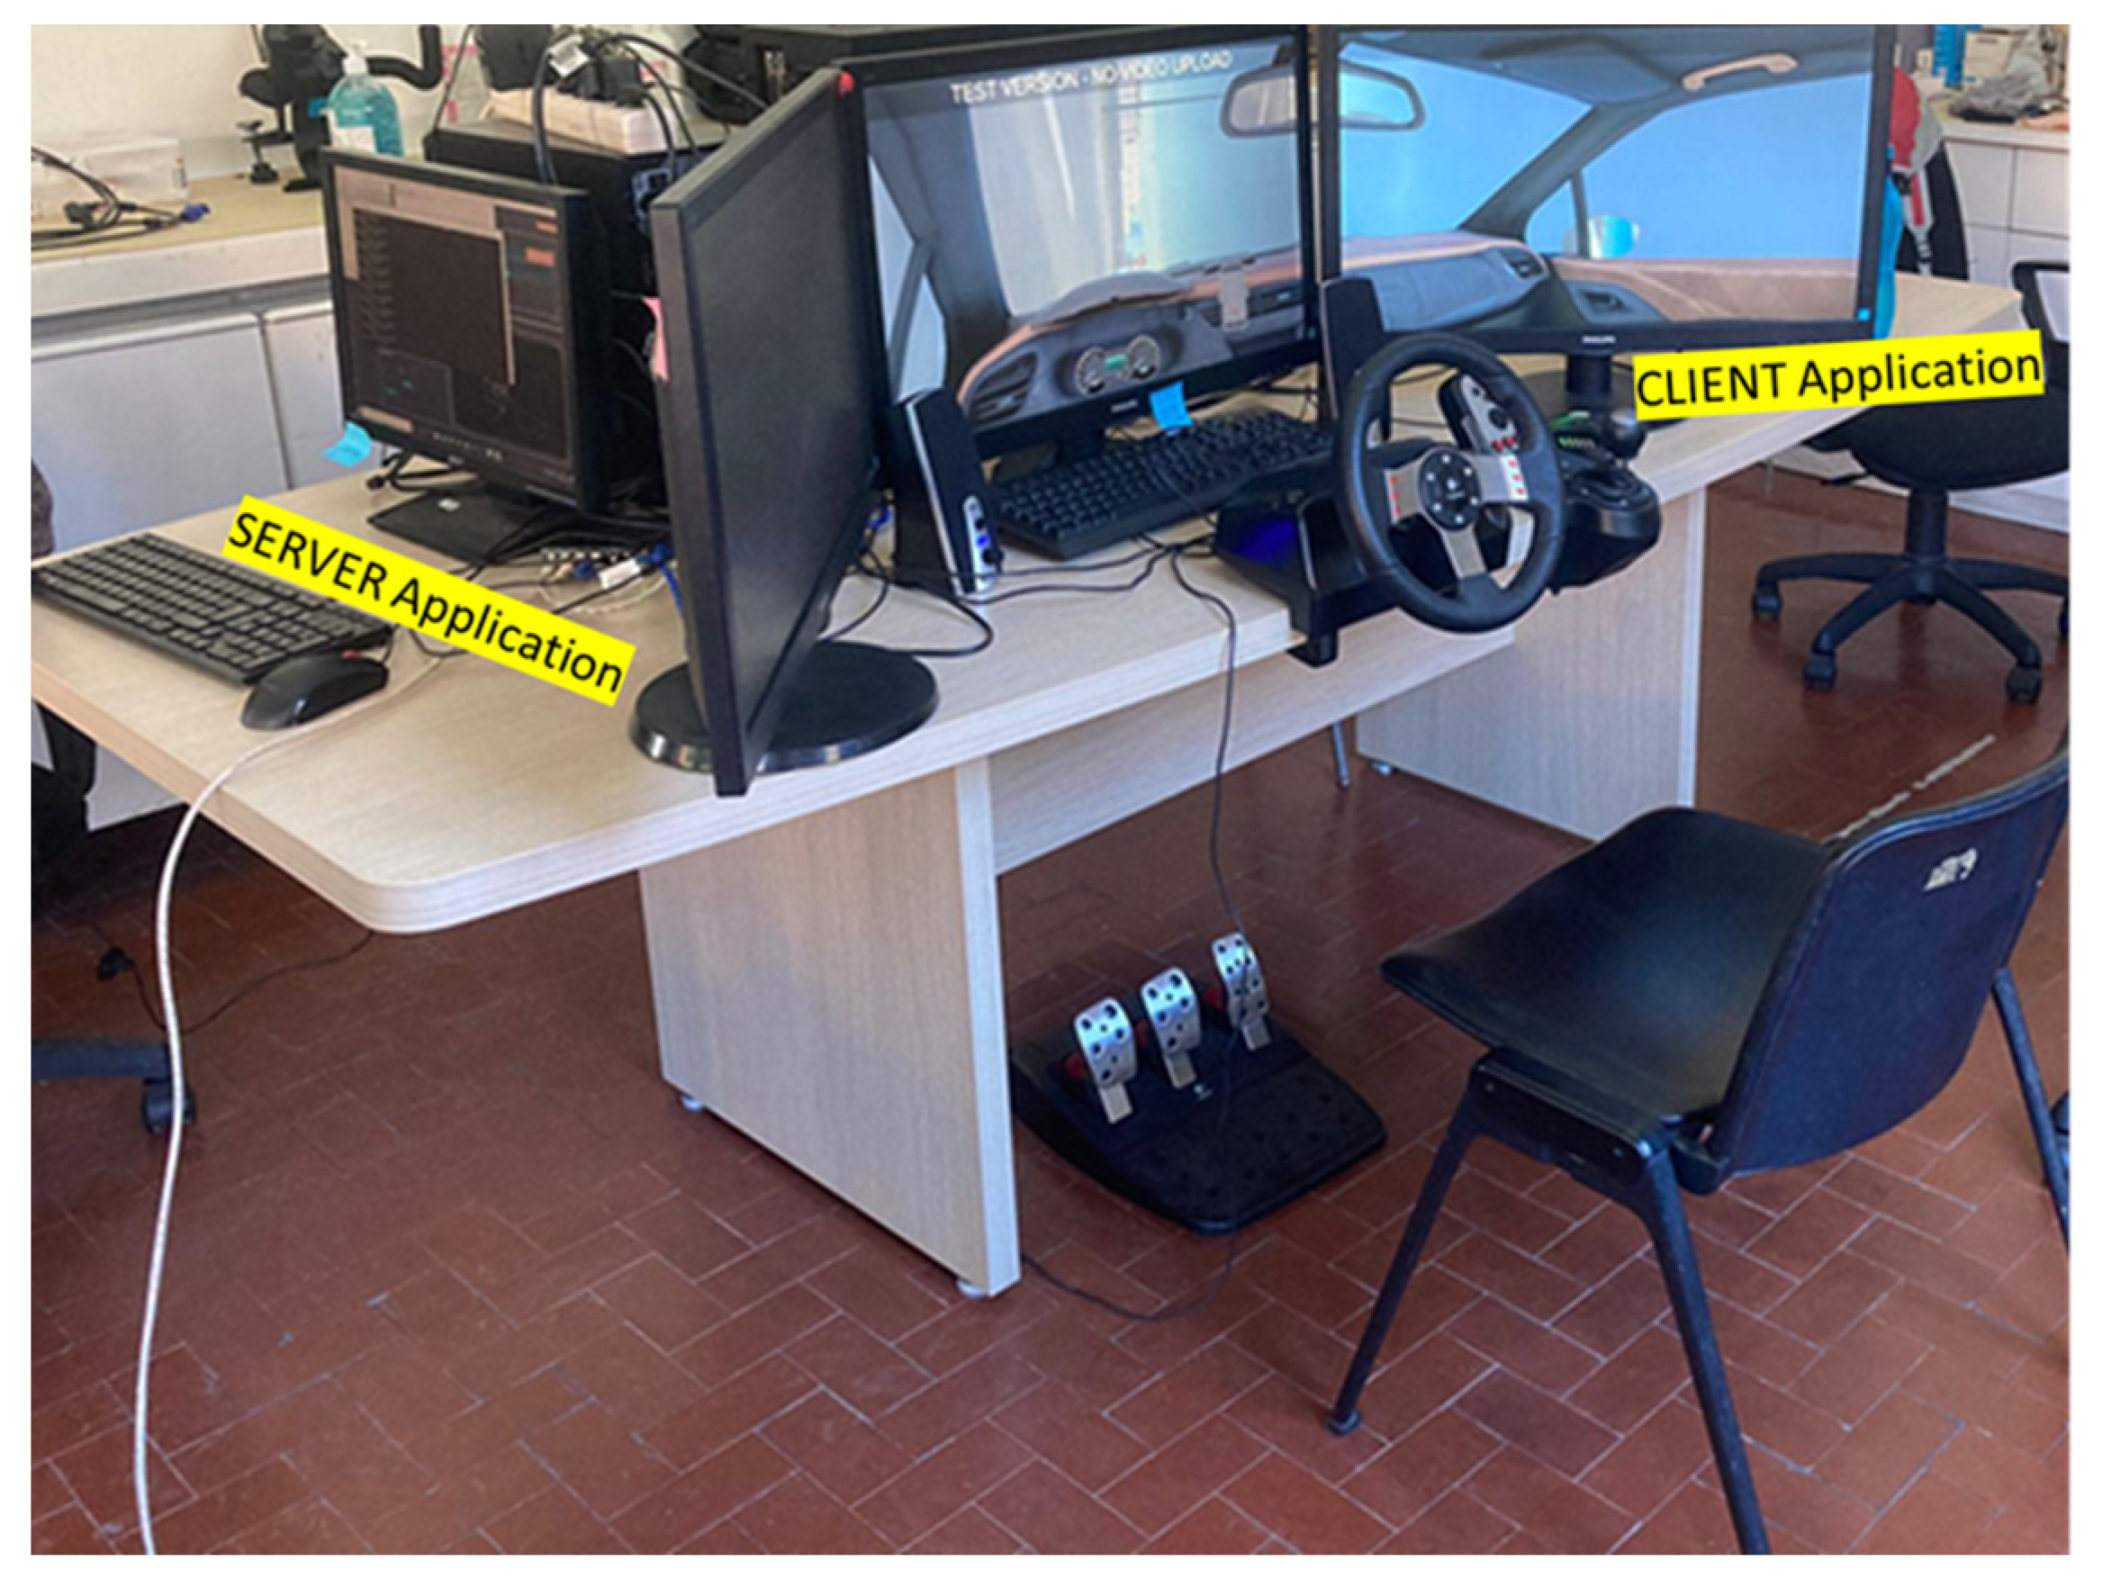
2.1. Experimental Setup
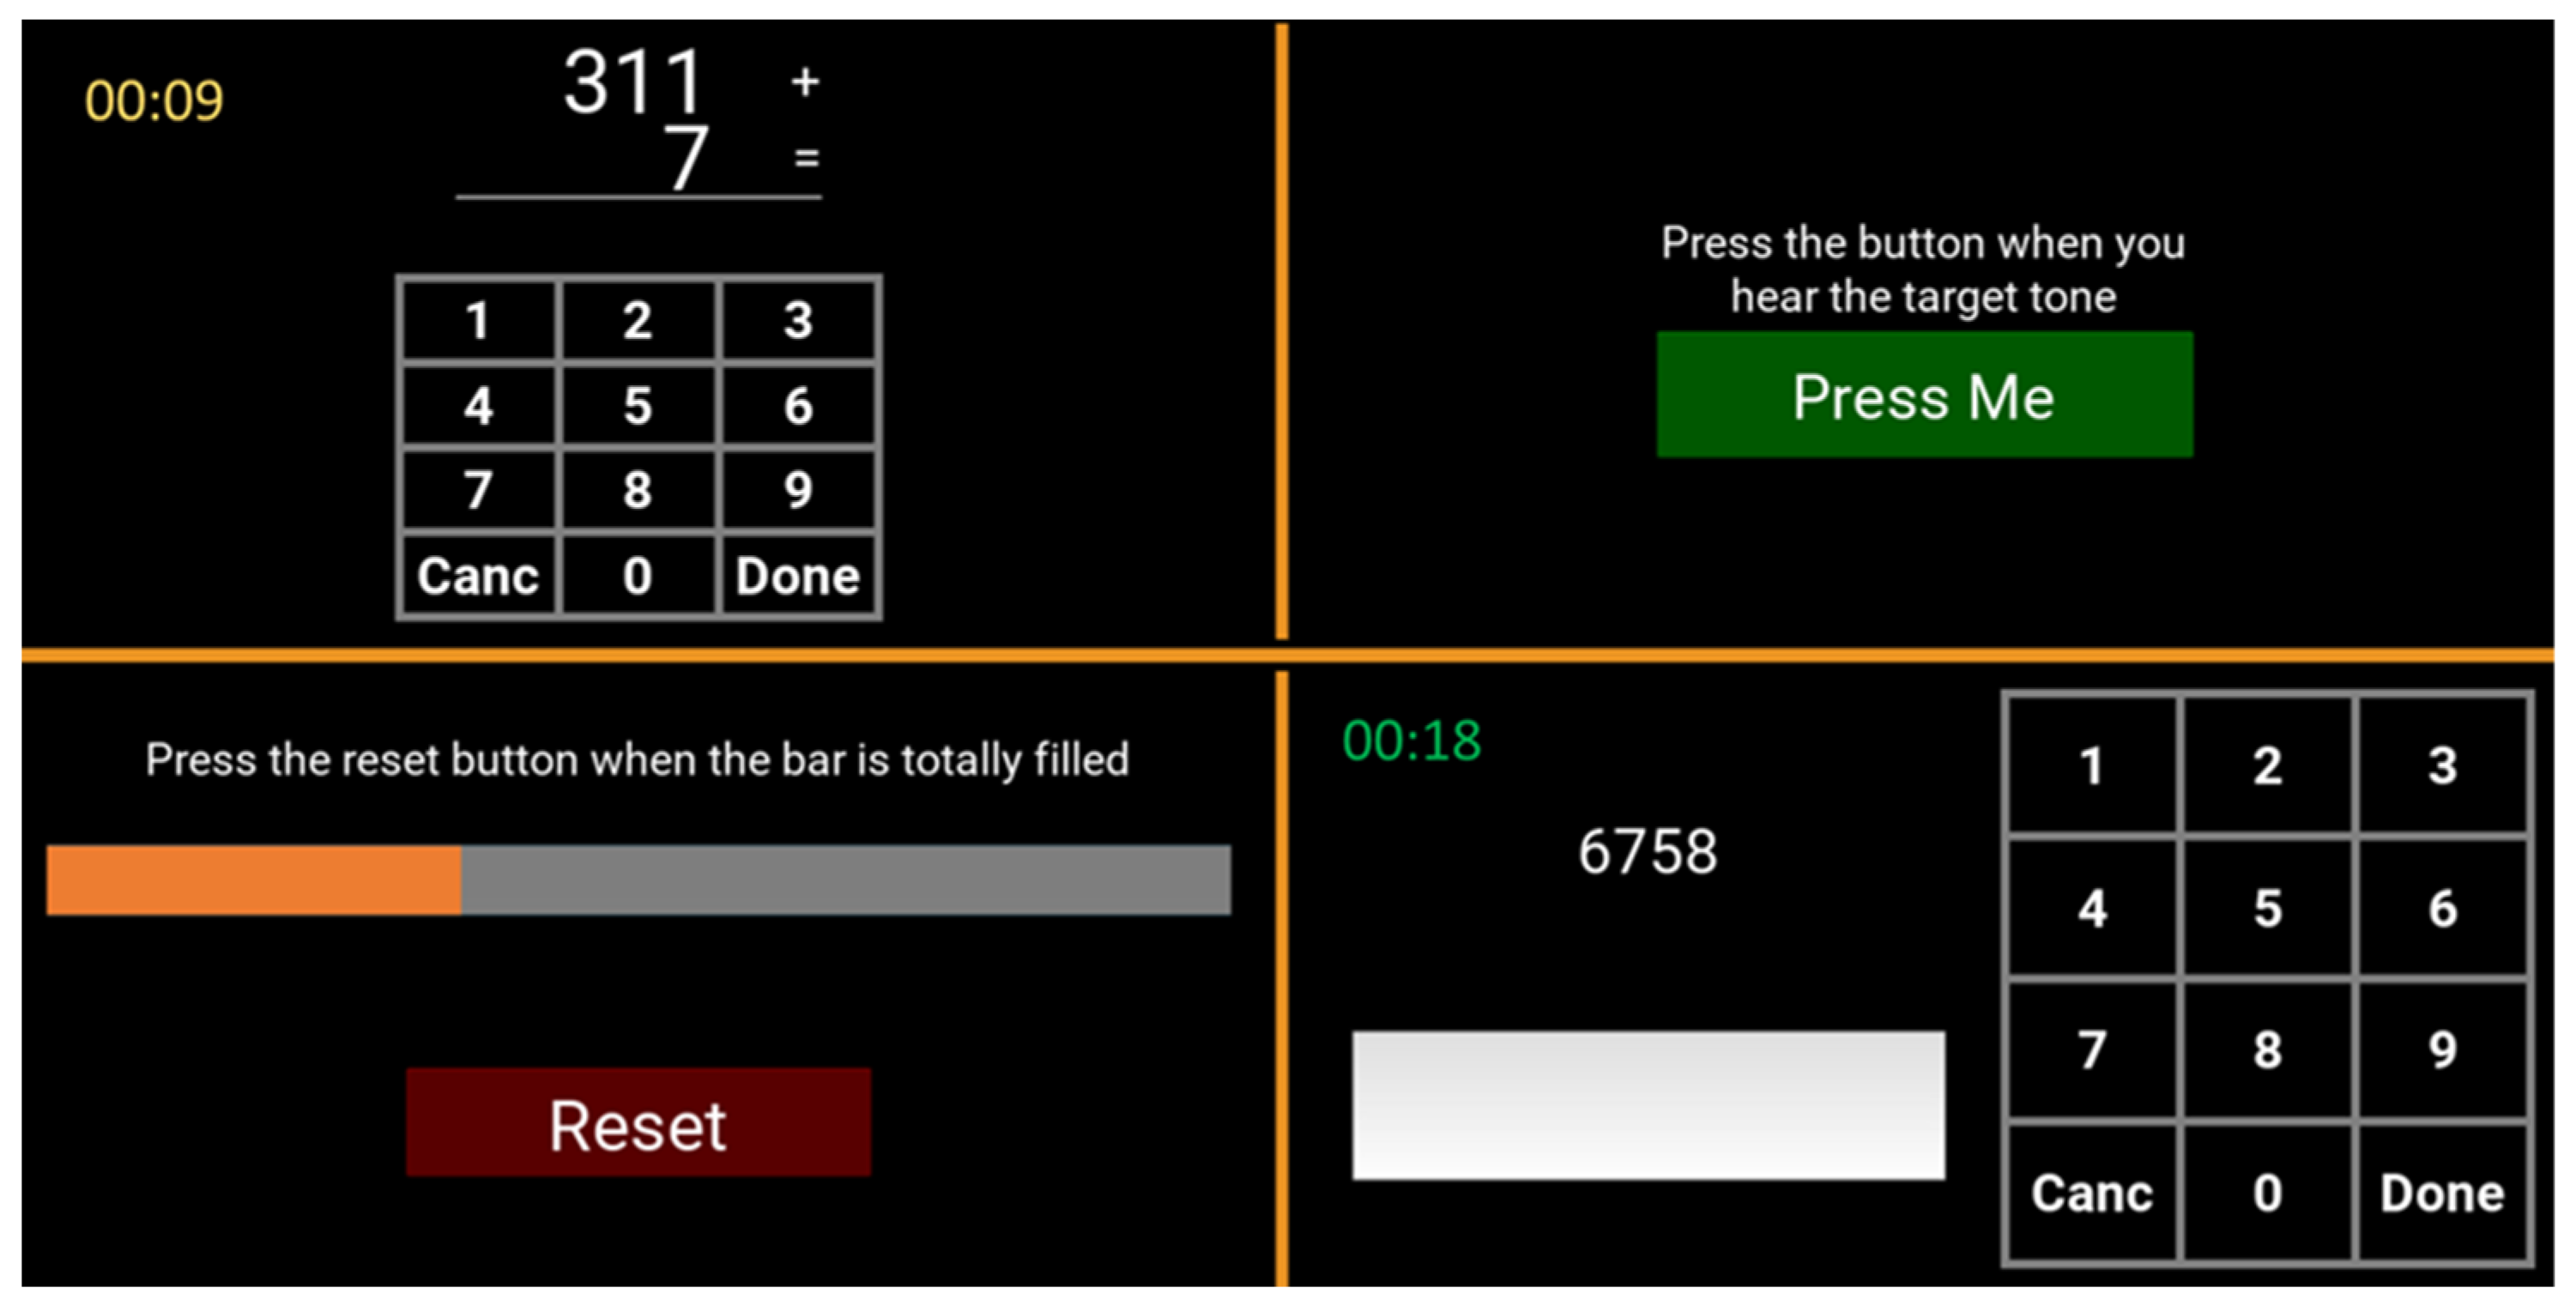
2.2. Multitasking
- Mental Arithmetic (Left-Up): addition results must be entered into the numeric touch screen keypad. As the difficulty increases, the number of digits (from 1 to 3) and carryover digits (from 0 to 2) increase.
- Auditory Monitoring (Right-Up): A target tone must be identified between two tones of different frequencies emitted at regular intervals. As the difficulty increases, the target tone and distractor tone increase in similarity.
- Visual Monitoring (Left-Down): A horizontal fill bar should be reset as soon as it becomes full. As the difficulty increases, the fill rate increases.
- Phone Number Entry Task (Right-Down): A number must be entered on the touch screen keypad. As the difficulty increases, the number of digits to be entered increases (from 4 to 10).
2.3. Realistic Driving
- Time pressure: subjects have a limited time to make the same route. A chronometer was used to show the remaining time.
- White Coat effect: An operator was just behind the driver, taking notes of errors committed.
- External noise: Car traffic noise was introduced during the exercise.
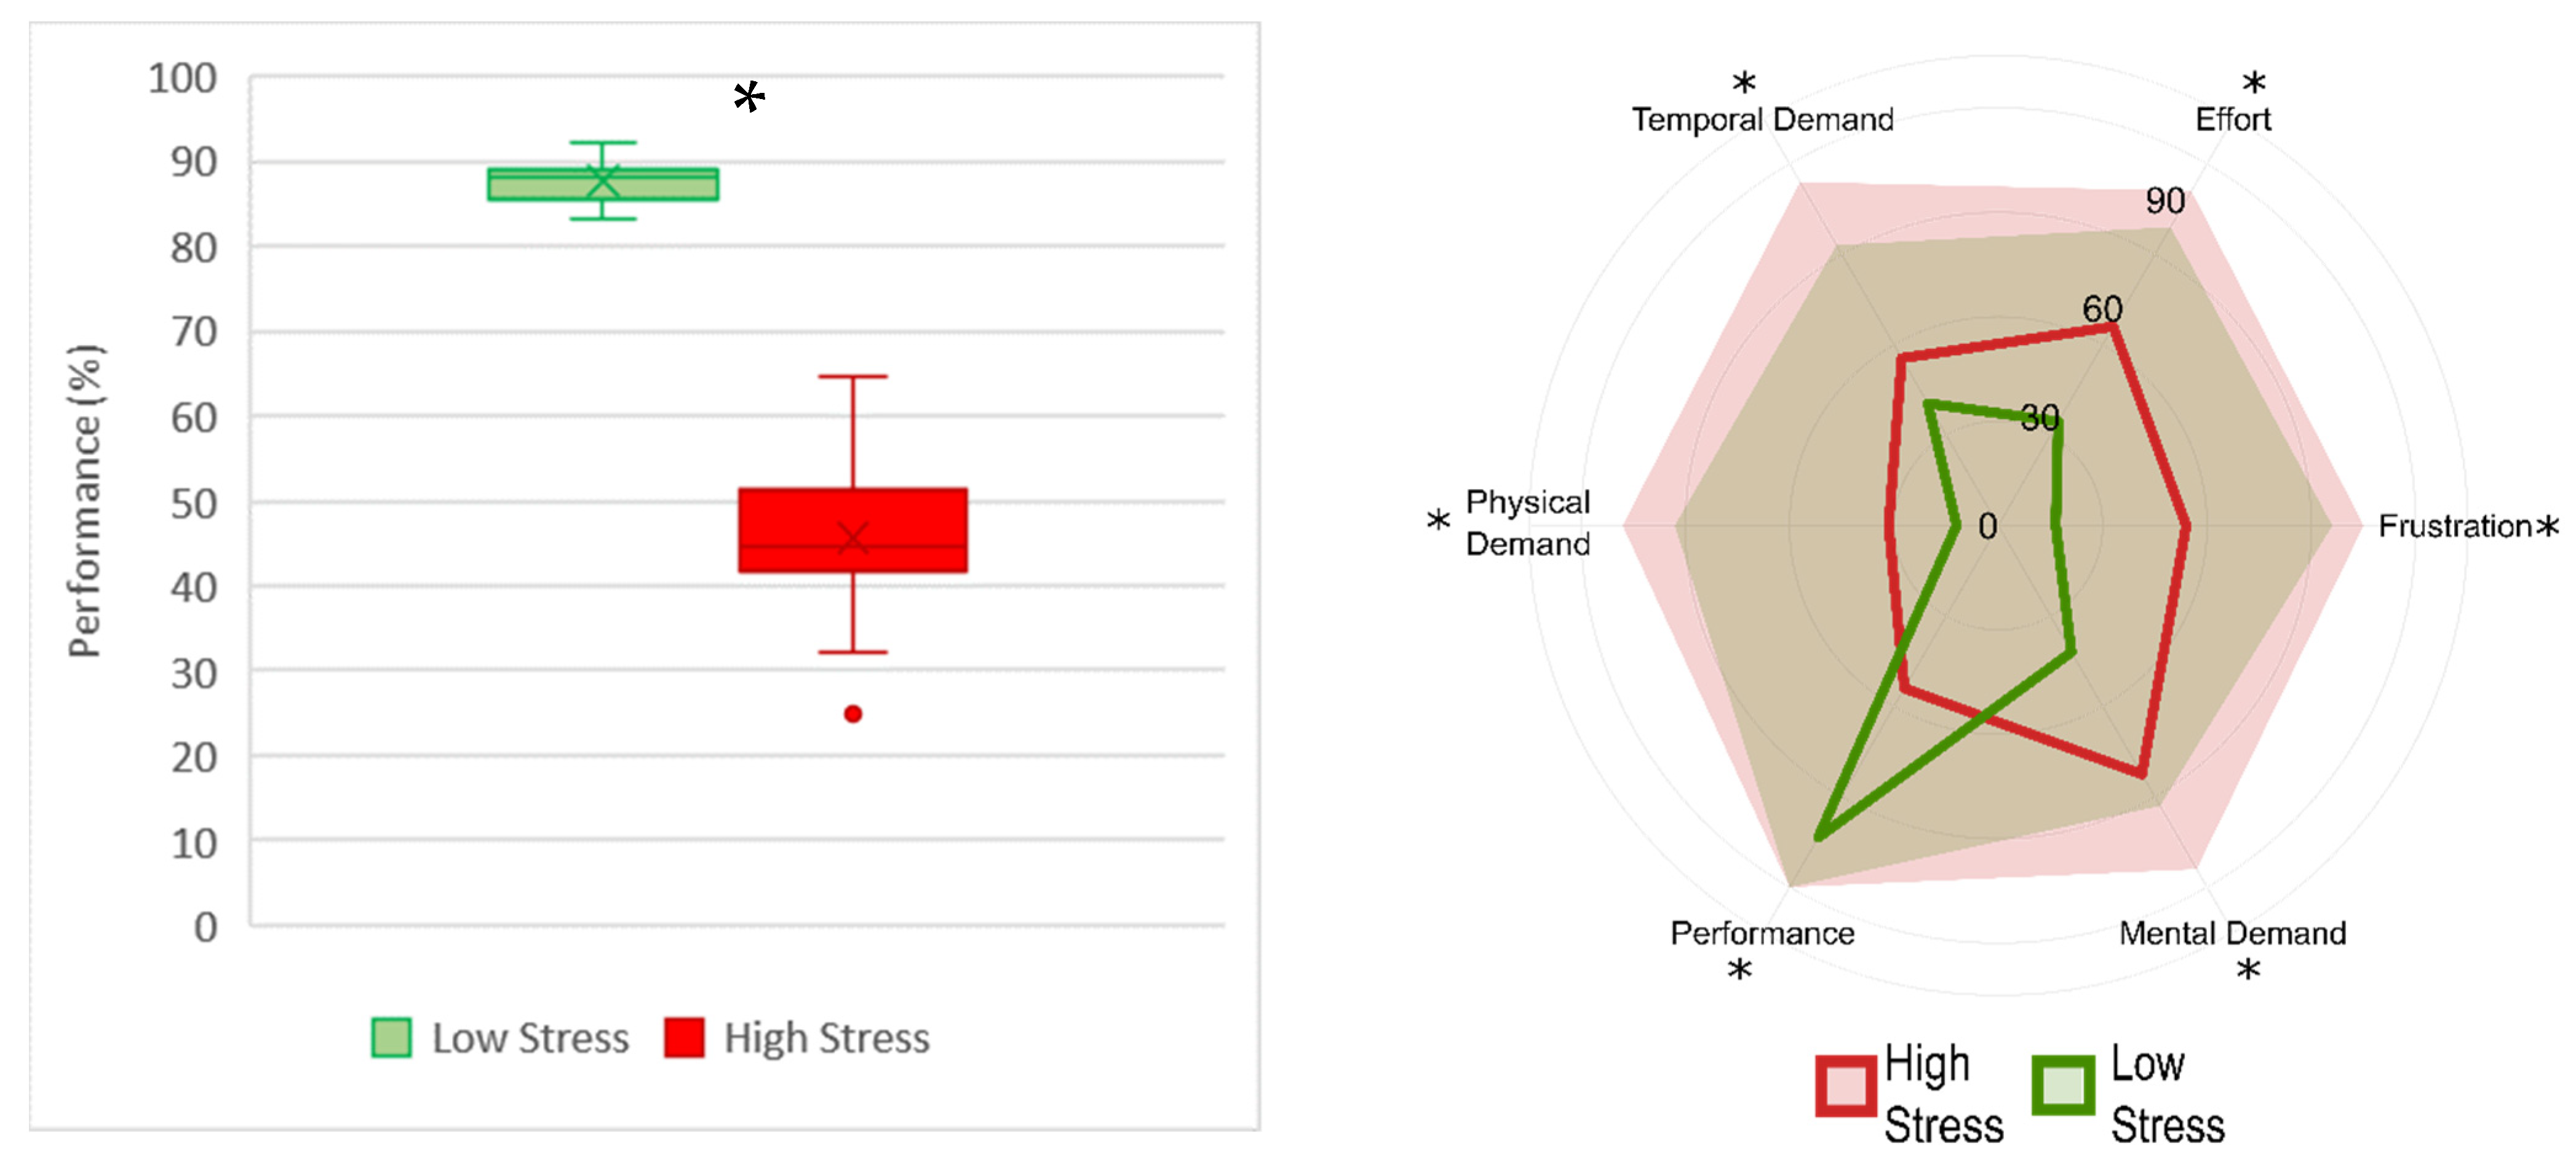
2.4. Subjective Assessment: NASA-TLX Questionnaire
2.5. Physiological Assessment: Electrodermal Activity
2.6. Neurophysiological Assessment: Electroencephalographic Signals
2.7. Machine Learning Model
- o
- Number of estimators: range from 50 to 500;
- o
- Max depth: range from 2 to 30;
- o
- Min samples split range from 0.01 to 0.5;
- o
- Min samples leaf range from 0.01 to 0.5; and
- o
- Max leaf nodes range from 2 to 40.
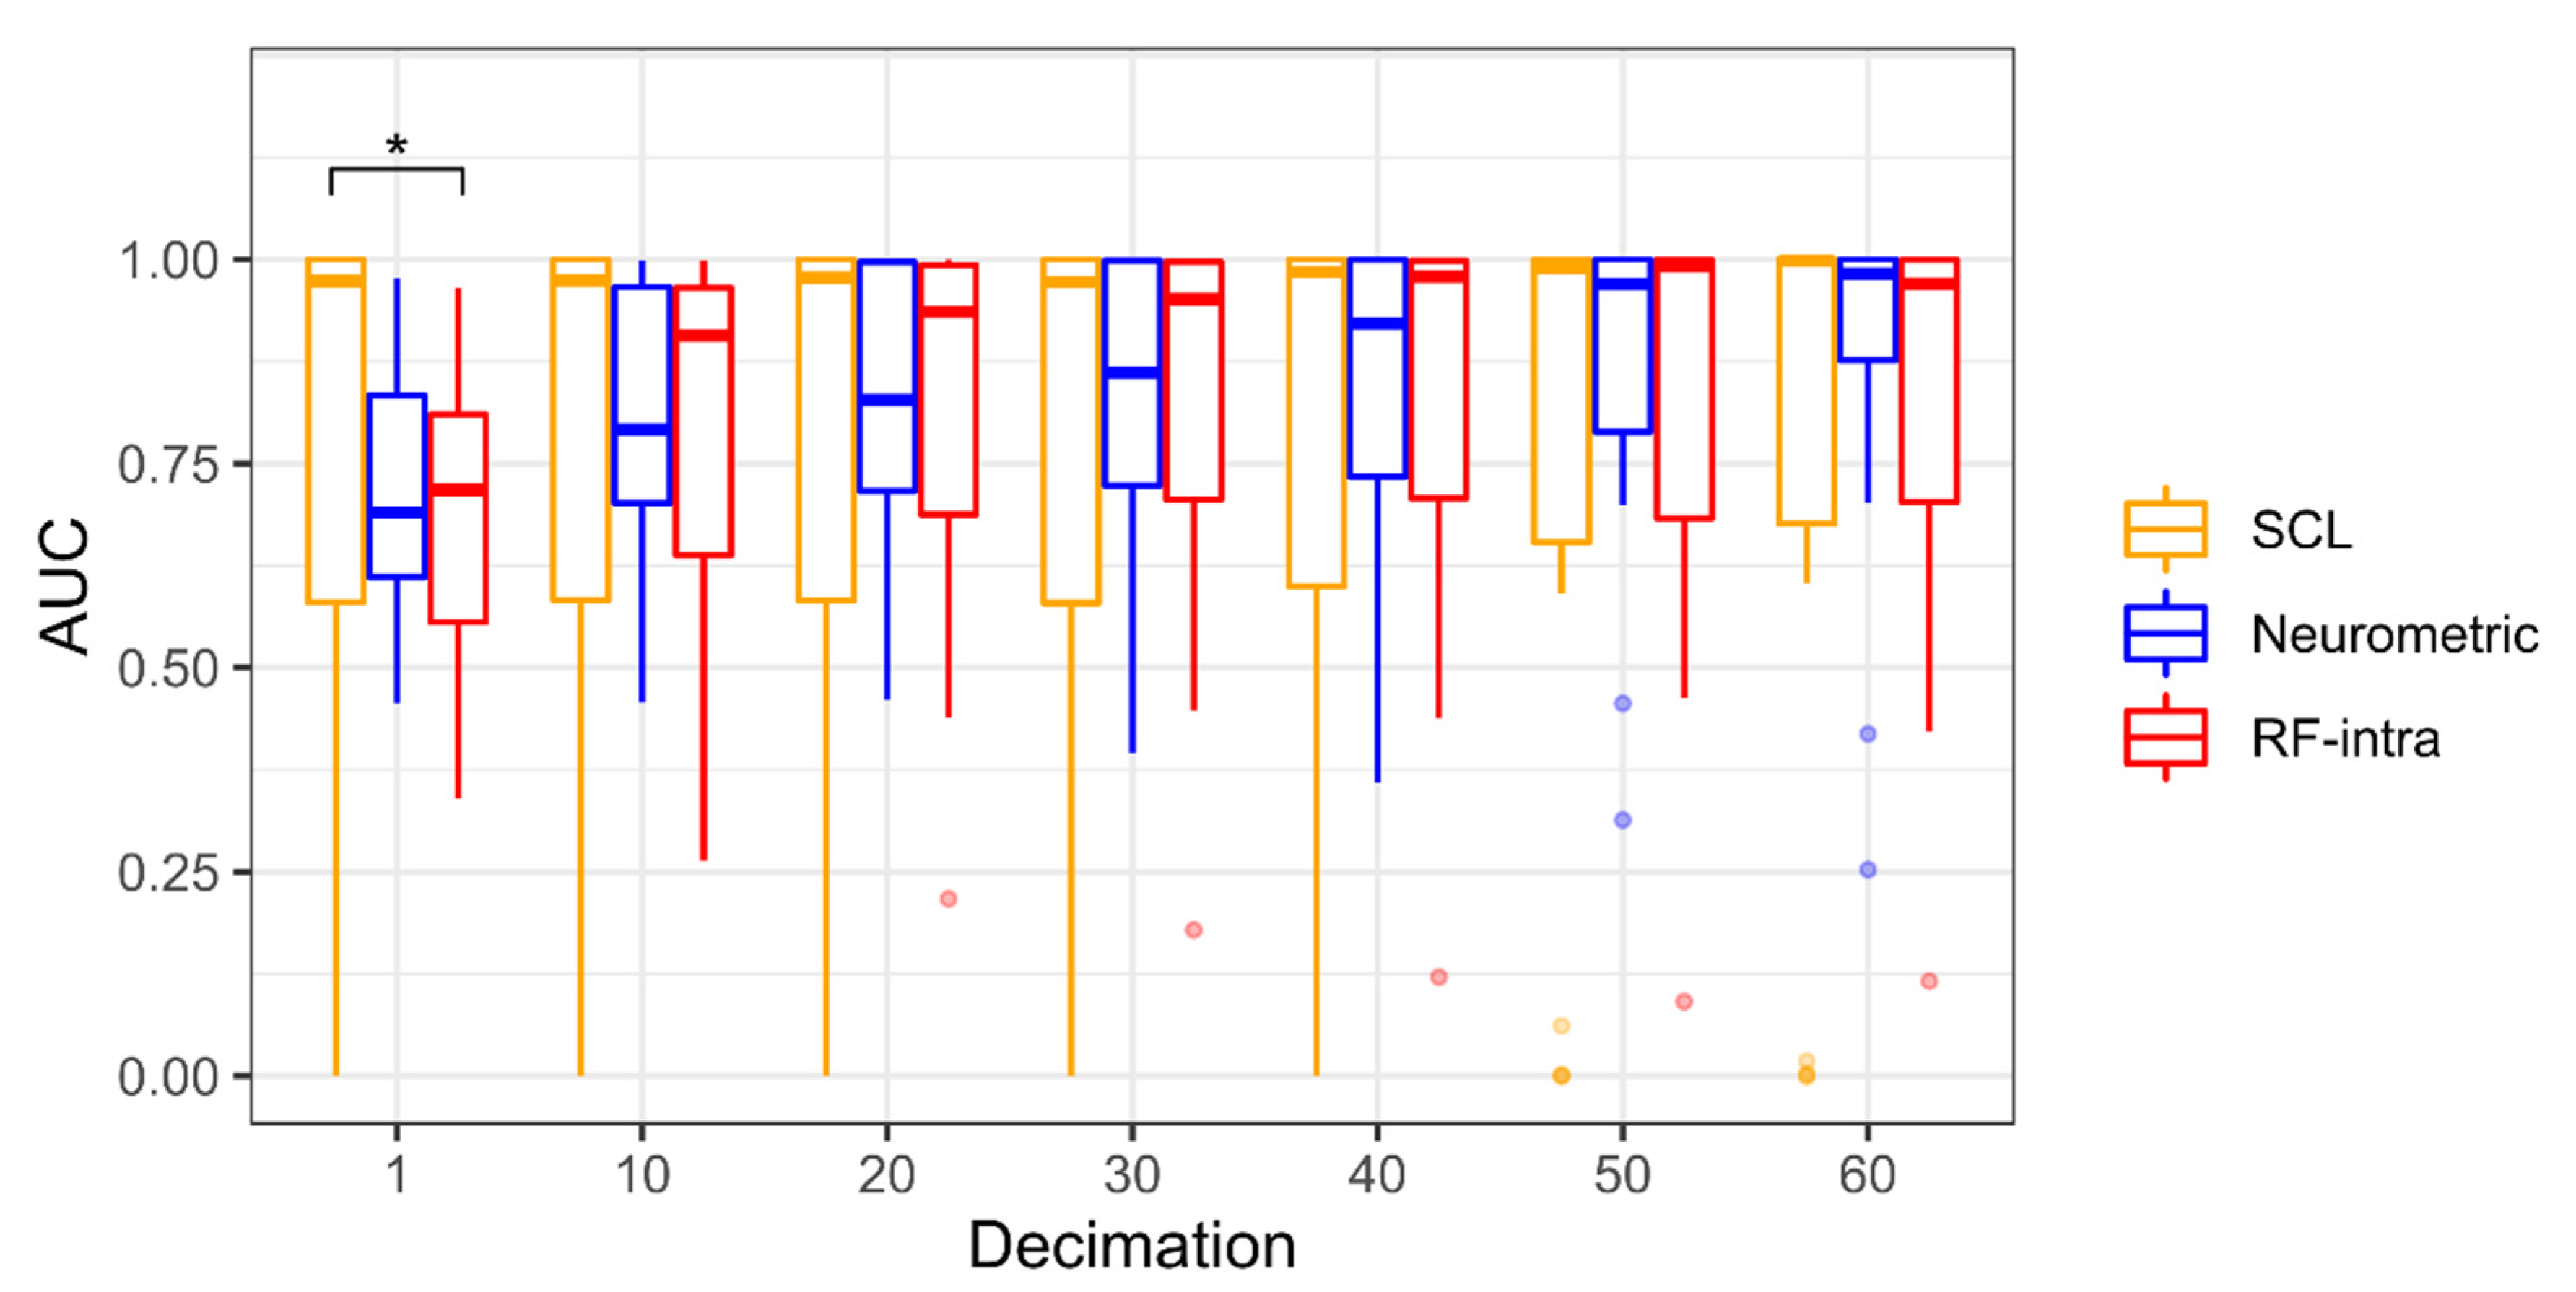
2.8. Evaluation of Models Effectiveness
2.9. Statistical Analysis
3. Results
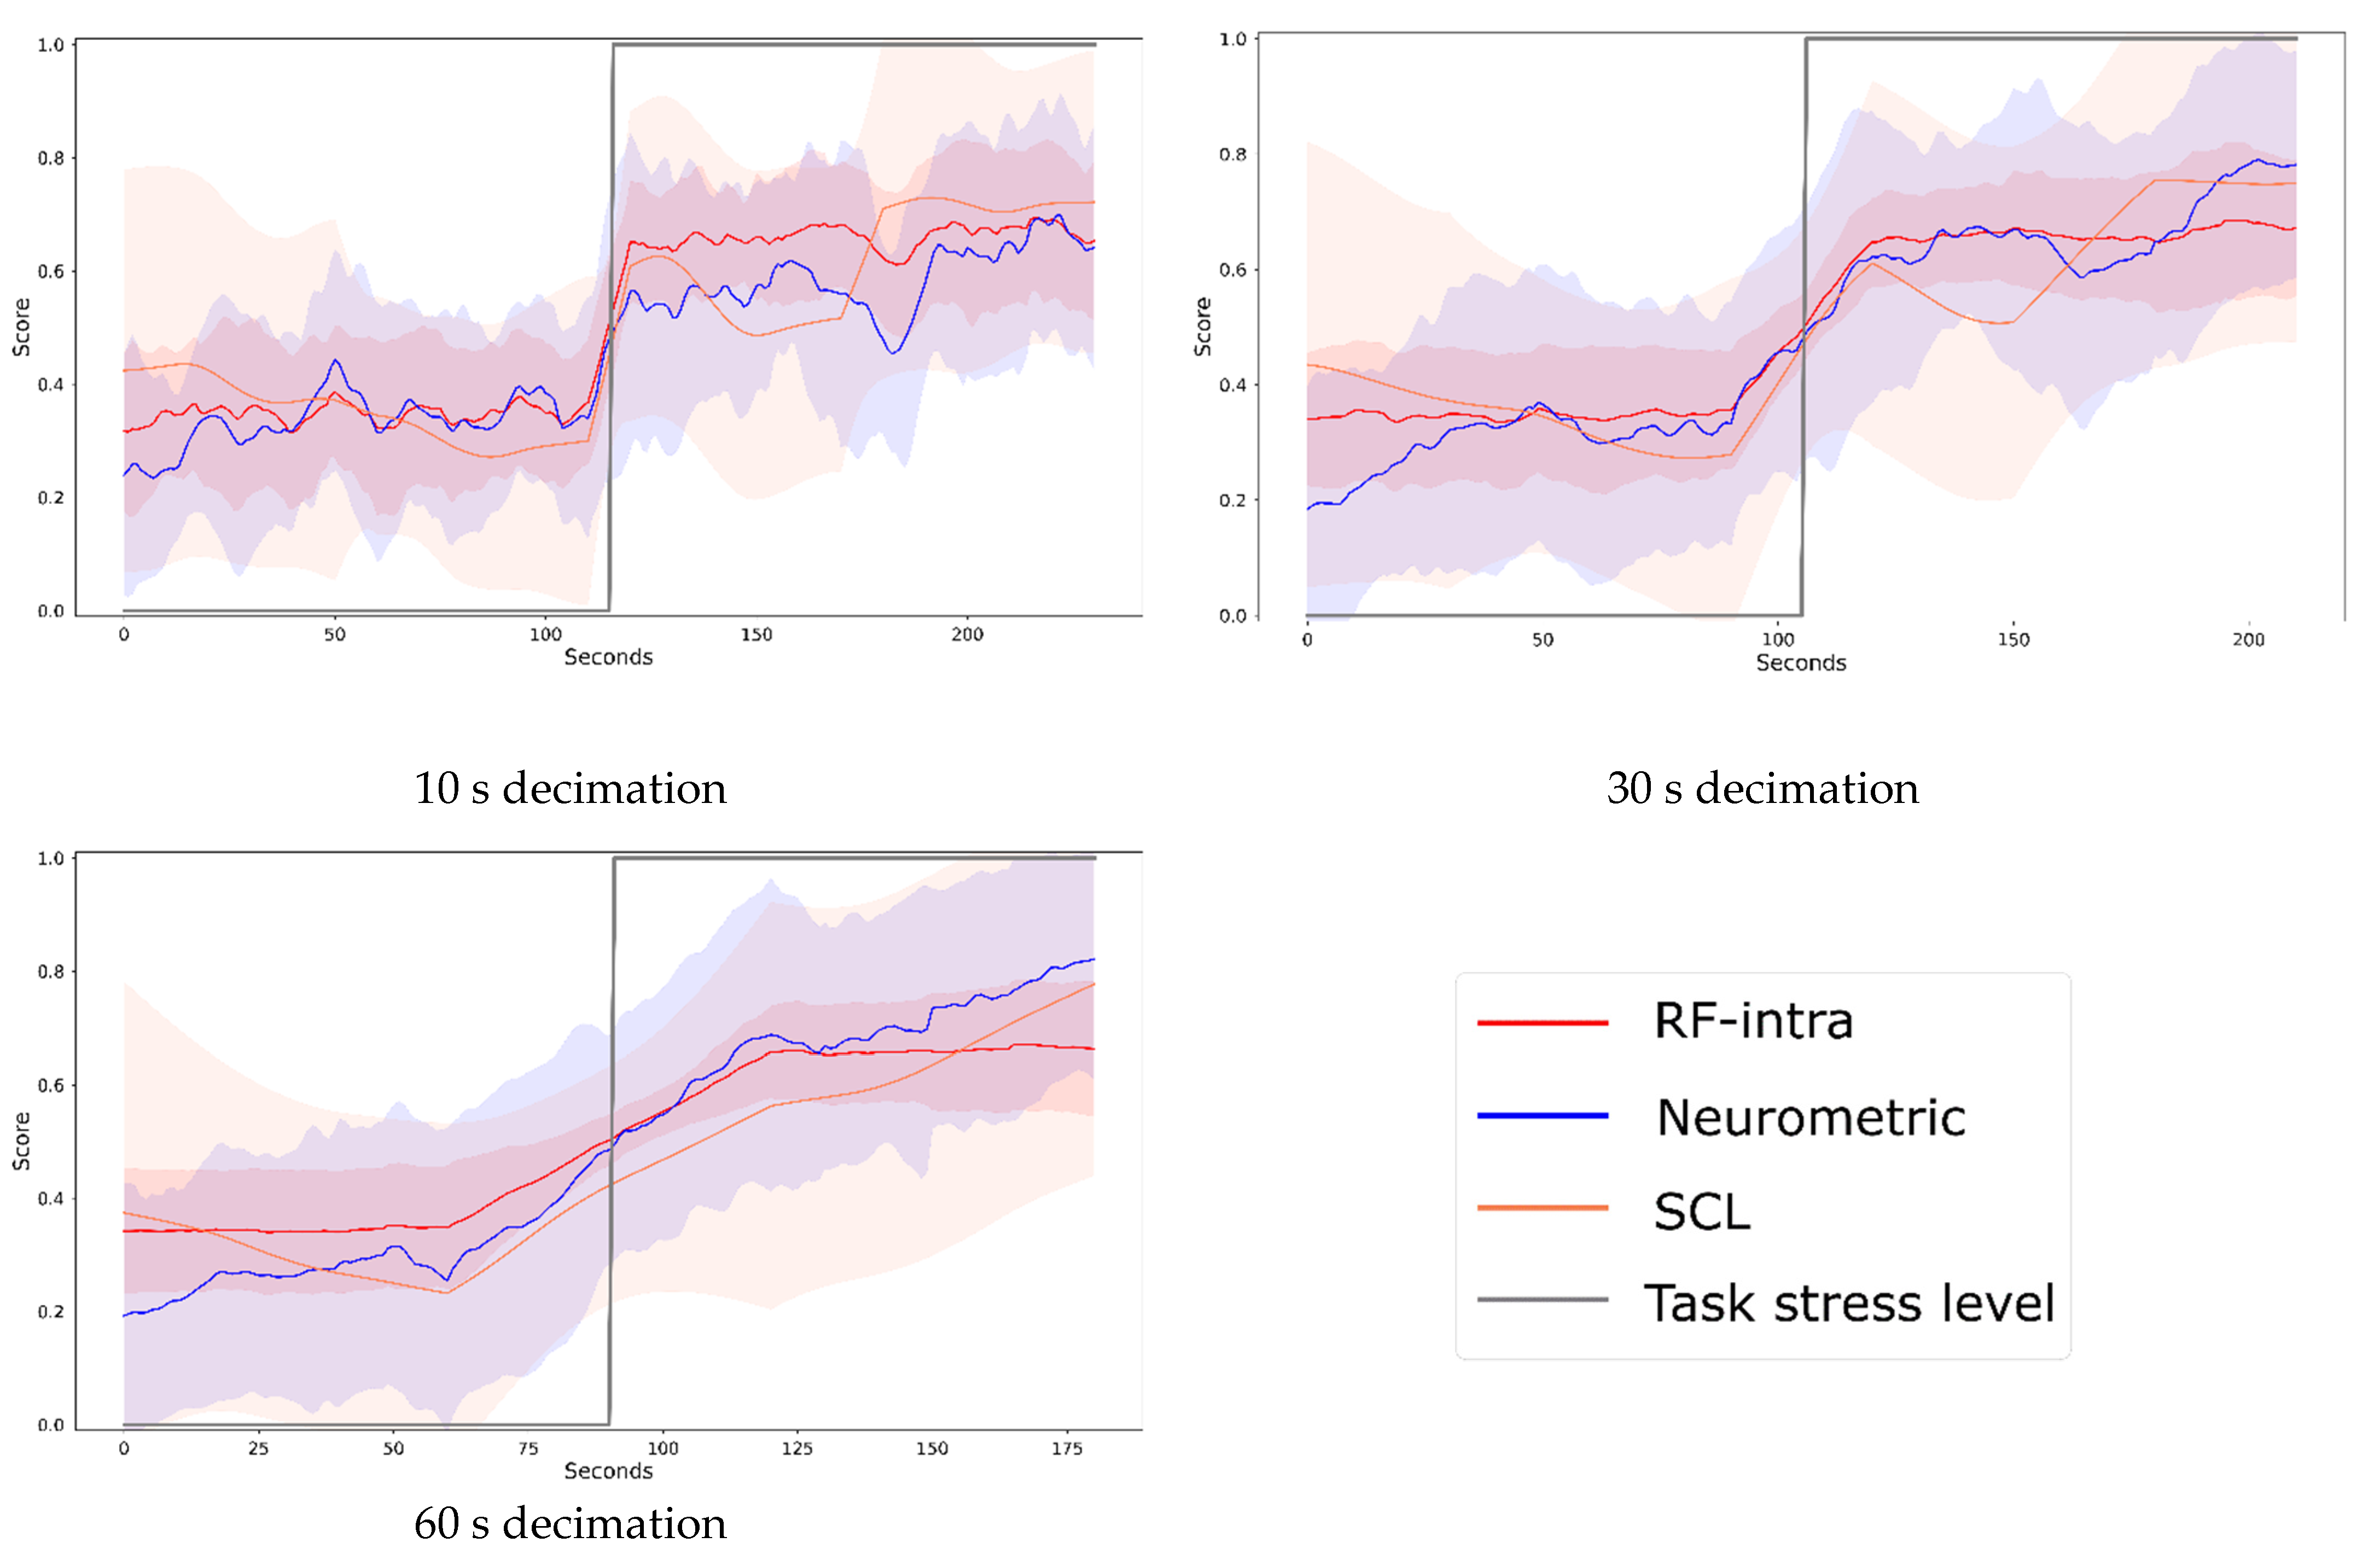
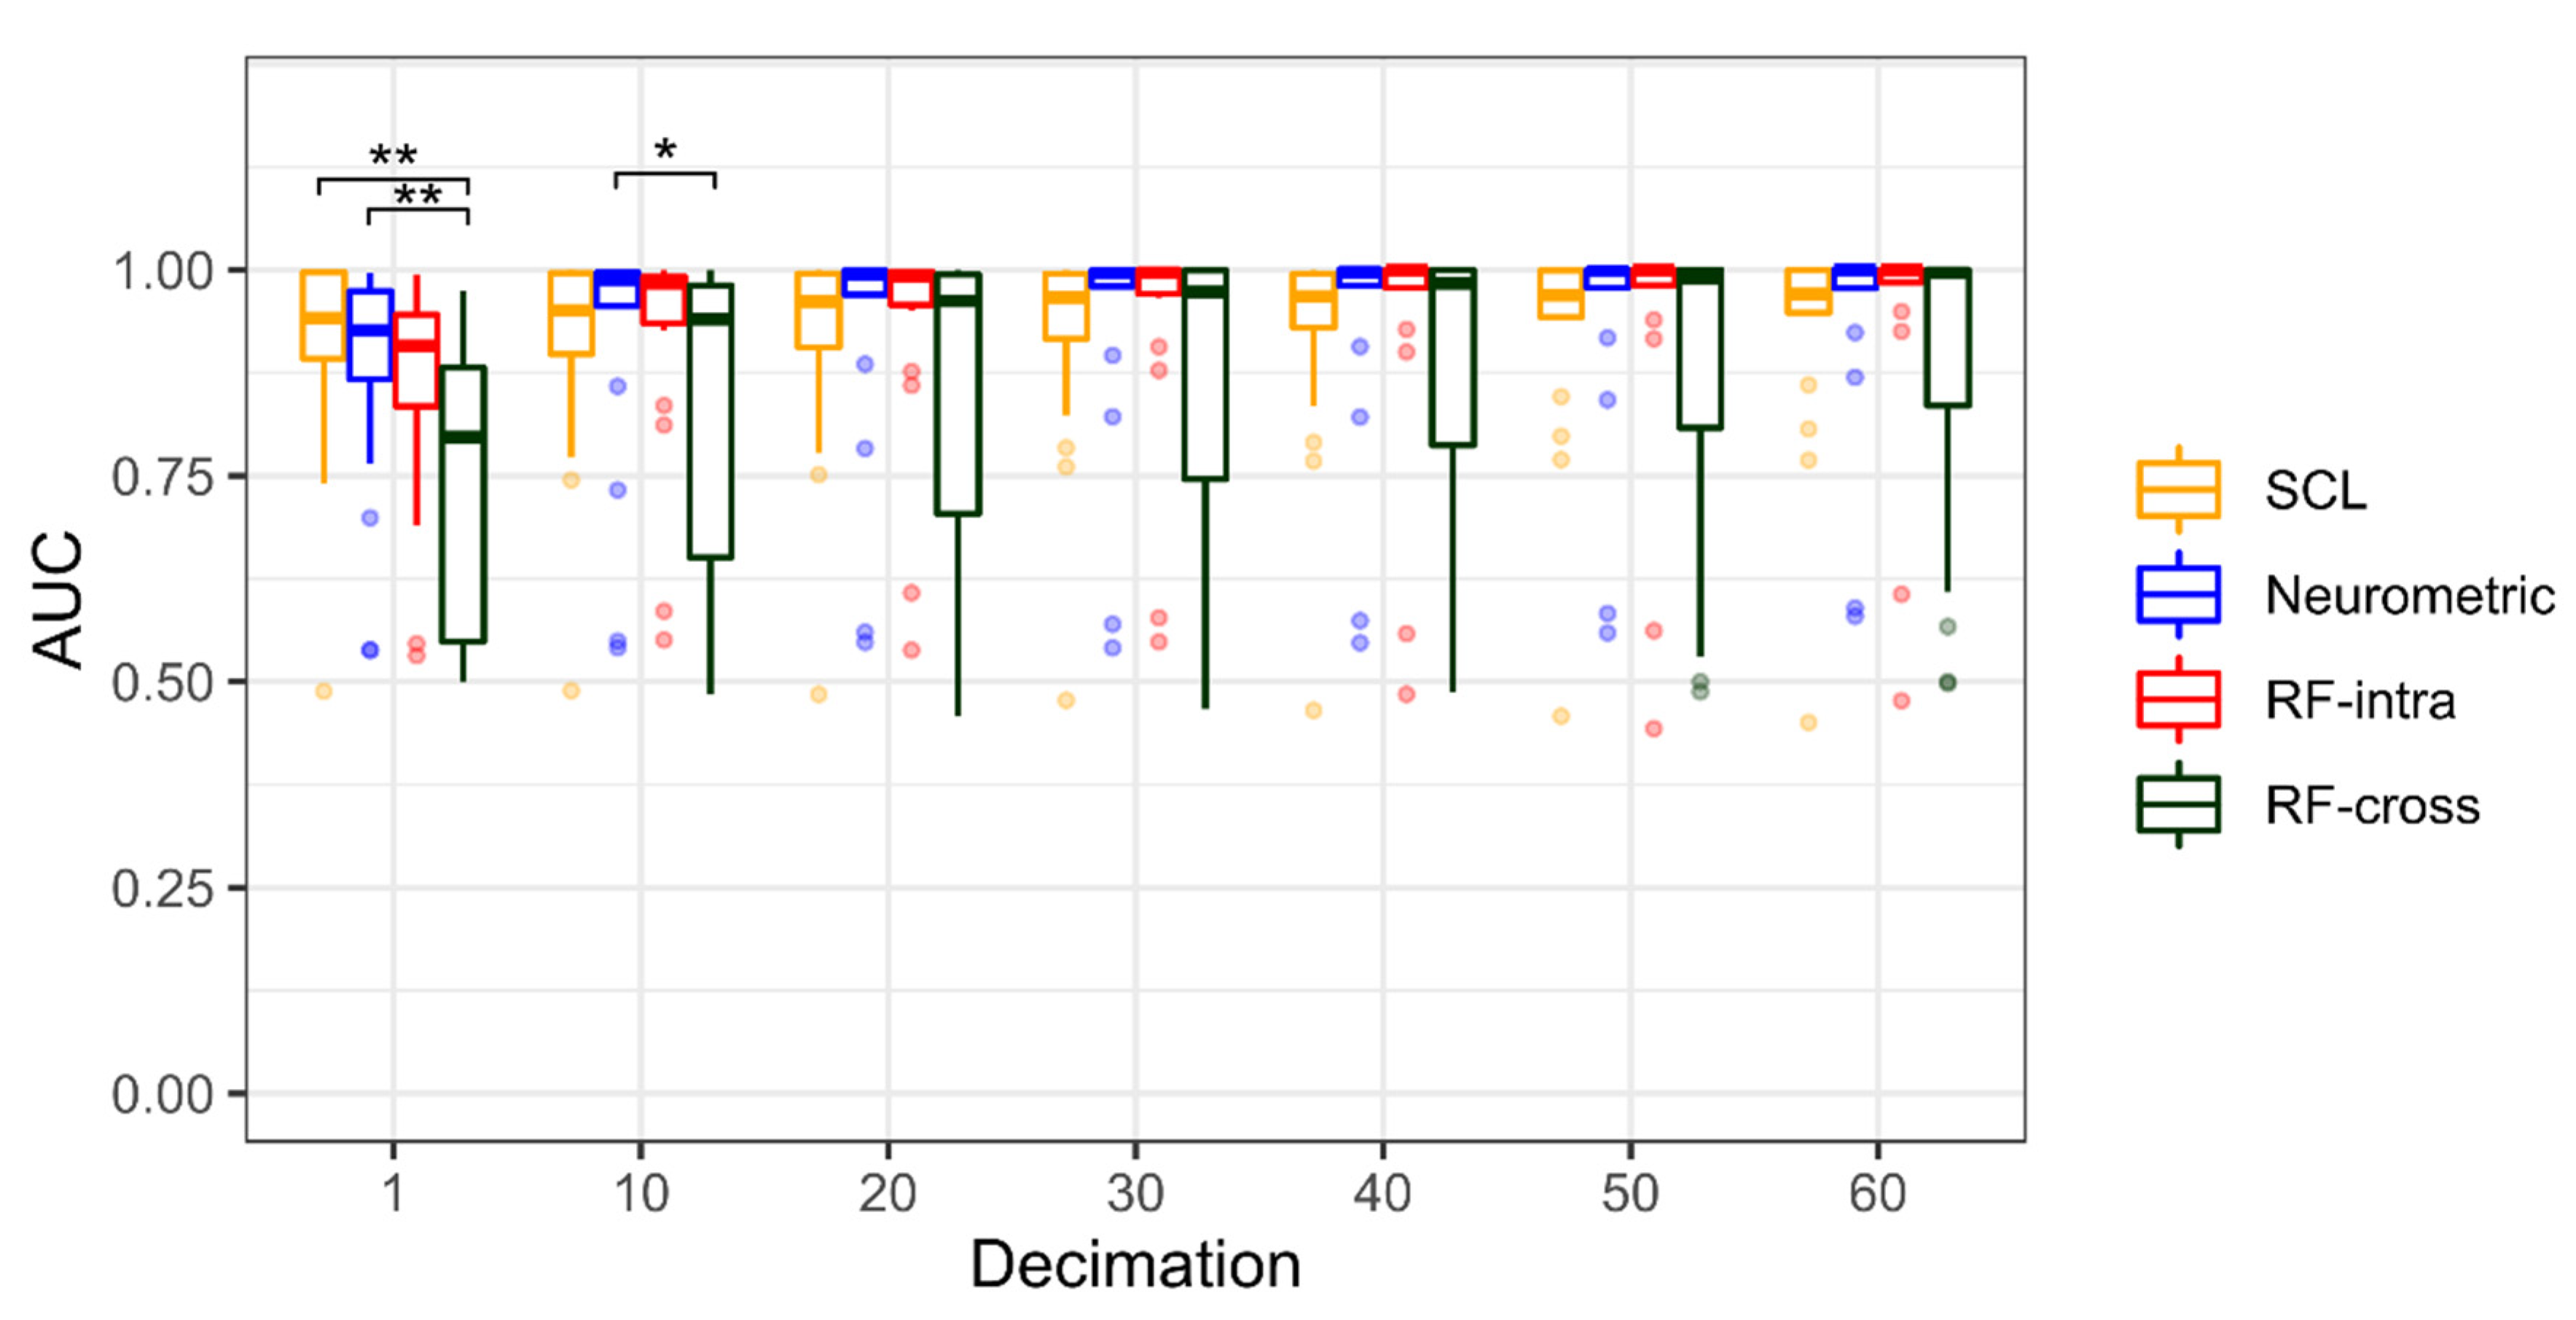
3.1. Multitasking
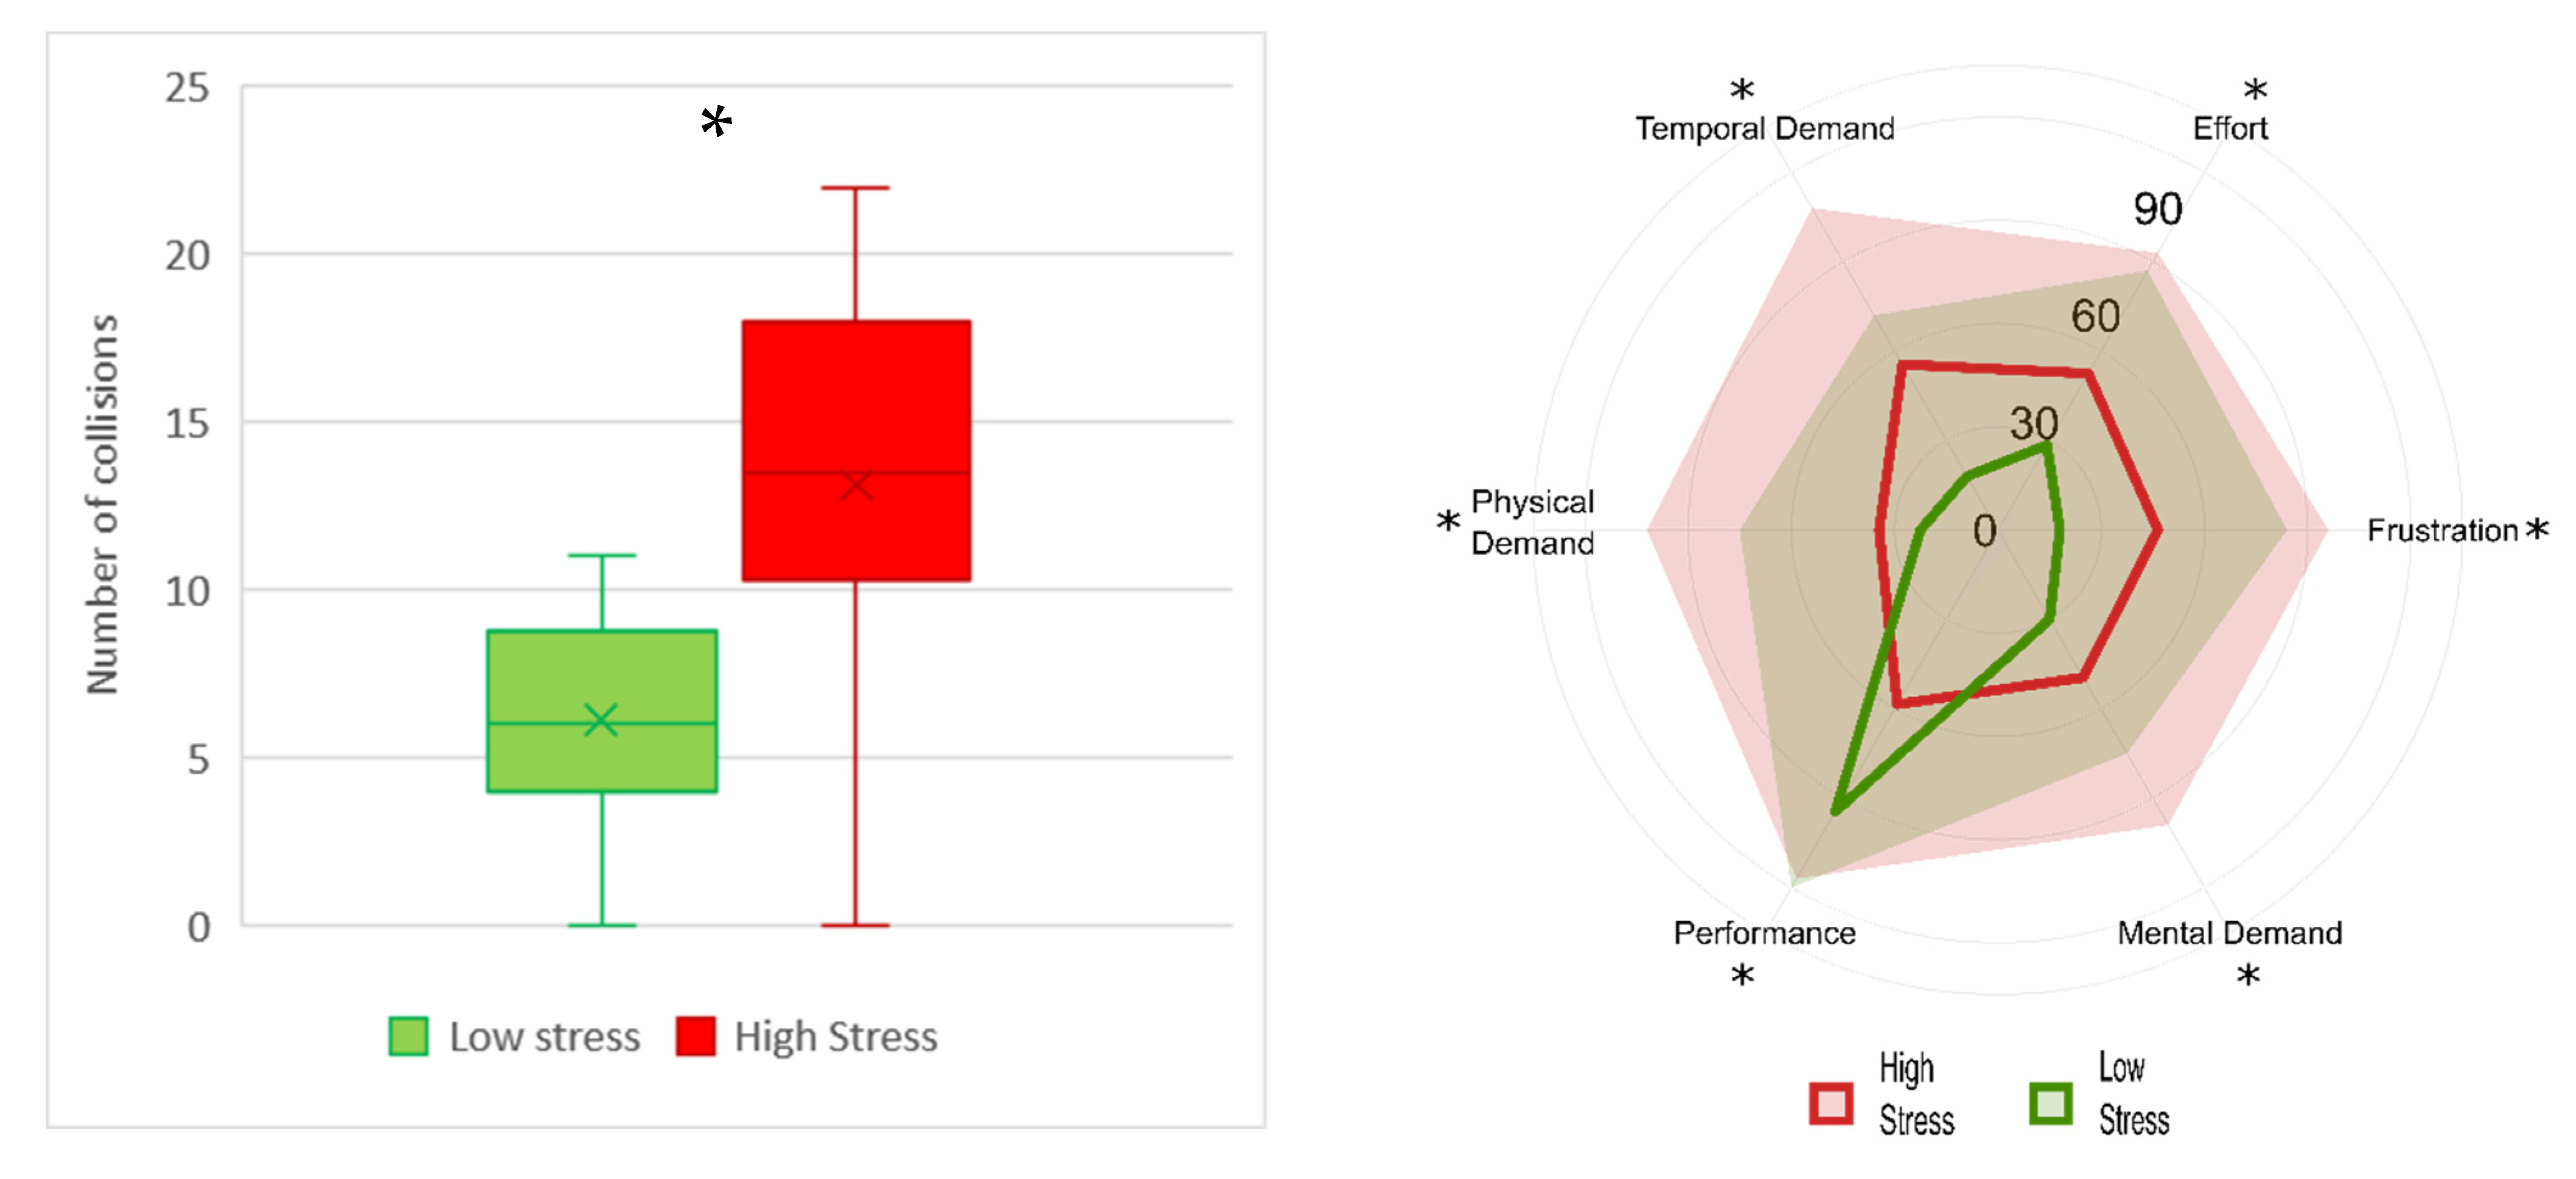
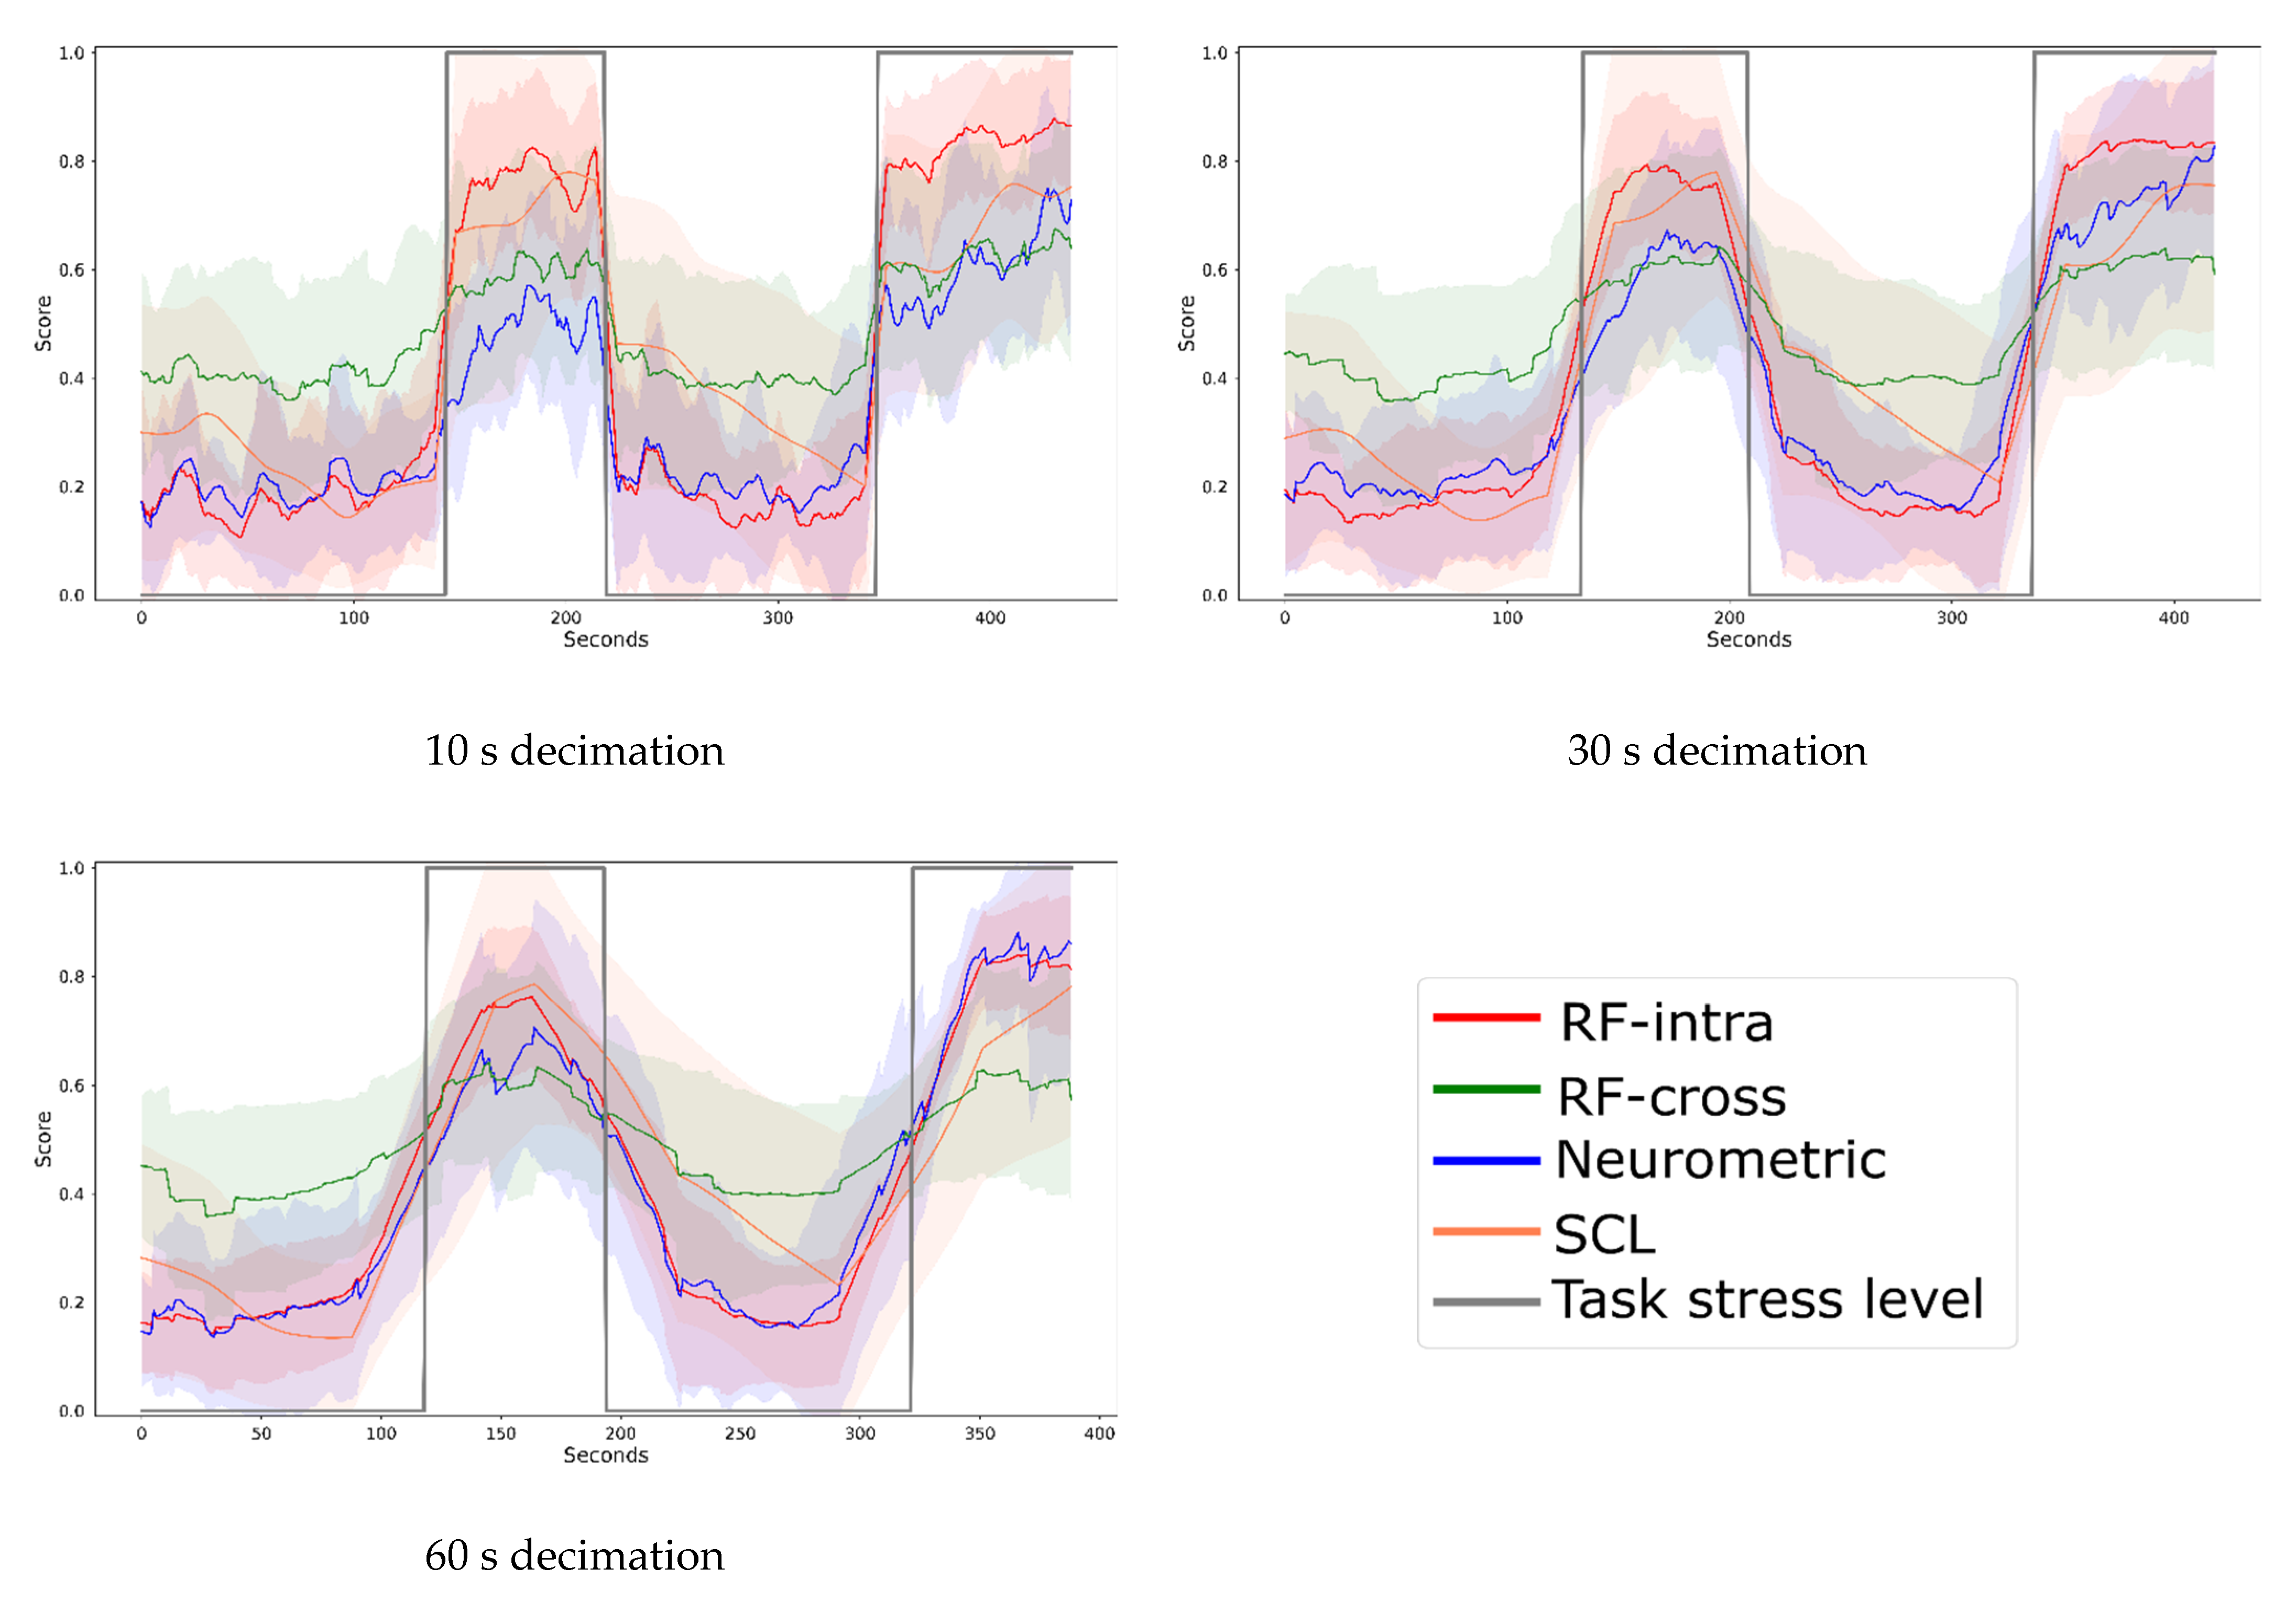
3.2. Realistic Driving
4. Discussion
5. Conclusions
Author Contributions
Funding
Institutional Review Board Statement
Informed Consent Statement
Data Availability Statement
Acknowledgments
Conflicts of Interest
References
- Lazarus, R.S.; Folkman, S. Stress, Appraisal, and Coping; Springer Publishing Company: New York, NY, USA, 1984; ISBN 0826141927. [Google Scholar]
- Rastgoo, M.N.; Nakisa, B.; Rakotonirainy, A.; Chandran, V.; Tjondronegoro, D. A critical review of proactive detection of driver stress levels based on multimodal measurements. ACM Comput. Surv. 2018, 51, 88. [Google Scholar] [CrossRef] [Green Version]
- Matthews, G. Towards a transactional ergonomics for driver stress and fatigue. Theor. Issues Ergon. Sci. 2002, 3, 195–211. [Google Scholar] [CrossRef]
- Haak, M.; Bos, S.; Panic, S.; Rothkrantz, L.J.M. Detecting Stress Using Eye Blinks And Brain Activity From EEG Signals. Game-On 2009, 10, 75–82. Available online: https://www.researchgate.net/publication/221024391_Detecting_Stress_using_Eye_Blinks_during_Game_Playing (accessed on 29 December 2021).
- Healey, J.A.; Picard, R.W. Detecting stress during real-world driving tasks using physiological sensors. IEEE Trans. Intell. Transp. Syst. 2005, 6, 156–166. [Google Scholar] [CrossRef] [Green Version]
- Reimer, B.; Mehler, B.; Coughlin, J.F. An Evaluation of Driver Reactions to New Vehicle Parking Assist Technologies Developed to Reduce Driver Stress. N. Engl. Univ. Transp. Cent. 2010. [Google Scholar] [CrossRef]
- Paxion, J.; Galy, E.; Berthelon, C. Mental workload and driving. Front. Psychol. 2014, 5, 1344. [Google Scholar] [CrossRef]
- Stanton, N.A.; Young, M.S. A proposed psychological model of driving automation. Theor. Issues Ergon. Sci. 2000, 1, 315–331. [Google Scholar] [CrossRef] [Green Version]
- Woody, A.; Hooker, E.D.; Zoccola, P.M.; Dickerson, S.S. Social-evaluative threat, cognitive load, and the cortisol and cardiovascular stress response. Psychoneuroendocrinology 2018, 97, 149–155. [Google Scholar] [CrossRef]
- Yerkes, R.M.; Dodson, J.D. The relation of strength of stimulus to rapidity of habit-formation. J. Comp. Neurol. Psychol. 1908, 18, 459–482. [Google Scholar] [CrossRef] [Green Version]
- Eysenck, M.W.; Derakshan, N.; Santos, R.; Calvo, M.G. Anxiety and cognitive performance: Attentional control theory. Emotion 2007, 7, 336–353. [Google Scholar] [CrossRef] [Green Version]
- Hancock, P.; Szalma, J. Stress and Neuroergonomics. In Neuroergonomics: The Brain at Work; Oxford University Press: Oxford, UK, 2007; pp. 195–206. [Google Scholar] [CrossRef]
- Di Flumeri, G.; Borghini, G.; Aricò, P.; Sciaraffa, N.; Lanzi, P.; Pozzi, S.; Vignali, V.; Lantieri, C.; Bichicchi, A.; Simone, A.; et al. EEG-Based Mental Workload Neurometric to Evaluate the Impact of Different Traffic and Road Conditions in Real Driving Settings. Front. Hum. Neurosci. 2018, 12, 509. [Google Scholar] [CrossRef] [PubMed] [Green Version]
- Lee, E.H. Review of the psychometric evidence of the perceived stress scale. Asian Nurs. Res. 2012, 6, 121–127. [Google Scholar] [CrossRef] [PubMed] [Green Version]
- Marucci, M.; Di Flumeri, G.; Borghini, G.; Sciaraffa, N.; Scandola, M.; Pavone, E.F.; Babiloni, F.; Betti, V.; Aricò, P. The impact of multisensory integration and perceptual load in virtual reality settings on performance, workload and presence. Sci. Rep. 2021, 11, 4831. [Google Scholar] [CrossRef] [PubMed]
- Everly, G.S.; Lating, J.M. The anatomy and physiology of the human stress response. In A Clinical Guide to the Treatment of the Human Stress Response; Springer: New York, NY, USA, 2019; pp. 19–56. [Google Scholar] [CrossRef]
- Sequeira, H.; Hot, P.; Silvert, L.; Delplanque, S. Electrical autonomic correlates of emotion. Int. J. Psychophysiol. 2009, 71, 50–56. [Google Scholar] [CrossRef] [PubMed]
- Boucsein, W. Electrodermal Activity; Springer: Boston, MA, USA, 2012; ISBN 978-1-4614-1125-3. [Google Scholar]
- Dawson, M.E.; Schell, A.M.; Filion, D.L. The electrodermal system. In Handbook of Psychophysiology; Cambridge University Press: Cambridge, UK, 2017. [Google Scholar] [CrossRef]
- Reinhardt, T.; Schmahl, C.; Wüst, S.; Bohus, M. Salivary cortisol, heart rate, electrodermal activity and subjective stress responses to the Mannheim Multicomponent Stress Test (MMST). Psychiatry Res. 2012, 198, 106–111. [Google Scholar] [CrossRef]
- Borghini, G.; Di Flumeri, G.; Aricò, P.; Sciaraffa, N.; Bonelli, S.; Ragosta, M.; Tomasello, P.; Drogoul, F.; Turhan, U.; Acikel, B.; et al. A multimodal and signals fusion approach for assessing the impact of stressful events on Air Traffic Controllers. Sci. Rep. 2020, 10, 8600. [Google Scholar] [CrossRef]
- Kirschbaum, C.; Pirke, K.M.; Hellhammer, D.H. The “Trier social stress test”—A tool for investigating psychobiological stress responses in a laboratory setting. Neuropsychobiology 1993, 28, 76–81. [Google Scholar] [CrossRef]
- Mcginley, J.J.; Friedman, B.H. Autonomic responses to lateralized cold pressor and facial cooling tasks. Psychophysiology 2015, 52, 416–424. [Google Scholar] [CrossRef]
- Dedovic, K.; Renwick, R.; Mahani, N.K.; Engert, V.; Lupien, S.J.; Pruessner, J.C. The Montreal Imaging Stress Task: Using functional imaging to investigate the effects of perceiving and processing psychosocial stress in the human brain. J. Psychiatry Neurosci. 2005, 30, 319–325. [Google Scholar]
- MacLeod, C.M. Half a century of reseach on the stroop effect: An integrative review. Psychol. Bull. 1991, 109, 163–203. [Google Scholar] [CrossRef]
- Wetherell, M.A.; Sidgreaves, M.C. Secretory immunoglobulin—A reactivity following increases in workload intensity using the Defined Intensity Stressor Simulation (DISS). Stress Health J. Int. Soc. Investig. Stress 2005, 21, 99–106. [Google Scholar] [CrossRef]
- Giannakakis, G.; Grigoriadis, D.; Giannakaki, K.; Simantiraki, O.; Roniotis, A.; Tsiknakis, M. Review on psychological stress detection using biosignals. IEEE Trans. Affect. Comput. 2019, 3045, 1–22. [Google Scholar] [CrossRef]
- Bernardi, M.L.; Cimitile, M.; Martinelli, F.; Mercaldo, F. Driver and path detection through time-series classification. J. Adv. Transp. 2018, 2018, 1758731. [Google Scholar] [CrossRef]
- Skoluda, N.; Strahler, J.; Schlotz, W.; Niederberger, L.; Marques, S.; Fischer, S.; Thoma, M.V.; Spoerri, C.; Ehlert, U.; Nater, U.M. Intra-individual psychological and physiological responses to acute laboratory stressors of different intensity. Psychoneuroendocrinology 2015, 51, 227–236. [Google Scholar] [CrossRef]
- Alberdi, A.; Aztiria, A.; Basarab, A. Towards an automatic early stress recognition system for office environments based on multimodal measurements: A review. J. Biomed. Inform. 2016, 59, 49–75. [Google Scholar] [CrossRef]
- Al-Shargie, F.; Kiguchi, M.; Badruddin, N.; Dass, S.C.; Hani, A.F.M.; Tang, T.B. Mental stress assessment using simultaneous measurement of EEG and fNIRS. Biomed. Opt. Express 2016, 7, 3882. [Google Scholar] [CrossRef] [Green Version]
- Sulaiman, N.; Taib, M.N.; Lias, S.; Murat, Z.H.; Aris, S.A.M.; Hamid, N.H.A. Novel methods for stress features identification using EEG signals. Int. J. Simul. Syst. Sci. Technol. 2011, 12, 27–33. [Google Scholar] [CrossRef]
- Seo, S.-H.; Lee, J.-T. Stress and EEG. In Convergence and Hybrid Information Technologies; IntechOpen: Rijeka, Croatia, 2010. [Google Scholar] [CrossRef] [Green Version]
- Katmah, R.; Al-Shargie, F.; Tariq, U.; Babiloni, F.; Al-Mughairbi, F.; Al-Nashash, H. A review on mental stress assessment methods using eeg signals. Sensors 2021, 21, 5043. [Google Scholar] [CrossRef]
- Hosseini, M.P.; Hosseini, A.; Ahi, K. A Review on Machine Learning for EEG Signal Processing in Bioengineering. IEEE Rev. Biomed. Eng. 2021, 14, 204–218. [Google Scholar] [CrossRef]
- Borghini, G.; Aricò, P.; Di Flumeri, G.; Sciaraffa, N.; Colosimo, A.; Herrero, M.-T.; Bezerianos, A.; Thakor, N.V.; Babiloni, F. A new perspective for the training assessment: Machine learning-based neurometric for augmented user’s evaluation. Front. Neurosci. 2017, 11, 325. [Google Scholar] [CrossRef]
- Abujelala, M.; Karthikeyan, R.; Tyagi, O.; Du, J.; Mehta, R.K. Brain activity-based metrics for assessing learning states in vr under stress among firefighters: An explorative machine learning approach in neuroergonomics. Brain Sci. 2021, 11, 885. [Google Scholar] [CrossRef] [PubMed]
- Novak, D.; Mihelj, M.; Munih, M. A survey of methods for data fusion and system adaptation using autonomic nervous system responses in physiological computing. Interact. Comput. 2012, 24, 154–172. [Google Scholar] [CrossRef]
- Breiman, L. Random forests. Mach. Learn. 2001, 45, 5–32. [Google Scholar] [CrossRef] [Green Version]
- Aricò, P.; Borghini, G.; Di Flumeri, G.; Sciaraffa, N.; Colosimo, A.; Babiloni, F. Passive BCI in Operational Environments: Insights, Recent Advances, and Future Trends. IEEE Trans. Biomed. Eng. 2017, 64, 1431–1436. [Google Scholar] [CrossRef]
- Wolpaw, J.R.; Birbaumer, N.; Heetderks, W.J.; McFarland, D.J.; Peckham, P.H.; Schalk, G.; Donchin, E.; Quatrano, L.A.; Robinson, C.J.; Vaughan, T.M. Brain-computer interface technology: A review of the first international meeting. IEEE Trans. Rehabil. Eng. 2000, 8, 164–173. [Google Scholar] [CrossRef] [PubMed]
- Kappenman, E.S.; Luck, S.J. The effects of electrode impedance on data quality and statistical significance in ERP recordings. Psychophysiology 2010, 47, 888–904. [Google Scholar] [CrossRef] [PubMed] [Green Version]
- Comstock, J.R. MATB—Multi-Attribute Task Battery for Human Operator Workload and Strategic Behavior Research; NASA Langley Research Center: Hampton, VA, USA, 1994.
- Hart, S.G.; Staveland, L.E. Development of NASA-TLX (Task Load Index): Results of empirical and theoretical research. In Advances in Psychology; Elsevier: Amsterdam, The Netherlands, 1988; Volume 52, pp. 139–183. [Google Scholar] [CrossRef]
- Trujillo, A.C. Evaluation of Electronic Formats of the NASA Task Load Index; NASA Langley Research Center: Hampton, VA, USA, 2011. Available online: https://ntrs.nasa.gov/archive/nasa/casi.ntrs.nasa.gov/20110014454.pdf (accessed on 29 December 2021).
- Jacobs, S.C.; Friedman, R.; Parker, J.D.; Tofler, G.H.; Jimenez, A.H.; Muller, J.E.; Benson, H.; Stone, P.H. Use of skin conductance changes during mental stress testing as an index of autonomic arousal in cardiovascular research. Am. Heart J. 1994, 128, 1170–1177. [Google Scholar] [CrossRef]
- Riva, G.; Wiederhold, B.K.; Molinari, E. Virtual Environments in Clinical Psychology and Neuroscience: Methods and Techniques in Advanced Patient-Therapist Interaction; IOS Press: Amsterdam, The Netherlands, 1998. [Google Scholar]
- Wiederhold, B.K.; Davis, R.; Wiederhold, M.D. The effects of immersiveness on physiology. Stud. Health Technol. Inform. 1998, 58, 52–62. [Google Scholar]
- Wiederhold, B.K.; Jang, D.P.; Kaneda, M.; Cabral, I.; Lurie, Y.; May, T.; Kim, I.Y.; Wiederhold, M.D.; Kim, S.I. An investigation into physiological responses in virtual environments: An objective measurement of presence. Towards CyberPsychol. Mind Cogn. Soc. Internet Age 2001, 2, 175–183. [Google Scholar]
- De Boor, C.; De Boor, C. A Practical Guide to Splines; Springer: New York, NY, USA, 1978; Volume 27. [Google Scholar]
- Benedek, M.; Kaernbach, C. Decomposition of skin conductance data by means of nonnegative deconvolution. Psychophysiology 2010, 47, 647–658. [Google Scholar] [CrossRef] [Green Version]
- Di Flumeri, G.; Aricò, P.; Borghini, G.; Colosimo, A.; Babiloni, F. A New Regression-Based Method for the Eye Blinks Artifacts Correction in the EEG Signal, without Using any EOG Channel. In Proceedings of the 2016 38th Annual International Conference of the IEEE Engineering in Medicine and Biology Society (EMBC), Orlando, FL, USA, 16–20 August 2016; pp. 3187–3190. [Google Scholar] [CrossRef]
- Somers, B.; Francart, T.; Bertrand, A. A generic EEG artifact removal algorithm based on the multi-channel Wiener filter. J. Neural Eng. 2018, 15, 36007. [Google Scholar] [CrossRef] [PubMed]
- Klimesch, W. EEG alpha and theta oscillations reflect cognitive and memory performance: A review and analysis. Brain Res. Brain Res. Rev. 1999, 29, 169–195. [Google Scholar] [CrossRef]
- He, H.; Bai, Y.; Garcia, E.A.; Li, S. ADASYN: Adaptive synthetic sampling approach for imbalanced learning. In Proceedings of the 2008 IEEE International Joint Conference on Neural Networks (IEEE World Congress on Computational Intelligence), Hong Kong, China, 1–8 June 2008; pp. 1322–1328. [Google Scholar] [CrossRef] [Green Version]
- Bamber, D. The area above the ordinal dominance graph and the area below the receiver operating characteristic graph. J. Math. Psychol. 1975, 12, 387–415. [Google Scholar] [CrossRef]
- Umar Saeed, S.M.; Anwar, S.M.; Majid, M.; Awais, M.; Alnowami, M. Selection of neural oscillatory features for human stress classification with single channel EEG headset. Biomed. Res. Int. 2018, 2018, 1049257. [Google Scholar] [CrossRef] [PubMed] [Green Version]
- Halim, Z.; Rehan, M. On identification of driving-induced stress using electroencephalogram signals: A framework based on wearable safety-critical scheme and machine learning. Inf. Fusion 2020, 53, 66–79. [Google Scholar] [CrossRef]
- Choi, Y.; Kim, M.; Chun, C. Measurement of occupants’ stress based on electroencephalograms (EEG) in twelve combined environments. Build. Environ. 2015, 88, 65–72. [Google Scholar] [CrossRef]
- Puterman, E.; O’Donovan, A.; Adler, N.E.; Tomiyama, A.J.; Kemeny, M.; Wolkowitz, O.M.; Epel, E. Physical activity moderates stressor-induced rumination on cortisol reactivity. Psychosom. Med. 2011, 73, 604. [Google Scholar] [CrossRef] [PubMed] [Green Version]
- Tran, Y.; Thuraisingham, R.A.; Wijesuriya, N.; Nguyen, H.T.; Craig, A. Detecting neural changes during stress and fatigue effectively: A comparison of spectral analysis and sample entropy. In Proceedings of the 2007 3rd International IEEE/EMBS Conference on Neural Engineering, Kohala Coast, HI, USA, 2–5 May 2007; pp. 350–353. [Google Scholar]
- Zhu, Y.; Wang, Q.; Zhang, L. Study of EEG characteristics while solving scientific problems with different mental effort. Sci. Rep. 2021, 11, 23783. [Google Scholar] [CrossRef] [PubMed]
- Cacioppo, J.T.; Tassinary, L.G.; Berntson, G.G. Psychophysiological science: Interdisciplinary approaches to classic questions about the mind. In Handbook of Psychophysiology; Cambridge University Press: Cambridge, UK, 2007; Volume 3, pp. 1–16. [Google Scholar]
- Smitha, K.G.; Xin, N.Y.; Lian, S.S.; Robinson, N. Classifying subjective emotional stress response evoked by multitasking using EEG. In Proceedings of the 2017 IEEE International Conference on Systems, Man, and Cybernetics (SMC), Banff, AB, Canada, 5–8 October 2017; pp. 3036–3041. [Google Scholar] [CrossRef]
- Lohani, M.; Payne, B.R.; Strayer, D.L. A review of psychophysiological measures to assess cognitive states in real-world driving. Front. Hum. Neurosci. 2019, 13, 57. [Google Scholar] [CrossRef]
- Saeed, S.M.U.; Anwar, S.M.; Majid, M.; Bhatti, A.M. Psychological stress measurement using low cost single channel EEG headset. In Proceedings of the 2015 IEEE International Symposium on Signal Processing and Information Technology (ISSPIT), Abu Dhabi, United Arab Emirates, 7–10 December 2015; pp. 581–585. [Google Scholar] [CrossRef]
- Attallah, O. An effective mental stress state detection and evaluation system using minimum number of frontal brain electrodes. Diagnostics 2020, 10, 292. [Google Scholar] [CrossRef]
- Can, Y.S.; Chalabianloo, N.; Ekiz, D.; Ersoy, C. Continuous stress detection using wearable sensors in real life: Algorithmic programming contest case study. Sensors 2019, 19, 1849. [Google Scholar] [CrossRef] [PubMed] [Green Version]
- Memar, M.; Mokaribolhassan, A.; Aminzadeh Ghavifekr, A. Review on Machine Learning Frameworks in Drivers’ Physiological Signal Analysis to Detect Stress. In Proceedings of the 2021 7th International Conference on Control, Instrumentation and Automation (ICCIA), Tabriz, Iran, 23–24 February 2021. [Google Scholar] [CrossRef]
- Sciaraffa, N.; Arico, P.; Borghini, G.; Di Flumeri, G.; Di Florio, A.; Babiloni, F. The evolution of passive brain–computer interfaces: Enhancing the human–machine interaction. In Neurotechnology: Methods, Advances and Applications; The Institution of Engineering and Technology: London, UK, 2020; p. 155. [Google Scholar] [CrossRef]
- Aricò, P.; Reynal, M.; Di Flumeri, G.; Borghini, G.; Sciaraffa, N.; Imbert, J.-P.; Hurter, C.; Terenzi, M.; Ferreira, A.; Pozzi, S. How neurophysiological measures can be used to enhance the evaluation of remote tower solutions. Front. Hum. Neurosci. 2019, 13, 303. [Google Scholar] [CrossRef] [PubMed]
- Borghini, G.; Astolfi, L.; Vecchiato, G.; Mattia, D.; Babiloni, F. Measuring neurophysiological signals in aircraft pilots and car drivers for the assessment of mental workload, fatigue and drowsiness. Neurosci. Biobehav. Rev. 2014, 44, 58–75. [Google Scholar] [CrossRef] [PubMed]
- Borghini, G.; Bandini, A.; Orlandi, S.; Di Flumeri, G.; Aricò, P.; Sciaraffa, N.; Ronca, V.; Bonelli, S.; Ragosta, M.; Tomasello, P. Stress assessment by combining neurophysiological signals and radio communications of air traffic controllers. In Proceedings of the 2020 42nd Annual International Conference of the IEEE Engineering in Medicine & Biology Society (EMBC), Montreal, QC, Canada, 20–24 July 2020; pp. 851–854. [Google Scholar]
- Fowles, D.C.; Christie, M.J.; Edelberg, R.; Grings, W.W.; Lykken, D.T.; Venables, P.H. Publication recommendations for electrodermal measurements. Psychophysiology 1981, 18, 232–239. [Google Scholar] [CrossRef]
- Pignoni, G.; Komandur, S.; Volden, F. Accounting for effects of variation in luminance in pupillometry for field measurements of cognitive workload. IEEE Sens. J. 2020, 21, 6393–6400. [Google Scholar] [CrossRef]
- Arico, P.; Borghini, G.; Di Flumeri, G.; Bonelli, S.; Golfetti, A.; Graziani, I.; Pozzi, S.; Imbert, J.-P.; Granger, G.; Benhacene, R.; et al. Human Factors and Neurophysiological Metrics in Air Traffic Control: A Critical Review. IEEE Rev. Biomed. Eng. 2017, 10, 250–263. [Google Scholar] [CrossRef]
- Sciaraffa, N.; Borghini, G.; Aricò, P.; Di Flumeri, G.; Colosimo, A.; Bezerianos, A.; Thakor, V.N.; Babiloni, F. Brain Interaction during Cooperation: Evaluating Local Properties of Multiple-Brain Network. Brain Sci. 2017, 7, 90. [Google Scholar] [CrossRef]


| Decimation (s) | SCL | Neurometric | RF-Intra |
|---|---|---|---|
| 1 | 0.42 | 0.22 | 0.25 |
| 10 | 0.42 | 0.26 | 0.33 |
| 20 | 0.42 | 0.28 | 0.31 |
| 30 | 0.42 | 0.28 | 0.29 |
| 40 | 0.40 | 0.27 | 0.29 |
| 50 | 0.35 | 0.21 | 0.32 |
| 60 | 0.32 | 0.12 | 0.30 |
| RF-Intra vs. Neurometric | RF-Intra vs. SCL | Neurometric vs. SCL | |||||
|---|---|---|---|---|---|---|---|
| Decimation (s) | Median | IQR | Median | IQR | Median | IQR | |
| 10 | R | 0.85 | 0.36 | 0.61 | 0.81 | 0.31 | 0.68 |
| RMSE | 0.15 | 0.10 | 0.27 | 0.09 | 0.35 | 0.08 | |
| 30 | R | 0.88 | 0.37 | 0.71 | 0.80 | 0.41 | 0.96 |
| RMSE | 0.20 | 0.10 | 0.27 | 0.09 | 0.37 | 0.15 | |
| 60 | R | 0.91 | 0.32 | 0.85 | 0.69 | 0.51 | 0.97 |
| RMSE | 0.20 | 0.11 | 0.30 | 0.06 | 0.34 | 0.19 | |
| Decimation (s) | SCL | Neurometric | RF-Intra | RF-Cross |
|---|---|---|---|---|
| 1 | 0.10 | 0.11 | 0.11 | 0.33 |
| 10 | 0.10 | 0.04 | 0.06 | 0.33 |
| 20 | 0.09 | 0.03 | 0.04 | 0.29 |
| 30 | 0.08 | 0.02 | 0.03 | 0.25 |
| 40 | 0.07 | 0.02 | 0.02 | 0.21 |
| 50 | 0.06 | 0.02 | 0.02 | 0.19 |
| 60 | 0.05 | 0.02 | 0.02 | 0.16 |
| RF-Cross vs. Neurometric | RF-Cross vs. RF-Intra | RF-Cross vs. SCL | RF-Intra vs. Neurometric | RF-Intra vs. SCL | Neurometric vs. SCL | ||||||||
|---|---|---|---|---|---|---|---|---|---|---|---|---|---|
| Decimation (s) | Med | IQR | Med | IQR | Med | IQR | Med | IQR | Med | IQR | Med | IQR | |
| 10 | R | 0.87 | 0.20 | 0.81 | 0.32 | 0.43 | 0.42 | 0.93 | 0.04 | 0.61 | 0.30 | 0.49 | 0.33 |
| RMSE | 0.22 | 0.11 | 0.27 | 0.11 | 0.30 | 0.07 | 0.19 | 0.06 | 0.28 | 0.14 | 0.29 | 0.08 | |
| 30 | R | 0.91 | 0.19 | 0.81 | 0.29 | 0.48 | 0.46 | 0.96 | 0.05 | 0.68 | 0.35 | 0.51 | 0.42 |
| RMSE | 0.24 | 0.14 | 0.25 | 0.13 | 0.28 | 0.08 | 0.11 | 0.07 | 0.25 | 0.10 | 0.27 | 0.09 | |
| 60 | R | 0.92 | 0.15 | 0.83 | 0.37 | 0.62 | 0.30 | 0.96 | 0.05 | 0.72 | 0.23 | 0.61 | 0.54 |
| RMSE | 0.28 | 0.12 | 0.22 | 0.12 | 0.26 | 0.13 | 0.12 | 0.11 | 0.23 | 0.06 | 0.29 | 0.09 | |
Publisher’s Note: MDPI stays neutral with regard to jurisdictional claims in published maps and institutional affiliations. |
© 2022 by the authors. Licensee MDPI, Basel, Switzerland. This article is an open access article distributed under the terms and conditions of the Creative Commons Attribution (CC BY) license (https://creativecommons.org/licenses/by/4.0/).
Share and Cite
Sciaraffa, N.; Di Flumeri, G.; Germano, D.; Giorgi, A.; Di Florio, A.; Borghini, G.; Vozzi, A.; Ronca, V.; Varga, R.; van Gasteren, M.; et al. Validation of a Light EEG-Based Measure for Real-Time Stress Monitoring during Realistic Driving. Brain Sci. 2022, 12, 304. https://doi.org/10.3390/brainsci12030304
Sciaraffa N, Di Flumeri G, Germano D, Giorgi A, Di Florio A, Borghini G, Vozzi A, Ronca V, Varga R, van Gasteren M, et al. Validation of a Light EEG-Based Measure for Real-Time Stress Monitoring during Realistic Driving. Brain Sciences. 2022; 12(3):304. https://doi.org/10.3390/brainsci12030304
Chicago/Turabian StyleSciaraffa, Nicolina, Gianluca Di Flumeri, Daniele Germano, Andrea Giorgi, Antonio Di Florio, Gianluca Borghini, Alessia Vozzi, Vincenzo Ronca, Rodrigo Varga, Marteyn van Gasteren, and et al. 2022. "Validation of a Light EEG-Based Measure for Real-Time Stress Monitoring during Realistic Driving" Brain Sciences 12, no. 3: 304. https://doi.org/10.3390/brainsci12030304