
FER-PCVT: Facial Expression Recognition with Patch-Convolutional Vision Transformer for Stroke Patients
 ,
,
Abstract
:1. Introduction
- We propose a lightweight FER algorithm named Facial Expression Recognition with Patch-Convolutional Vision Transformer. It requires less memory and computation for model training/inference while ensuring high accuracy.
- The proposed algorithm effectively combines the local perception ability of CNN and the advantages of ViT in extracting global features, which makes the algorithm achieve the highest accuracy on the RAF-DB dataset.
- We treat emotion features as the weighted sum of neutral and V-A-like emotion features at different scales and design a unique classifier, which has been verified that more detailed facial emotion information of stroke patients has been extracted for classification.
2. Materials and Methods
2.1. Data Sources and Data Preprocessing
- RAF-DB dataset
- FER+ dataset
- Private dataset
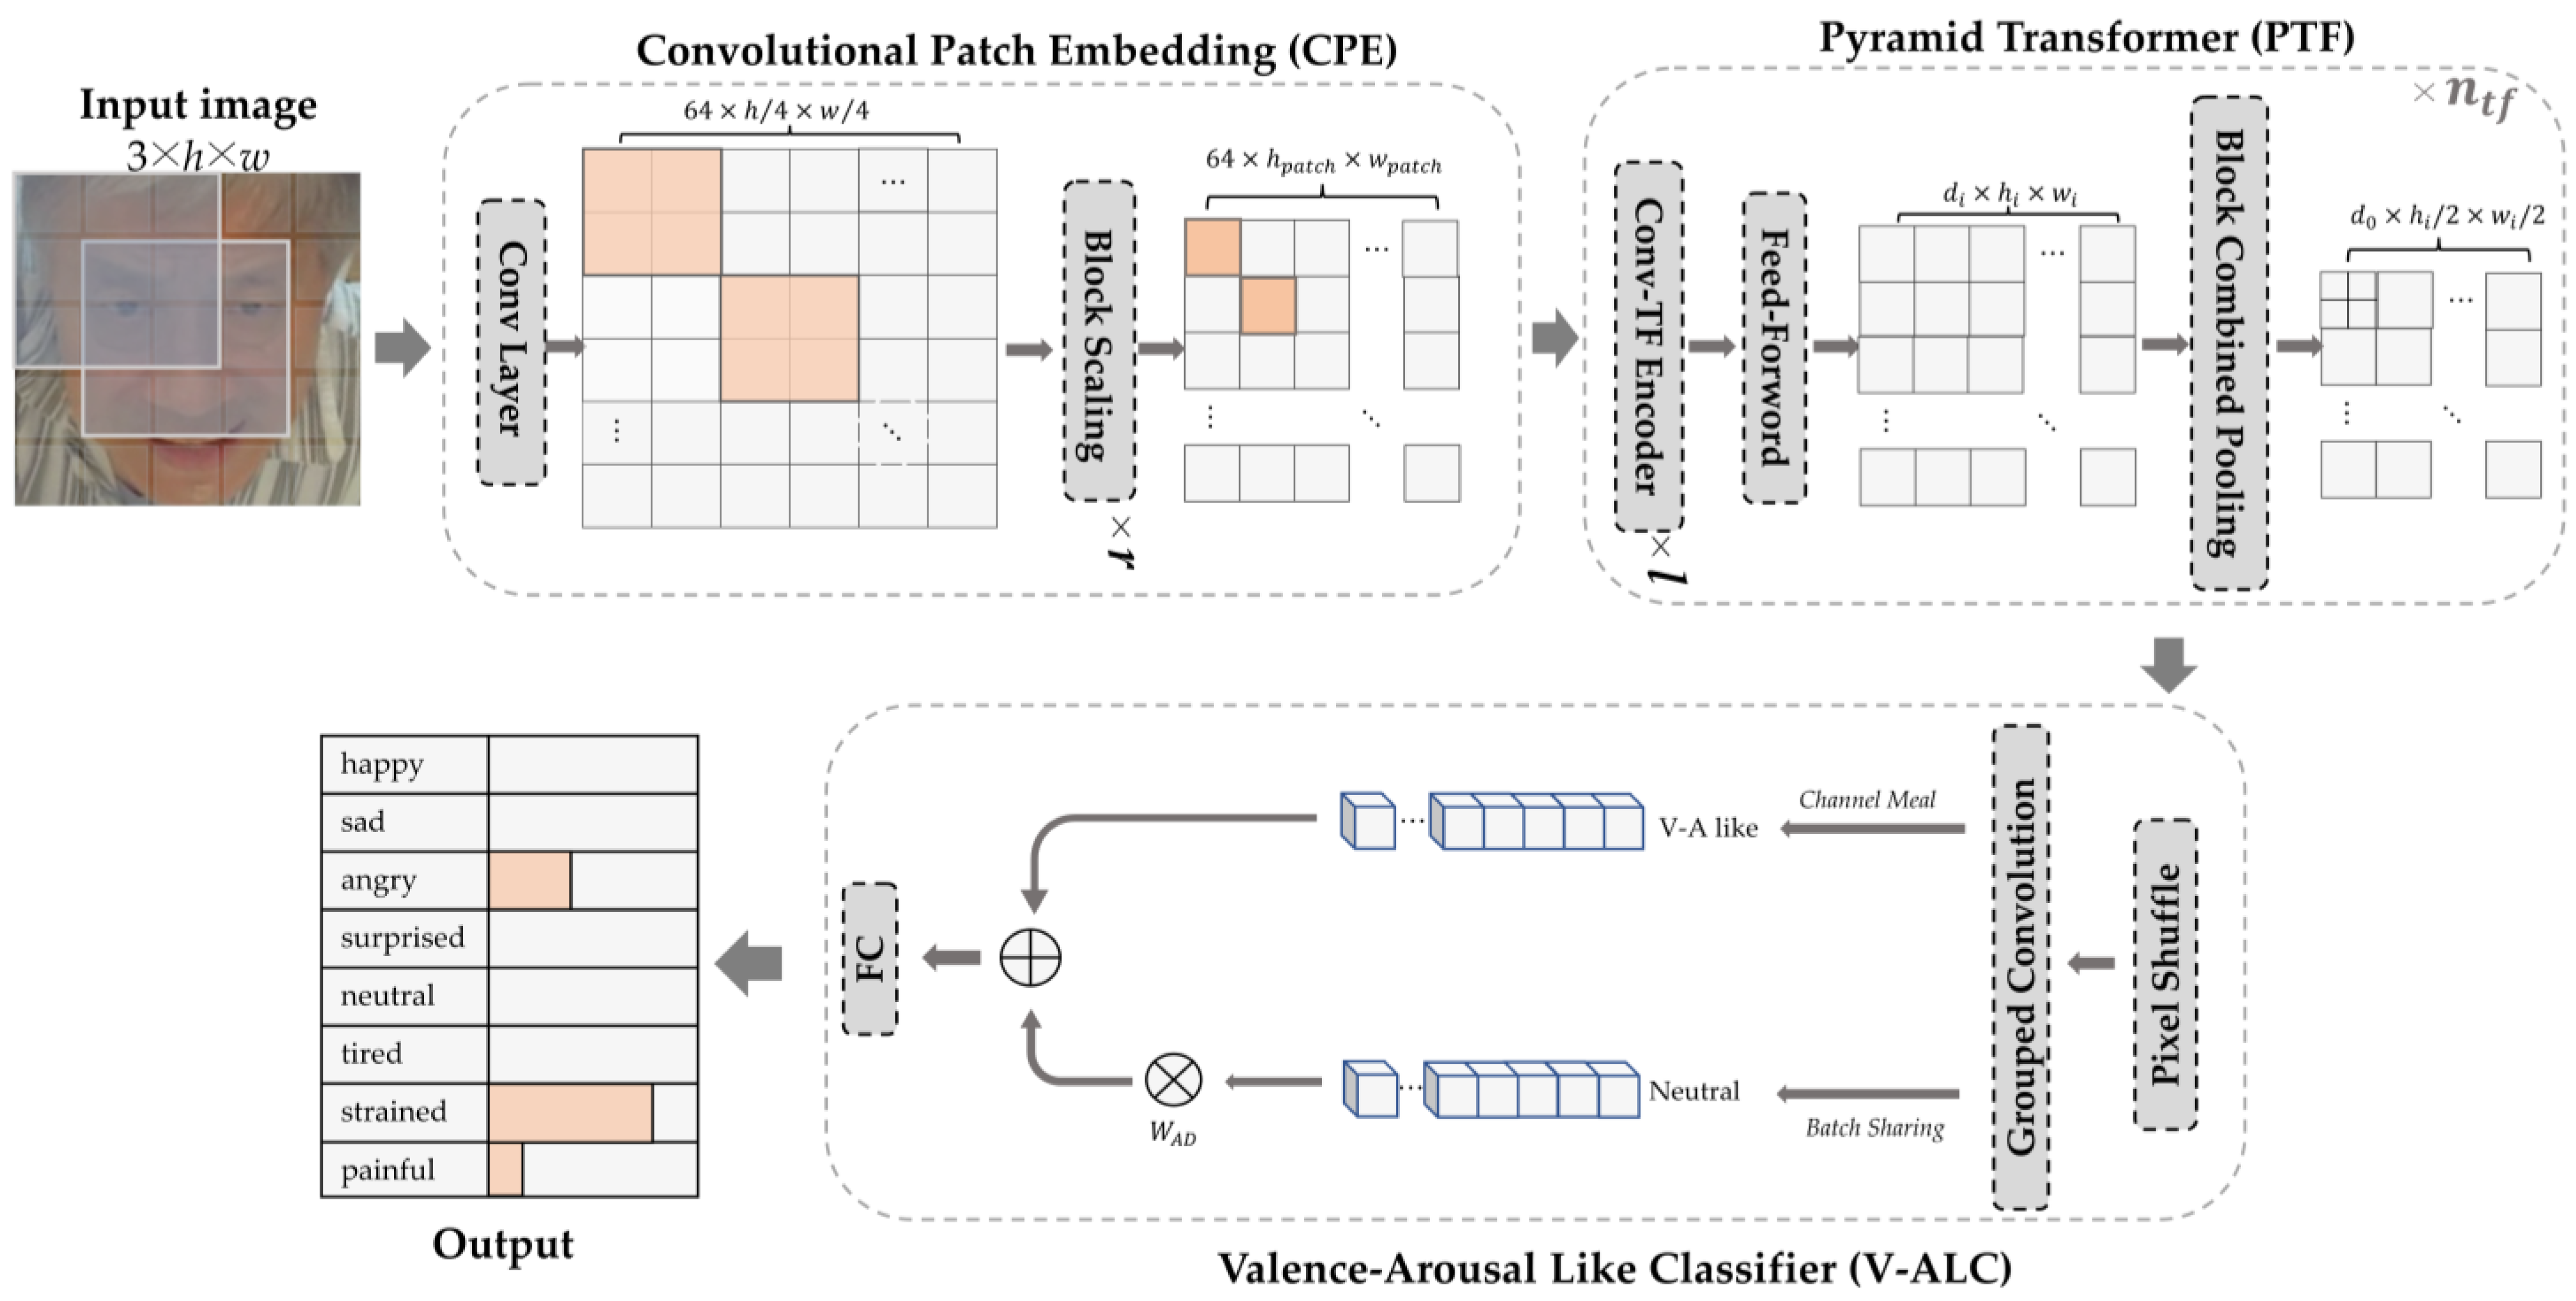
2.2. Model Building
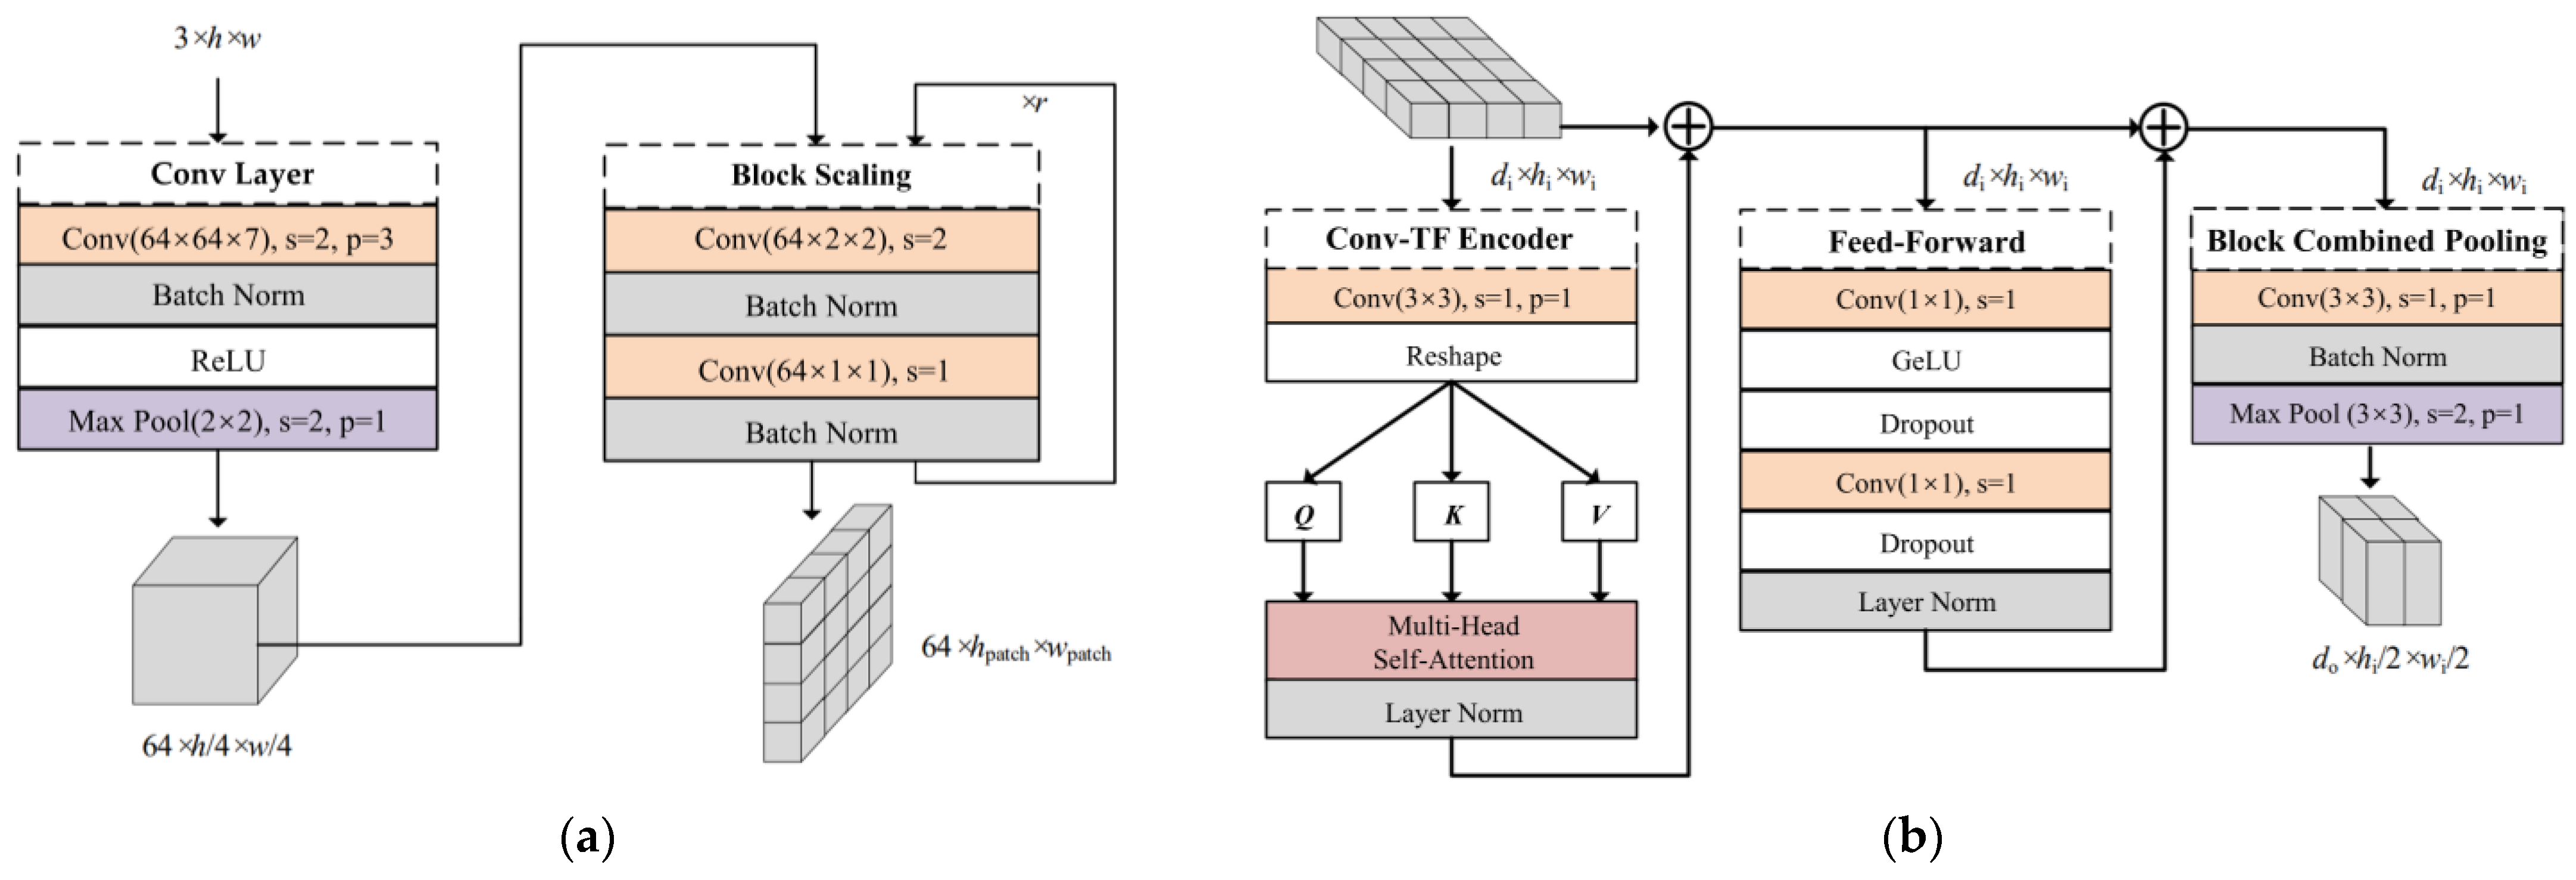
2.2.1. Convolutional Patch Embedding
2.2.2. Pyramid Transformer
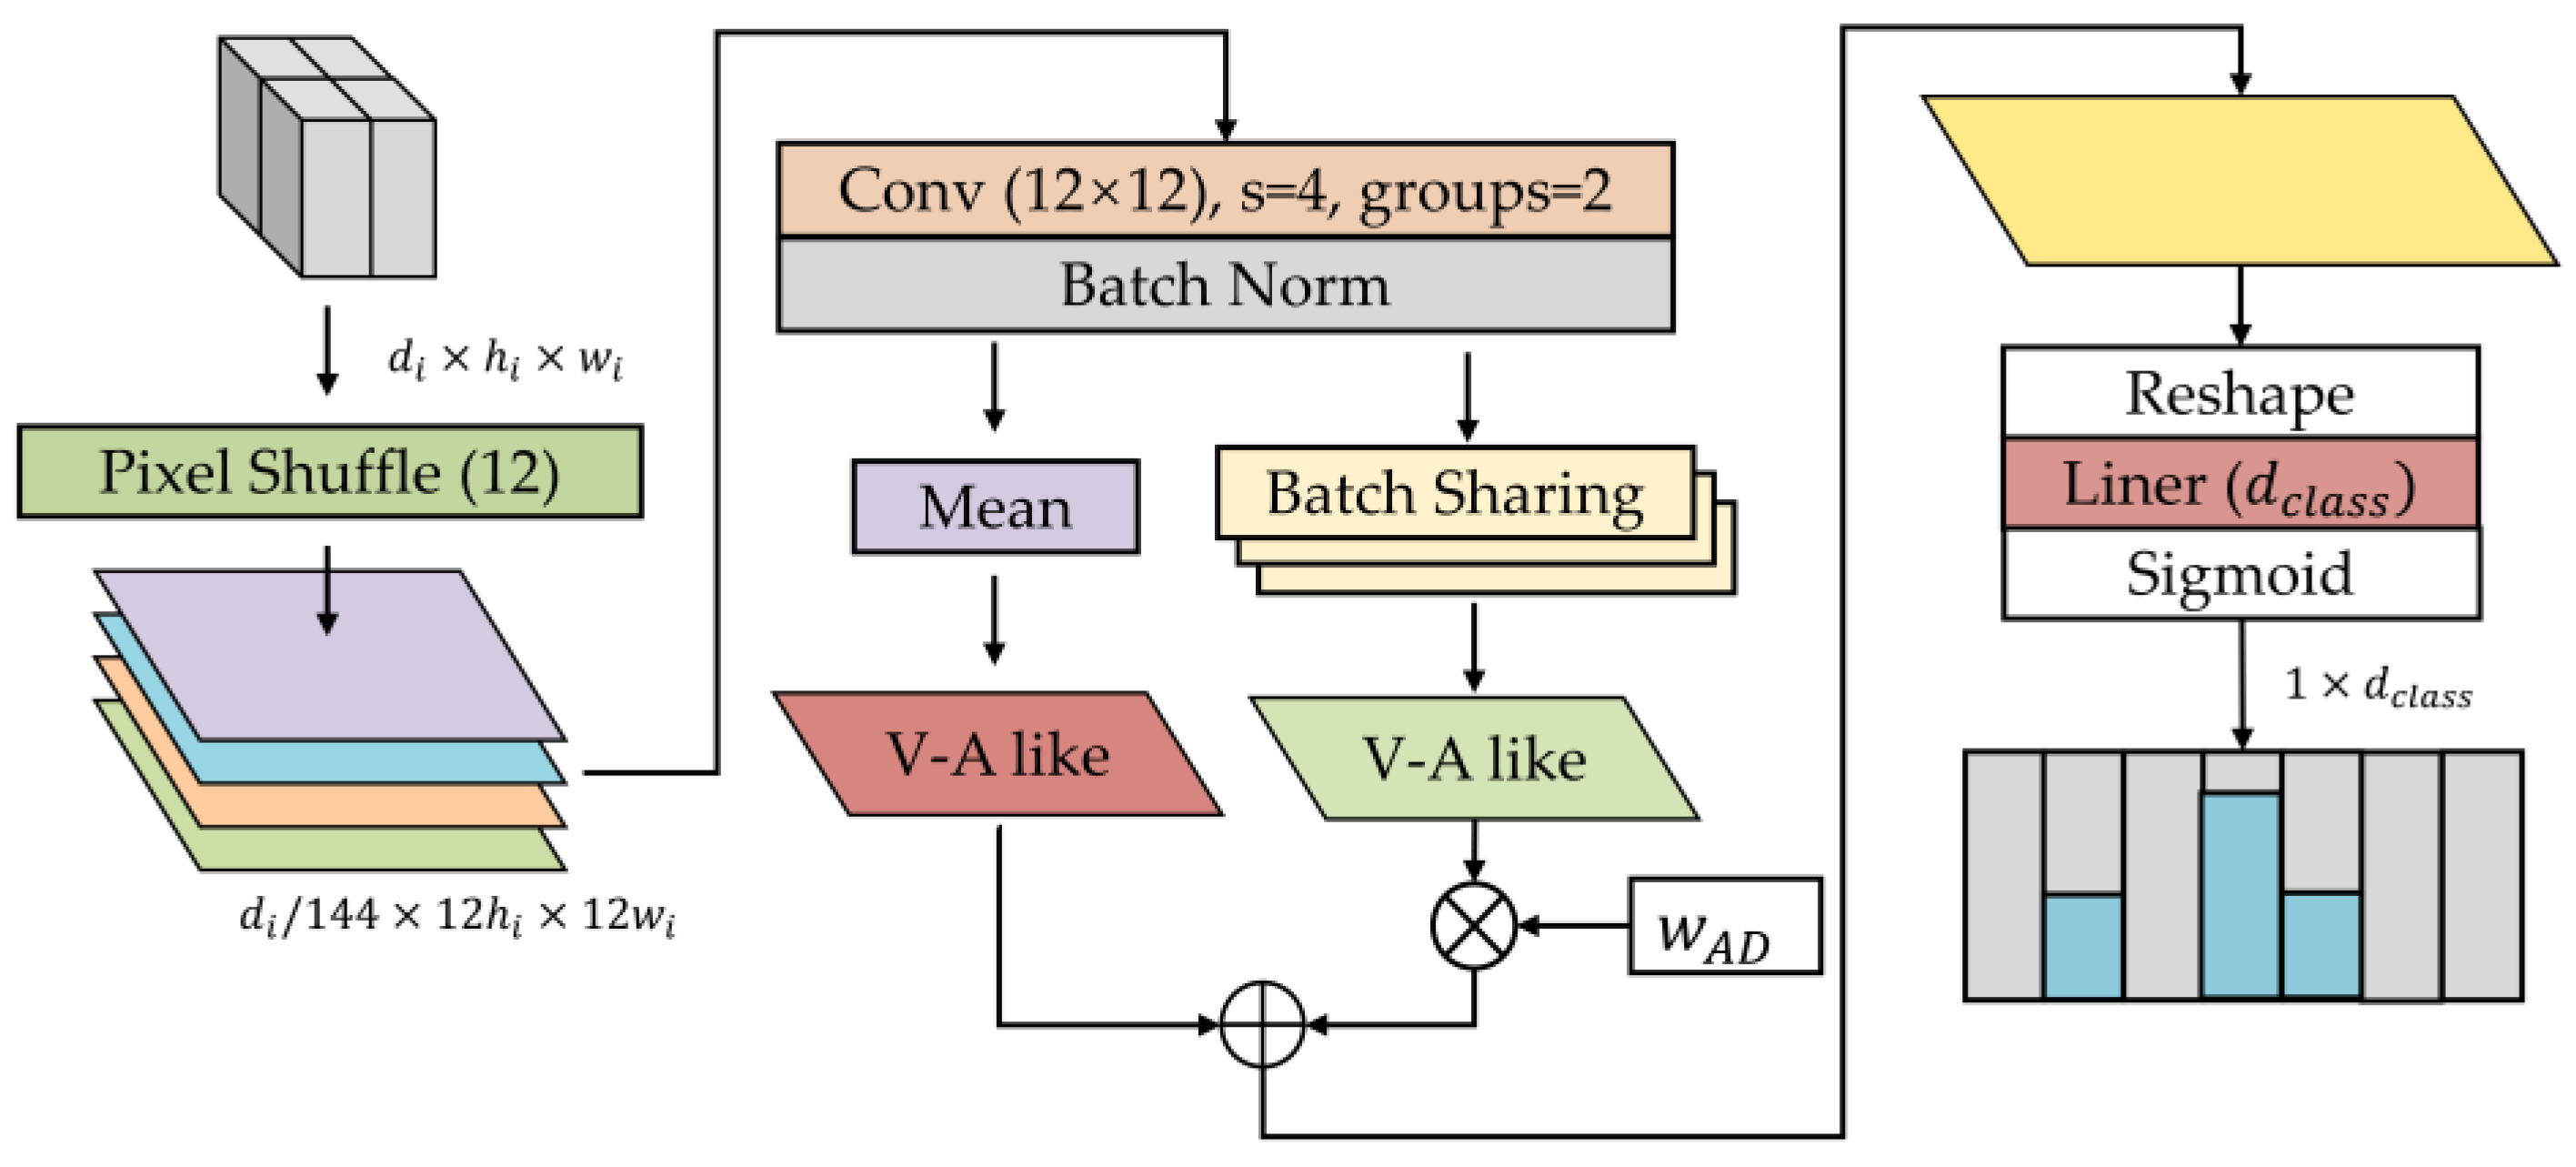
2.2.3. Valence-Arousal-Like Classifier
3. Results
3.1. Setup
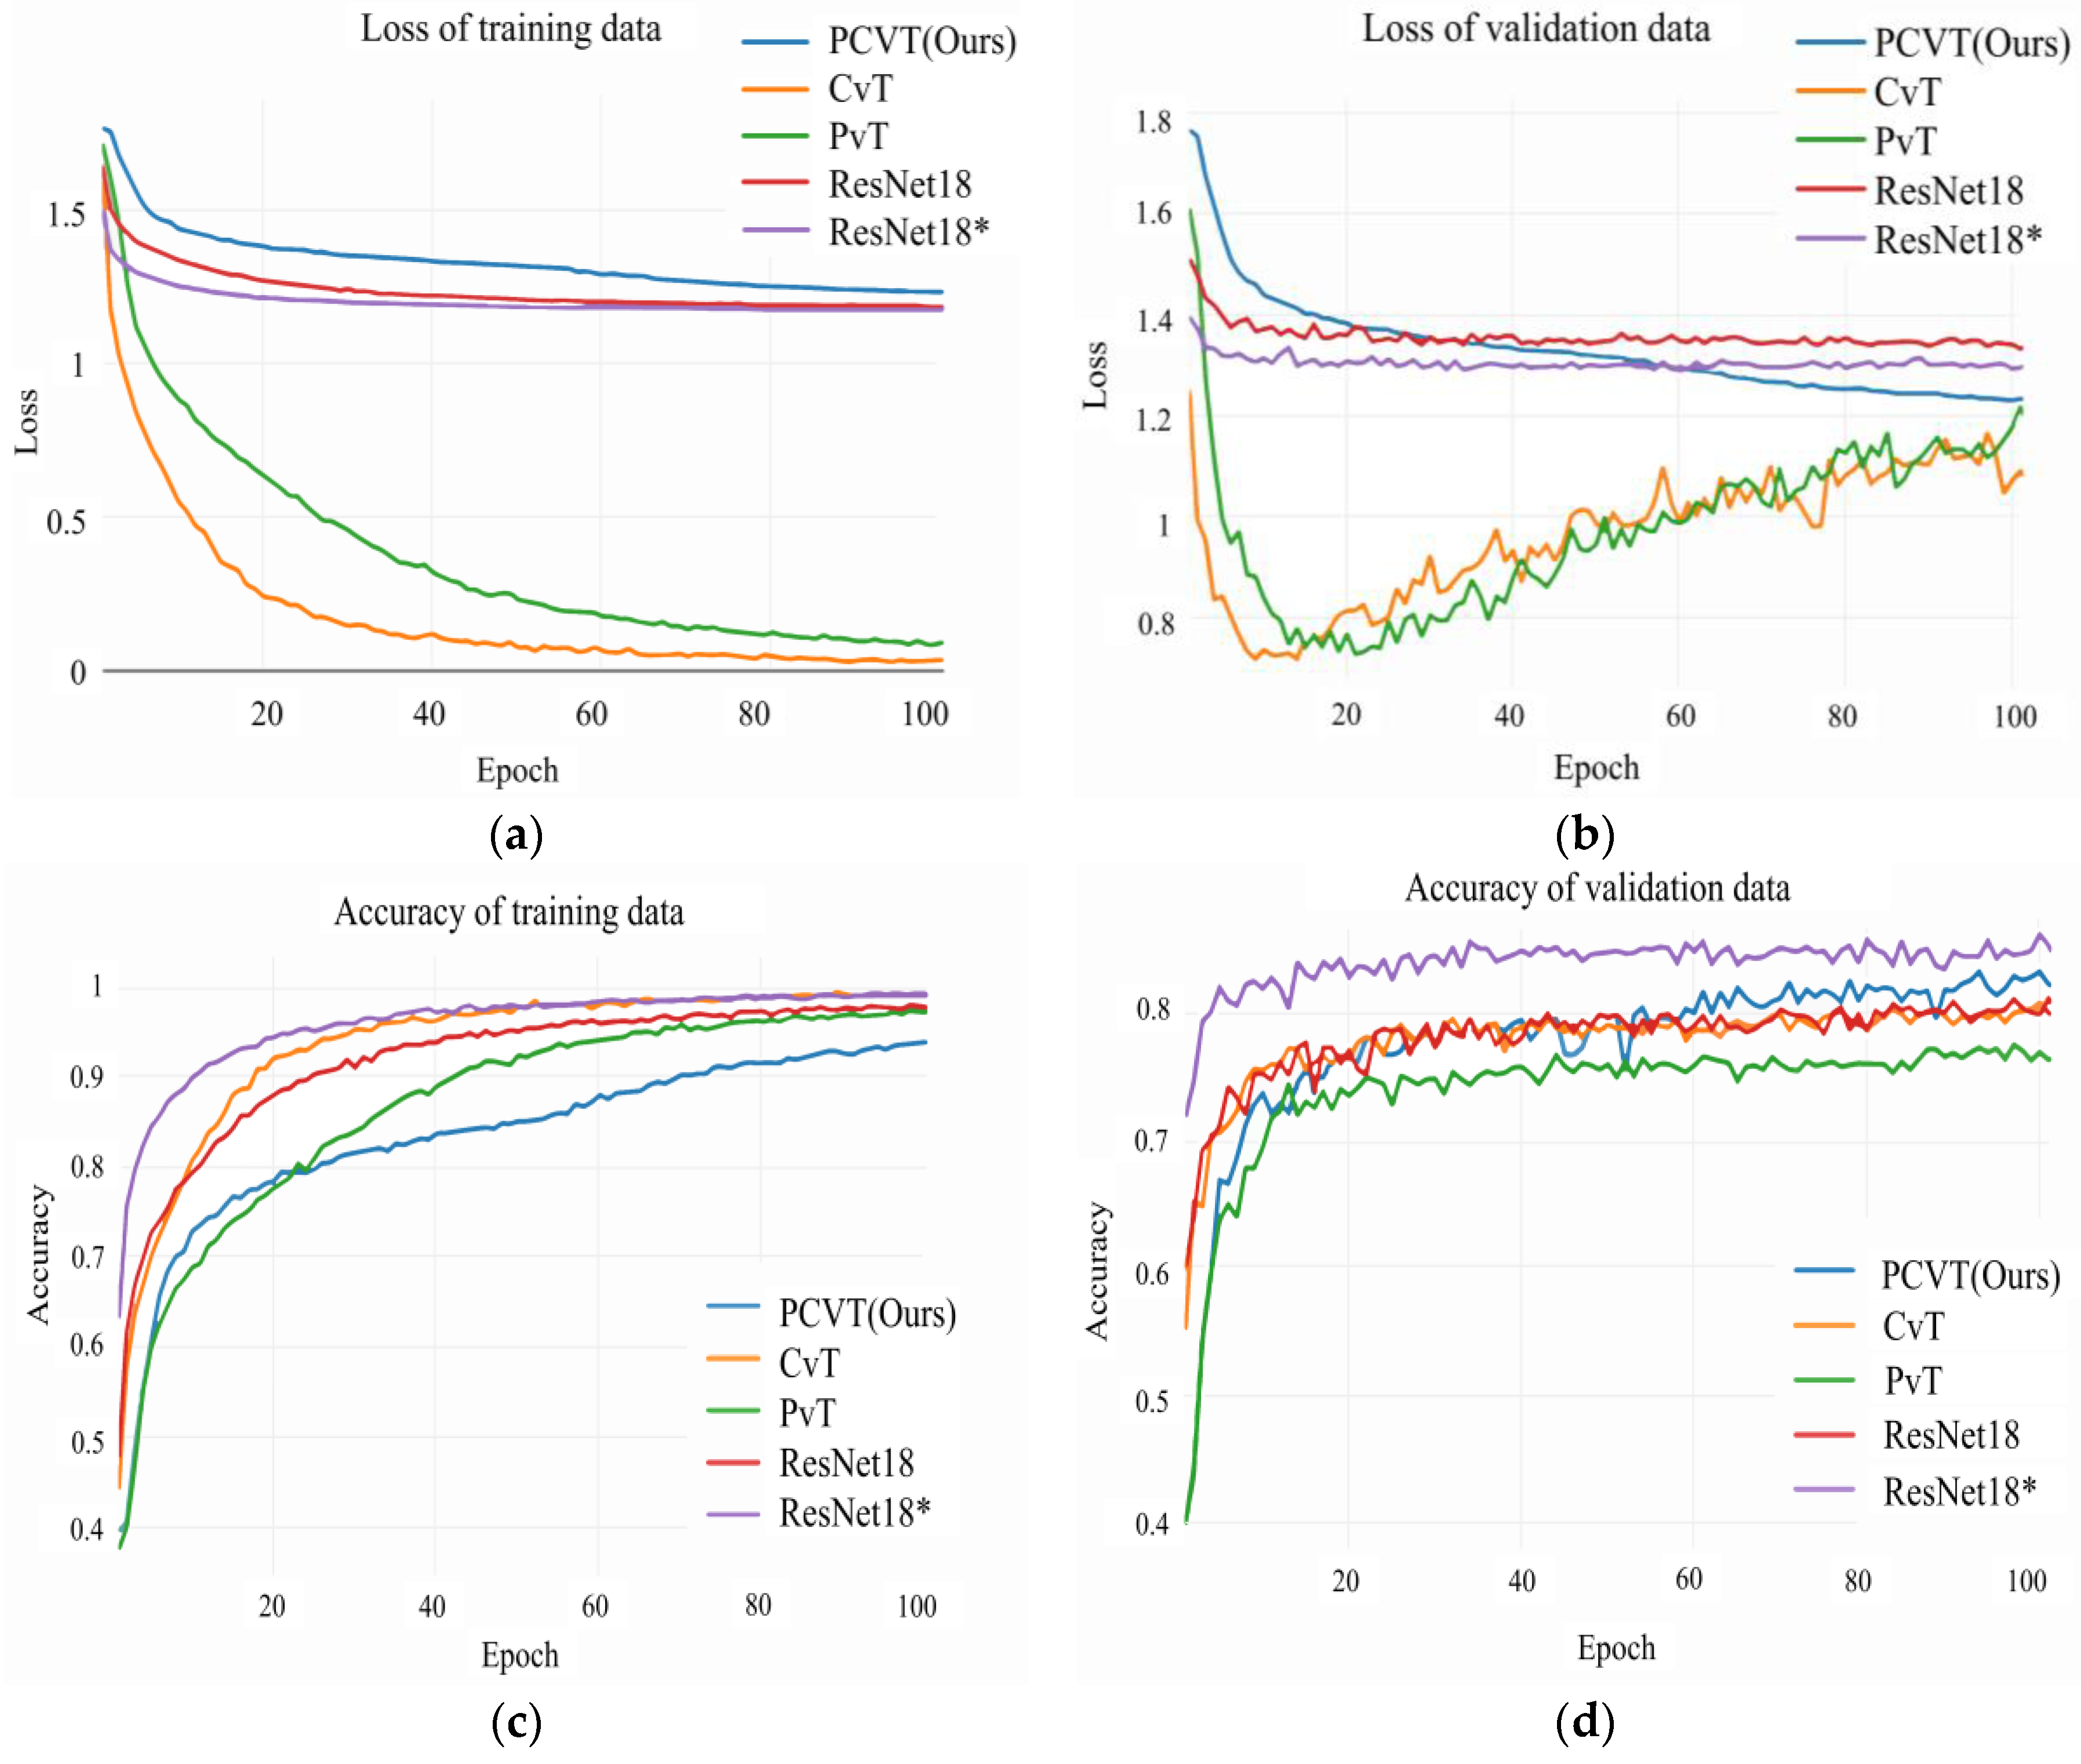
3.2. Performance Evaluation of PCVT Based on Public Datasets
3.3. Performance Evaluation of FER-PCVT Based on Public Datasets
3.3.1. Comparison with State-of-the-Art Methods
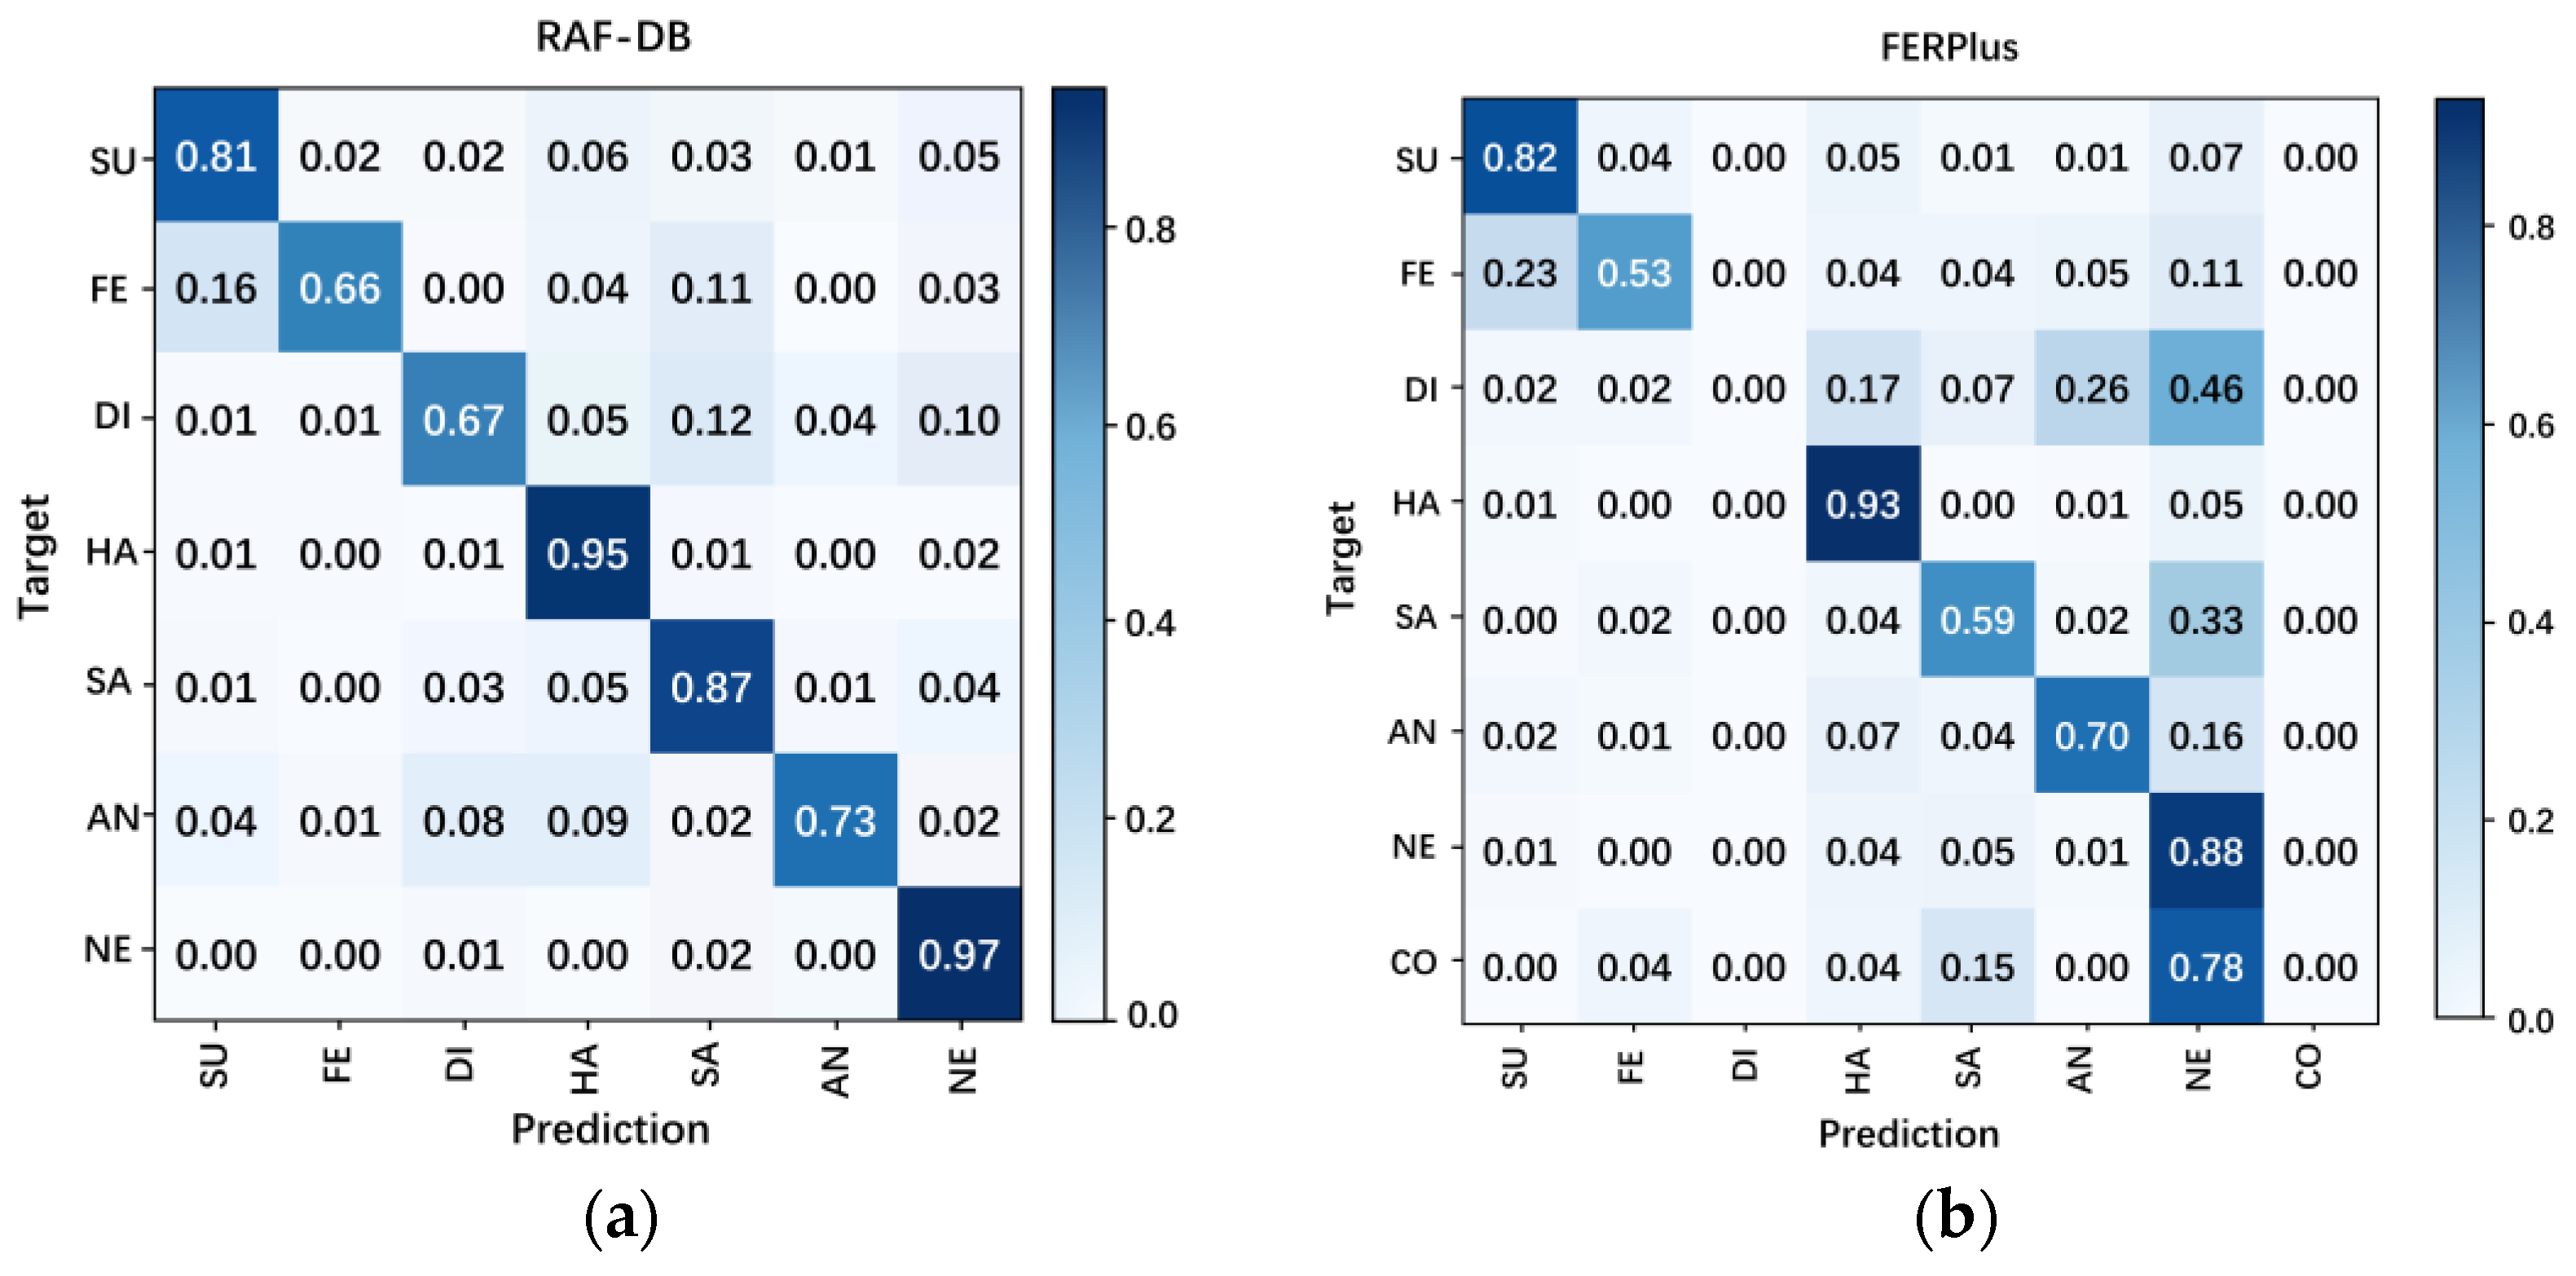
3.3.2. Analysis Based on Confusion Matrix
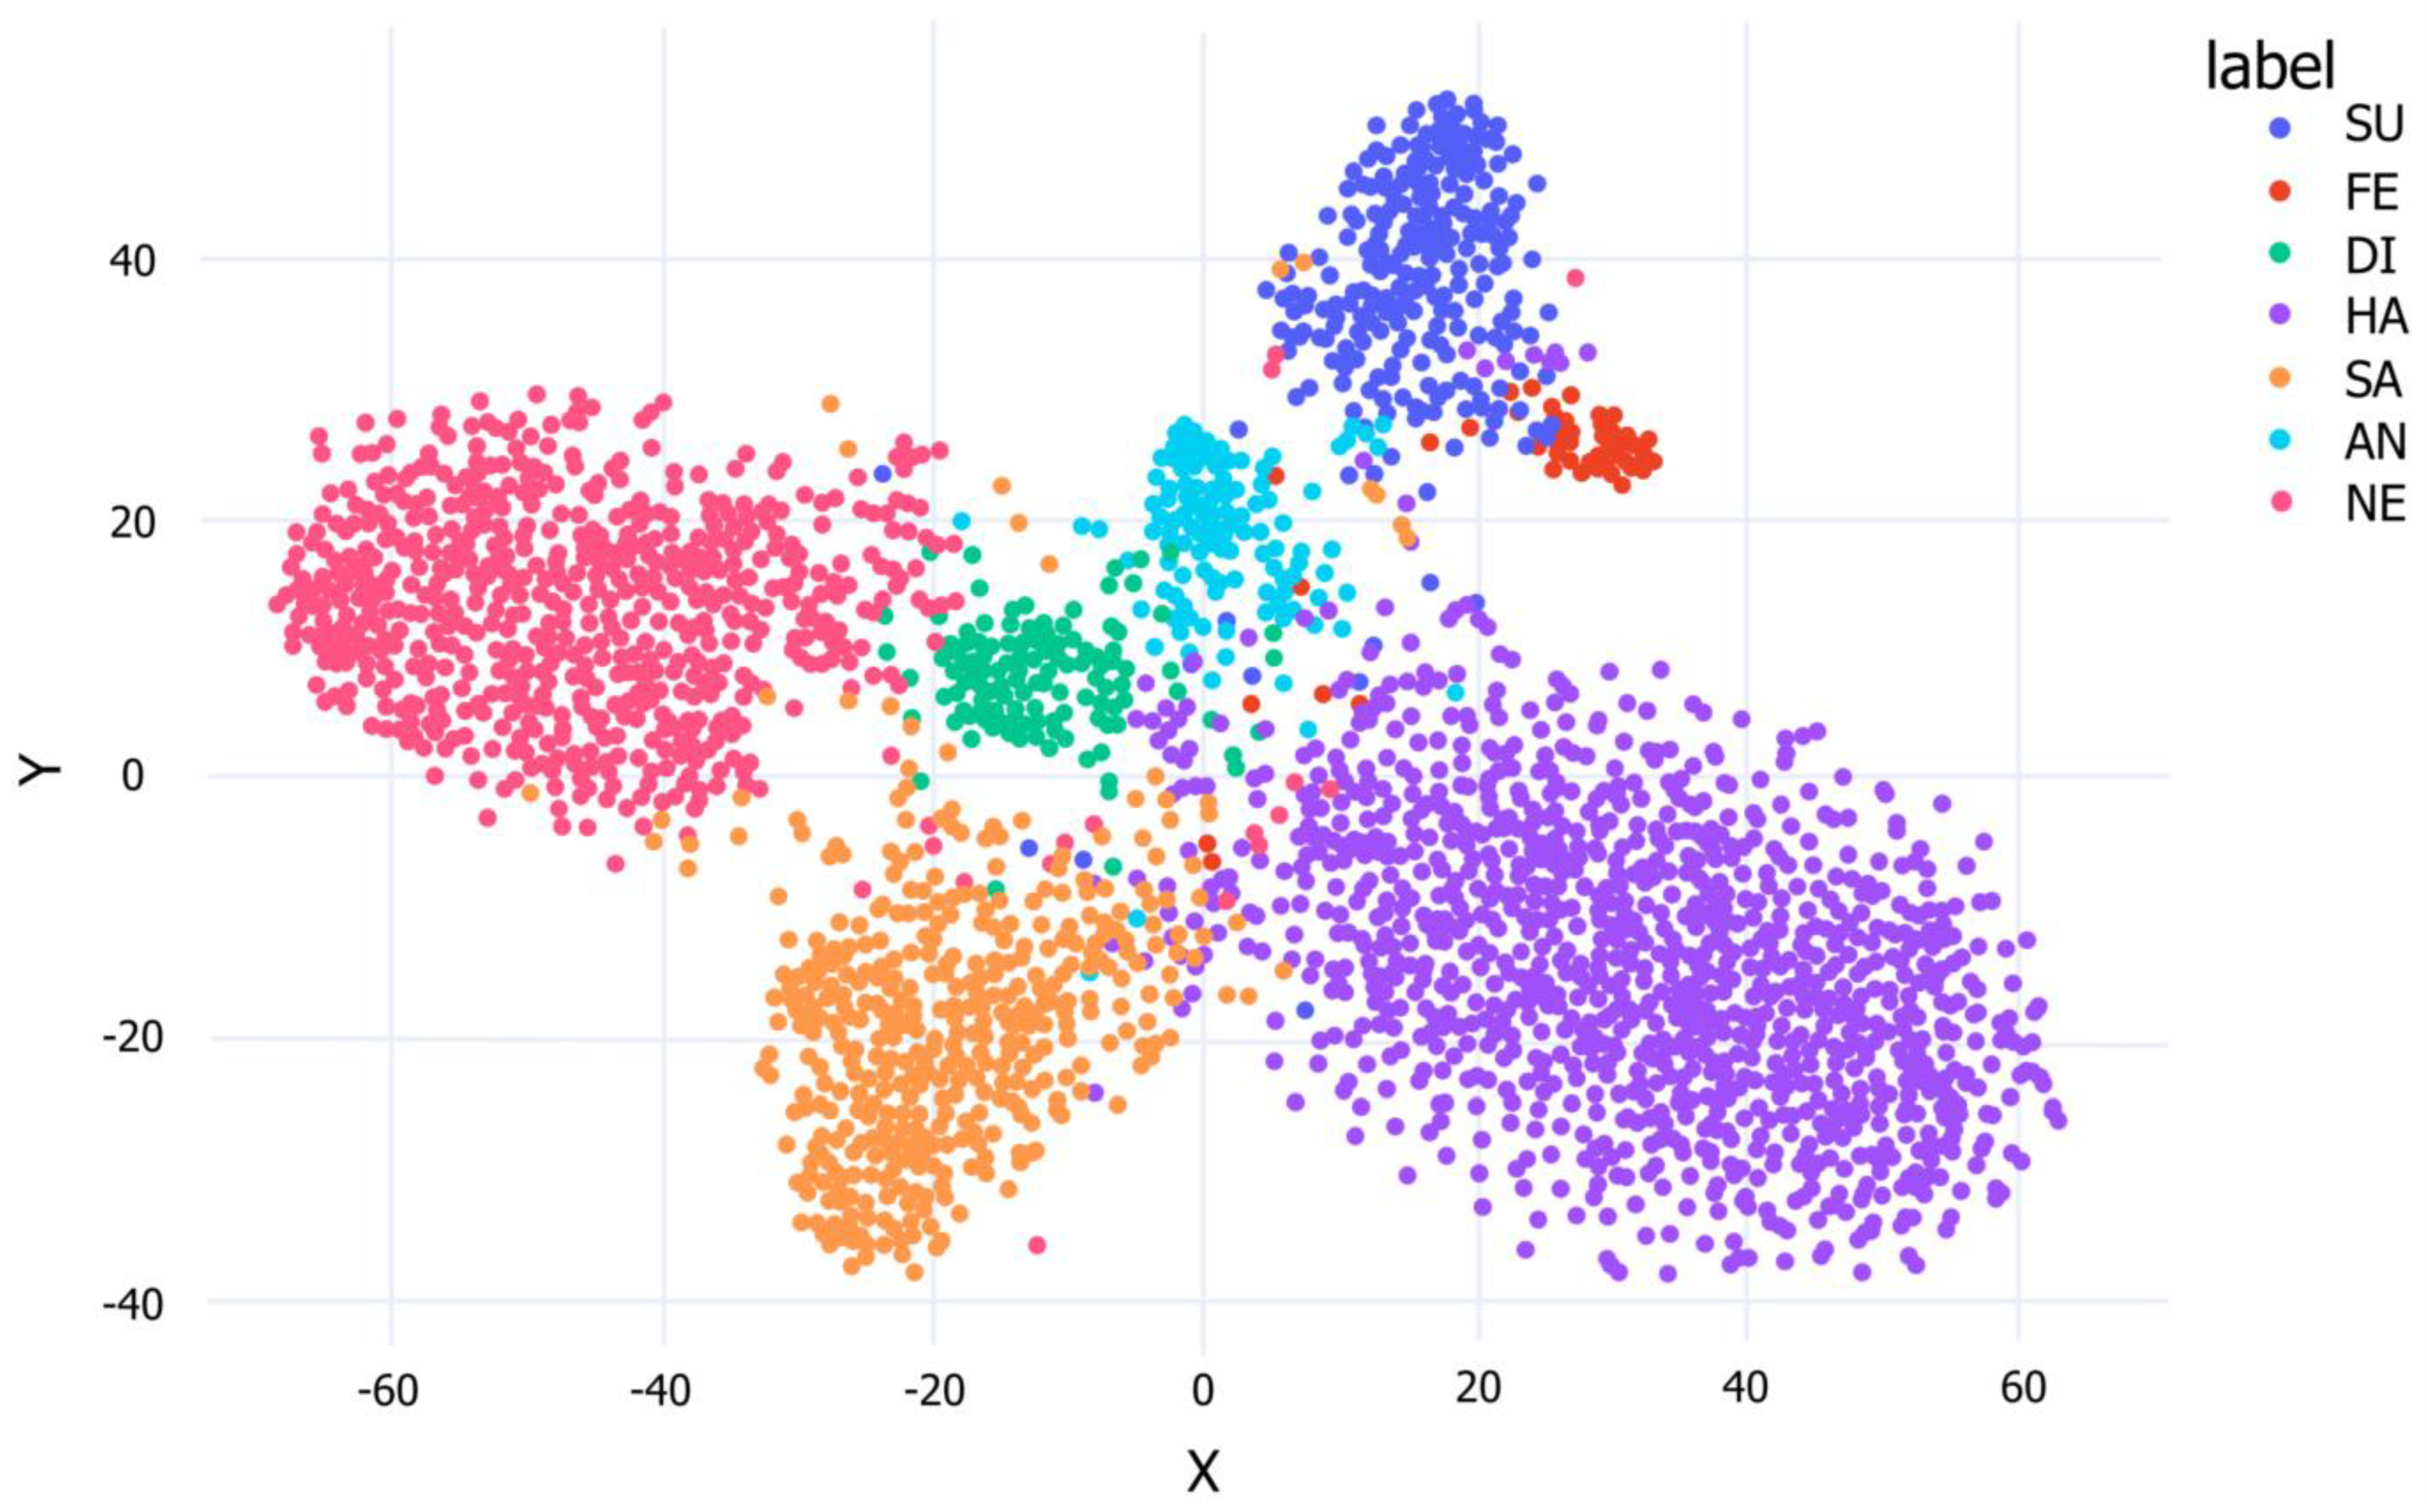
3.3.3. Visualization of Clustering Ability
3.4. Performance Evaluation of FER-PCVT Based on the Private Dataset
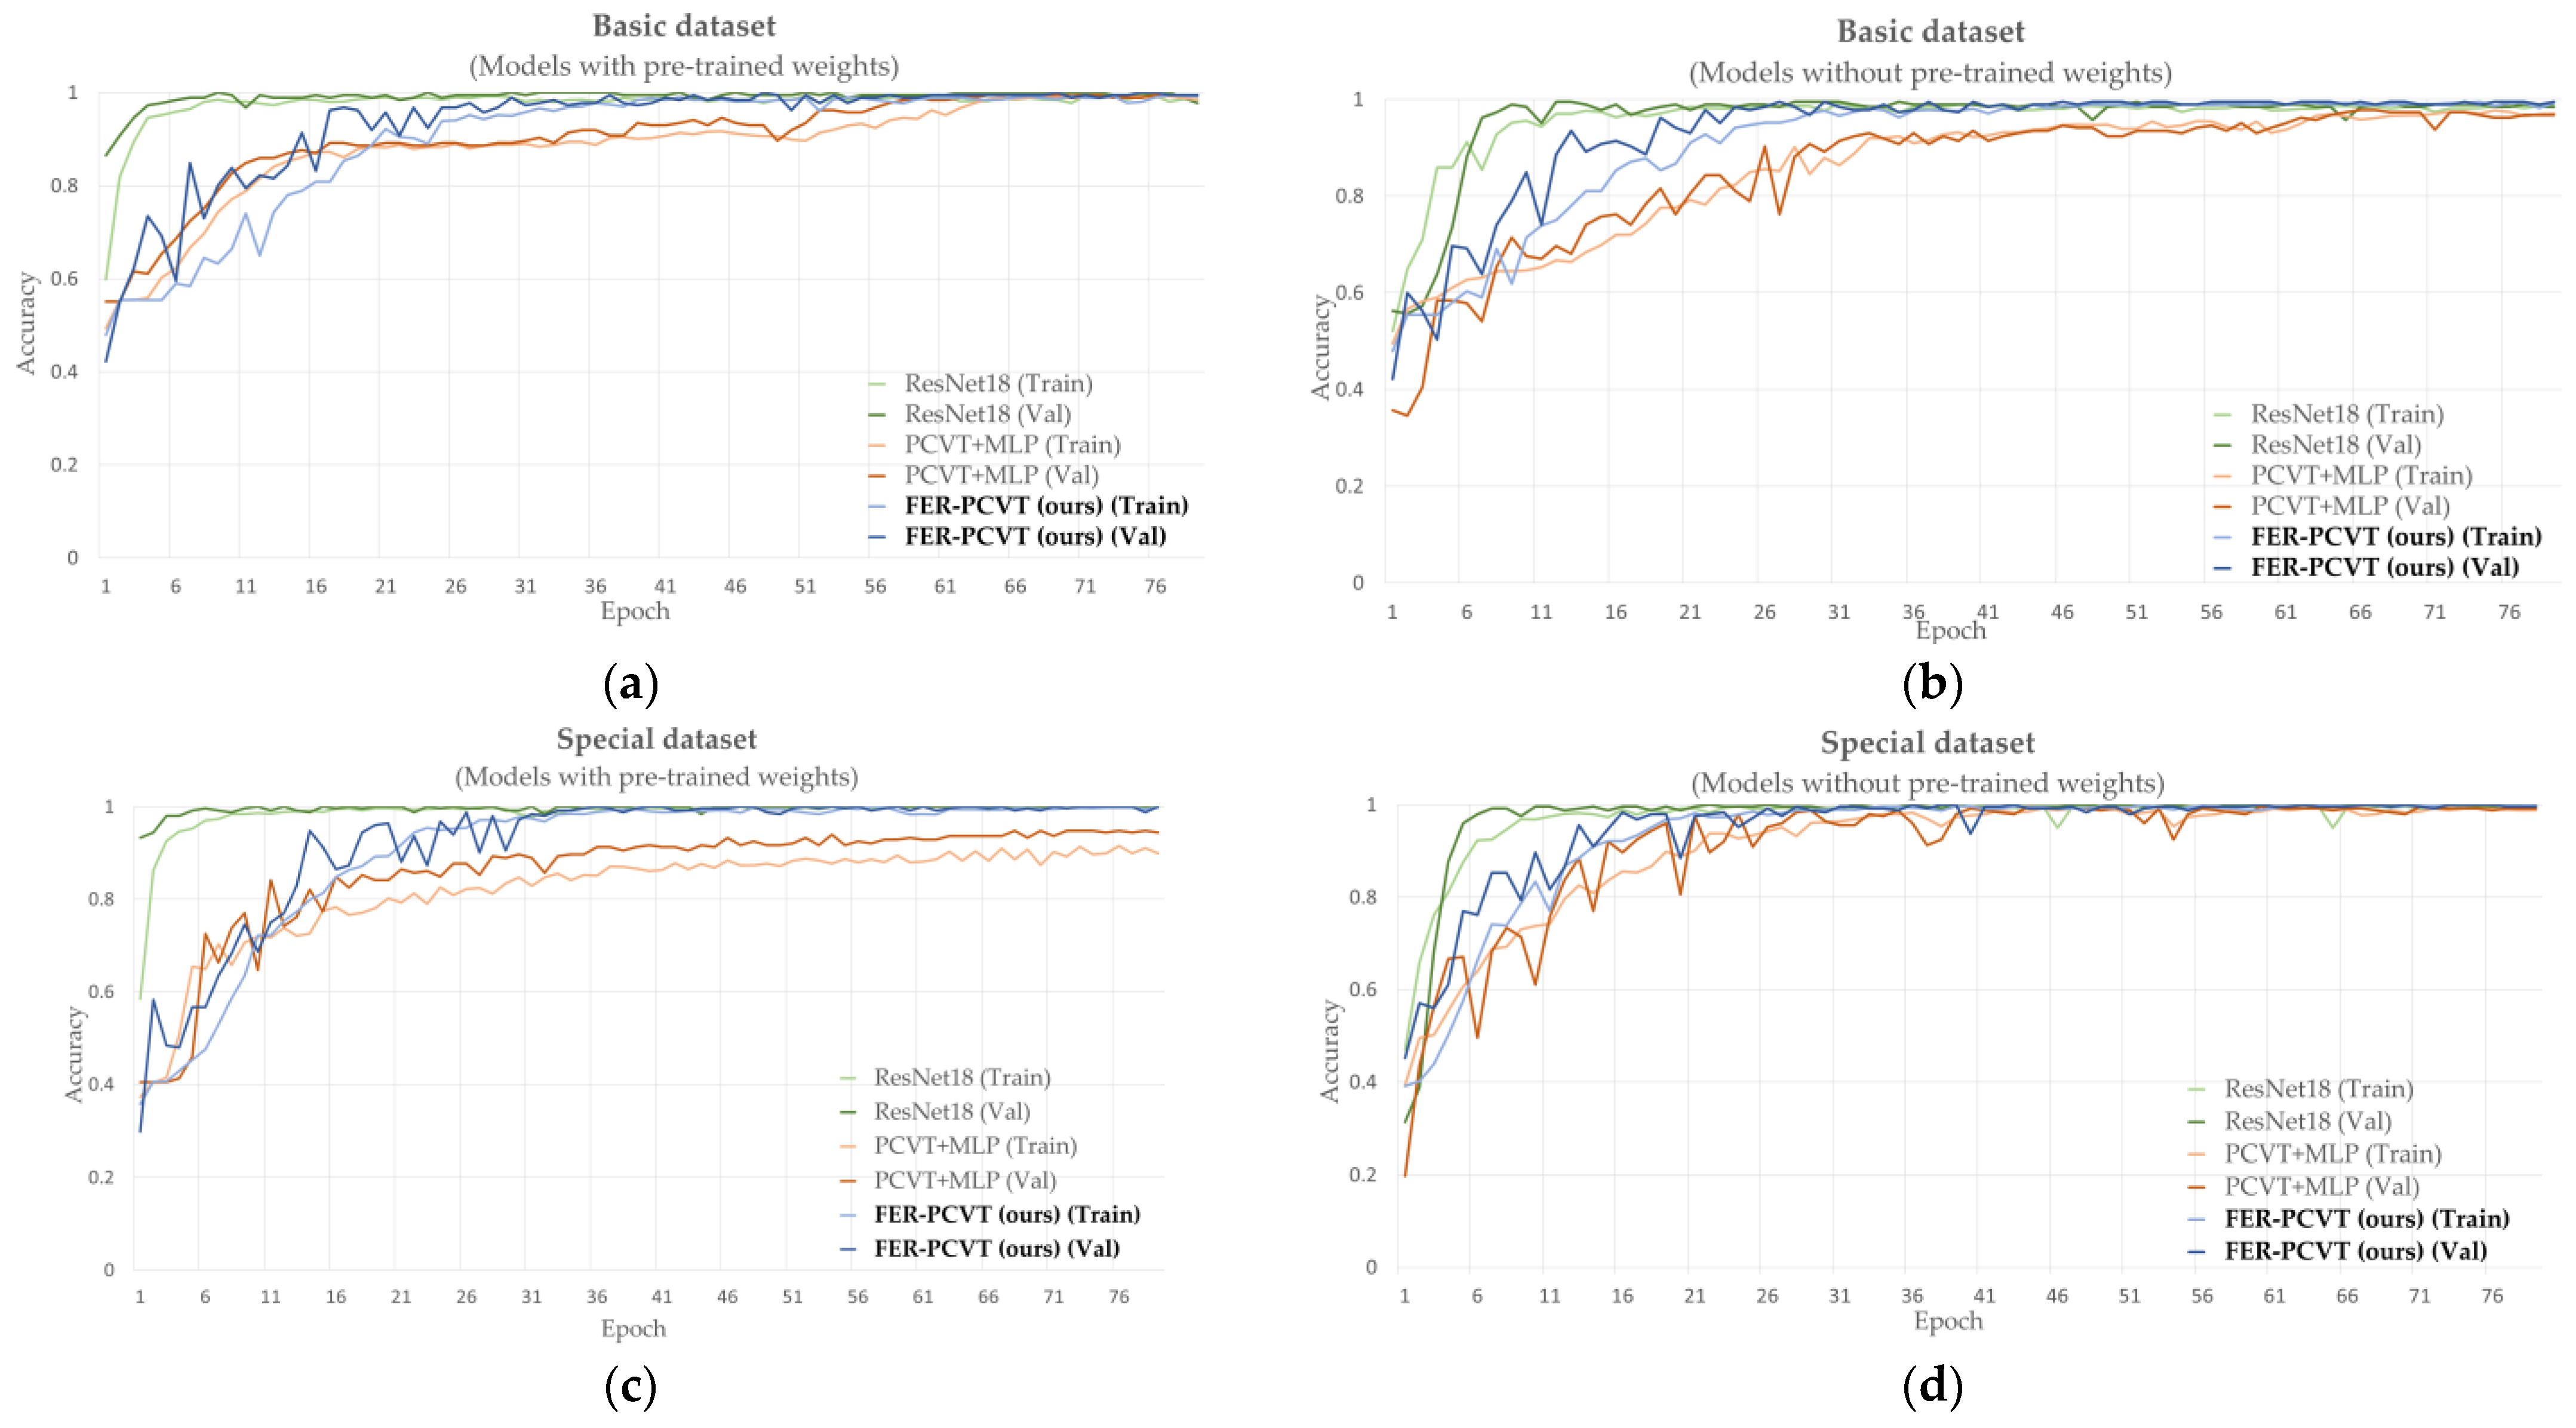
3.4.1. Accuracy Comparison and Impact of Pretrained Weights
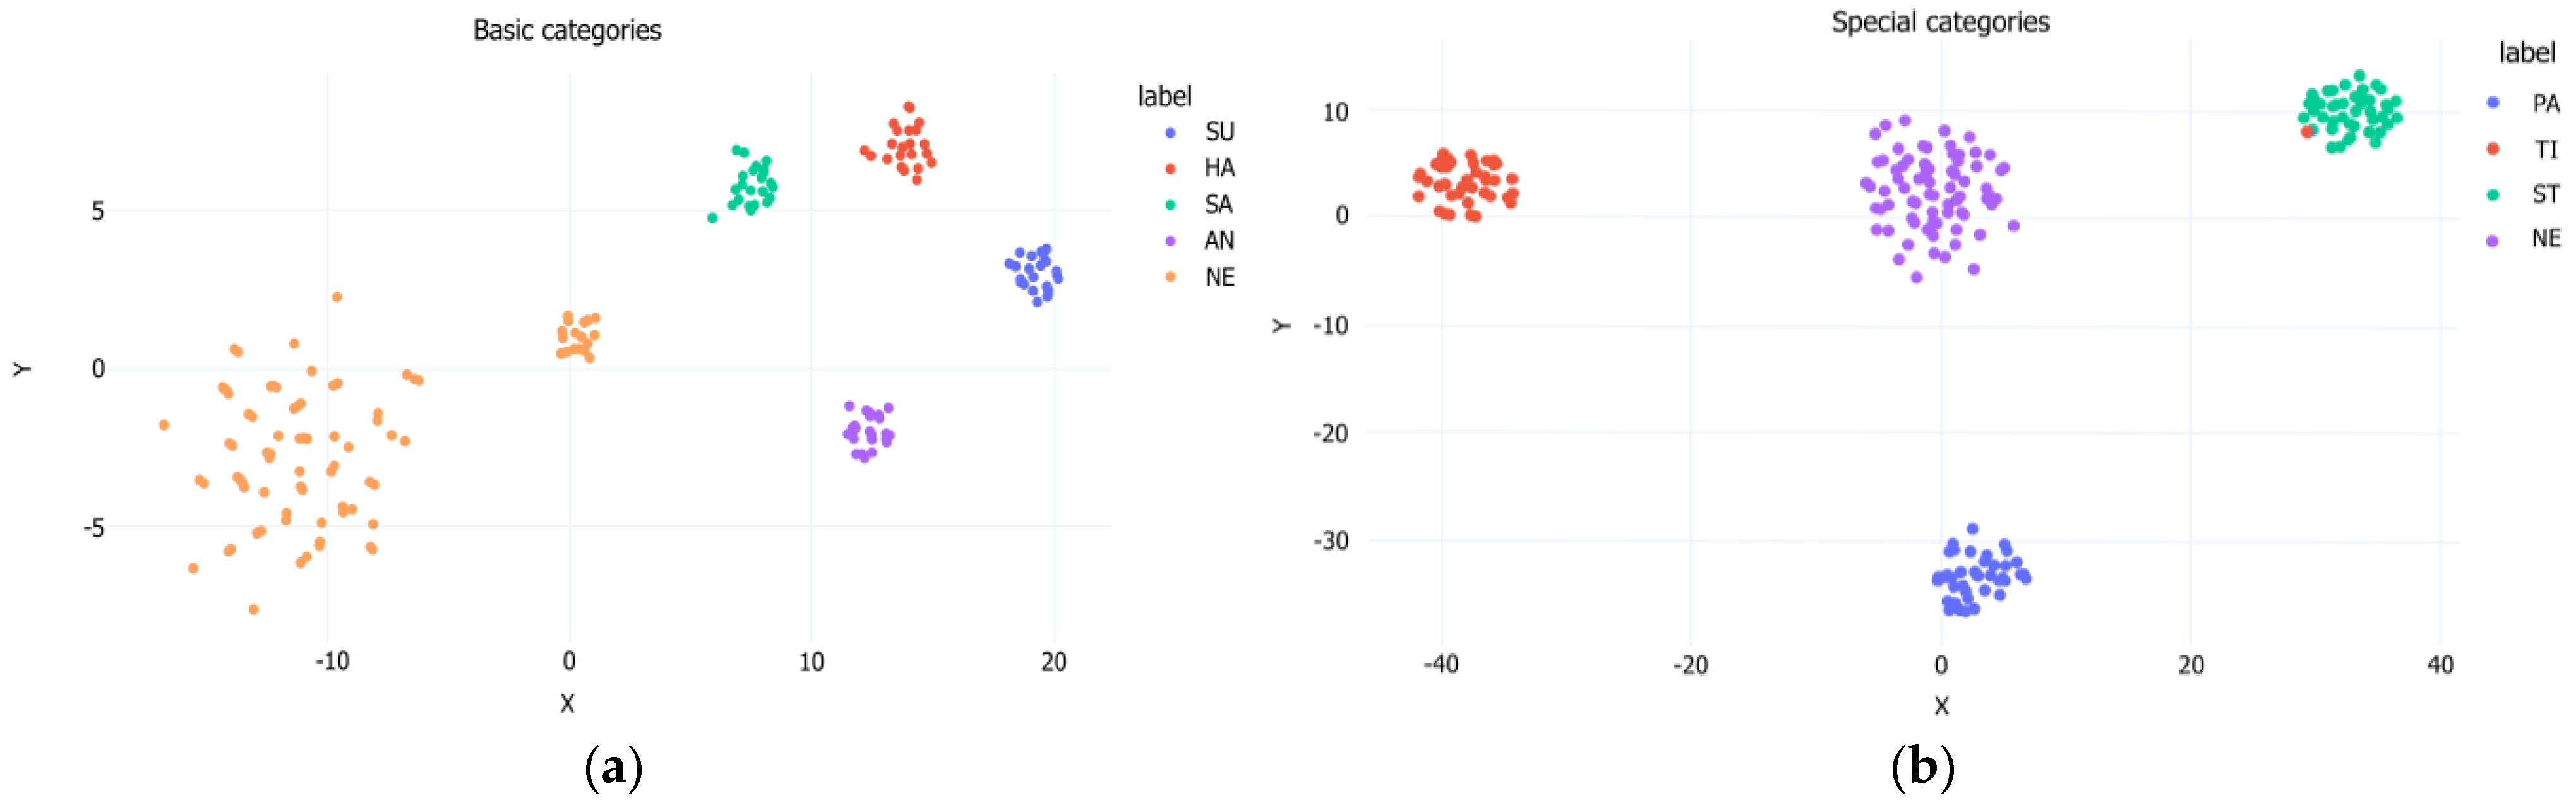
3.4.2. Visualization of Clustering Ability
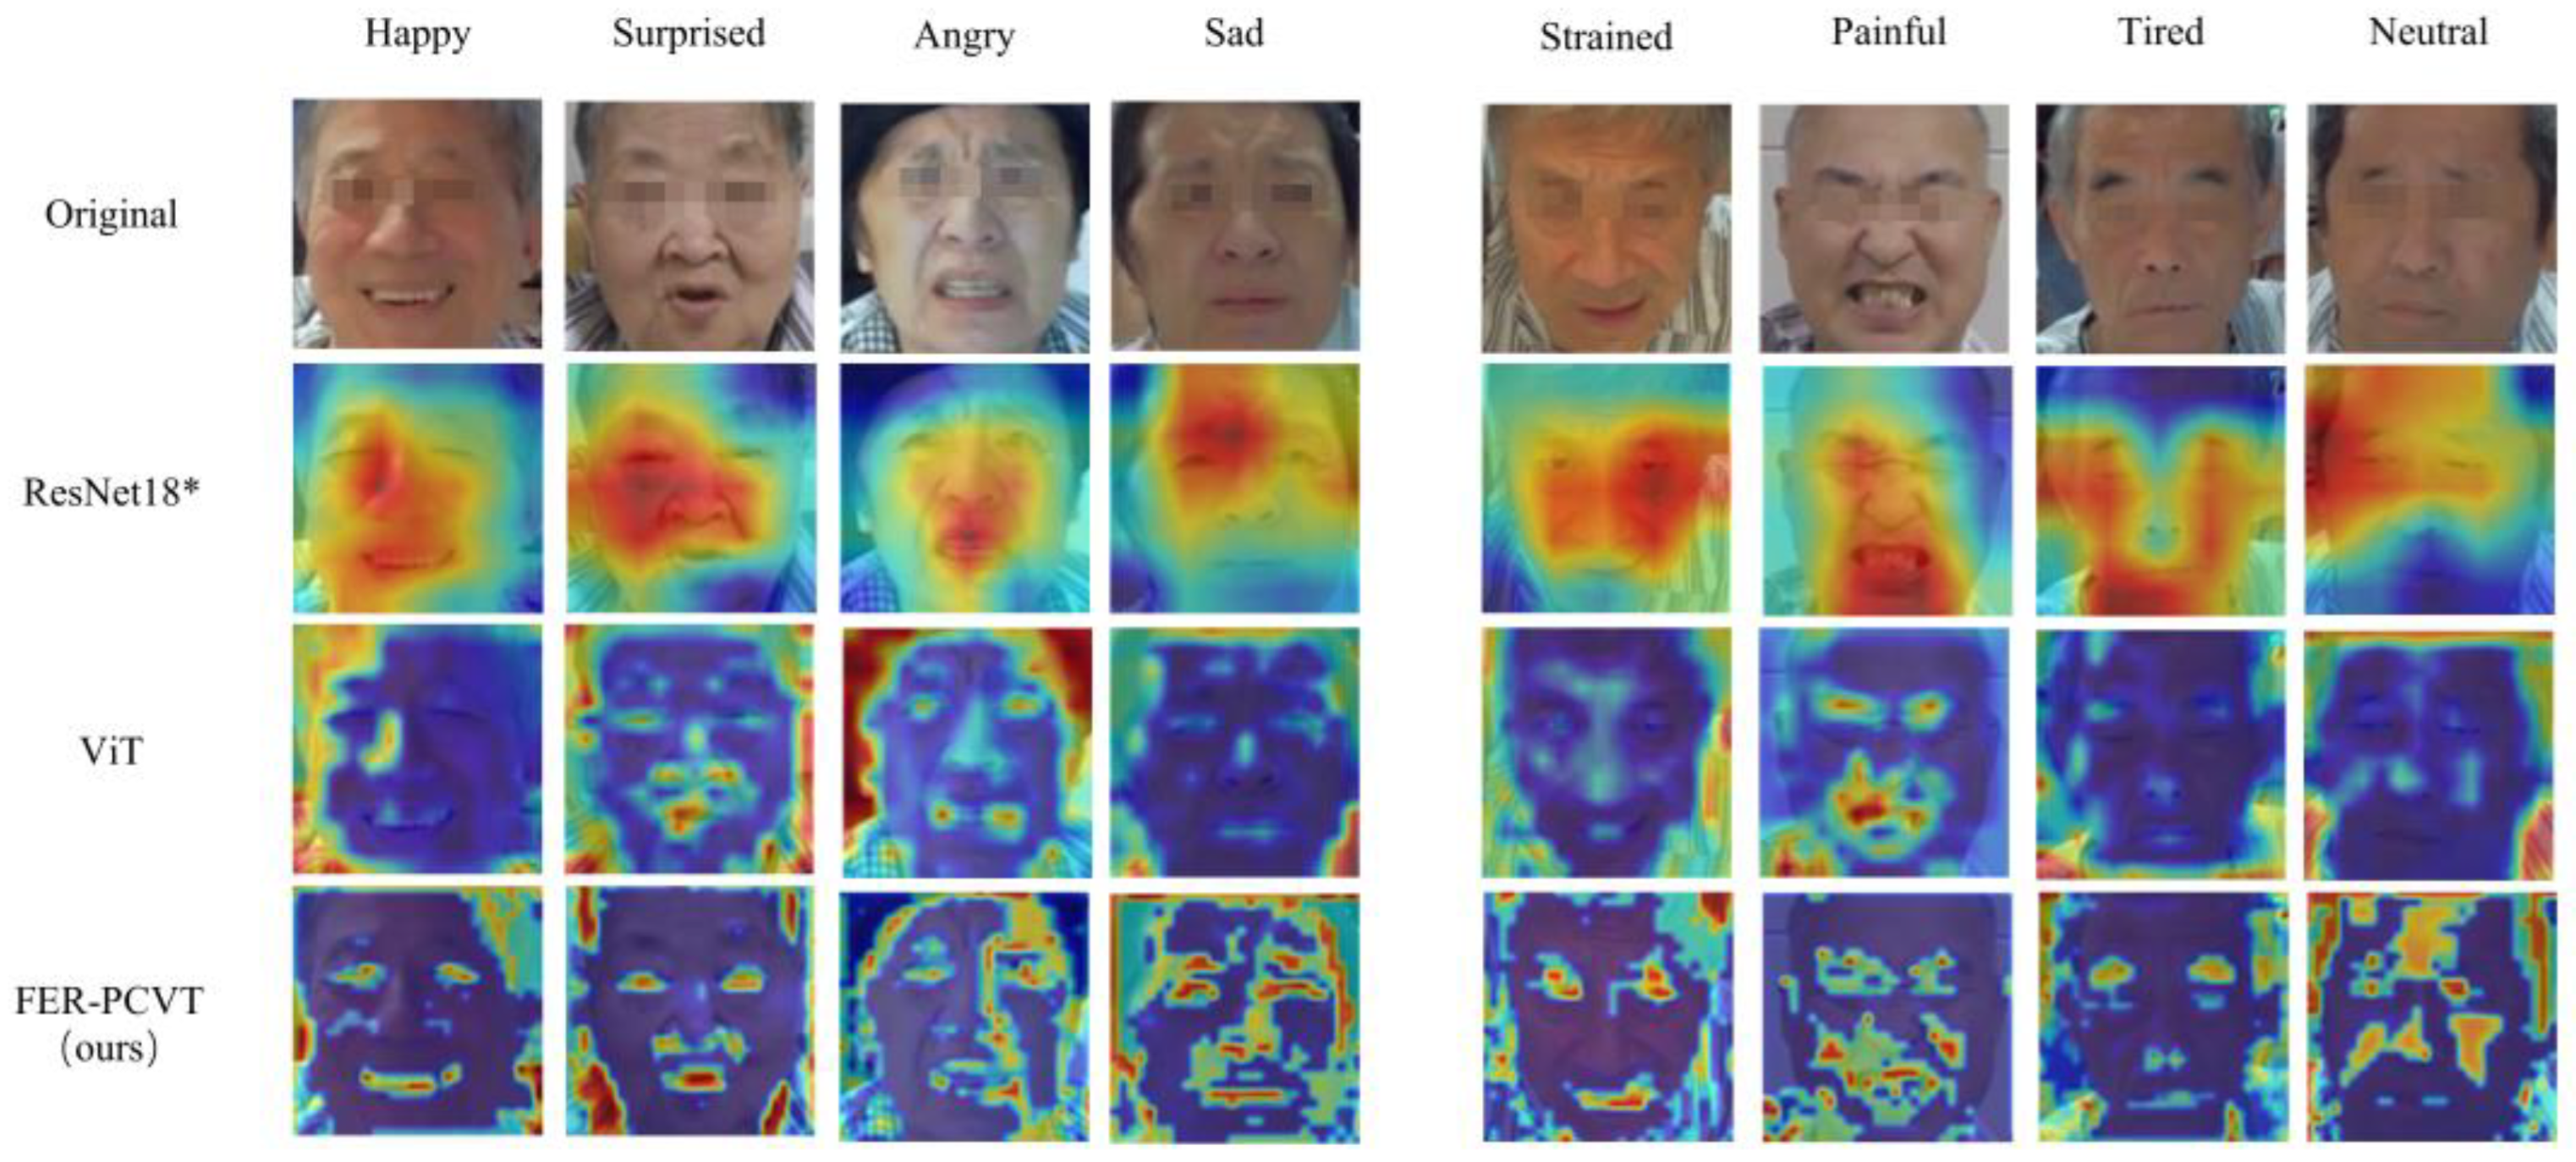
3.5. Visual Analysis
4. Discussion
5. Conclusions
Author Contributions
Funding
Institutional Review Board Statement
Informed Consent Statement
Data Availability Statement
Conflicts of Interest
References
- Wang, Y.N.; Wu, S.M.; Liu, M. Temporal trends and characteristics of stroke in China in the past 15 years. West China Med. J. 2021, 36, 803–807. [Google Scholar] [CrossRef]
- Bernhardt, J.; Godecke, E.; Johnson, L.; Langhorne, P. Early rehabilitation after stroke. Curr. Opin. Neurol. 2017, 30, 48–54. [Google Scholar] [CrossRef] [PubMed] [Green Version]
- Budd, S.; Robinson, E.C.; Kainz, B. A survey on active learning and human-in-the-loop deep learning for medical image analysis. Med. Image Anal. 2021, 71, 102062. [Google Scholar] [CrossRef] [PubMed]
- Duggento, A.; Conti, A.; Mauriello, A.; Guerrisi, M.; Toschi, N. Deep computational pathology in breast cancer. Semin. Cancer Biol. 2021, 72, 226–237. [Google Scholar] [CrossRef] [PubMed]
- Lin, L.; Tao, X.; Yang, W.; Pang, S.; Su, Z.; Lu, H.; Li, S.; Feng, Q.; Chen, B. Quantifying Axial Spine Images Using Object-Specific Bi-Path Network. IEEE J. Biomed. Heal. Inform. 2021, 25, 2978–2987. [Google Scholar] [CrossRef]
- Cai, L.; Gao, J.; Zhao, D. A review of the application of deep learning in medical image classification and segmentation. Ann. Transl. Med. 2020, 8, 713. [Google Scholar] [CrossRef] [PubMed]
- Polat, Ö.; Güngen, C. Classification of brain tumors from MR images using deep transfer learning. J. Supercomput. 2021, 77, 7236–7252. [Google Scholar] [CrossRef]
- Hussain, I.; Park, S.J. HealthSOS: Real-Time Health Monitoring System for Stroke Prognostics. IEEE Access 2020, 8, 213574–213586. [Google Scholar] [CrossRef]
- Hussain, I.; Park, S.J. Big-ECG: Cardiographic Predictive Cyber-Physical System for Stroke Management. IEEE Access 2021, 9, 123146–123164. [Google Scholar] [CrossRef]
- Yean, C.; Ahmad, W.W.; Mustafa, W.; Murugappan, M.; Rajamanickam, Y.; Adom, A.; Omar, M.; Zheng, B.; Junoh, A.; Razlan, Z.; et al. An Emotion Assessment of Stroke Patients by Using Bispectrum Features of EEG Signals. Brain Sci. 2020, 10, 672. [Google Scholar] [CrossRef]
- Murugappan, M.; Zheng, B.S.; Khairunizam, W. Recurrent Quantification Analysis-Based Emotion Classification in Stroke Using Electroencephalogram Signals. Arab. J. Sci. Eng. 2021, 46, 9573–9588. [Google Scholar] [CrossRef]
- Bong, S.Z.; Wan, K.; Murugappan, M.; Ibrahim, N.M.; Rajamanickam, Y.; Mohamad, K. Implementation of wavelet packet transform and non linear analysis for emotion classification in stroke patient using brain signals. Biomed. Signal Process. Control. 2017, 36, 102–112. [Google Scholar] [CrossRef]
- Xu, G.; Gao, X.; Pan, L.; Chen, S.; Wang, Q.; Zhu, B.; Li, J. Anxiety detection and training task adaptation in robot-assisted active stroke rehabilitation. Int. J. Adv. Robot. Syst. 2018, 15, 1729881418806433. [Google Scholar] [CrossRef] [Green Version]
- Agbolade, O.; Nazri, A.; Yaakob, R.; Ghani, A.A.; Cheah, Y.K. Down Syndrome Face Recognition: A Review. Symmetry 2020, 12, 1182. [Google Scholar] [CrossRef]
- Wang, Z.; Ma, Z.; Liu, W.; An, Z.; Huang, F. A Depression Diagnosis Method Based on the Hybrid Neural Network and Attention Mechanism. Brain Sci. 2022, 12, 834. [Google Scholar] [CrossRef] [PubMed]
- Rahman, K.K.M.; Subashini, M.M. Identification of Autism in Children Using Static Facial Features and Deep Neural Networks. Brain Sci. 2022, 12, 94. [Google Scholar] [CrossRef]
- Yolcu, G.; Oztel, I.; Kazan, S.; Oz, C.; Palaniappan, K.; Lever, T.E.; Bunyak, F. Deep learning-based facial expression recognition for monitoring neurological disorders. In Proceedings of the 2017 IEEE International Conference on Bioinformatics and Biomedicine (BIBM), Kansas City, MO, USA, 13–16 November 2017. [Google Scholar]
- Siddiqi, M.H.; Ali, R.; Sattar, A.; Khan, A.M.; Lee, S. Depth Camera-Based Facial Expression Recognition System Using Multilayer Scheme. IETE Tech. Rev. 2014, 31, 277–286. [Google Scholar] [CrossRef]
- Goodfellow, I.J.; Erhan, D.; Carrier, P.L.; Courville, A.; Mirza, M.; Hamner, B.; Cukierski, W.; Tang, Y.; Thaler, D.; Lee, D.-H.; et al. Challenges in representation learning: A report on three machine learning contests. Neural Netw. 2015, 64, 59–63. [Google Scholar] [CrossRef] [Green Version]
- Gold, J.M.; Barker, J.D.; Barr, S.; Bittner, J.L.; Bromfield, W.D.; Chu, N.; Goode, R.A.; Lee, D.; Simmons, M.; Srinath, A. The efficiency of dynamic and static facial expression recognition. J. Vis. 2013, 13, 23. [Google Scholar] [CrossRef]
- Li, S.; Deng, W.H.; Du, J.P. Reliable Crowdsourcing and Deep Locality-Preserving Learning for Expression Recognition in the Wild. In Proceedings of the IEEE Conference on Computer Vision and Pattern Recognition (CVPR), Honolulu, HI, USA, 21–26 July 2017. [Google Scholar]
- Mollahosseini, A.; Hasani, B.; Mahoor, M.H. AffectNet: A Database for Facial Expression, Valence, and Arousal Computing in the Wild. IEEE Trans. Affect. Comput. 2017, 10, 18–31. [Google Scholar] [CrossRef]
- Simonyan, K.; Zisserman, A. Very Deep Convolutional Networks for Large-Scale Image Recognition. arXiv 2015, arXiv:1409.1556. [Google Scholar] [CrossRef]
- Mollahosseini, A.; Chan, D.; Mahoor, M.H. Going deeper in facial expression recognition using deep neural networks. In Proceedings of the IEEE Winter Conference on Applications of Computer Vision (WACV), Lake Placid, NY, USA, 7–10 March 2016. [Google Scholar]
- He, K.; Zhang, X.; Ren, S.; Sun, J. Deep Residual Learning for Image Recognition. In Proceedings of the IEEE Conference on Computer Vision and Pattern Recognition (CVPR), Las Vegas, NV, USA, 27–30 June 2016. [Google Scholar]
- Bahdanau, D.; Cho, K.; Bengio, Y. Neural Machine Translation by Jointly Learning to Align and Translate. arXiv 2014, arXiv:1409.0473. [Google Scholar] [CrossRef]
- Wen, Z.; Lin, W.; Wang, T.; Xu, G. Distract Your Attention: Multi-head Cross Attention Network for Facial Expression Recognition. arXiv 2021, arXiv:2109.07270. [Google Scholar] [CrossRef]
- Farzaneh, A.H.; Qi, X.J. Facial Expression Recognition in the Wild via Deep Attentive Center Loss. In Proceedings of the IEEE/CVF Winter Conference on Applications of Computer Vision (WACV), Waikoloa, HI, USA, 3–8 January 2021. [Google Scholar]
- Wang, K.; Peng, X.J.; Yang, J.F.; Meng, D.B.; Qiao, Y. Region Attention Networks for Pose and Occlusion Robust Facial Expression Recognition. IEEE Trans. Image Process. 2020, 29, 4057–4069. [Google Scholar] [CrossRef] [Green Version]
- Dosovitskiy, A.; Beyer, L.; Kolesnikov, A.; Weissenborn, D.; Zhai, X.; Unterthiner, T.; Dehghani, M.; Minderer, M.; Heigold, G.; Gelly, S.; et al. An Image is Worth 16x16 words: Transformers for Image Recognition at Scale. arXiv 2020, arXiv:2010.11929. [Google Scholar] [CrossRef]
- Vaswani, A.; Shazeer, N.; Parmar, N.; Uszkoreit, J.; Jones, L.; Gomez, A.N.; Kaiser, Ł.; Polosukhin, I. Attention Is All You Need. arXiv 2017, arXiv:1706.03762. [Google Scholar] [CrossRef]
- Aouayeb, M.; Hamidouche, W.; Soladie, C.; Kpalma, K.; Seguier, R. Learning Vision Transformer with Squeeze and Excitation for Facial Expression Recognition. arXiv 2021, arXiv:2107.03107. [Google Scholar] [CrossRef]
- Fayyaz, M.; Koohpayegani, S.A.; Jafari, F.R.; Sengupta, S.; Joze, H.R.V.; Sommerlade, E.; Pirsiavash, H.; Gall, J. Adaptive Token Sampling for Efficient Vision Transformers. arXiv 2022, arXiv:2111.15667. [Google Scholar] [CrossRef]
- Ma, F.; Sun, B.; Li, S. Facial Expression Recognition with Visual Transformers and Attentional Selective Fusion. IEEE Trans. Affect. Comput. 2021. [Google Scholar] [CrossRef]
- Wu, H.P.; Xiao, B.; Codella, N.; Liu, M.; Dai, X.; Yuan, L.; Zhang, L. CvT: Introducing Convolutions to Vision Transformers. In Proceedings of the IEEE/CVF International Conference on Computer Vision (ICCV), Montreal, QC, Canada, 10–17 October 2021. [Google Scholar]
- Barsoum, E.; Zhang, C.; Ferrer, C.C.; Zhang, Z.Y. Training Deep Networks for Facial Expression Recognition with Crowd-Sourced Label Distribution. In Proceedings of the 18th ACM International Conference on Multimodal Interaction (ICMI ’16), Tokyo, Japan, 12–16 November 2016. [Google Scholar]
- GitHub. Available online: https://github.com/dlunion/DBFace (accessed on 28 March 2022).
- Ekman, P.E.; Friesen, W.V. Facial Action Coding System (FACS). Environ. Psychol. Nonverbal Behav. 1978. [Google Scholar] [CrossRef]
- Lucey, P.; Cohn, J.F.; Prkachin, K.M.; Solomon, P.E.; Matthews, I. Painful data: The UNBC-McMaster shoulder pain expression archive database. In Proceedings of the IEEE international Conference on Automatic Face & Gesture Recognition (FG), Santa Barbara, CA, USA, 21–35 March 2011. [Google Scholar]
- Feldman, L.A. Valence focus and arousal focus: Individual differences in the structure of affective experience. J. Personal. Soc. Psychol. 1995, 69, 153–166. [Google Scholar] [CrossRef]
- Xiao, T.; Singh, M.; Mintun, E.; Darrell, T.; Dollár, P.; Girshick, R. Early Convolutions Help Transformers See Better. Adv. Neural Inf. Process. Syst. 2021, 34, 30392–30400. [Google Scholar] [CrossRef]
- Wang, W.H.; Xie, E.Z.; Li, X.; Fan, D.P.; Song, K.; Liang, D.; Lu, T.; Luo, P.; Shao, L. Pyramid Vision Transformer: A Versatile Backbone for Dense Prediction without Convolutions. In Proceedings of the 2021 IEEE/CVF International Conference on Computer Vision (ICCV), Montreal, QC, Canada, 10–17 October 2021. [Google Scholar]
- Loshchilov, L.; Hutter, F. Decoupled Weight Decay Regularization. arXiv 2017, arXiv:1711.05101. [Google Scholar] [CrossRef]
- Steiner, A.; Kolesnikov, A.; Zhai, X.H.; Wightman, R.; Uszkoreit, J.; Beyer, L. How to train your ViT? Data, Augmentation, and Regularization in Vision Transformers. arXiv 2021, arXiv:2106.10270. [Google Scholar] [CrossRef]
- Li, Y.; Lu, G.; Li, J.; Zhang, Z.; Zhang, D. Facial Expression Recognition in the Wild Using Multi-level Features and Attention Mechanisms. IEEE Trans. Affect. Comput. 2020. [Google Scholar] [CrossRef]
- Fard, A.P.; Mahoor, M.H. Ad-Corre: Adaptive Correlation-Based Loss for Facial Expression Recognition in the Wild. IEEE Access 2022, 10, 26756–26768. [Google Scholar] [CrossRef]
- Wang, K.; Peng, X.J.; Yang, J.F.; Lu, S.; Qiao, Y. Suppressing Uncertainties for Large-Scale Facial Expression Recognition. In Proceedings of the 2020 IEEE/CVF Conference on Computer Vision and Pattern Recognition (CVPR), Seattle, WA, USA, 13–19 June 2020. [Google Scholar]
- Huang, Q.H.; Huang, C.Q.; Wang, X.Z.; Jiang, F. Facial expression recognition with grid-wise attention and visual transformer. Inf. Sci. 2021, 580, 35–54. [Google Scholar] [CrossRef]
- Vo, T.H.; Lee, G.S.; Yang, H.J.; Kim, S.H. Pyramid with Super Resolution for In-the-Wild Facial Expression Recognition. IEEE Access 2020, 8, 131988–132001. [Google Scholar] [CrossRef]
- Zhang, Y.H.; Wang, C.R.; Deng, W.H. Relative Uncertainty Learning for Facial Expression Recognition. Adv. Neural Inf. Process. Syst. 2021, 34, 17616–17627. Available online: https://openreview.net/forum?id=h1-ilmYbdea¬eId=svNqytjxNmQ (accessed on 25 October 2021).
- Zhou, H.S.; Meng, D.B.; Zhang, Y.Y.; Peng, X.; Du, J.; Wang, K.; Qiao, Y. Exploring Emotion Features and Fusion Strategies for Audio-Video Emotion Recognition. In Proceedings of the 2019 International Conference on Multimodal Interaction (ICMI’19), Suzhou, China, 14–18 October 2019. [Google Scholar]
- Selvaraju, R.R.; Cogswell, M.; Das, A.; Vedantam, R.; Parikh, D.; Batra, D. Grad-CAM: Visual Explanations from Deep Networks via Gradient-Based Localization. In Proceedings of the 2017 IEEE International Conference on Computer Vision (ICCV), Venice, Italy, 22–29 October 2017. [Google Scholar]


| Class | FER+ | RAF-DB | Private Dataset | |||
|---|---|---|---|---|---|---|
| Simple Size | Proportion (%) | Simple Size | Proportion (%) | Simple size | Proportion (%) | |
| happy | 5165 | 24.41 | 5957 | 38.84 | 141 | 10.83 |
| surprised | 3963 | 18.73 | 1619 | 10.55 | 62 | 4.76 |
| sad | 3765 | 17.79 | 2460 | 16.04 | 78 | 5.99 |
| angry | 2594 | 12.26 | 867 | 5.65 | 44 | 3.38 |
| neutral | 4748 | 22.44 | 3204 | 20.89 | 509 | 39.09 |
| fearful | 633 | 2.99 | 355 | 2.31 | - | - |
| disgusted | 145 | 0.69 | 877 | 5.72 | - | - |
| contempt | 148 | 0.70 | - | - | - | - |
| painful | - | - | - | - | 85 | 6.53 |
| strained | - | - | - | - | 298 | 22.89 |
| tired | - | - | - | - | 85 | 6.53 |
| Min/Max sample size | 0.0281 | - | 0.0596 | - | 0.0864 | - |
| SUM | 21,161 | 100 | 15,339 | 100 | 1302 | 100 |
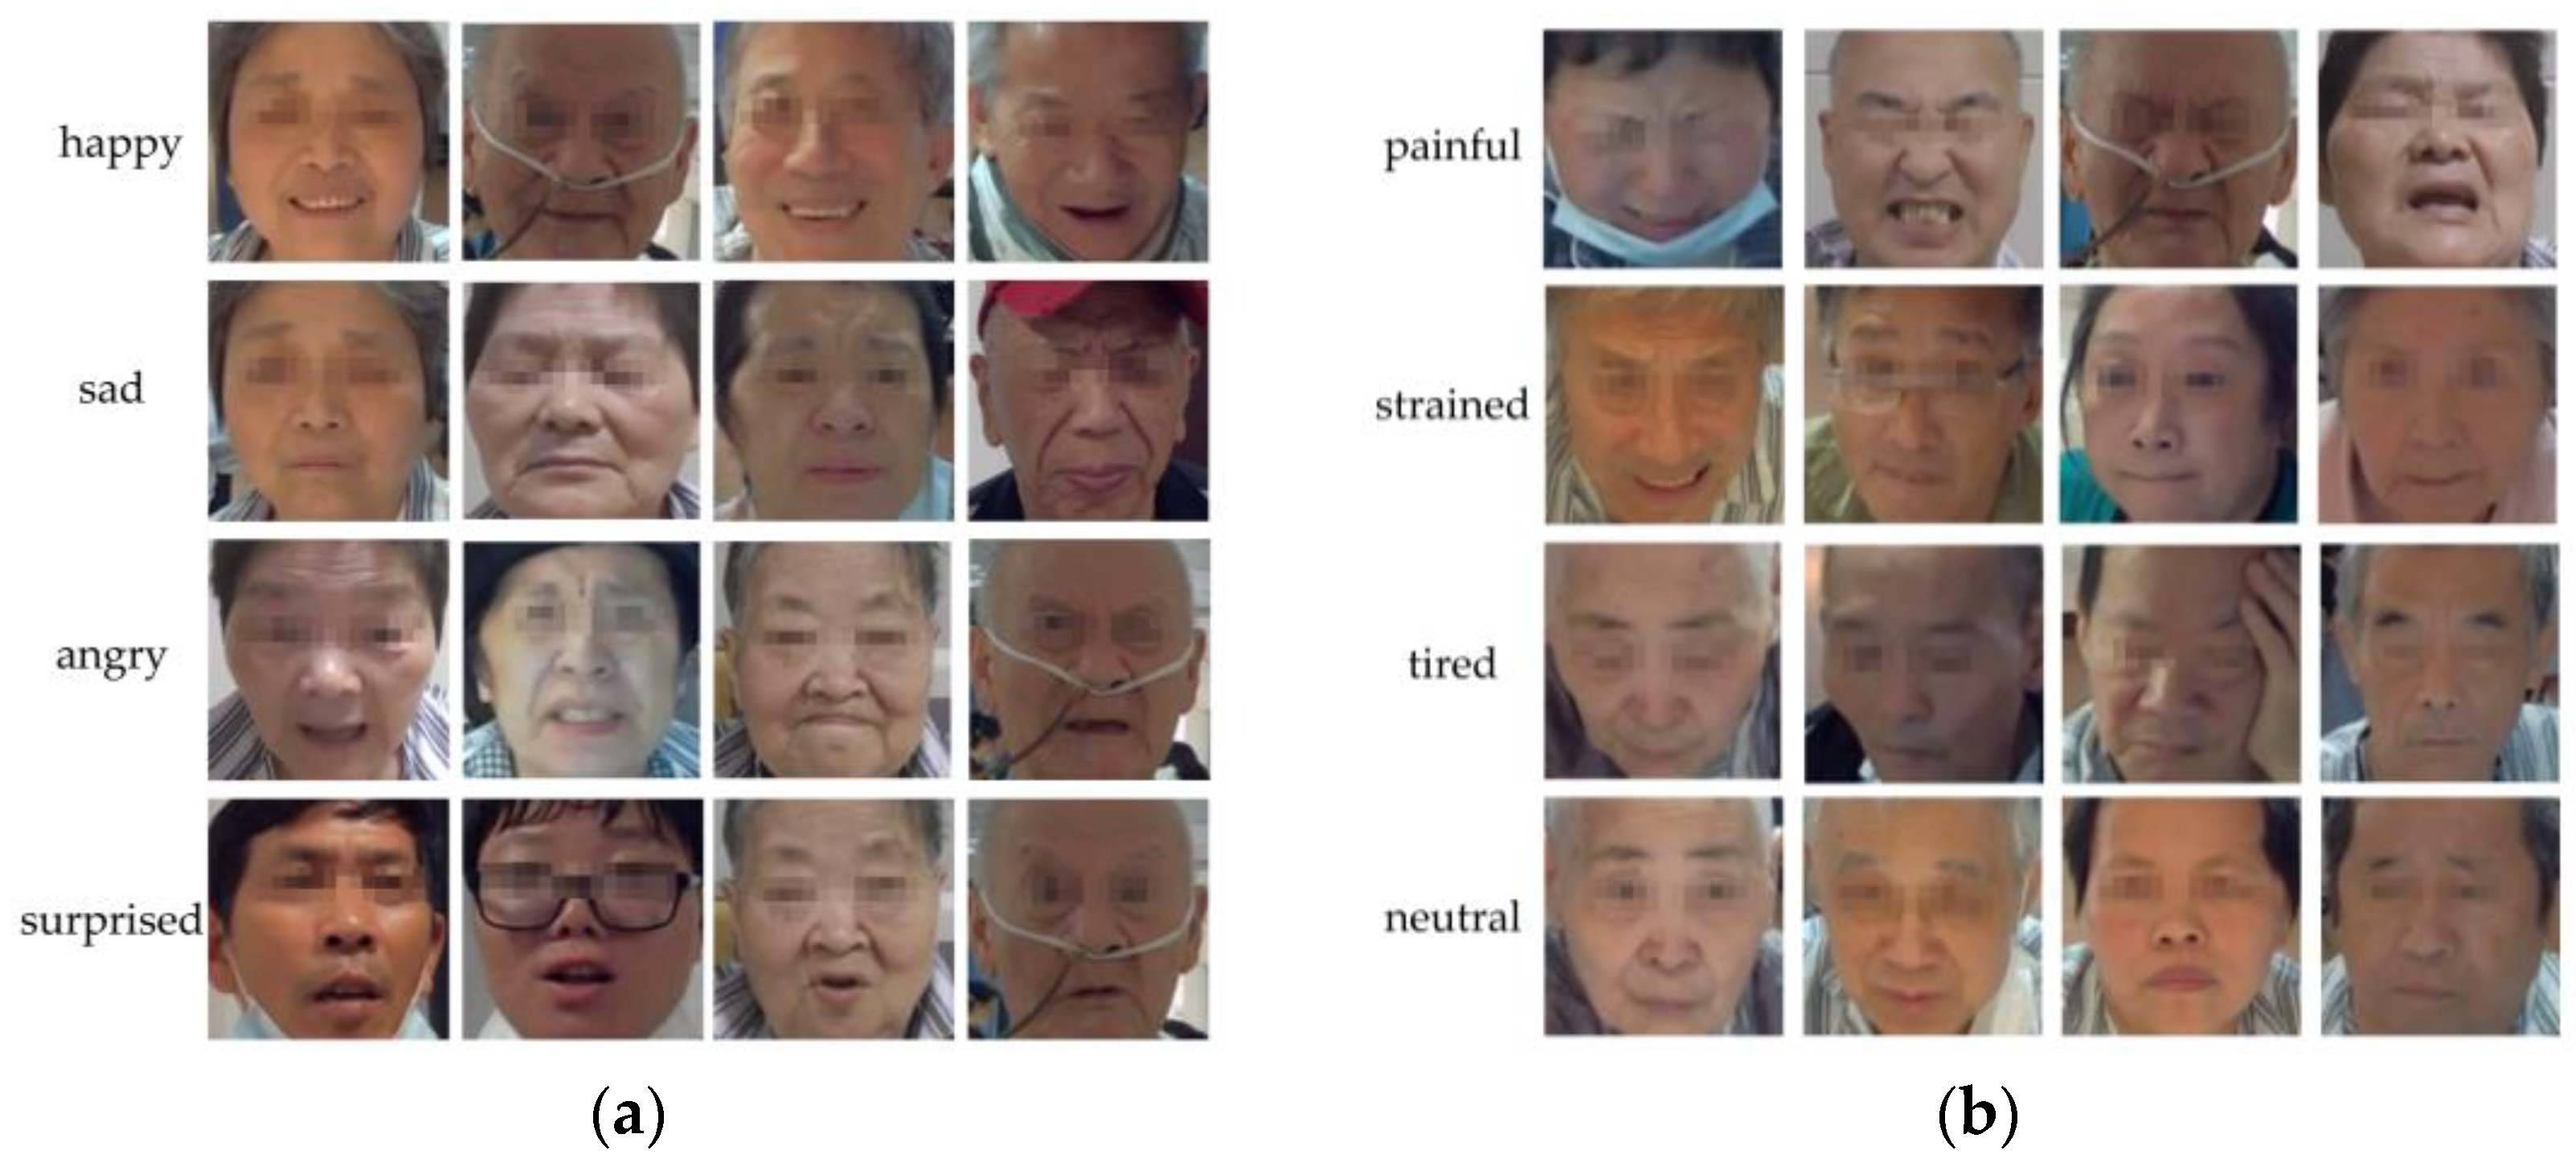
| Emotions | Code * |
|---|---|
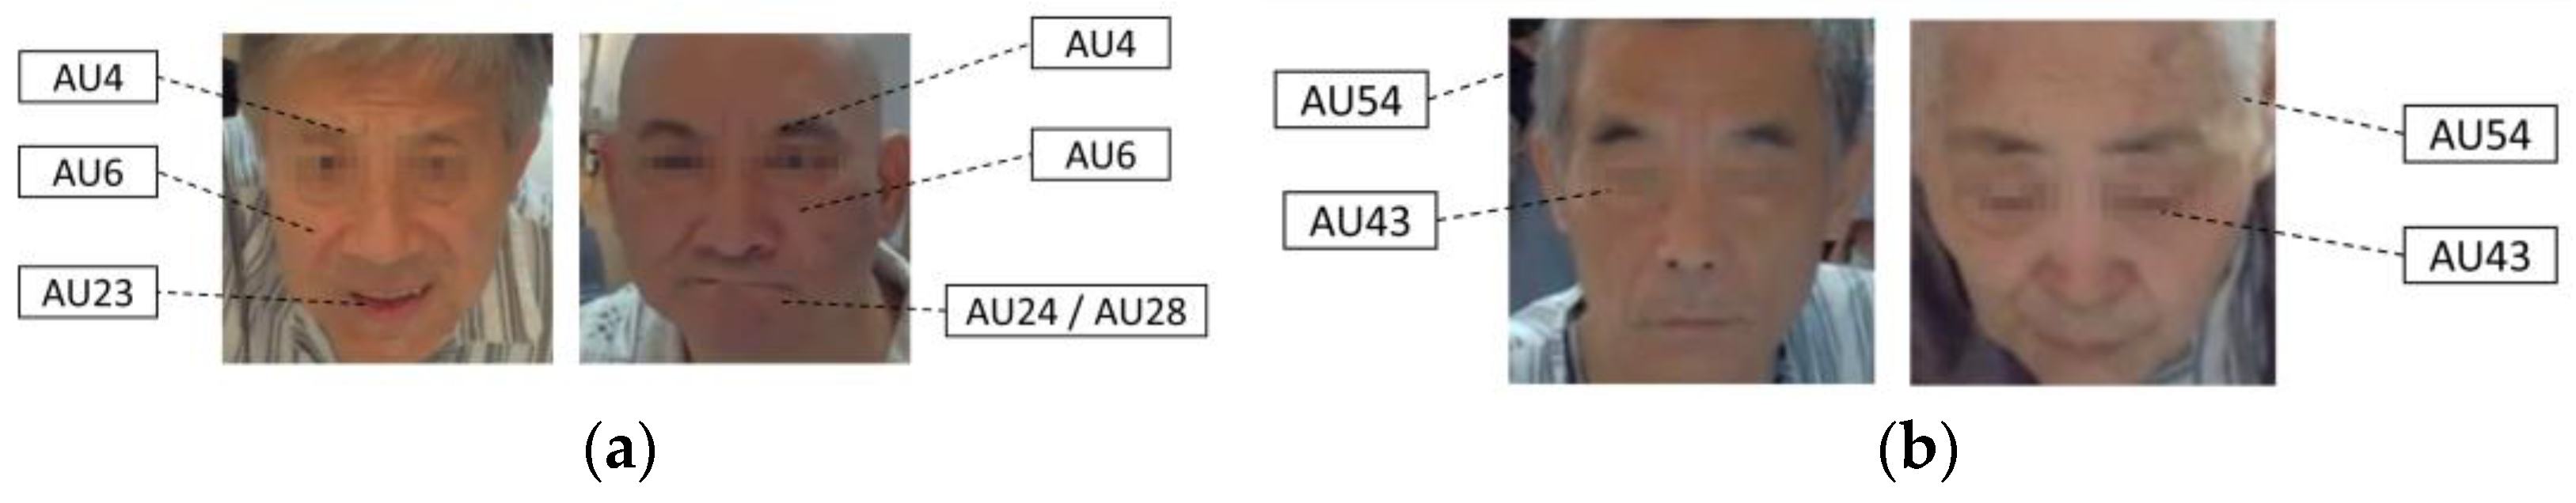
| painful | AU4 + (AU6/AU7) + (AU9/AU10) + AU43 |
| strained | AU4 + AU6 + (AU23/AU24/AU28) |
| tired | AU43 + AU54 |
| neutral | / |
| happy | AU6 + AU12 |
| sad | AU1 + AU4 + AU15 |
| surprised | AU1 + AU2 + AU5 + AU26 |
| angry | AU4 + AU5 + AU7 + AU23 |
| Parameter | Setting |
|---|---|
| optimizer | AdamW [43] 1 |
| loss function | the Cross Entropy Loss |
| batch size | 120 |
| epoch | 200 |
| learning rate | 0.0003 |
| exponential LR | 0.99 |
| Module | Structural Params | Internal Params | Input Size | Output Size |
|---|---|---|---|---|
| CPE | patch size 1 = 8 | 3 × 128 × 128 | 64 × 16 × 16 | |
| PTF1 2 | = 192, heads 3 = 8 | 64 × 16 × 16 | 192 × 8 × 8 | |
| PTF2 2 | = 576, heads 3 = 4 | 192 × 8 × 8 | 576 × 4 × 4 | |
| V-ALC | - | = 7 | 576 × 4 × 4 | 1 × 7 |
| Model | Params (M) | GFLOPs | Accuracy (%) |
|---|---|---|---|
| ResNet18 | 11.20 | 0.29 | 81.52 |
| ResNet18 * | 11.20 | 0.29 | 86.28 |
| CvT | 19.55 | 0.66 | 81.45 |
| PvT | 6.25 | 0.14 | 77.80 |
| PCVT(Ours) | 2.46 | 0.12 | 84.22 |
| Model | Tags | Year | Accuracy | |
|---|---|---|---|---|
| FER+ | RAF-DB | |||
| SPWFA-SE [45] | CNN | 2020 | - | 86.31% |
| RAN [29] | ResNet | 2019 | 89.16% | 86.90% |
| Ad-Corre [46] | CNN | 2022 | 86.96% | |
| DACL [28] | ResNet | 2021 | - | 87.78% |
| VTFF [34] | ViT | 2022 | 88.81% | 88.14% |
| SCN [47] | CNN | 2020 | 89.35% | 88.14% |
| FER-VT [48] | ViT | 2021 | 90.04% | 88.26% |
| PSR [49] | VGG-16 | 2020 | - | 88.98% |
| RUL [50] | ResNet | 2021 | - | 88.98% |
| LResNet50E-IR [51] | ResNet | 2020 | 89.257% | 89.075% |
| FER-PCVT(Ours) | ViT | 2022 | 88.21% | 89.44% |
| Class | RAF-DB | FER+ | ||||||||
|---|---|---|---|---|---|---|---|---|---|---|
| Precision | Specificity | Sensitivity | F1-Score | G-Mean | Precision | Specificity | Sensitivity | F1-Score | G-Mean | |
| surprised | 0.877 | 0.987 | 0.81 | 0.842 | 0.894 | 0.912 | 0.982 | 0.82 | 0.864 | 0.898 |
| fear | 0.824 | 0.996 | 0.66 | 0.733 | 0.811 | 0.555 | 0.987 | 0.53 | 0.542 | 0.723 |
| disgust | 0.688 | 0.982 | 0.67 | 0.679 | 0.811 | 0 | 1 | 0 | 0 | 0 |
| happy | 0.941 | 0.962 | 0.95 | 0.945 | 0.956 | 0.861 | 0.951 | 0.93 | 0.894 | 0.940 |
| sad | 0.864 | 0.974 | 0.87 | 0.867 | 0.921 | 0.835 | 0.975 | 0.59 | 0.691 | 0.758 |
| angry | 0.895 | 0.995 | 0.73 | 0.804 | 0.852 | 0.462 | 0.886 | 0.70 | 0.557 | 0.788 |
| neutral | 0.882 | 0.966 | 0.97 | 0.924 | 0.968 | 0.632 | 0.851 | 0.88 | 0.736 | 0.865 |
| contempt | - | - | - | - | 0 | 1 | 0 | 0 | 0 | |
| Model | Params (M) | Pre-Training | Accuracy (%) | ||
|---|---|---|---|---|---|
| Basic Categories 1 | Special Categories 2 | AVG | |||
| ResNet18 | 11.19 | ✘ | 98.72 | 99.66 | 99.19 |
| ✔ | 99.58 | 99.72 | 99.65 | ||
| RCVT+MLP | 4.06 | ✘ | 88.46 | 97.22 | 92.84 |
| ✔ | 98.64 | 99.21 | 98.93 | ||
| PCVT+V-ALC (Ours) | 4.10 | ✘ | 99.15 | 99.42 | 99.29 |
| ✔ | 99.89 | 99.72 | 99.81 | ||
Publisher’s Note: MDPI stays neutral with regard to jurisdictional claims in published maps and institutional affiliations. |
© 2022 by the authors. Licensee MDPI, Basel, Switzerland. This article is an open access article distributed under the terms and conditions of the Creative Commons Attribution (CC BY) license (https://creativecommons.org/licenses/by/4.0/).
Share and Cite
Fan, Y.; Wang, H.; Zhu, X.; Cao, X.; Yi, C.; Chen, Y.; Jia, J.; Lu, X. FER-PCVT: Facial Expression Recognition with Patch-Convolutional Vision Transformer for Stroke Patients. Brain Sci. 2022, 12, 1626. https://doi.org/10.3390/brainsci12121626
Fan Y, Wang H, Zhu X, Cao X, Yi C, Chen Y, Jia J, Lu X. FER-PCVT: Facial Expression Recognition with Patch-Convolutional Vision Transformer for Stroke Patients. Brain Sciences. 2022; 12(12):1626. https://doi.org/10.3390/brainsci12121626
Chicago/Turabian StyleFan, Yiming, Hewei Wang, Xiaoyu Zhu, Xiangming Cao, Chuanjian Yi, Yao Chen, Jie Jia, and Xiaofeng Lu. 2022. "FER-PCVT: Facial Expression Recognition with Patch-Convolutional Vision Transformer for Stroke Patients" Brain Sciences 12, no. 12: 1626. https://doi.org/10.3390/brainsci12121626