Article

Glioblastoma Multiforme Tumors in Women Have a Lower Expression of Fatty Acid Elongases ELOVL2, ELOVL5, ELOVL6, and ELOVL7 than in Men

1
Department of Biochemistry and Medical Chemistry, Pomeranian Medical University in Szczecin, Powstańców Wielkopolskich 72, 70-111 Szczecin, Poland
2
Department of Neurosurgery and Pediatric Neurosurgery, Pomeranian Medical University in Szczecin, Unii Lubelskiej 1, 71-252 Szczecin, Poland
3
Department of Applied Neurocognitivistics, Pomeranian Medical University in Szczecin, Unii Lubelskiej 1, 71-252 Szczecin, Poland
4
Department of Anaesthesiology and Intensive Care, Pomeranian Medical University in Szczecin, Unii Lubelskiej 1, 71-281 Szczecin, Poland
5
Institute of Physical Culture Sciences, University of Szczecin, Piastów 40b/6, 71-065 Szczecin, Poland
6
Department of Physiology in Health Sciences, Pomeranian Medical University in Szczecin, Żołnierska 54, 70-210 Szczecin, Poland
*
Author to whom correspondence should be addressed.
Brain Sci. 2022, 12(10), 1356; https://doi.org/10.3390/brainsci12101356
Submission received: 23 August 2022 / Revised: 24 September 2022 / Accepted: 3 October 2022 / Published: 6 October 2022
(This article belongs to the Section Neuropharmacology and Neuropathology)

Abstract

:
One line of research on the possible ways of inhibiting the growth of glioblastoma multiforme (GBM), a brain tumor with a very poor prognosis, is the analysis of its metabolism, such as fatty acid synthesis by desaturases and elongases. This study examines the expression of elongases ELOVL1, ELOVL2, ELOVL3, ELOVL4, ELOVL5, ELOVL6, and ELOVL7 in GBM tumor samples from 28 patients (16 men and 12 women), using a quantitative real-time polymerase chain reaction (qRT-PCR). To demonstrate the influence of the tumor microenvironment on the tested elongases, U-87 MG cells were cultured in nutrient-deficient conditions and with cobalt chloride (CoCl2) as a hypoxia-mimetic agent. The results showed that the expression of ELOVL1 and ELOVL7 in the GBM tumor was lower than in the peritumoral area. The expression of six of the seven studied elongases differed between the sexes. Hypoxia increased the expression of ELOVL5 and ELOVL6 and decreased the expression of ELOVL1, ELOVL3, ELOVL4, and ELOVL7 in U-87 MG cells. These results indicate that the synthesis of fatty acids, especially polyunsaturated fatty acids (PUFA), in GBM tumors may be higher in men than in women. In contrast, the synthesis of saturated fatty acids (SFA) may be higher in women than in men.

Graphical Abstract

1. Introduction

Glioblastoma multiforme (GBM) is a grade IV glioma [1], with an estimated incidence of 3–5 cases per 100,000 people; it is 1.2 to 2.6 times more common in men than in women [2]. Current therapy for this cancer consists of surgical intervention, with radiotherapy in combination with chemotherapy [3,4]. A current therapeutic approach to GBM treatment based on the use of a DNA alkylating agent (temozolomide) is inadequate and highly ineffective, as shown by the very poor prognosis for newly diagnosed patients, giving an average survival time of only 10 months [5], with only about 5% of patients surviving more than 5 years after diagnosis [6].
One direction of research on finding an effective treatment for GBM is to gain a thorough understanding of metabolism, such as fatty acid synthesis in GBM tumors. In human cells, de novo fatty acid synthesis occurs with saturated fatty acids (SFA) and monounsaturated fatty acids (MUFA) [7]. The first stage mainly involves the synthesis of palmitic acid C16:0 by fatty acid synthase (FAS) and acetyl-CoA carboxylase (ACC) [7,8]. Subsequently, palmitic acid C16:0 becomes the substrate for the production of other SFAs and MUFAs. In contrast, the synthesis of major polyunsaturated fatty acids (PUFAs) in humans does not occur de novo. The precursors for n-3 and n-6 PUFAs are linolenic acid (ALA) 18:3n-3 and linoleic acid (LA) 18:2n-6, respectively. The conversion of fatty acids to other fatty acids depends on desaturases and elongases [7,9]. Desaturases form a double bond and elongases lengthen the chain by two carbons. The elongation of a hydrocarbon chain by two carbons in a fatty acid follows four reactions: condensation, reduction, dehydration, and reduction. The first of these, condensation, is catalyzed by elongases and represents the rate-controlling step of fatty acid elongation by two carbons [7,9]. Mammals have 7 elongases—elongation of long-chain fatty acid family members 1–7—(Elovl)1–7. Elovl6 is responsible for the synthesis of stearic acid C18:0 from palmitic acid C16:0, and the second synthesis reaction of cis-vaccenic acid C18:1n-7 from palmitoleic acid C16:1n-7 [10,11,12]. Elovl1, Elovl3, and Elovl7 are responsible for further elongation of the hydrocarbon chain into stearic acid C18:0 [7,9,13,14]. Elovl2 and Elovl5 are responsible for PUFA biosynthesis [15,16]. Elovl2, but not Elovl5, is responsible for the biosynthesis of DHA C22:6n-3 and other very long-chain PUFAs in the last steps of this fatty acid synthesis. Elovl5 is responsible for the elongation of MUFAs, but exhibits little activity against C16:1n-7 compared to Elovl6 [15]. Elovl4 is responsible for the synthesis of very long-chain fatty acids with lengths greater than 26 carbons [17,18].
In a previous study, we analyzed changes in the expression of fatty acid desaturases in GBM and found a reduction in the expression of SCD and FADS2 in GBM tumors, with no differences in the expression of fatty acid desaturases between women and men [19]. In order to have a thorough understanding of the fatty acid synthesis pathways in GBM, it is necessary to study the expression of elongases, especially in relation to the gender of the GBM tumor patients—men have a worse prognosis and lower survival rate than women [20,21]. Therefore, the aim of this study was to analyze the expression of elongases involved in fatty acid biosynthesis.

2. Materials and Methods

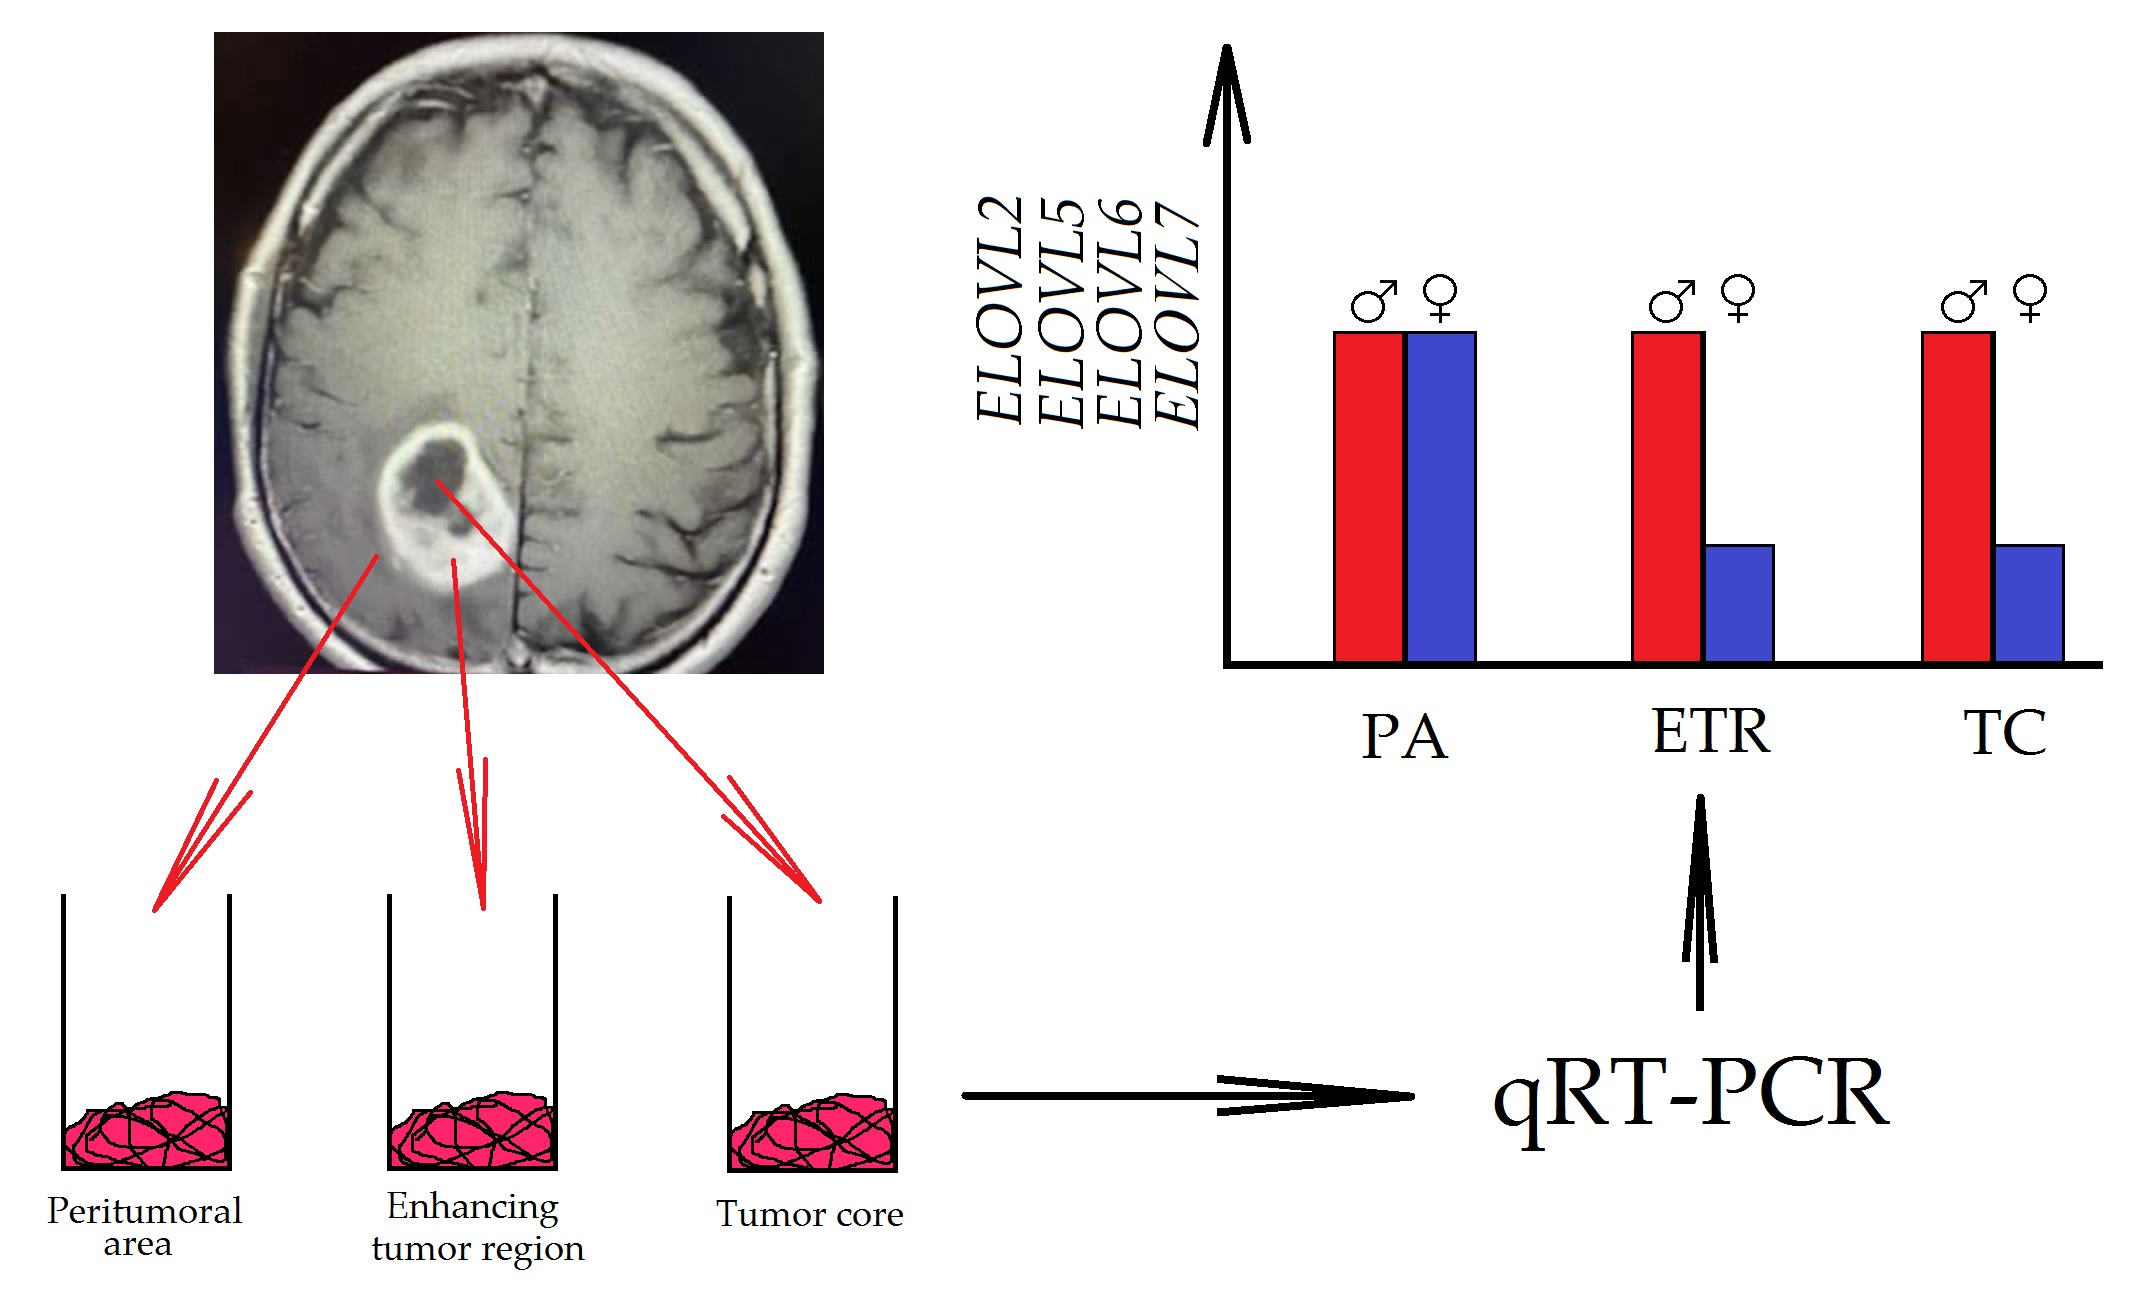
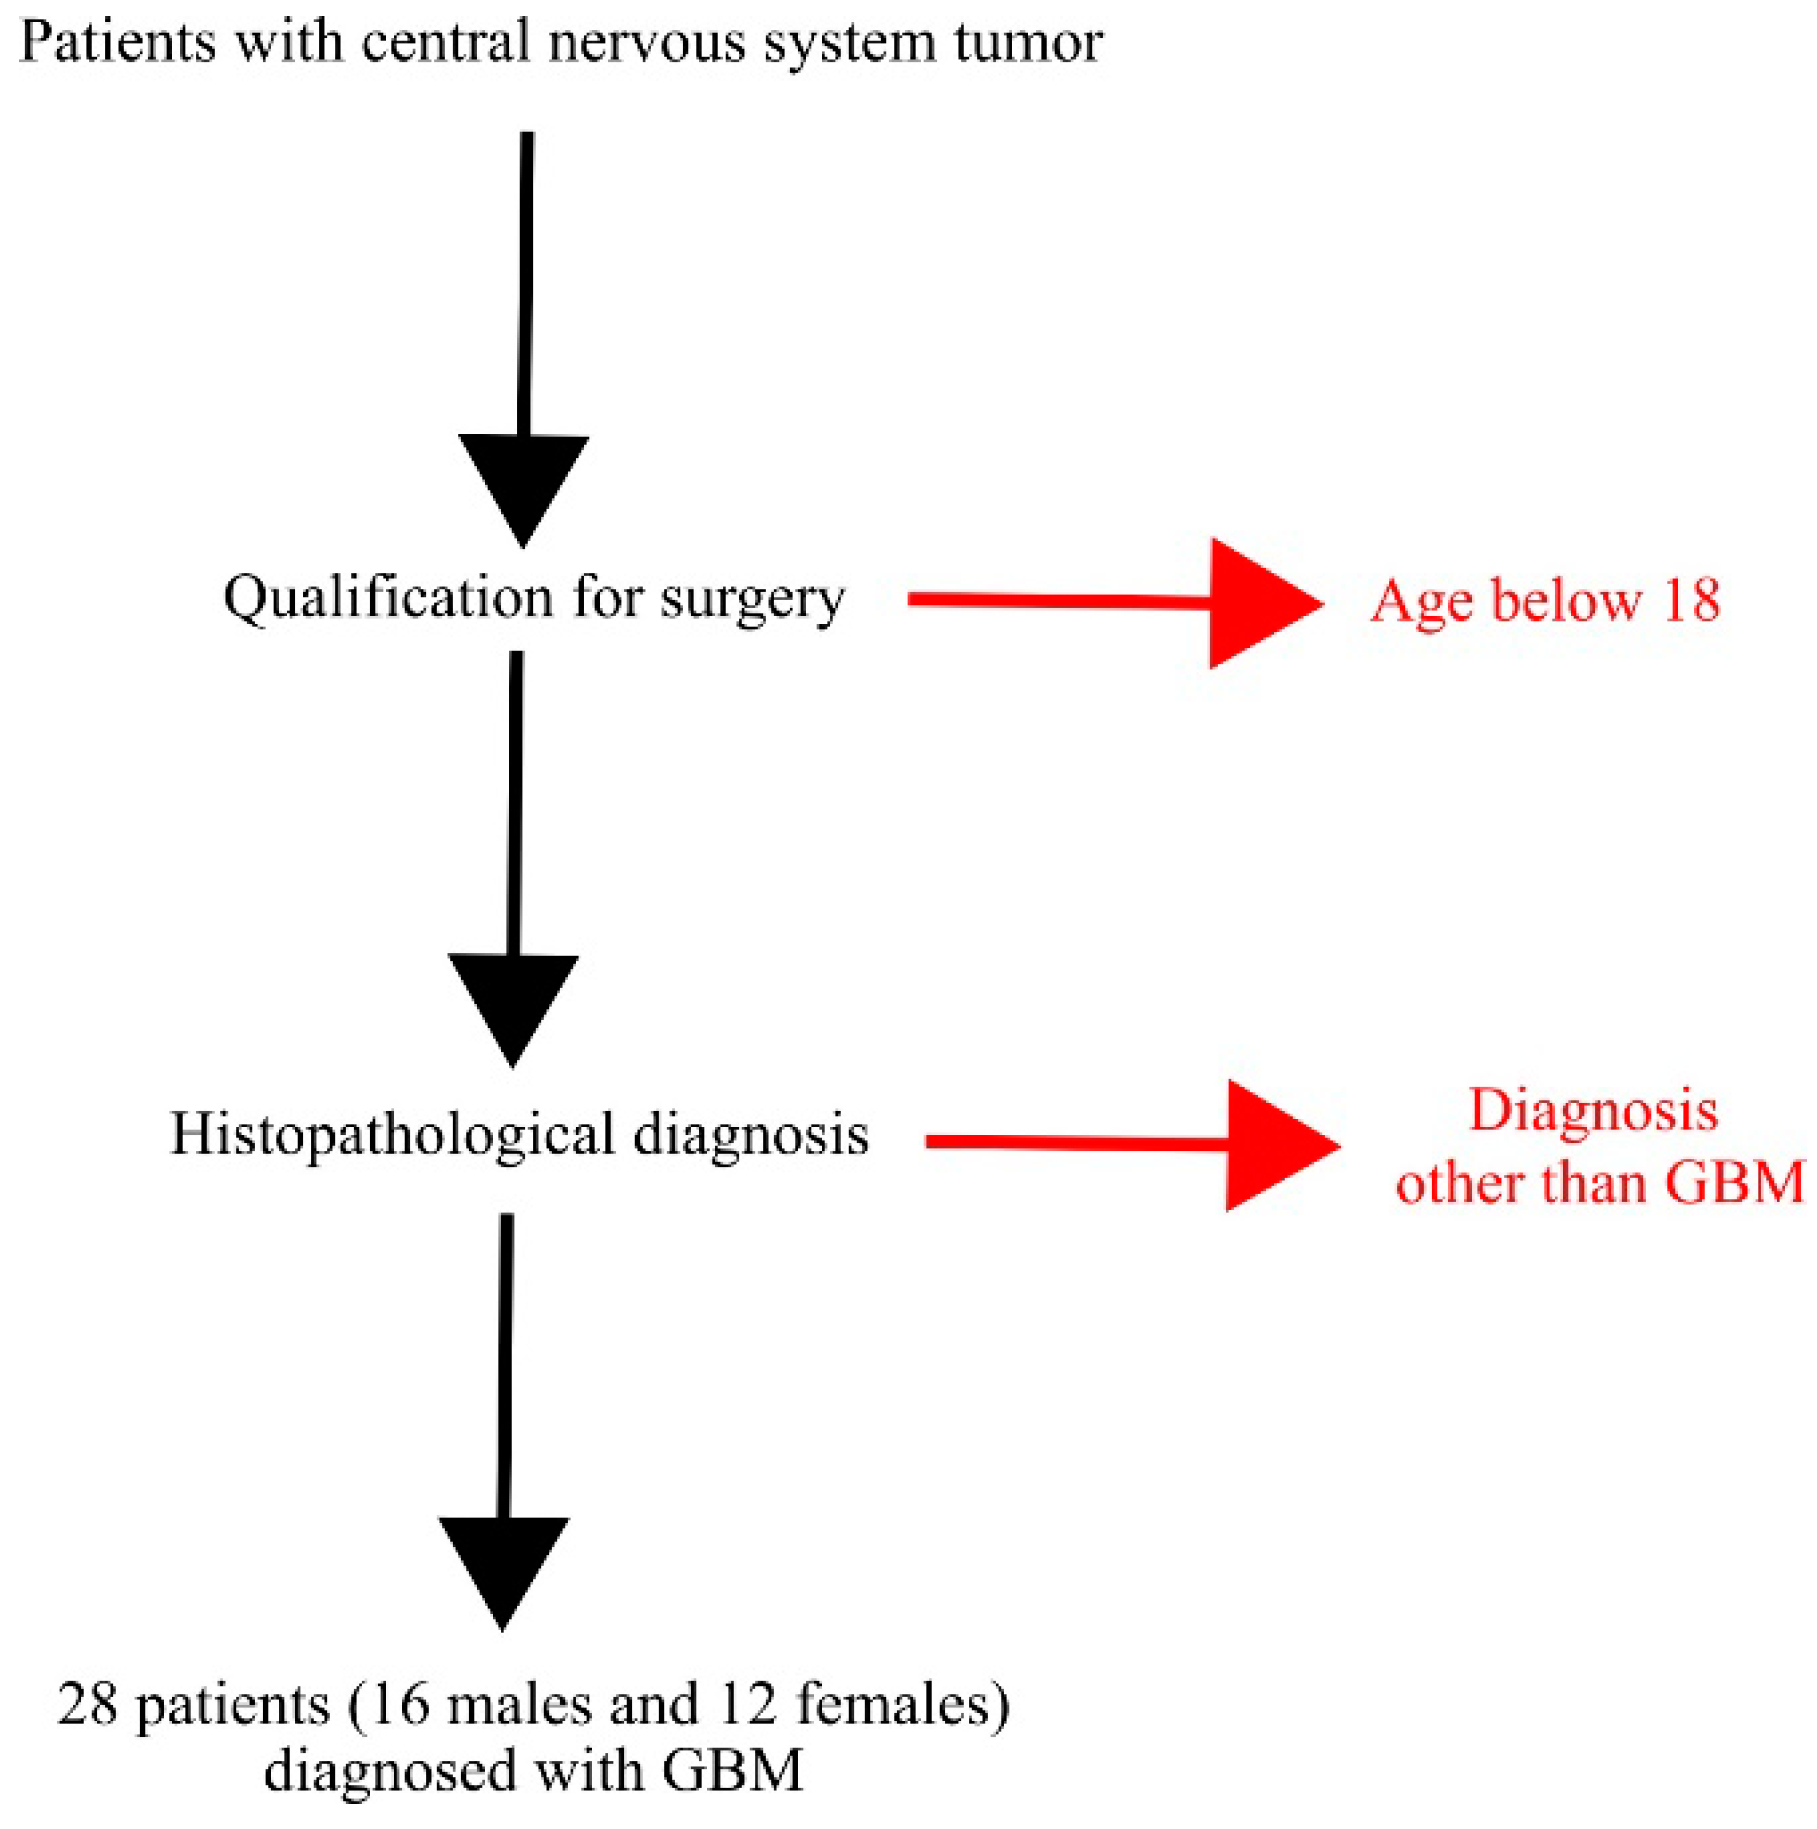
2.1. Patient Samples

The tumor samples used in this study were obtained in 2014 by the Department of Biochemistry and the Department of Neurosurgery and Pediatric Neurosurgery of the Pomeranian Medical University in Szczecin in a project that addressed purinergic receptors in GBM progression. This project was accepted by the local bioethical commission (KB-0012/96/14), and the study was conducted in accordance with the Declaration of Helsinki.
Tumor samples were collected from 28 adult patients (16 men and 12 women) with GBM tumors during surgery at the Department of Neurosurgery and Pediatric Neurosurgery of the Pomeranian Medical University in Szczecin, Poland (Table 1 and Figure 1). Patients were initially diagnosed with brain tumors using magnetic resonance imaging (MRI) or computed tomography (CT). Each patient had then been recommended for neurosurgery following the radiological diagnosis. During the brain tumor removal, surgery patients underwent standard general anesthesia with endotracheal intubation. During the neuronavigation procedure, craniotomy and tumor resections were performed according to the classical method (bone removal and dura incision, tumor visualization, resection, biopsy for histopathological and molecular examination, closure of the dura, bone restoration in some patients, subcutaneous tissue and skin closure in some patients). During surgery, the results of the 1.5 Tesla (T) and 3T MRI were fed into the computer station of a neuronavigation device to estimate the position of the surgical instruments in relation to the GBM tumor with the help of a video camera recording the surgical movement (precision of 2–3 mm). During surgery, a biopsy was performed for a histopathological examination to confirm the brain tumor was grade IV, as defined by the WHO [1].
Clinical radiological morphology made it possible to distinguish three tumor zones commonly used in the literature and clinical practice (Figure 2) [22,23]:
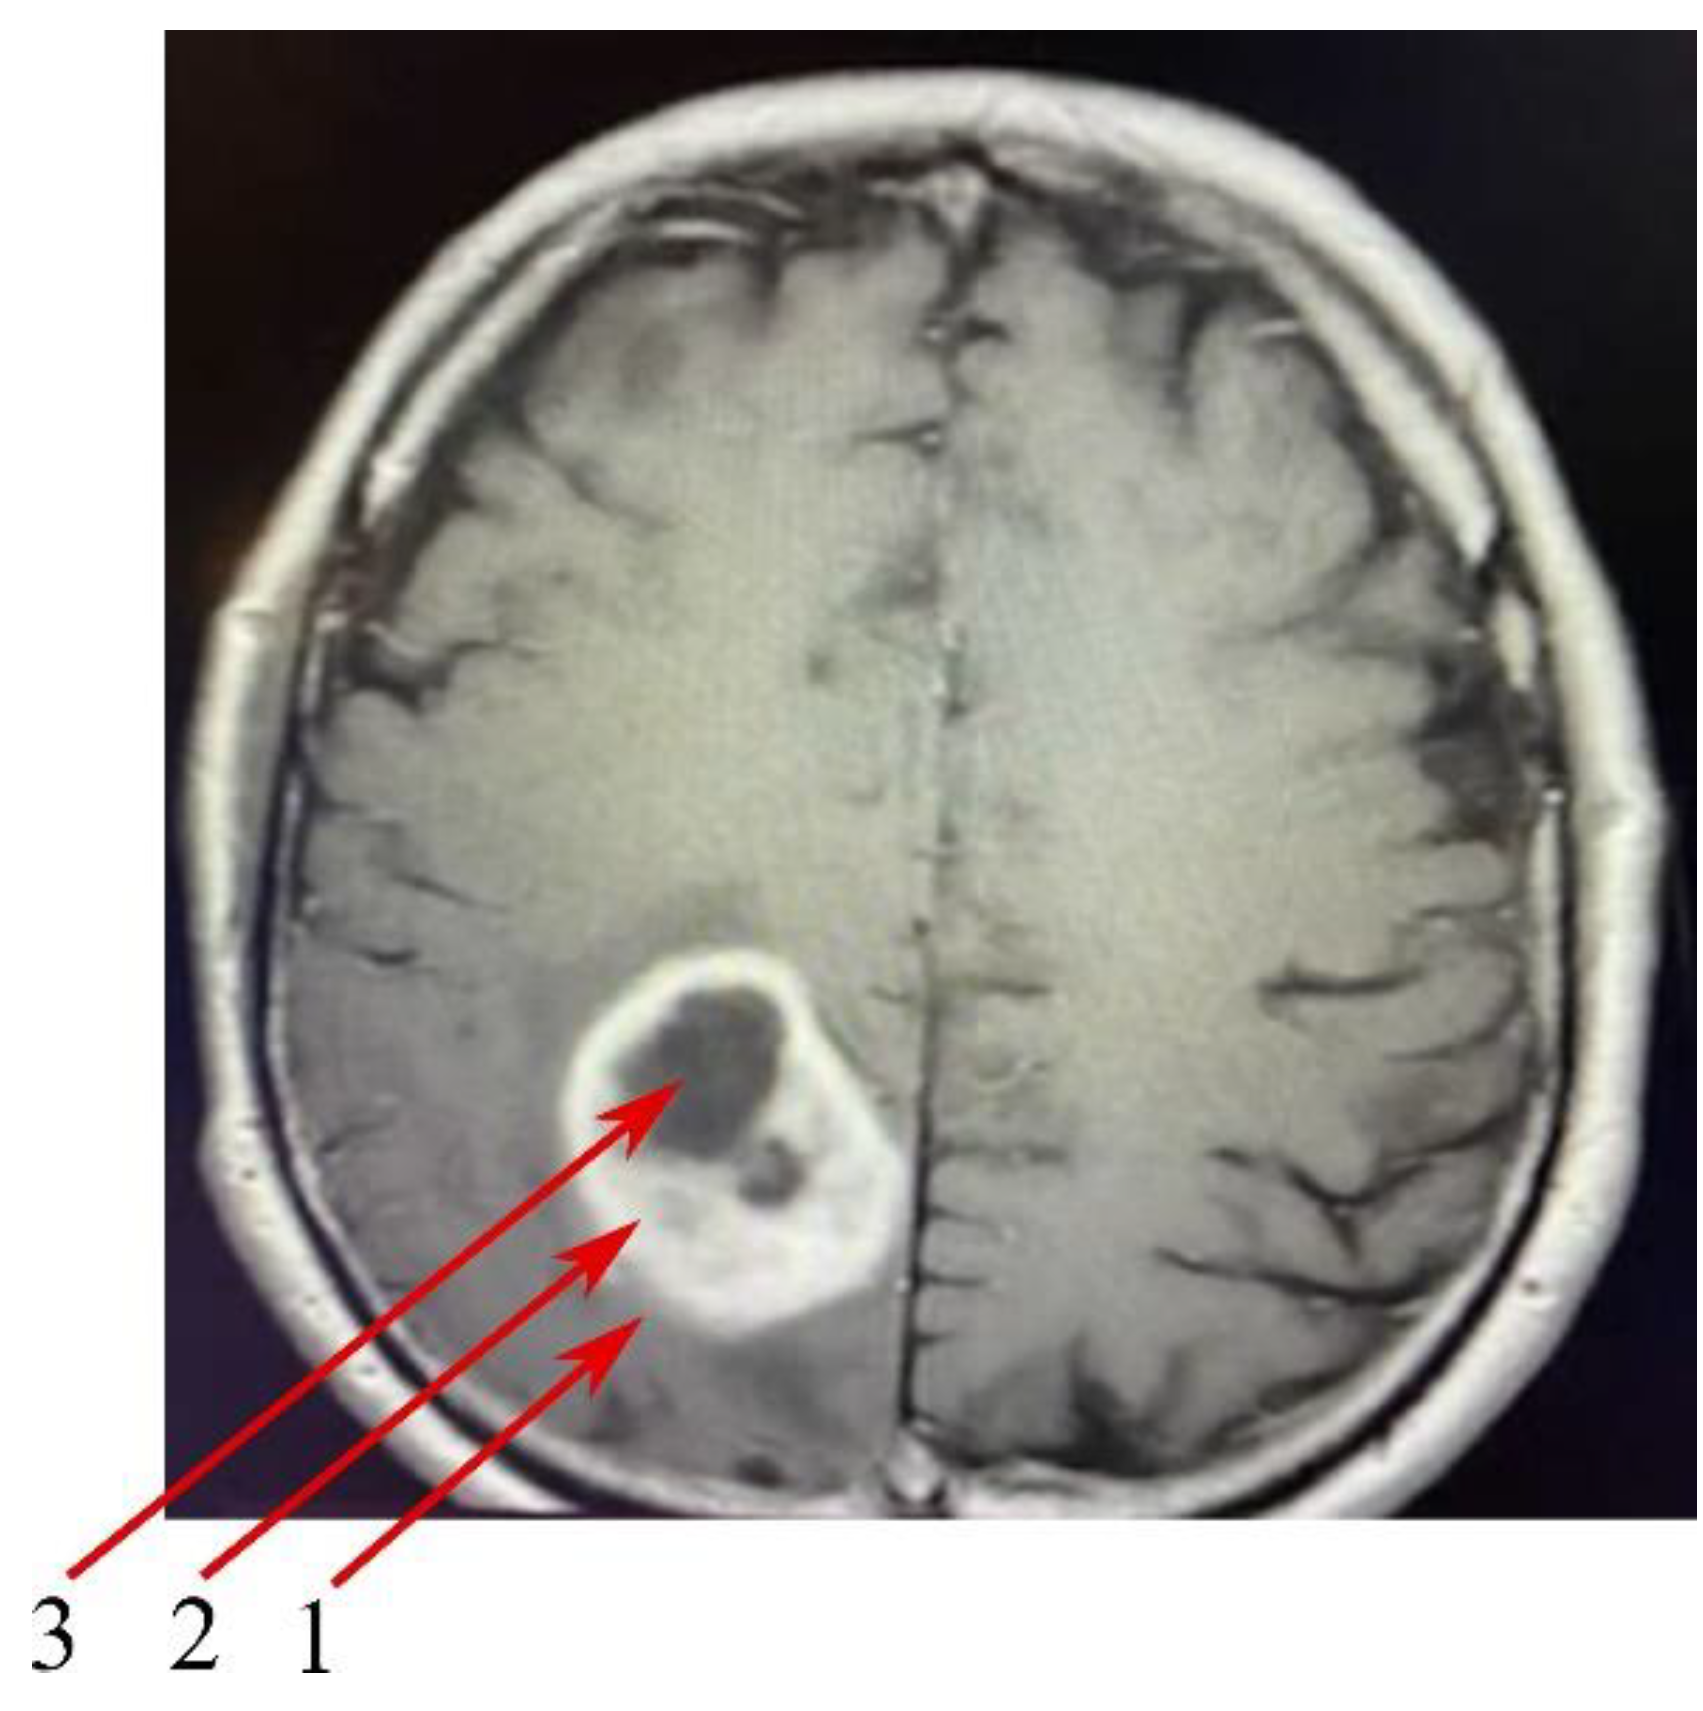
  • The peritumoral area, a buffer zone between the GBM tumor and healthy tissue, with individual foci of infiltration. The peritumoral area is considered an appropriate control for the study of GBM tumors [24]. For this reason, the results obtained from GBM tumor studies were assimilated into the peritumoral area.
  • The non-enhancing tumor core. This area of GBM is usually located in the central part of the GBM tumor,
  • The enhancing tumor region, surrounding the tumor core.

2.2. Cell Cultures and Treatment

U-87 MG cells from the European Collection of Authenticated Cell Cultures (ECACC) were used for in vitro experiments. These cells were cultured in Eagle’s minimum essential medium (EMEM) (Sigma-Aldrich, Poznań, Poland) supplemented with 10% (v/v) heat-inactivated fetal bovine serum (FBS) (Gibco Limited, Poznań, Poland), 2 mM L-glutamine, 1 mM sodium pyruvate (Sigma-Aldrich, Poznań, Poland), 1% non-essential amino acids (Sigma-Aldrich, Poznań, Poland), and antibiotics (100 U/mL penicillin, and 100 µg/mL streptomycin (Gibco Limited, Poznań, Poland)) at 37 °C in a humidified atmosphere of 95% air and 5% CO2. Cells were lavaged twice weekly with 0.25% trypsin-ethylenediaminetetraacetic acid (EDTA) solution (Sigma-Aldrich, Poznań, Poland).
An in vitro study was performed to investigate the effect of the tumor microenvironment on the elongases studied. In some areas of the GBM tumor are structures called pseudopalisades [25]. These structures are significantly distant from blood vessels, or the blood vessels in such a structure are obstructed, leading to hypoxia and nutrient deficiency. To emulate this, U-87 MG cells would be cultured under hypoxic or nutrient-deficient conditions. First, test cells were seeded onto 6-well plates at a density of 20,000 cells/cm2. After 3 days of incubation, the medium was changed and the U-87 MG cells were divided and cultured under two different conditions for 24 h: control (standard culture medium), or hypoxic or nutrient-deficient. The control cells were incubated on a standard culture medium. To mimic hypoxic conditions, 200 mM of cobalt chloride (CoCl2) (Sigma-Aldrich, Poznań, Poland) was used. This is a commonly used hypoxia-mimetic agent [26]. To produce nutrient deficiency, U-87 MG cells were incubated with a low concentration of L-glutamine (0.2 mM) and without sodium pyruvate (volume supplemented with PBS), leaving 1.0 g/L (5.5 mM) of glucose in the medium. These conditions have been described by us and applied in a previous work in which we studied the expression of fatty acid desaturases in GBM [19]. After 24 h of incubation under those conditions, the U-87 MG cells were trypsinized, and the resulting cell pellet was washed with PBS solution and centrifuged again (25 °C, 300 G, 5 min). The cell pellet was used for RNA analysis.

2.3. Quantitative Real-Time Polymerase Chain Reaction (qRT-PCR)

Analysis of the elongase expression from patient material and U-87 MG cells was performed using two-step reverse transcription PCR (RT-PCR). First, RNA extraction was performed from the patient material using RNeasy Lipid Tissue Mini Kit (Qiagen, Hilden, Germany), and from the cellular material using RNeasy Mini Kit (Qiagen). Then, cDNA was produced using a First Strand cDNA synthesis kit and oligo-dT primers (Fermentas, Waltham, MA, USA). Analysis of selected mRNAs was performed using an ABI 7500 Fast instrument with Power SYBR Green PCR Master Mix reagent (Applied Biosystems, Waltham, MA, USA). Real-time conditions were as follows: 95 °C for 15 s, 40 cycles at 95 °C for 15 s, and 60 °C for 1 min. Ct values were used for further analysis. The quantity of the test transcript was normalized to an endogenous control, namely, glyceraldehyde-3-phosphate dehydrogenase (GAPDH) gene, was calculated as the fold difference (2^dCt), and further processed using statistical analysis. Data were presented as tumor tissue absolute expression. GAPDH is considered the reference gene for GBM studies [27]. The following primer pairs were used:
  • for GAPDH, (5′-TCATGGGTGTGAACCATGAGAA-3′ and 5′-GGCATGGACTGTGGTCATGAG-3′);
  • for ELOVL1, (5′-TTATTCTCCGAAAGAAAGACGGG-3′ and 5′-ATGACATGCACGGAAGAGTTTAT-3′)
  • for ELOVL2, (5′-ATGTTTGGACCGCGAGATTCT-3′ and 5′-CCCAGCCATATTGAGAGCAGATA-3′);
  • for ELOVL3, (5′-CTGTTCCAGCCCTATAACTTCG-3′ and 5′-GAATGAGGTTGCCCAATACTCC-3′);
  • for ELOVL4, (5′-GAGCCGGGTAGTGTCCTAAAC-3′ and 5′-CACACGCTTATCTGCGATGG-3′);
  • for ELOVL5, (5′-TAACAGGAGTATGGGAAGGCA-3′ and 5′-ACCAGAGGACACGGATAATCTT-3′);
  • for ELOVL6, (5′-AACGAGCAAAGTTTGAACTGAGG-3′ and 5′-TCGAAGAGCACCGAATATACTGA-3′);
  • for ELOVL7, (5′-GCCTTCAGTGATCTTACATCGAG-3′ and 5′-AGGACATGAGGAGCCAATCTT-3′).

2.4. Statistical Methods

The expression levels of the elongases tested in this paper are reported in relation to the reference gene, GAPDH, as an average of all the results obtained for a given group. All statistical analyses were performed using Statistica software (version 13, StatSoft Polska, Kraków, Poland). Values of p ≤ 0.05 will be considered statistically significant. A Shapiro–Wilk test was performed and showed that the results did not have a normal distribution, so non-parametric tests were used for statistical analyses: Wilcoxon signed-rank tests for comparisons between tumor zones and between culture conditions of the U-87 MG cells; Mann–Whitney U-tests for comparisons between groups of patients; Spearman rank correlation coefficients for the analysis of correlations between the gene expression in each of the three zones, and between gene expressions and the data given by the patients in the questionnaire.
The study with 28 patients (16 men and 12 women) had sufficient statistical power to detect with 80% probability the following real effect sizes for the analyzed quantitative variables: difference between tumor zones or culture conditions (paired measurements) corresponding to 0.55 standard deviations of the difference between paired measurements for the analyzed parameter; difference between males and females (independent groups) corresponding to 1.2 standard deviations of the analyzed parameter; correlation between analyzed parameters corresponding to the value of correlation coefficient equal to ±0.50.

3. Results

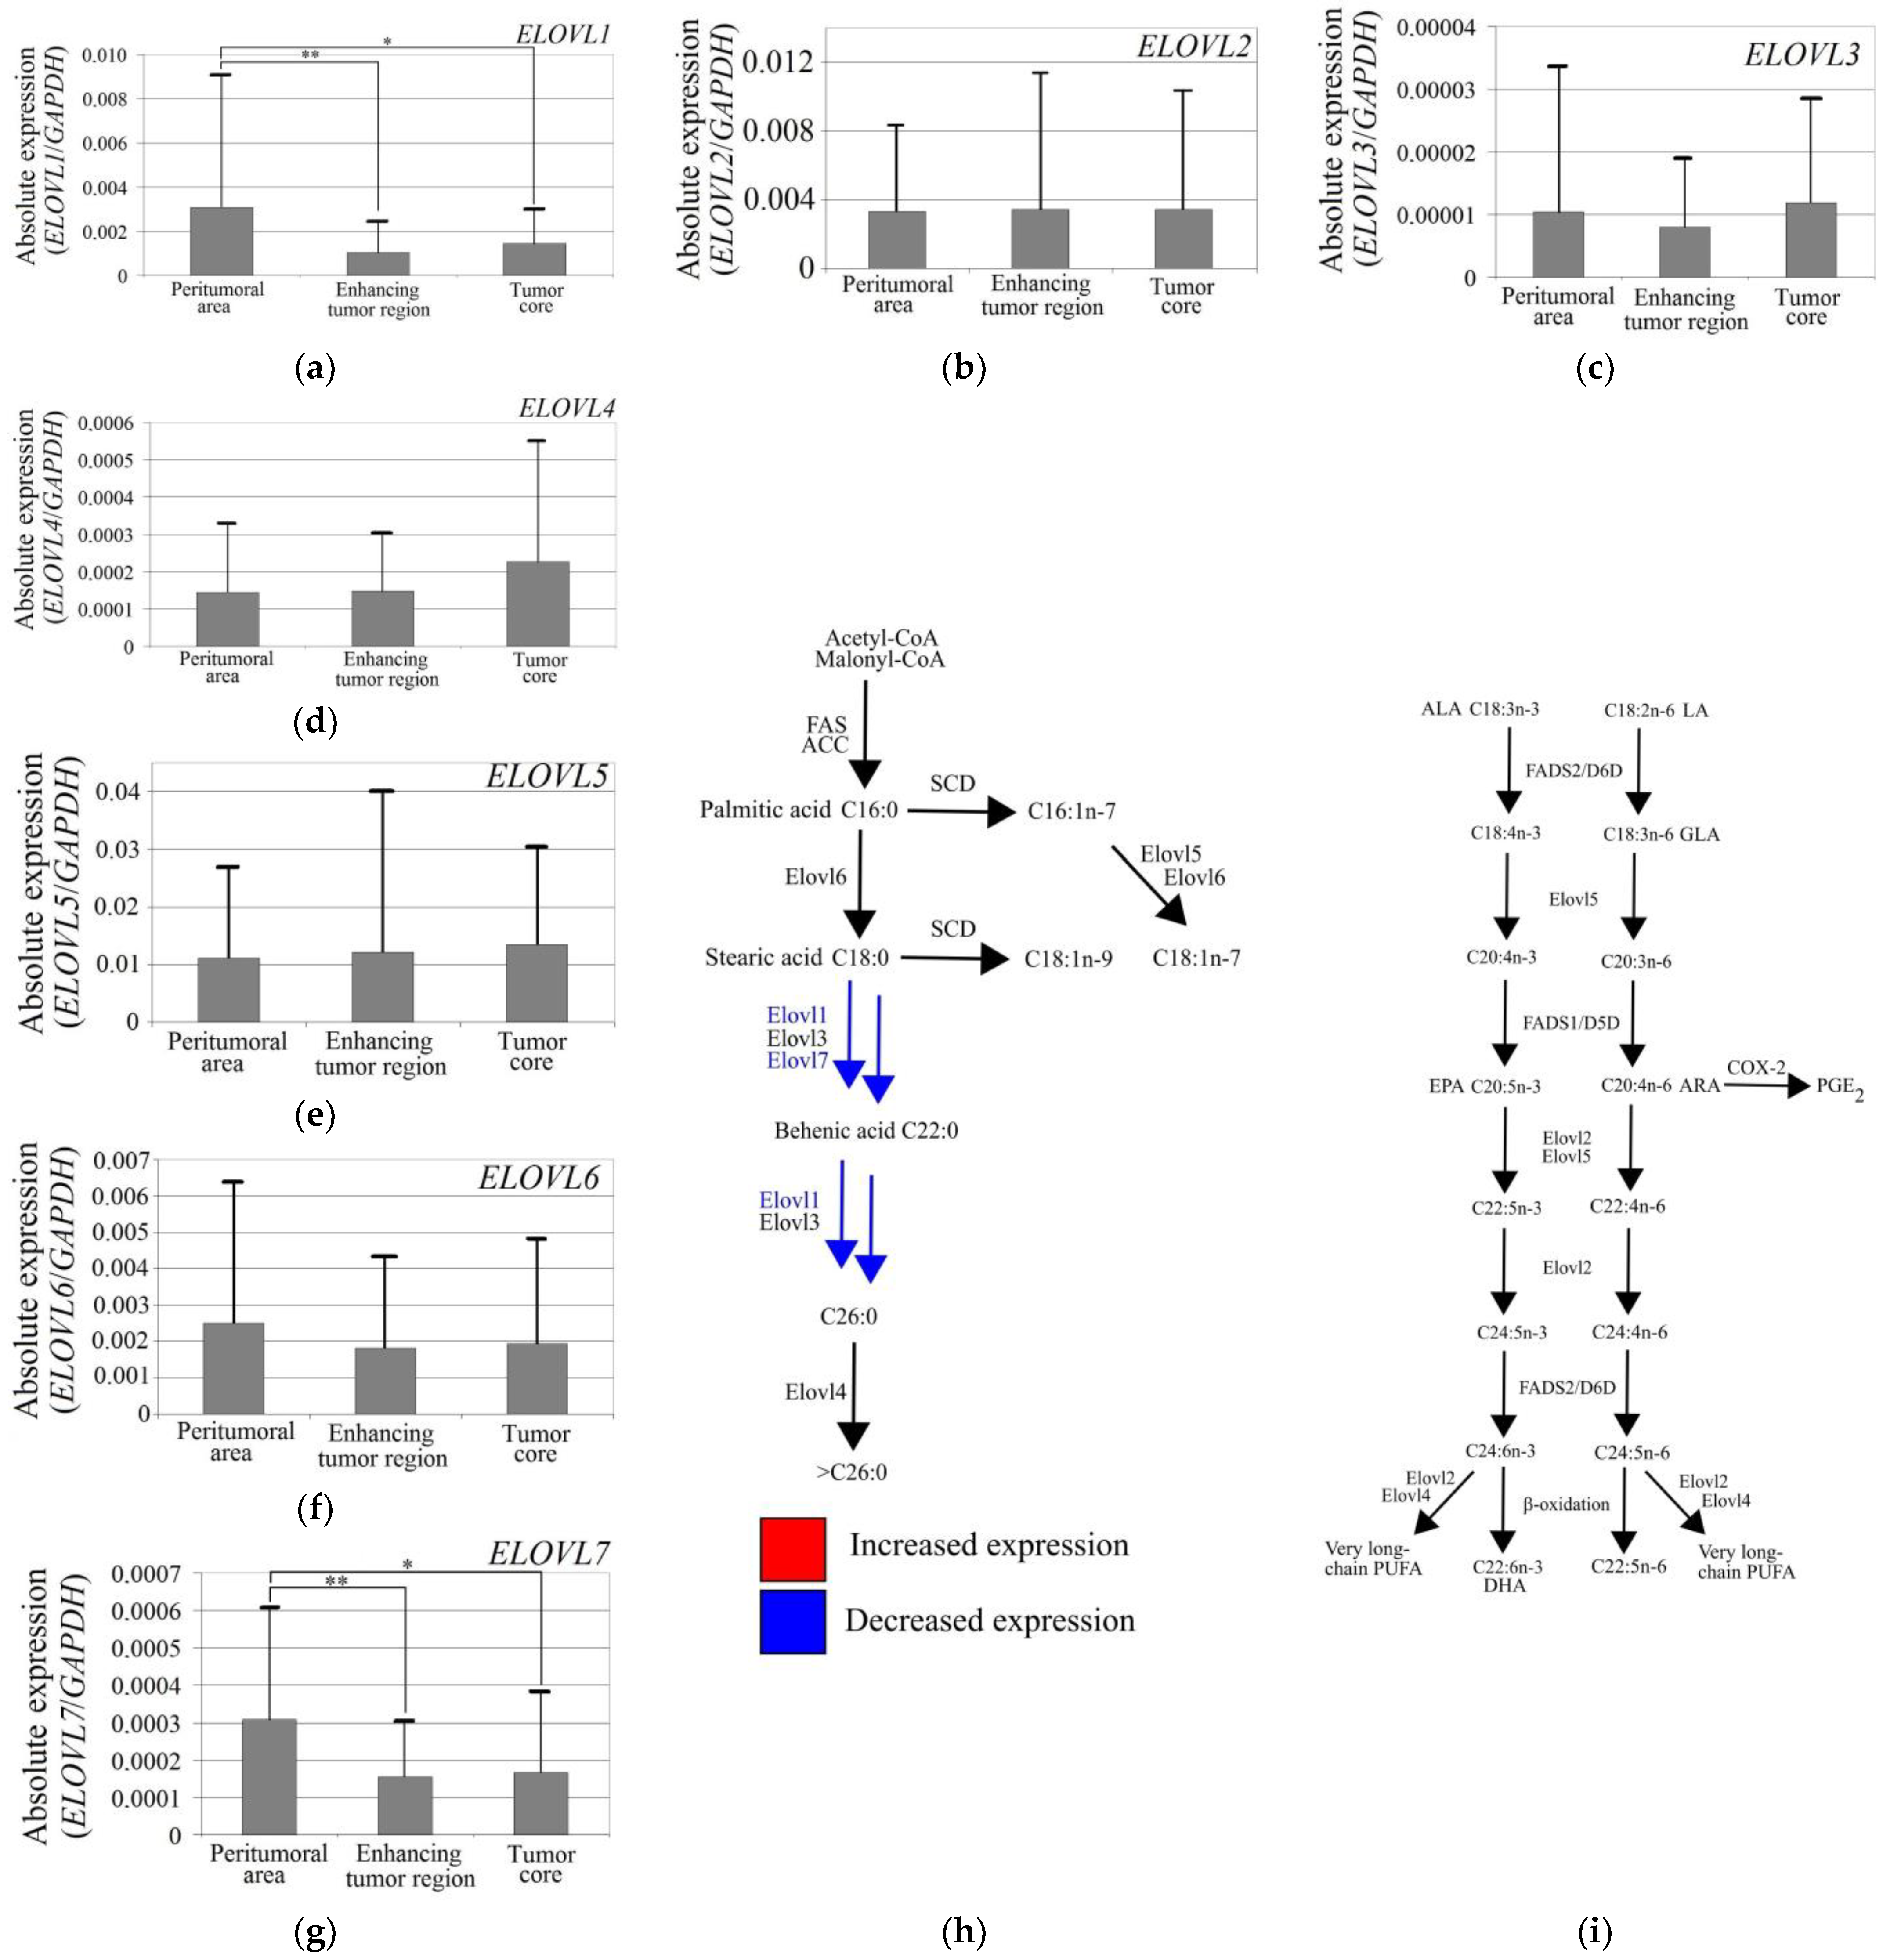
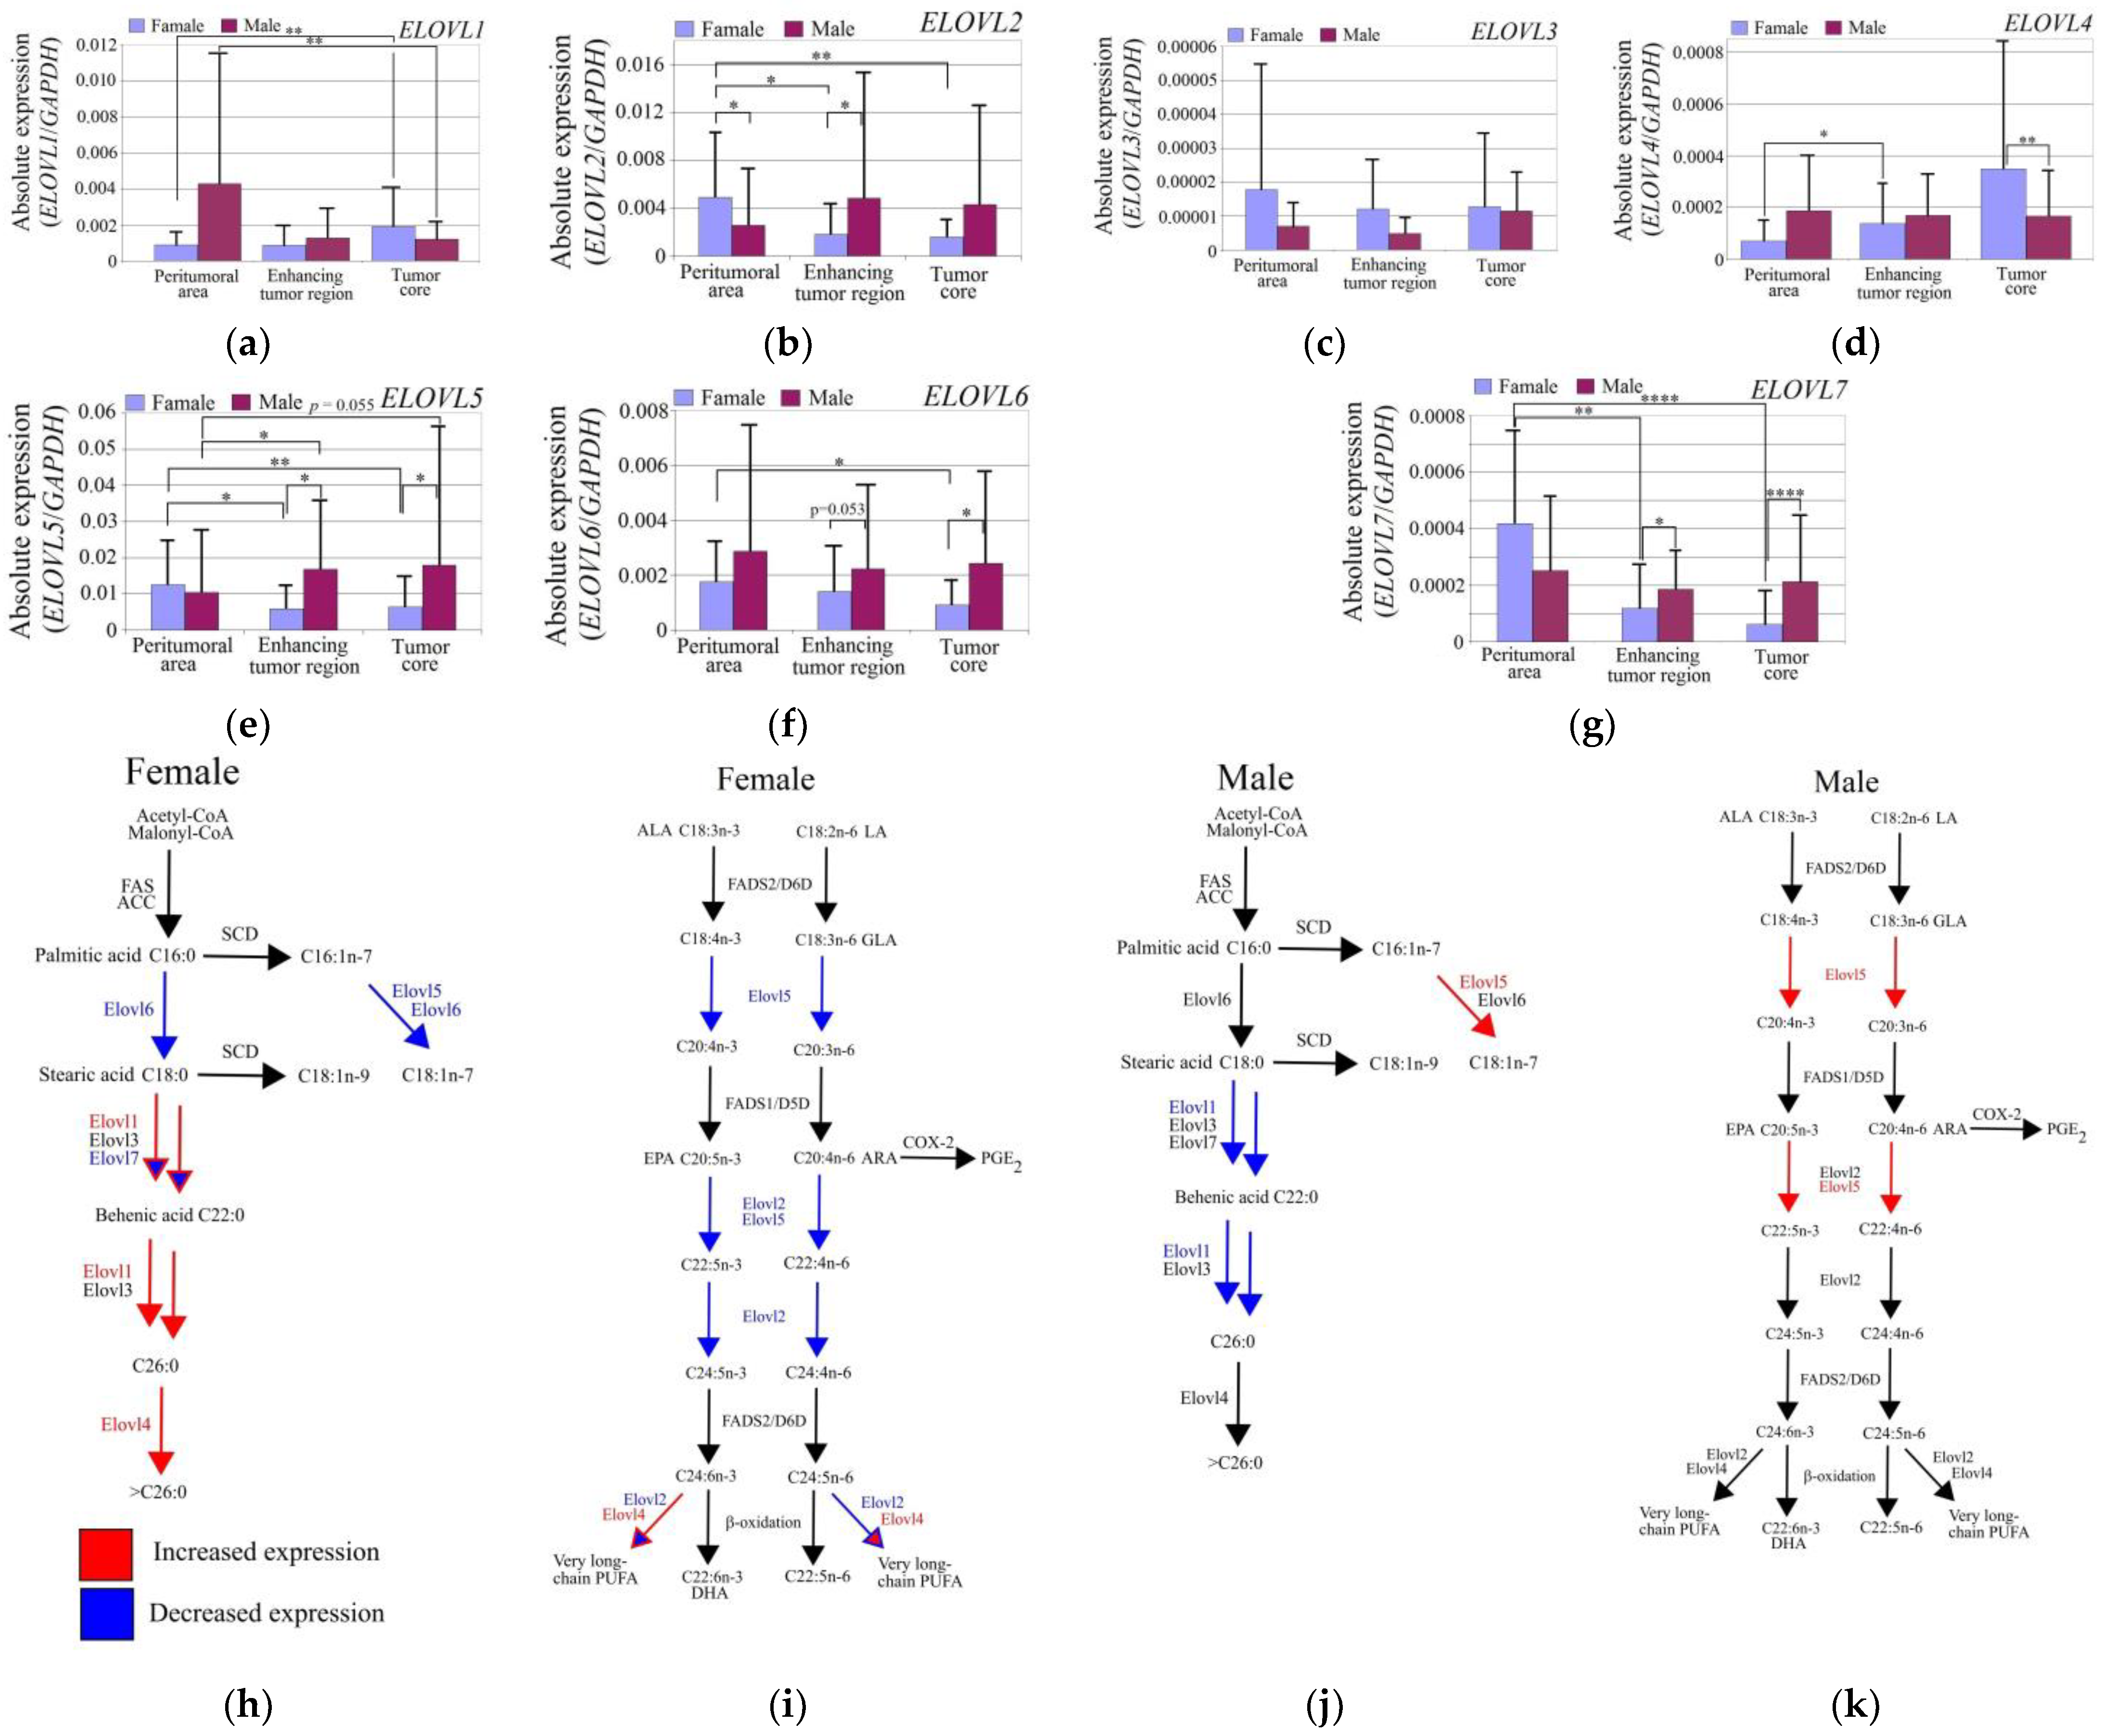
3.1. ELOVL1 and ELOVL7 Expression Was Lower in the GBM Tumor Than in the Peritumoral Area

Analysis of elongase expression showed that ELOVL1 and ELOVL7 expressions were lower in the GBM tumor than in the peritumoral area (Figure 3). In the tumor core, the expression of ELOVL1 (p = 0.04) and ELOVL7 (p = 0.013) was lower than in the peritumoral area. The same results were obtained when analyzing the enhancing tumor region where ELOVL1 (p = 0.0013) and ELOVL7 (p = 0.004) expressions were lower than in the peritumoral area.

3.2. Expression of Elongases in GBM Tumors Differed between Genders

The ELOVL1 expression in the tumor core relative to the peritumoral area was greater in the women (p = 0.0016) and lower in the men (p = 0.0016) (Figure 4).
The ELOVL2 expression was significantly higher in the peritumoral area in women compared to the men (p = 0.013). In contrast, the ELOVL2 expression in the women was lower in GBM tumors (enhancing tumor region—p = 0.02; tumor core—p = 0.004) than in the peritumoral area. In the enhancing tumor region, the expression of ELOVL2 in the women was lower than in the peritumoral area (p = 0.04). In the men, the expression level of ELOVL2 was the same in all the examined regions of the GBM tumor.
The ELOVL3 expression was not different in the GBM tumor core relative to the peritumoral area in both the women and men (p > 0.05).
The ELOVL4 expression was elevated in the GBM tumor in the women. In the enhancing tumor region relative to the peritumoral area, the ELOVL4 expression was significantly higher (p = 0.02).
The ELOVL5 expression in the peritumoral area did not differ between genders. In the tumor, there was decreased expression of ELOVL5 in the women compared to the peritumoral area (enhancing tumor region—p = 0.015; tumor core—p = 0.005), and an increased expression of ELOVL5 in the men (enhancing tumor region—p = 0.03; tumor core—p = 0.055). In the enhancing tumor region and tumor core, the ELOVL5 expression in the women was lower than in the men (enhancing tumor region—p = 0.02; tumor core—p = 0.04).
The ELOVL6 expression in the peritumoral area did not differ between the genders. The expression of ELOVL6 in the women was lower (p = 0.03) in the tumor core than in the peritumoral area, and was lower than in the men (p = 0.04).
The ELOVL7 expression was lower in the GBM tumor in women. In the enhancing tumor region (p = 0.004) and tumor core (p = 0.00007), the expression of ELOVL7 was lower than in the peritumoral area.

3.3. Expression of Elongases in the GBM Tumors Correlated with Each Other

To a large extent, the expression of elongases positively correlated with each other in the enhancing tumor region and tumor core (Table 2). The expression of ELOVL7 was with ELOVL6, ELOVL7 with ELOVL5, ELOVL7 with ELOVL4, ELOVL6 with ELOVL5, ELOVL6 with ELOVL4, ELOVL6 with ELOVL2, ELOVL5 with ELOVL4, ELOVL5 with ELOVL4, ELOVL5 with ELOVL2, and ELOVL4 with ELOVL2. The ELOVL1 expression was weakly correlated with the other elongases, as was the ELOVL3 expression, which positively correlated with the other elongases. The expression of individual elongases between the different GBM tumor areas studied was weakly correlated. The ELOVL4 expression in the peritumoral area was positively correlated with the tumor core. Additionally, the expression of ELOVL7 in the peritumoral area was negatively correlated with the expression of this elongase in the enhancing tumor region. In contrast, the positive correlation of the expression of the elongases in question between the enhancing tumor region with the tumor core sometimes occurs. The ELOVL2 expression in the tumor core was positively correlated with the ELOVL1 expression from the enhancing tumor region. Additionally, the ELOVL3 expression in the tumor core was positively correlated with the ELOVL5 expression from the enhancing tumor region and negatively correlated with the ELOVL2 expression from the enhancing tumor region. Additionally, the ELOVL5 expression in the tumor core was positively correlated with the ELOVL6 expression in the enhancing tumor region.
There was a positive correlation between ELOVL4, ELOVL5, ELOVL6, and ELOVL7 expressions in the GBM tumor (Table 3). The ELOVL3 expression in the same region of the GBM was not correlated with other elongases except for the ELOVL2 expression in the enhancing tumor region. Additionally, the ELOVL1 expression in the tumor core was positively correlated with ELOVL4, ELOVL5, ELOVL6, and ELOVL7 expressions. Within the GBM tumor, there was a positive correlation of expression of only ELOVL2 in the tumor core with the enhancing tumor region. There was a positive correlation in elongase expression between the enhancing tumor region and the tumor core in only two cases. There was a negative correlation in the ELOVL2 expression in the enhancing tumor region with the ELOVL3 expression in the tumor core. Additionally, there was a positive correlation in the ELOVL2 expression in the tumor core with the ELOVL6 expression in the enhancing tumor region.
In the GBM tumors in the women, there was a positive correlation in the expression of ELOVL7 with ELOVL5, ELOVL7 with ELOVL4, ELOVL6 with ELOVL5, ELOVL6 with ELOVL3, ELOVL6 with ELOVL2, ELOVL5 with ELOVL4, and ELOVL5 with ELOVL2 (Table 4). There was also a positive correlation of ELOVL2 with ELOVL3, ELOVL4, ELOVL5, ELOVL6, and ELOVL7. The expression of the same elongase was rarely correlated between the tumor core and the enhancing tumor regions. The ELOVL3 expression in the tumor core was negatively correlated with ELOVL5 and ELOVL6 expressions in the enhancing tumor region.

3.4. The Expression of Elongases in the GBM Tumors Correlated with BMI and Cigarette Pack-Years in the Men, and Correlated with Age and Body Weight in the Women

In the tumor core, the expression of ELOVL3 had a negative correlation with body weight and BMI, while in the peritumoral area, there was a negative correlation between the ELOVL2 expression and height and a negative correlation between the ELOVL4 expression and cigarette pack-years (Table 5). In contrast, in the enhancing tumor region, the ELOVL2 expression positively correlated with the number of cigarette packs smoked per year, the ELOVL4 expression positively correlated with height, the ELOVL7 expression negatively correlated with age, and the ELOVL5 expression positively correlated with body weight and BMI.
In the men, the expression of the elongases positively correlated with BMI (Table 4)—in particular, the ELOVL2 expression in the peritumoral area and tumor core, and ELOVL5 and ELOVL6 expressions in the enhancing tumor region. There was a negative correlation between the ELOVL3 expression in the tumor core and BMI. Additionally, in the men, there was a positive correlation between the ELOVL2 expression in the enhancing tumor region and the number of cigarette packs smoked per year, and a negative correlation between ELOVL1, ELOVL4 and ELOVL7 expressions in the tumor core and the number of cigarette packs smoked per year. There was a positive correlation of the ELOVL7 expression in the peritumoral area with body weight.
In the women, there was a negative correlation between ELOVL5 and ELOVL6 expressions in the GBM tumor and BMI. Additionally, the expression of ELOVL2 and ELOVL5 in the enhancing tumor region negatively correlated with age in the women. The expression of ELOVL7 in the enhancing tumor region was negatively correlated with cigarette packs smoked per year. In the tumor core, the expression of ELOVL1 was positively correlated with cigarette packs smoked per year and negatively correlated with age, body weight, and BMI.

3.5. Expression of ELOVL5 and ELOVL6 Increased under the Influence of Hypoxia, and the Expression of ELOVL1, ELOVL3, ELOVL4, and ELOVL7 Decreased

The hypoxia-mimetic agent CoCl2 caused an increase in ELOVL5 and ELOVL6 expressions in the U-87 MG cells by approximately 35% relative to the controls (Figure 5). This indicates that hypoxia increases the expression of ELOVL5 (p = 0.00003) and ELOVL6 (p = 0.00003) in GBM cells. Additionally, in the same model, hypoxia reduced the expression of ELOVL1 (p = 0.0026), ELOVL3 (p = 0.02), ELOVL4 (p = 0.00005), and ELOVL7 (p = 0.0002) by approximately 50%. The expression of ELOVL2 was not analyzed because it was below the detection limit in U-87 MG cells.
Nutrient-deficient conditions reduced the expression of ELOVL1 (p = 0.0018), ELOVL4 (p = 0.0018), and ELOVL7 (p = 0.010) in the U-87 MG cells. Nutrient-deficient conditions in a slight but statistically significant way decreased the expression of ELOVL5 (p = 0.04). Nutrient-deficient conditions did not significantly affect the expression of ELOVL3 or ELOVL6 (p > 0.05).

4. Discussion

4.1. Expression of Elongases in GBM Tumors

To date, only a few studies have analyzed the expression of elongases in GBM tumors, and their results vary widely. In our study, we demonstrated that the expression of ELOVL2, ELOVL3, ELOVL4, ELOVL5, and ELOVL6 was similar in the GBM tumor and in the peritumoral area, confirming the results of Seifert et al. (2015) [28]. Saurty-Seerunghen et al. (2019) showed that ELOVL2 undergoes increased expression in GBM tumors [29]. Vyazunova et al. (2014) [30] showed an increased expression of ELOVL6 in murine GBM.
We showed that ELOVL1 and ELOVL7 expressions were lower in the GBM tumor than in the peritumoral area. This is partly consistent with the results of Seifert et al. (2015) who showed that the ELOVL7 expression is lower in GBM tumors [28]. Additionally, Kaplan et al. showed that there is less behenic acid C22:0 in GBM tumors than in grade II gliomas [31]. This confirms our results that the synthesis of very-long-chain SFA in GBM tumors was reduced as a result of a decreased expression of ELOVL1 and ELOVL7. At the same time, ELOVL3 was also responsible for the synthesis of very-long-chain SFA. Nevertheless, our analysis showed that the expression of ELOVL3 was about 100 times lower than ELOVL1 and 10 times lower than ELOVL7. In some samples, ELOVL3 expression was below the detection threshold, which indicates that ELOVL1 and ELOVL7 were responsible for the synthesis of very-long-chain SFA in GBM tumors.

4.2. Gender Differences in the Expression of Elongases

Our study is the first research on gender-related differences in the expression of elongases in GBM. We showed that the expression of ELOVL2, ELOVL5, and ELOVL6 in the GBM tumor was lower in women than in men. In contrast, the expression of ELOVL1 and ELOVL4 was upregulated, and ELOVL7 was downregulated in GBM tumors in women. Our results indicate that in GBM tumors, men have higher PUFA synthesis and lower very-long-chain SFA synthesis than women. Additionally, in GBM tumors in men, the synthesis of stearic acid and oleic acid was higher than in women. The ELOVL2 expression in the peritumoral area was higher in the women than in the men. In the peritumoral area, the expression of ELOVL5 and ELOVL6 was the same for each gender. As this is the first demonstration of such correlations in a GBM tumor, it is very difficult to relate our findings to the literature data.
The gender difference in the expression of the studied elongases may indicate the possible influence of sex hormones. The regulatory mechanism of elongase genes has to date been partially understood in the liver, a key organ involved in the biosynthesis of PUFA, and are then transported to other organs, including the brain [32,33]. In hepatocytes, Elovl6 activity has been shown to be increased by estrogens [34,35] and decreased by androgens [34,36]. The ELOVL2 and ELOVL5 expressions are not altered by estrogens [33,37,38].
The estrogen-mediated regulation of MUFA and PUFA synthesis takes place by altering the expression of desaturases SCD, FADS1, and FADS2 [33,37,38,39]. As PUFA are only produced in the liver [32,33], the sex hormones can only act on the expression of enzymes involved in fatty acid synthesis in the liver, and not in the brain [33]. This may explain the lack of difference in the ELOVL5 expression in the brain between men and women [40,41].
The ELOVL2 expression was higher in the peritumoral area in women compared to men. ELOVL2 is a gene that has two estrogen response elements (EREs) in its promoter [42], a fact which may explain the increased expression of ELOVL2 in women in the peritumoral area compared to men. However, the average age of the female subjects at the time of surgery in our study was 60.8 years. Therefore, most of the women studied may have had reduced estrogen levels compared to premenopausal women [43] and the effect of estrogen on the ELOVL2 expression in the brain of the women included in our study may have been low. At the same time, the expression of ELOVL2 and ELOVL5 in the enhancing tumor region in women negatively correlated with their age. That indicates that the age of the women influences the expression of elongases involved in PUFA biosynthesis in GBM.
The observed differences may depend on the expression of the epithelial growth factor receptor (EGFR). Men have a higher frequency of EGFR mutations in GBM tumors than women [44]. These mutations are also associated with the amplification of this gene. In contrast, studies on genes associated with inherited GBM risk indicate that EGFR is associated with GBM incidence in men, but not in women [45]. EGFR encodes a receptor for EGF, which is significant for GBM tumor development [46]. It activates sterol regulatory element-binding protein 1 (SREBP-1) through the PI3K-Akt/PKB pathway [47]. As SREBP-1 causes an increased expression of ELOVL5 [48,49], ELOVL6 [50,51], and ELOVL7 [52], men may have a higher expression of ELOVL5, ELOVL6, and ELOVL7 in GBM tumors. This may explain our results where women had a lower expression of ELOVL5, ELOVL6, and ELOVL7 in GBM tumors compared to men.
Regarding gender differences in ELOVL1 and ELOVL4 expressions, there are no literature data on the effect of sex hormones on the expression of these elongases. For this reason, we cannot refer to the literature data.
Differences in elongase expressions between men and women may also partly depend on patient BMI. The expression of elongases in the liver, particularly ELOVL5 and ELOVL6, is higher under the influence of a fatty diet and obesity, as shown by experiments on mice [51]. This may explain the correlation between the ELOVL5 expression in the enhancing tumor region and BMI in all patients. The same correlation was also found in men, i.e., BMI vs. ELOVL5 and ELOVL6 expressions in the enhancing tumor region and the ELOVL2 expression in the tumor core. This effect may be gender-dependent. In the female GBM tumors, the ELOVL5 and ELOVL6 expressions negatively correlated with BMI. This shows that in women, obesity and overweight are associated with a decreased expression of ELOVL5 and ELOVL6 in GBM tumors, whereas in men, the expression of these elongases is increased.

4.3. Effects of Hypoxia and Nutrient-Deficient Conditions on the Expression of Elongases

In the present study, hypoxia induced by CoCl2 increased the expression of ELOVL5 and ELOVL6 but decreased the expression of ELOVL1, ELOVL3, ELOVL4, and ELOVL7 in the U-87 MG cells. These results are consistent with the literature data. Indeed, hypoxia has been shown to increase SREBP-1 activity in vitro [53]. Those cited studies were also performed on the U-87 MG line, as in this study. Additionally, HIF-1-dependent hypoxia increases SREBP expression as shown by a study on breast cancer cells [54]. SREBP-1 is a transcription factor that increases the expression of genes involved in lipid synthesis, particularly fatty acids [55], as well as FAS, ACC, and SCD [55]. SREBP also elevates the expression of ELOVL6 [50,51], which confirms our results in which CoCl2 increased the ELOVL6 expression. The same mechanism (hypoxia SREBP-1) may be responsible for the regulation of the hypoxia-induced increase in the ELOVL5 expression. This is associated with the fact that the expression of ELOVL5 is also dependent on SREBP-1c [48,49]. To date, there has been no literature data on the effect of hypoxia on the expression of ELOVL1, ELOVL3, ELOVL4, and ELOVL7, so we cannot refer our data to other studies.
Our results are the first to show the effect of the hypoxia mimetic agent on the expression of these elongases. The elongase expression results show that hypoxia decreases the synthesis of very-long-chain SFA but increases the synthesis of MUFA and PUFA. This indicates that under hypoxia, the cell membrane begins to be remodeled into a more fluid membrane (less very-long-chain SFA, more PUFA with more double bonds) which may have a role in signal transduction from various membrane receptors.
In our study, nutrient deficiency decreased ELOVL1, ELOVL4, ELOVL5, and ELOVL7 expressions in U-87 MG cells, but not that of ELOVL3 and ELOVL6. This effect was much smaller than that observed under hypoxic conditions. It is difficult to relate our results to the literature data because the expression of elongases such as ELOVL5 is poorly understood. So far, it has been shown that the expression of ELOVL5 is rarely different. The ELOVL5 expression, compared to ELOVL6, is not altered by SREBP-1c, glucose, or diabetes [51]. In contrast, the ELOVL5 expression is increased by PPARα activation and a high-fat diet [51]. PPARα is a transcription factor involved in the expression of genes related to fatty acid oxidation [56], that is, fatty acid catabolism. The nutrient deficiency used in this study is associated with insufficient substances to produce the optimal amount of fatty acids and a reduction in fatty acid oxidation. This may explain why in our results the nutrient deficiency condition decreased the ELOVL5 expression in U-87 MG cells. We have shown that nutrient deficiency reduces the ELOVL4 expression in U-87 MG cells. The regulation of the ELOVL4 expression has been poorly understood. It is known that diabetes reduces the ELOVL4 expression in the retina [57]. Diabetes is a disease caused by decreased insulin action which reduces the uptake and metabolization of glucose by cells. Because of this, cells are in a state similar to nutrient deficiency. Therefore, these results may confirm our findings that nutrient deficiency reduces the ELOVL4 expression. As for the effect of nutrient deficiency on the expression of ELOVL1 and ELOVL7, the regulation of the expression of these two elongases has been very poorly understood. It is known that ELOVL1 and ELOVL7 expressions are upregulated by the mammalian/mechanistic target of rapamycin (mTOR) [52,58]. Under glucose deficiency, there is a decrease in the activity of this kinase [59], which may reduce the expression of ELOVL1 and ELOVL7, and thus, explain our results.
As in the case of hypoxia, nutrient deficiency causes a decrease in the synthesis of very-long-chain SFA but does not affect the synthesis of MUFA and PUFA.

4.4. Clinical Significance of Elongases in GBM

Some elongases play a significant role in cancer processes, as indicated by the lower survival rates of GBM patients with a high expression of these enzymes. Despite this, they are very rarely studied, resulting in a low number of articles on the effect of elongase expressions on the survival of GBM patients available in the PubMed browser (https://pubmed.ncbi.nlm.nih.gov, accessed on 3 September 2022). For this reason, in this section, we used Gene Expression Profiling Interactive Analysis (GEPIA) (http://gepia.cancer-pku.cn accessed on 3 September 2022) [60] and the Pathology Atlas, which is part of the Human Protein Atlas (https://www.proteinatlas.org/humanproteome/pathology accessed on 3 September 2022) [61,62]. Both are based on data from The Cancer Genome Atlas (TCGA). GEPIA provides a range of useful information regarding the selected gene, including the effect of expression on the survival of GBM patients. The Human Protein Atlas only gives a prognosis for patients with glioma, and for this reason, the data from the Pathology Atlas may differ from GEPIA—GBM accounts only for 3/5 of all glioma cases [63].
SFA synthesis is an important fatty acid synthesis pathway in GBM, as demonstrated by the low survival rate of GBM patients when the enzymes responsible for SFA synthesis are expressed in greater levels in the tumor. In particular, according to the GEPIA portal, a worse GBM prognosis is associated with a higher expression of ELOVL1 and ELOVL3 [60]. Additionally, a higher expression of ELOVL3 in glioma is associated with a worse prognosis [64], and for ELOVL1, it is associated with a tendency toward a worse prognosis (p = 0.066) [65]. On the other hand, the expression level of ELOVL7, the third enzyme responsible for long-chain SFA elongation, does not affect the prognosis for patients with GBM [60] or glioma [66]. The significance of ELOVL1 and ELOVL3 in GBM tumorigenesis remains unclear. The elevated expression of these genes is also associated with a worse prognosis for hepatocellular carcinoma [67]. At least for ELOVL1, a higher expression in hepatocellular carcinoma results in cancer immune evasion, including an increased expression of programmed death-ligand 1 (PD-L1) and cytotoxic T-lymphocyte-associated protein 4 (CTLA4) [67].
An important factor for cancer processes in GBM is the biosynthesis of PUFA, in particular, arachidonic acid C20:4n-6. This PUFA is processed into prostaglandin E2 (PGE2) by cyclooxygenases [68]. As PGE2 is responsible for radioresistance [69] and temozolomide (TMZ) resistance [70], the enzymes involved in the synthesis of arachidonic acid C20:4n-6—in particular, Elovl5 and Fads2/D6D—are also responsible for the resistance to GBM anti-tumor therapy [69]. However, GEPIA [60] and Pathology Atlas [71] do not show that a higher ELOVL5 expression is associated with a worse or better prognosis in patients with GBM or glioma. PUFA can be further elongated to very-long-chain PUFA by ELOVL2. These fatty acids accumulate in the phospholipids of the cell membrane, and are followed by enhanced signal transduction from membrane receptors such as EGFR [72]. For this reason, an increase in the ELOVL2 expression leads to a resistance to anticancer drugs that inhibit receptors with tyrosine kinase activity or drugs that reduce EGFR activity, such as lapatinib. The high importance of ELOVL2 in tumorigenesis and resistance to treatment may confirm the association of the expression of this elongase with the prognosis for GBM patients. A higher ELOVL2 expression in the tumor is associated with a worse prognosis for patients with GBM [29] and glioma [73]. At the same time, according to the GEPIA portal, there is no association between Elovl2 expression and prognosis for GBM patients [60].
According to the GEPIA portal, there is no correlation between ELOVL6 expression and the prognosis for GBM patients [60]. On the other hand, Pathology Atlas showed that a higher ELOVL6 expression in glioma tumors is associated with a worse prognosis [74]. Elovl6 is involved in the elongation of palmitoyl-CoA to stearoyl-CoA and, in this way, it participates in the synthesis of all MUFA and SFA—the structural elements of cells. The importance of this enzyme in cancer processes has been well established in hepatocellular carcinoma [75]. Here, Elovl6 is essential in cancer cell proliferation; a higher ELOVL6 expression accompanies greater tumor growth, and thus, a greater aggressiveness of this cancer. According to the available studies, the expression level of ELOVL4 does not affect the prognosis of patients with GBM [60] or glioma [76]. Thus, it is possible that is does not play a significant role in tumorigenesis in GBM.

4.5. Limitations of the Study

In this study, the influence of hypoxia and nutrient-deficient conditions on the expression of elongases was investigated. The experiments were performed on U-87 MG cells, that is, on one cell line only. This line is widely used and is the standard model for in vitro studies of tumor mechanisms in GBM. Nevertheless, a neoplastic tumor, not only GBM, is characterized by the heterogeneity of neoplastic cells. There are also differences in tumor mechanisms between patients. For this reason, the obtained data based on the results of only one cell line may be inaccurate. However, the results presented in this article have great scientific value as a preliminary study of the role of elongases in neoplastic processes in GBM tumor. In this study, the expression of elongases at the mRNA level was analyzed. The mRNA level is closely related to the expression at the protein level. However, in some cases, the expression of the genes in question at the mRNA and protein levels may differ from one another. For this reason, the results of our study do not guarantee the observed differences in the expression of a given elongase at the protein level.

5. Conclusions

The results of the present study showed that:
  • The ELOVL1 and ELOVL7 expressions were reduced in GBM tumors. Very-long-chain SFA synthesis was also reduced in GBM;
  • ELOVL2, ELOVL5, ELOVL6, and ELOVL7 expressions were decreased in GBM tumors in women but not in men. The expression of ELOVL1 was upregulated in GBM tumors in women and downregulated in men. The ELOVL4 expression was upregulated in GBM tumors in women. GBM tumors in men showed a higher expression of ELOVL2, ELOVL5, and ELOVL6;
  • The demonstrated gender differences in the expression of the studied elongases may allow for the development of personalized therapy targeting fatty acid biosynthesis;
  • Hypoxia increased the expression of ELOVL5 and ELOVL6 but decreased the expression of ELOVL1, ELOVL3, ELOVL4, and ELOVL7 in GBM cells. Hypoxia decreased the synthesis of very-long-chain SFA but increased PUFA synthesis;
  • Nutrient deficiency reduced the expression of ELOVL1, ELOVL4, ELOVL5, and ELOVL7. Nutrient deficiency decreased the synthesis of very-long-chain SFA but did not affect PUFA synthesis.

Author Contributions

J.K., study design, data collection and interpretation, the literature review and manuscript draft preparation; D.S., data collection; D.J., investigation; K.K. investigation; P.T. data collection; M.T. data collection; D.C. founds collection, supervision; I.B.-B. writing—original draft preparation, writing—review and editing. All authors have read and agreed to the published version of the manuscript.

Funding

This study was supported by the statutory budget of the Department of Biochemistry and Medical Chemistry Pomeranian Medical University in Szczecin, Poland (WL-130-01/S/16/2022).

Institutional Review Board Statement

The study was conducted in accordance with the Declaration of Helsinki, and approved by the local bioethical commission (KB-0012/96/14).

Informed Consent Statement

Informed consent was obtained from all subjects involved in the study.

Data Availability Statement

The data presented in this study are available on request from the corresponding author.

Conflicts of Interest

The authors declare no conflict of interest.

References

  1. Louis, D.N.; Perry, A.; Reifenberger, G.; von Deimling, A.; Figarella-Branger, D.; Cavenee, W.K.; Ohgaki, H.; Wiestler, O.D.; Kleihues, P.; Ellison, D.W. The 2016 World Health Organization Classification of Tumors of the Central Nervous System: A summary. Acta Neuropathol. 2016, 131, 803–820. [Google Scholar] [CrossRef] [PubMed] [Green Version]
  2. Grochans, S.; Cybulska, A.M.; Simińska, D.; Korbecki, J.; Kojder, K.; Chlubek, D.; Baranowska-Bosiacka, I. Epidemiology of Glioblastoma Multiforme-Literature Review. Cancers 2022, 14, 2412. [Google Scholar] [CrossRef] [PubMed]
  3. Mirimanoff, R.O.; Gorlia, T.; Mason, W.; Van den Bent, M.J.; Kortmann, R.D.; Fisher, B.; Reni, M.; Brandes, A.A.; Curschmann, J.; Villa, S.; et al. Radiotherapy and temozolomide for newly diagnosed glioblastoma: Recursive partitioning analysis of the EORTC 26981/22981-NCIC CE3 phase III randomized trial. J. Clin. Oncol. 2006, 24, 2563–2569. [Google Scholar] [CrossRef] [Green Version]
  4. Lu, V.M.; Goyal, A.; Graffeo, C.S.; Perry, A.; Burns, T.C.; Parney, I.F.; Quinones-Hinojosa, A.; Chaichana, K.L. Survival Benefit of Maximal Resection for Glioblastoma Reoperation in the Temozolomide Era: A Meta-Analysis. World Neurosurg. 2019, 127, 31–37. [Google Scholar] [CrossRef]
  5. Eriksson, M.; Kahari, J.; Vestman, A.; Hallmans, M.; Johansson, M.; Bergenheim, A.T.; Sandström, M. Improved treatment of glioblastoma—Changes in survival over two decades at a single regional Centre. Acta Oncol. 2019, 58, 334–341. [Google Scholar] [CrossRef] [PubMed] [Green Version]
  6. Cantrell, J.N.; Waddle, M.R.; Rotman, M.; Peterson, J.L.; Ruiz-Garcia, H.; Heckman, M.G.; Quiñones-Hinojosa, A.; Rosenfeld, S.S.; Brown, P.D.; Trifiletti, D.M. Progress Toward Long-Term Survivors of Glioblastoma. Mayo Clin. Proc. 2019, 94, 1278–1286. [Google Scholar] [CrossRef]
  7. Guillou, H.; Zadravec, D.; Martin, P.G.; Jacobsson, A. The key roles of elongases and desaturases in mammalian fatty acid metabolism: Insights from transgenic mice. Prog. Lipid Res. 2010, 49, 186–199. [Google Scholar] [CrossRef]
  8. Libertini, L.J.; Smith, S. Synthesis of long chain acyl-enzyme thioesters by modified fatty acid synthetases and their hydrolysis by a mammary gland thioesterase. Arch. Biochem. Biophys. 1979, 192, 47–60. [Google Scholar] [CrossRef]
  9. Jakobsson, A.; Westerberg, R.; Jacobsson, A. Fatty acid elongases in mammals: Their regulation and roles in metabolism. Prog. Lipid Res. 2006, 45, 237–249. [Google Scholar] [CrossRef]
  10. Moon, Y.A.; Horton, J.D. Identification of two mammalian reductases involved in the two-carbon fatty acyl elongation cascade. J. Biol. Chem. 2003, 278, 7335–7343. [Google Scholar] [CrossRef]
  11. Matsuzaka, T.; Shimano, H.; Yahagi, N.; Yoshikawa, T.; Amemiya-Kudo, M.; Hasty, A.H.; Okazaki, H.; Tamura, Y.; Iizuka, Y.; Ohashi, K.; et al. Cloning and characterization of a mammalian fatty acyl-CoA elongase as a lipogenic enzyme regulated by SREBPs. J. Lipid Res. 2002, 43, 911–920. [Google Scholar] [CrossRef]
  12. Matsuzaka, T.; Shimano, H.; Yahagi, N.; Kato, T.; Atsumi, A.; Yamamoto, T.; Inoue, N.; Ishikawa, M.; Okada, S.; Ishigaki, N.; et al. Crucial role of a long-chain fatty acid elongase, Elovl6, in obesity-induced insulin resistance. Nat. Med. 2007, 13, 1193–1202. [Google Scholar] [CrossRef]
  13. Ohno, Y.; Suto, S.; Yamanaka, M.; Mizutani, Y.; Mitsutake, S.; Igarashi, Y.; Sassa, T.; Kihara, A. ELOVL1 production of C24 acyl-CoAs is linked to C24 sphingolipid synthesis. Proc. Natl. Acad. Sci. USA 2010, 107, 18439–18444. [Google Scholar] [CrossRef] [Green Version]
  14. Naganuma, T.; Sato, Y.; Sassa, T.; Ohno, Y.; Kihara, A. Biochemical characterization of the very long-chain fatty acid elongase ELOVL7. FEBS Lett. 2011, 585, 3337–3341. [Google Scholar] [CrossRef] [Green Version]
  15. Leonard, A.E.; Bobik, E.G.; Dorado, J.; Kroeger, P.E.; Chuang, L.T.; Thurmond, J.M.; Parker-Barnes, J.M.; Das, T.; Huang, Y.S.; Mukerji, P. Cloning of a human cDNA encoding a novel enzyme involved in the elongation of long-chain polyunsaturated fatty acids. Biochem. J. 2000, 350, 765–770. [Google Scholar] [CrossRef]
  16. Leonard, A.E.; Kelder, B.; Bobik, E.G.; Chuang, L.T.; Lewis, C.J.; Kopchick, J.J.; Mukerji, P.; Huang, Y.S. Identification and expression of mammalian long-chain PUFA elongation enzymes. Lipids 2002, 37, 733–740. [Google Scholar] [CrossRef]
  17. Agbaga, M.P.; Brush, R.S.; Mandal, M.N.; Henry, K.; Elliott, M.H.; Anderson, R.E. Role of Stargardt-3 macular dystrophy protein (ELOVL4) in the biosynthesis of very long chain fatty acids. Proc. Natl. Acad. Sci. USA 2008, 105, 12843–12848. [Google Scholar] [CrossRef] [PubMed] [Green Version]
  18. Hopiavuori, B.R.; Anderson, R.E.; Agbaga, M.P. ELOVL4: Very long-chain fatty acids serve an eclectic role in mammalian health and function. Prog. Retin. Eye Res. 2019, 69, 137–158. [Google Scholar] [CrossRef] [PubMed]
  19. Korbecki, J.; Kojder, K.; Jeżewski, D.; Simińska, D.; Tarnowski, M.; Kopytko, P.; Safranow, K.; Gutowska, I.; Goschorska, M.; Kolasa-Wołosiuk, A.; et al. Expression of SCD and FADS2 Is Lower in the Necrotic Core and Growing Tumor Area than in the Peritumoral Area of Glioblastoma Multiforme. Biomolecules 2020, 10, 727. [Google Scholar] [CrossRef]
  20. Shabihkhani, M.; Telesca, D.; Movassaghi, M.; Naeini, Y.B.; Naeini, K.M.; Hojat, S.A.; Gupta, D.; Lucey, G.M.; Ontiveros, M.; Wang, M.W.; et al. Incidence, survival, pathology, and genetics of adult Latino Americans with glioblastoma. J. Neurooncol. 2017, 132, 351–358. [Google Scholar] [CrossRef]
  21. Tian, M.; Ma, W.; Chen, Y.; Yu, Y.; Zhu, D.; Shi, J.; Zhang, Y. Impact of gender on the survival of patients with glioblastoma. Biosci. Rep. 2018, 38, BSR20180752. [Google Scholar] [CrossRef] [Green Version]
  22. Baid, U.; Talbar, S.; Rane, S.; Gupta, S.; Thakur, M.H.; Moiyadi, A.; Sable, N.; Akolkar, M.; Mahajan, A. A Novel Approach for Fully Automatic Intra-Tumor Segmentation With 3D U-Net Architecture for Gliomas. Front. Comput. Neurosci. 2020, 14, 10. [Google Scholar] [CrossRef] [PubMed] [Green Version]
  23. Feng, X.; Tustison, N.J.; Patel, S.H.; Meyer, C.H. Brain Tumor Segmentation Using an Ensemble of 3D U-Nets and Overall Survival Prediction Using Radiomic Features. Front. Comput. Neurosci. 2020, 14, 25. [Google Scholar] [CrossRef] [Green Version]
  24. Lemée, J.M.; Com, E.; Clavreul, A.; Avril, T.; Quillien, V.; de Tayrac, M.; Pineau, C.; Menei, P. Proteomic analysis of glioblastomas: What is the best brain control sample? J. Proteomics 2013, 85, 165–173. [Google Scholar] [CrossRef] [Green Version]
  25. Brat, D.J.; Castellano-Sanchez, A.A.; Hunter, S.B.; Pecot, M.; Cohen, C.; Hammond, E.H.; Devi, S.N.; Kaur, B.; Van Meir, E.G. Pseudopalisades in glioblastoma are hypoxic, express extracellular matrix proteases, and are formed by an actively migrating cell population. Cancer Res. 2004, 64, 920–927. [Google Scholar] [CrossRef] [PubMed] [Green Version]
  26. Muñoz-Sánchez, J.; Chánez-Cárdenas, M.E. The use of cobalt chloride as a chemical hypoxia model. J. Appl. Toxicol. 2019, 39, 556–570. [Google Scholar] [CrossRef] [PubMed]
  27. Said, H.M.; Hagemann, C.; Stojic, J.; Schoemig, B.; Vince, G.H.; Flentje, M.; Roosen, K.; Vordermark, D. GAPDH is not regulated in human glioblastoma under hypoxic conditions. BMC Mol. Biol. 2007, 8, 55. [Google Scholar] [CrossRef] [Green Version]
  28. Seifert, M.; Garbe, M.; Friedrich, B.; Mittelbronn, M.; Klink, B. Comparative transcriptomics reveals similarities and differences between astrocytoma grades. BMC Cancer 2015, 15, 952. [Google Scholar] [CrossRef] [PubMed]
  29. Saurty-Seerunghen, M.S.; Bellenger, L.; El-Habr, E.A.; Delaunay, V.; Garnier, D.; Chneiweiss, H.; Antoniewski, C.; Morvan-Dubois, G.; Junier, M.P. Capture at the single cell level of metabolic modules distinguishing aggressive and indolent glioblastoma cells. Acta Neuropathol. Commun. 2019, 7, 155. [Google Scholar] [CrossRef] [PubMed] [Green Version]
  30. Vyazunova, I.; Maklakova, V.I.; Berman, S.; De, I.; Steffen, M.D.; Hong, W.; Lincoln, H.; Morrissy, A.S.; Taylor, M.D.; Akagi, K.; et al. Sleeping Beauty mouse models identify candidate genes involved in gliomagenesis. PLoS ONE 2014, 9, e113489. [Google Scholar] [CrossRef] [PubMed]
  31. Kaplan, M.; Koparan, M.; Sari, A.; Ozturk, S.; Kaplan, S.K.; Erol, F.S. Can Behenic Acid (C22:0) Levels be a Prognostic Factor in Glial Tumors? Can J. Neurol. Sci. 2013, 40, 854–856. [Google Scholar] [CrossRef] [PubMed] [Green Version]
  32. Igarashi, M.; Ma, K.; Chang, L.; Bell, J.M.; Rapoport, S.I. Dietary n-3 PUFA deprivation for 15 weeks upregulates elongase and desaturase expression in rat liver but not brain. J. Lipid Res. 2007, 48, 2463–2470. [Google Scholar] [CrossRef] [PubMed] [Green Version]
  33. Alessandri, J.M.; Extier, A.; Al-Gubory, K.H.; Langelier, B.; Baudry, C.; LePoupon, C.; Lavialle, M.; Guesnet, P. Ovariectomy and 17β-estradiol alter transcription of lipid metabolism genes and proportions of neo-formed n-3 and n-6 long-chain polyunsaturated fatty acids differently in brain and liver. J. Nutr. Biochem. 2011, 22, 820–827. [Google Scholar] [CrossRef]
  34. Marks, K.A.; Kitson, A.P.; Stark, K.D. Hepatic and plasma sex differences in saturated and monounsaturated fatty acids are associated with differences in expression of elongase 6, but not stearoyl-CoA desaturase in Sprague-Dawley rats. Genes Nutr. 2013, 8, 317–327. [Google Scholar] [CrossRef] [Green Version]
  35. Marks, K.A.; Kitson, A.P.; Shaw, B.; Mutch, D.M.; Stark, K.D. Stearoyl-CoA desaturase 1, elongase 6 and their fatty acid products and precursors are altered in ovariectomized rats with 17β-estradiol and progesterone treatment. Prostaglandins Leukot. Essent. Fat. Acids 2013, 89, 89–96. [Google Scholar] [CrossRef] [PubMed]
  36. Marra, C.A.; de Alaniz, M.J. Influence of testosterone administration on the biosynthesis of unsaturated fatty acids in male and female rats. Lipids 1989, 24, 1014–1019. [Google Scholar] [CrossRef] [PubMed]
  37. Childs, C.E.; Hoile, S.P.; Burdge, G.C.; Calder, P.C. Changes in rat n-3 and n-6 fatty acid composition during pregnancy are associated with progesterone concentrations and hepatic FADS2 expression. Prostaglandins Leukot. Essent. Fat. Acids 2012, 86, 141–147. [Google Scholar] [CrossRef] [PubMed]
  38. Kitson, A.P.; Marks, K.A.; Shaw, B.; Mutch, D.M.; Stark, K.D. Treatment of ovariectomized rats with 17β-estradiol increases hepatic delta-6 desaturase enzyme expression and docosahexaenoic acid levels in hepatic and plasma phospholipids. Prostaglandins Leukot. Essent. Fat. Acids 2013, 89, 81–88. [Google Scholar] [CrossRef] [PubMed]
  39. Sibbons, C.M.; Brenna, J.T.; Lawrence, P.; Hoile, S.P.; Clarke-Harris, R.; Lillycrop, K.A.; Burdge, G.C. Effect of sex hormones on n-3 polyunsaturated fatty acid biosynthesis in HepG2 cells and in human primary hepatocytes. Prostaglandins Leukot. Essent. Fat. Acids 2014, 90, 47–54. [Google Scholar] [CrossRef] [Green Version]
  40. Liu, Y.; Jandacek, R.; Rider, T.; Tso, P.; McNamara, R.K. Elevated delta-6 desaturase (FADS2) expression in the postmortem prefrontal cortex of schizophrenic patients: Relationship with fatty acid composition. Schizophr. Res. 2009, 109, 113–120. [Google Scholar] [CrossRef]
  41. Kitson, A.P.; Smith, T.L.; Marks, K.A.; Stark, K.D. Tissue-specific sex differences in docosahexaenoic acid and Δ6-desaturase in rats fed a standard chow diet. Appl. Physiol. Nutr. Metab. 2012, 37, 1200–1211. [Google Scholar] [CrossRef] [PubMed]
  42. González-Bengtsson, A.; Asadi, A.; Gao, H.; Dahlman-Wright, K.; Jacobsson, A. Estrogen Enhances the Expression of the Polyunsaturated Fatty Acid Elongase Elovl2 via ERα in Breast Cancer Cells. PLoS ONE 2016, 11, e0164241. [Google Scholar] [CrossRef] [Green Version]
  43. Burger, H. The menopausal transition—Endocrinology. J. Sex. Med. 2008, 5, 2266–2273. [Google Scholar] [CrossRef] [PubMed]
  44. Idbaih, A.; Aimard, J.; Boisselier, B.; Marie, Y.; Paris, S.; Crinière, E.; Carvalho Silva, R.; Laigle-Donadey, F.; Rousseau, A.; Mokhtari, K.; et al. Epidermal growth factor receptor extracellular domain mutations in primary glioblastoma. Neuropathol. Appl. Neurobiol. 2009, 35, 208–213. [Google Scholar] [CrossRef]
  45. Ostrom, Q.T.; Coleman, W.; Huang, W.; Rubin, J.B.; Lathia, J.D.; Berens, M.E.; Speyer, G.; Liao, P.; Wrensch, M.R.; Eckel-Passow, J.E.; et al. Sex-specific gene and pathway modeling of inherited glioma risk. Neuro-oncology 2019, 21, 71–82. [Google Scholar] [CrossRef] [Green Version]
  46. An, Z.; Aksoy, O.; Zheng, T.; Fan, Q.W.; Weiss, W.A. Epidermal growth factor receptor and EGFRvIII in glioblastoma: Signaling pathways and targeted therapies. Oncogene 2018, 37, 1561–1575. [Google Scholar] [CrossRef]
  47. Guo, D.; Prins, R.M.; Dang, J.; Kuga, D.; Iwanami, A.; Soto, H.; Lin, K.Y.; Huang, T.T.; Akhavan, D.; Hock, M.B.; et al. EGFR signaling through an Akt-SREBP-1-dependent, rapamycin-resistant pathway sensitizes glioblastomas to antilipogenic therapy. Sci. Signal. 2009, 2, ra82. [Google Scholar] [CrossRef] [Green Version]
  48. Qin, Y.; Dalen, K.T.; Gustafsson, J.A.; Nebb, H.I. Regulation of hepatic fatty acid elongase 5 by LXRalpha-SREBP-1c. Biochim. Biophys. Acta 2009, 1791, 140–147. [Google Scholar] [CrossRef]
  49. Shikama, A.; Shinozaki, H.; Takeuchi, Y.; Matsuzaka, T.; Aita, Y.; Murayama, T.; Sawada, Y.; Piao, X.; Toya, N.; Oya, Y.; et al. Identification of human ELOVL5 enhancer regions controlled by SREBP. Biochem. Biophys. Res. Commun. 2015, 465, 857–863. [Google Scholar] [CrossRef]
  50. Moon, Y.A.; Shah, N.A.; Mohapatra, S.; Warrington, J.A.; Horton, J.D. Identification of a mammalian long chain fatty acyl elongase regulated by sterol regulatory element-binding proteins. J. Biol. Chem. 2001, 276, 45358–45366. [Google Scholar] [CrossRef]
  51. Wang, Y.; Botolin, D.; Xu, J.; Christian, B.; Mitchell, E.; Jayaprakasam, B.; Nair, M.G.; Peters, J.M.; Busik, J.V.; Olson, L.K.; et al. Regulation of hepatic fatty acid elongase and desaturase expression in diabetes and obesity. J. Lipid Res. 2006, 47, 2028–2041. [Google Scholar] [CrossRef] [Green Version]
  52. Purdy, J.G.; Shenk, T.; Rabinowitz, J.D. Fatty acid elongase 7 catalyzes lipidome remodeling essential for human cytomegalovirus replication. Cell Rep. 2015, 10, 1375–1385. [Google Scholar] [CrossRef] [PubMed] [Green Version]
  53. Lewis, C.A.; Brault, C.; Peck, B.; Bensaad, K.; Griffiths, B.; Mitter, R.; Chakravarty, P.; East, P.; Dankworth, B.; Alibhai, D.; et al. SREBP maintains lipid biosynthesis and viability of cancer cells under lipid- and oxygen-deprived conditions and defines a gene signature associated with poor survival in glioblastoma multiforme. Oncogene 2015, 34, 5128–5140. [Google Scholar] [CrossRef] [PubMed]
  54. Furuta, E.; Pai, S.K.; Zhan, R.; Bandyopadhyay, S.; Watabe, M.; Mo, Y.Y.; Hirota, S.; Hosobe, S.; Tsukada, T.; Miura, K.; et al. Fatty acid synthase gene is up-regulated by hypoxia via activation of Akt and sterol regulatory element binding protein-1. Cancer Res. 2008, 68, 1003–1011. [Google Scholar] [CrossRef] [PubMed] [Green Version]
  55. Shimano, H. Sterol regulatory element-binding proteins (SREBPs): Transcriptional regulators of lipid synthetic genes. Prog. Lipid Res. 2001, 40, 439–452. [Google Scholar] [CrossRef]
  56. Bougarne, N.; Weyers, B.; Desmet, S.J.; Deckers, J.; Ray, D.W.; Staels, B.; De Bosscher, K. Molecular Actions of PPARα in Lipid Metabolism and Inflammation. Endocr. Rev. 2018, 39, 760–802. [Google Scholar] [CrossRef] [Green Version]
  57. Kady, N.M.; Liu, X.; Lydic, T.A.; Syed, M.H.; Navitskaya, S.; Wang, Q.; Hammer, S.S.; O’Reilly, S.; Huang, C.; Seregin, S.S.; et al. ELOVL4-Mediated Production of Very Long-Chain Ceramides Stabilizes Tight Junctions and Prevents Diabetes-Induced Retinal Vascular Permeability. Diabetes 2018, 67, 769–781. [Google Scholar] [CrossRef] [Green Version]
  58. Wang, W.; He, Q.; Guo, Z.; Yang, L.; Bao, L.; Bao, W.; Zheng, X.; Wang, Y.; Wang, Z. Inhibition of Mammalian Target of Rapamycin Complex 1 (mTORC1) Downregulates ELOVL1 Gene Expression and Fatty Acid Synthesis in Goat Fetal Fibroblasts. Int. J. Mol. Sci. 2015, 16, 16440–16453. [Google Scholar] [CrossRef] [Green Version]
  59. Leprivier, G.; Rotblat, B. How does mTOR sense glucose starvation? AMPK is the usual suspect. Cell Death Discov. 2020, 6, 27. [Google Scholar] [CrossRef] [Green Version]
  60. Tang, Z.; Li, C.; Kang, B.; Gao, G.; Li, C.; Zhang, Z. GEPIA: A web server for cancer and normal gene expression profiling and interactive analyses. Nucleic Acids Res. 2017, 45, W98–W102. [Google Scholar] [CrossRef]
  61. Uhlen, M.; Zhang, C.; Lee, S.; Sjöstedt, E.; Fagerberg, L.; Bidkhori, G.; Benfeitas, R.; Arif, M.; Liu, Z.; Edfors, F.; et al. A pathology atlas of the human cancer transcriptome. Science 2017, 357, eaan2507. [Google Scholar] [CrossRef] [PubMed] [Green Version]
  62. Uhlén, M.; Fagerberg, L.; Hallström, B.M.; Lindskog, C.; Oksvold, P.; Mardinoglu, A.; Sivertsson, Å.; Kampf, C.; Sjöstedt, E.; Asplund, A.; et al. Proteomics. Tissue-based map of the human proteome. Science 2015, 347, 1260419. [Google Scholar] [CrossRef] [PubMed]
  63. Ostrom, Q.T.; Patil, N.; Cioffi, G.; Waite, K.; Kruchko, C.; Barnholtz-Sloan, J.S. CBTRUS Statistical Report: Primary Brain and Other Central Nervous System Tumors Diagnosed in the United States in 2013-2017. Neuro-oncology 2020, 22, iv96. [Google Scholar] [CrossRef] [PubMed]
  64. Expression of ELOVL3 in Glioma-The Human Protein Atlas. Version 21.1. Available online: https://www.proteinatlas.org/ENSG00000119915-ELOVL3/pathology/glioma (accessed on 3 September 2022).
  65. Expression of ELOVL1 in Glioma-The Human Protein Atlas. Version 21.1. Available online: https://www.proteinatlas.org/ENSG00000066322-ELOVL1/pathology/glioma (accessed on 3 September 2022).
  66. Expression of ELOVL7 in Glioma-The Human Protein Atlas. Version 21.1. Available online: https://www.proteinatlas.org/ENSG00000164181-ELOVL7/pathology/glioma (accessed on 3 September 2022).
  67. Zhang, Y.; Pang, S.; Sun, B.; Zhang, M.; Jiao, X.; Lai, L.; Qian, Y.; Yang, N.; Yang, W. ELOVLs Predict Distinct Prognosis Value and Immunotherapy Efficacy in Patients With Hepatocellular Carcinoma. Front. Oncol. 2022, 12, 884066. [Google Scholar] [CrossRef]
  68. Qiu, J.; Shi, Z.; Jiang, J. Cyclooxygenase-2 in glioblastoma multiforme. Drug Discov. Today 2017, 22, 148–156. [Google Scholar] [CrossRef] [Green Version]
  69. Wang, J.; Liang, H.; Sun, M.; Zhang, L.; Xu, H.; Liu, W.; Li, Y.; Zhou, Y.; Li, Y.; Li, M. Delta-6-desaturase inhibitor enhances radiation therapy in glioblastoma in vitro and in vivo. Cancer Manag. Res. 2018, 10, 6779–6790. [Google Scholar] [CrossRef] [Green Version]
  70. Tsai, Y.T.; Lo, W.L.; Chen, P.Y.; Ko, C.Y.; Chuang, J.Y.; Kao, T.J.; Yang, W.B.; Chang, K.Y.; Hung, C.Y.; Kikkawa, U.; et al. Reprogramming of arachidonate metabolism confers temozolomide resistance to glioblastoma through enhancing mitochondrial activity in fatty acid oxidation. J. Biomed. Sci. 2022, 29, 21. [Google Scholar] [CrossRef]
  71. Expression of ELOVL5 in Glioma-The Human Protein Atlas. Version 21.1. Available online: https://www.proteinatlas.org/ENSG00000012660-ELOVL5/pathology/glioma (accessed on 3 September 2022).
  72. Gimple, R.C.; Kidwell, R.L.; Kim, L.J.Y.; Sun, T.; Gromovsky, A.D.; Wu, Q.; Wolf, M.; Lv, D.; Bhargava, S.; Jiang, L.; et al. Glioma Stem Cell-Specific Superenhancer Promotes Polyunsaturated Fatty-Acid Synthesis to Support EGFR Signaling. Cancer Discov. 2019, 9, 1248–1267. [Google Scholar] [CrossRef]
  73. Expression of ELOVL2 in Glioma-The Human Protein Atlas. Version 21.1. Available online: https://www.proteinatlas.org/ENSG00000197977-ELOVL2/pathology/glioma (accessed on 3 September 2022).
  74. Expression of ELOVL6 in Glioma-The Human Protein Atlas. Version 21.1. Available online: https://www.proteinatlas.org/ENSG00000170522-ELOVL6/pathology/glioma (accessed on 3 September 2022).
  75. Su, Y.C.; Feng, Y.H.; Wu, H.T.; Huang, Y.S.; Tung, C.L.; Wu, P.; Chang, C.J.; Shiau, A.L.; Wu, C.L. Elovl6 is a negative clinical predictor for liver cancer and knockdown of Elovl6 reduces murine liver cancer progression. Sci. Rep. 2018, 8, 6586. [Google Scholar]
  76. Expression of ELOVL4 in Glioma-The Human Protein Atlas. Version 21.1. Available online: https://www.proteinatlas.org/ENSG00000118402-ELOVL4/pathology/glioma (accessed on 3 September 2022).
Figure 1. Inclusion and exclusion criteria for selecting and choosing patients from whom GBM tumor samples were analyzed.
Brainsci 12 01356 g001
Figure 2. Magnetic resonance imaging (MRI) scan of the brain with the glioblastoma multiforme (GBM) tumor. The image highlights the three study zones: (1) peritumoral area, (2) enhancing tumor region and (3) tumor core. Axial, T1-weighted MRI scans of a 64-year-old patient diagnosed with GBM in the right parietal lobe. The patient presented visual impairment in the left eye and visual-spatial coordination disorders, as well as a sensory impairment on the right side.
Brainsci 12 01356 g002
Figure 3. Expression levels of elongases in a GBM tumor. Expression levels of (a) ELOVL1, (b) ELOVL2, (c) ELOVL3, (d) ELOVL4, (e) ELOVL5, (f) ELOVL6, and (g) ELOVL7 in the peritumoral area, enhancing tumor area and tumor core. Changes in elongase expression affect the synthesis of (h) MUFA, SFA, and (i) PUFA. *—statistically significant difference of expression of a given elongase between different regions of a GBM tumor estimated by Wilcoxon signed-rank test (p < 0.05). **—p < 0.01.
Brainsci 12 01356 g003
Figure 4. Expression levels of elongases in a GBM tumor depending on gender. Expression levels of (a) ELOVL1, (b) ELOVL2, (c) ELOVL3, (d) ELOVL4, (e) ELOVL5, (f) ELOVL6, and (g) ELOVL7 in the peritumoral area, enhancing tumor area and tumor core. Changes in elongase expressions affect the synthesis of (h,j) MUFA, SFA, and (i,k) PUFA in women (h,i) and men (j,k). *—statistically significant difference of expression of a given elongase between different regions of a GBM tumor estimated by Wilcoxon signed-rank test (p < 0.05). **—p < 0.01. ****—p < 0.0001.
Brainsci 12 01356 g004
Figure 5. Effect of hypoxia and nutrient-deficient conditions on the expression of elongases. Effect of hypoxia and nutrient deficiency conditions on the expression of (a) ELOVL1, (b) ELOVL3, (c) ELOVL4, (d) ELOVL5, (e) ELOVL6, (f) and ELOVL7 in U-87 MG cells. Hypoxia affects (g) the synthesis of MUFA and SFA and (h) PUFA. *—Statistically significant difference in the expression of a given elongase between controls estimated by Wilcoxon signed-rank test (p < 0.05). **—p < 0.01. ***—p < 0.001. ****—p < 0.0001.
Brainsci 12 01356 g005
Table 1. The statistical characteristics of the patients.
NMeanStandard DeviationMinimumMaximum
Age at surgery2460.712.53681
Weight24841955130
Height2317212147196
BMI2328.74.821.538.9
Pack-years (number of smoking years × number of packs (20 pcs.)/d2013.4213.98042
Men
Age at surgery1460.611.94181
Weight1493.815.473130
Height141788.6163196
BMI1429.54.224.738.9
Pack-years (number of smoking years × number of packs (20 pcs.)/d1218.6314.48042
Women
Age at surgery1260.814.13679
Weight1270.3155595
Height111628147173
BMI1127.45.721.536.2
Pack-years (number of smoking years × number of packs (20 pcs.)/d85.619.23021
Hormone replacement therapy75 patients were not receiving hormone therapy, 2 patients were receiving
Table 2. Correlation of the expression of the studied elongases between each other and the studied GBM tumor regions.
Studied Gene/
Location
ELOVL1ELOVL2ELOVL3ELOVL4ELOVL5ELOVL6ELOVL7
ETRTCPAETRTCPAETRTCPAETRTCPAETRTCPAETRTCPAETRTCPA
ELOVL1ETR1.00
TC0.361.00
PA−0.320.071.00
ELOVL2ETR0.35−0.270.341.00
TC0.44 *0.170.040.021.00
PA0.35−0.060.250.340.071.00
ELOVL3ETR−0.02−0.15−0.020.370.290.131.00
TC−0.44−0.18−0.05−0.49 *0.16−0.33−0.031.00
PA−0.34−0.23−0.110.190.310.020.080.101.00
ELOVL4ETR0.05−0.020.060.260.15−0.100.07−0.10−0.331.00
TC−0.09−0.140.04−0.040.37 *0.160.23−0.02−0.12−0.141.00
PA−0.060.35−0.07−0.090.46 *0.49 *0.020.360.030.360.51 *1.00
ELOVL5ETR0.300.040.190.50 *−0.140.250.000.53 *0.010.46 *−0.090.181.00
TC0.260.58 *−0.03−0.120.65 *−0.22−0.070.220.160.030.77 *0.350.081.00
PA0.130.160.240.160.010.74 *−0.05−0.030.02−0.150.240.51 *0.100.171.00
ELOVL6ETR0.360.050.030.34−0.220.250.220.32−0.010.53 *0.150.220.72 *0.73 *−0.131.00
TC0.100.28−0.12−0.130.66 *−0.040.080.230.130.030.64 *0.280.060.83 *0.090.341.00
PA−0.040.030.21−0.010.200.61 *−0.19−0.170.060.330.200.73 *0.070.260.51 *0.070.281.00
ELOVL7ETR−0.120.170.000.22−0.03−0.020.260.25−0.260.60 *0.050.40 *0.54 *−0.03−0.080.51 *−0.320.311.00
TC−0.04−0.04−0.130.010.31−0.09−0.12−0.110.030.310.60 *−0.230.290.70 *−0.060.340.49 *0.060.291.00
PA−0.08−0.130.24−0.010.330.58 *0.03−0.30−0.15−0.52 *0.080.110.020.110.46 *−0.010.210.58 *−0.46 *−0.131.00
The values of Spearman’s rank correlation coefficients are given. * Statistically significant correlation of the expression of two genes/locations (p < 0.05). PA—peritumoral area; ETR—enhancing tumor region; TC—tumor core.
Table 3. Mutual correlations between the expression of the studied elongases, and correlations between the expression of the elongases and GBM tumor regions in men.
Studied Gene/
Location
ELOVL1ELOVL2ELOVL3ELOVL4ELOVL5ELOVL6ELOVL7
ETRTCPAETRTCPAETRTCPAETRTCPAETRTCPAETRTCPAETRTCPA
ELOVL1ETR1.00
TC0.181.00
PA0.150.061.00
ELOVL2ETR0.32−0.510.131.00
TC0.490.290.040.39 *1.00
PA0.410.110.360.70 *0.461.00
ELOVL3ETR−0.12−0.030.060.52 *0.280.101.00
TC−0.39−0.160.05−0.59 *0.14−0.64 *−0.351.00
PA0.180.310.050.430.370.290.60 *−0.211.00
ELOVL4ETR−0.040.02−0.03−0.240.08−0.030.15−0.090.161.00
TC0.000.54 *−0.260.090.270.140.29−0.040.19−0.081.00
PA−0.080.440.21−0.060.48 *0.61 *0.24−0.370.320.55 *0.401.00
ELOVL5ETR0.39−0.240.250.400.360.59 *0.02−0.170.270.26−0.270.291.00
TC0.310.67 *−0.02−0.110.67 *0.210.050.280.23−0.020.76 *0.220.191.00
PA0.190.250.360.400.350.68 *−0.30−0.380.060.220.110.57 *0.470.201.00
ELOVL6ETR0.320.04−0.310.290.42 *0.41 *−0.08−0.320.440.60 *0.140.460.66 *0.320.261.00
TC0.150.49 *0.14−0.090.65 *0.080.150.140.190.150.60 *0.270.030.82 *0.160.311.00
PA0.260.190.350.060.54 *0.72 *−0.11−0.400.17−0.230.310.83 *0.200.260.67 *0.090.221.00
ELOVL7ETR−0.500.15−0.24−0.49−0.33−0.180.09−0.340.170.69 *0.160.64 *0.19−0.25−0.300.54 *−0.19−0.091.00
TC0.200.69 *−0.23−0.120.11−0.020.04−0.05−0.07−0.150.76 *0.25−0.280.65 *−0.010.070.430.08−0.071.00
PA0.190.470.56 *0.360.360.66 *0.30−0.69 *0.280.080.030.50 *0.450.090.53 *0.320.170.58 *0.250.121.00
The values of Spearman’s rank correlation coefficients are given. * Statistically significant correlation of the expression of two genes/locations (p < 0.05). PA—peritumoral area; ETR—enhancing tumor region; TC—tumor core.
Table 4. Mutual correlations between the expression of the studied elongases, and correlations between the expression of the elongases and GBM tumor regions in women.
Studied Gene/
Location
ELOVL1ELOVL2ELOVL3ELOVL4ELOVL5ELOVL6ELOVL7
ETRTCPAETRTCPAETRTCPAETRTCPAETRTCPAETRTCPAETRTCPA
ELOVL1ETR1.00
TC0.521.00
PA0.360.221.00
ELOVL2ETR0.41−0.070.531.00
TC0.470.050.020.041.00
PA0.20−0.310.280.100.101.00
ELOVL3ETR−0.15−0.230.280.170.390.221.00
TC−0.23−0.17−0.20−0.410.67 *−0.210.251.00
PA−0.23−0.28−0.35−0.050.29−0.55 *0.050.61 *1.00
ELOVL4ETR0.24−0.040.300.75 *0.060.020.44−0.22−0.051.00
TC−0.250.48−0.15−0.250.130.030.030.190.16−0.021.00
PA−0.150.70 *−0.26−0.310.53−0.09−0.410.470.33−0.140.75 *1.00
ELOVL5ETR0.220.240.150.65 *−0.220.170.13−0.74 *−0.350.53 *0.09−0.161.00
TC0.250.55−0.18−0.260.63 *−0.310.050.31−0.04−0.270.93 *0.98 *0.101.00
PA0.200.240.09−0.330.50 *0.400.240.33−0.16−0.530.300.47−0.130.50 *1.00
ELOVL6ETR0.200.070.280.51 *−0.140.320.27−0.60 *−0.370.460.38−0.180.79 *0.16−0.271.00
TC0.030.00−0.57−0.270.67 *0.370.240.57 *0.11−0.410.550.58−0.230.73 *0.33−0.071.00
PA0.17−0.26−0.12−0.290.49 *0.53 *−0.290.24−0.300.000.100.15−0.260.150.07−0.06−0.101.00
ELOVL7ETR0.09−0.310.170.75 *0.370.490.21−0.20−0.090.64 *−0.23−0.090.60 *−0.030.050.41−0.080.381.00
TC0.05−0.030.390.500.270.26−0.09−0.10−0.050.07−0.24−0.050.540.170.430.36−0.130.080.66 *1.00
PA0.380.36−0.05−0.560.210.35−0.410.13−0.40−0.79 *0.070.40−0.380.430.58 *−0.25−0.070.59 *−0.36−0.021.00
The values of Spearman’s rank correlation coefficients are given. * Statistically significant correlation of the expression of two genes/locations (p < 0.05). PA—peritumoral area; ETR—enhancing tumor region; TC—tumor core.
Table 5. Correlation between the expression of the elongases studied and the characteristics of patients.
ParameterAgeBody WeightHeightBMIPack-YearsAgeBody WeightHeightBMIPack-YearsAgeBody WeightHeightBMIPack-Years
GenderAll patientsMenWomen
ELOVL1PA−0.04−0.330.070.340.39−0.02−0.450.05−0.310.18−0.13−0.67 *−0.40−0.550.63
ETR−0.040.160.21−0.010.270.170.30−0.060.350.29−0.53−0.560.14−0.570.48
TC−0.19−0.100.06−0.17−0.260.130.140.000.26−0.78 *−0.63 *−0.75 *0.04−0.68 *0.81 *
ELOVL2PA−0.01−0.23−0.47 *0.26−0.160.020.20−0.290.51 *−0.07−0.19−0.06−0.110.290.26
ETR−0.240.020.170.050.45 *0.08−0.24−0.400.200.77 *−0.46 *−0.160.46−0.34−0.17
TC0.190.07−0.110.01−0.210.130.13−0.240.41 *0.000.17−0.48 *−0.11−0.32−0.35
ELOVL3PA0.02−0.16−0.25−0.15−0.28−0.06−0.22−0.270.020.350.140.190.11−0.05−0.54
ETR−0.01−0.36−0.31−0.34−0.290.20−0.54−0.46−0.150.260.07−0.080.16−0.360.00
TC0.21−0.44 *−0.35−0.46 *−0.230.030−0.47−0.14−0.57 *0.010.44−0.38−0.41−0.22−0.34
ELOVL4PA−0.38−0.090.03−0.24−0.52 *−0.520.270.380.20−0.42−0.01−0.25−0.14−0.290.00
ETR−0.380.240.63 *−0.260.01−0.050.260.55−0.17−0.12−0.49−0.290.24−0.47−0.15
TC−0.12−0.41−0.42−0.32−0.40−0.04−0.30−0.410.01−0.69 *−0.04−0.49−0.03−0.660.34
ELOVL5PA−0.16−0.23−0.320.05−0.060.080.270.110.350.230.15−0.12−0.410.050.37
ETR−0.360.43 *0.090.58 *0.270.140.23−0.130.39 *0.23−0.61 *0.82 *0.01−0.45 *0.15
TC−0.050.170.14−0.190.00−0.080.10−0.190.30−0.330.05−0.42 *0.25−0.71 *0.06
ELOVL6PA−0.210.050.130.18−0.08−0.350.130.290.10−0.19−0.26−0.26−0.600.38−0.11
ETR−0.150.220.36−0.020.240.320.24−0.220.38 *−0.33−0.34−0.17−0.07−0.52 *0.22
TC0.250.02−0.15−0.12−0.110.29−0.20−0.30−0.01−0.090.29−0.050.00−0.21−0.23
ELOVL7PA0.12−0.04−0.350.22−0.280.100.55 *−0.070.76 *−0.190.13−0.13−0.460.330.11
ETR−0.57 *0.270.460.18−0.28−0.500.500.360.25−0.71−0.550.010.36−0.02−0.73 *
TC−0.100.400.450.05−0.15−0.040.120.020.12−0.78 *−0.37−0.150.33−0.09−0.39
The values of Spearman’s rank correlation coefficients are given. * Statistically significant correlation of the expression of two genes/locations (p < 0.05). PA—peritumoral area; ETR—enhancing tumor region; TC—tumor core.
Publisher’s Note: MDPI stays neutral with regard to jurisdictional claims in published maps and institutional affiliations.

