
Is There a Relationship between the Elasticity of Brain Tumors, Changes in Diffusion Tensor Imaging, and Histological Findings? A Pilot Study Using Intraoperative Ultrasound Elastography

 ,
,  ,
,
Abstract
:
1. Introduction
2. Materials and Methods
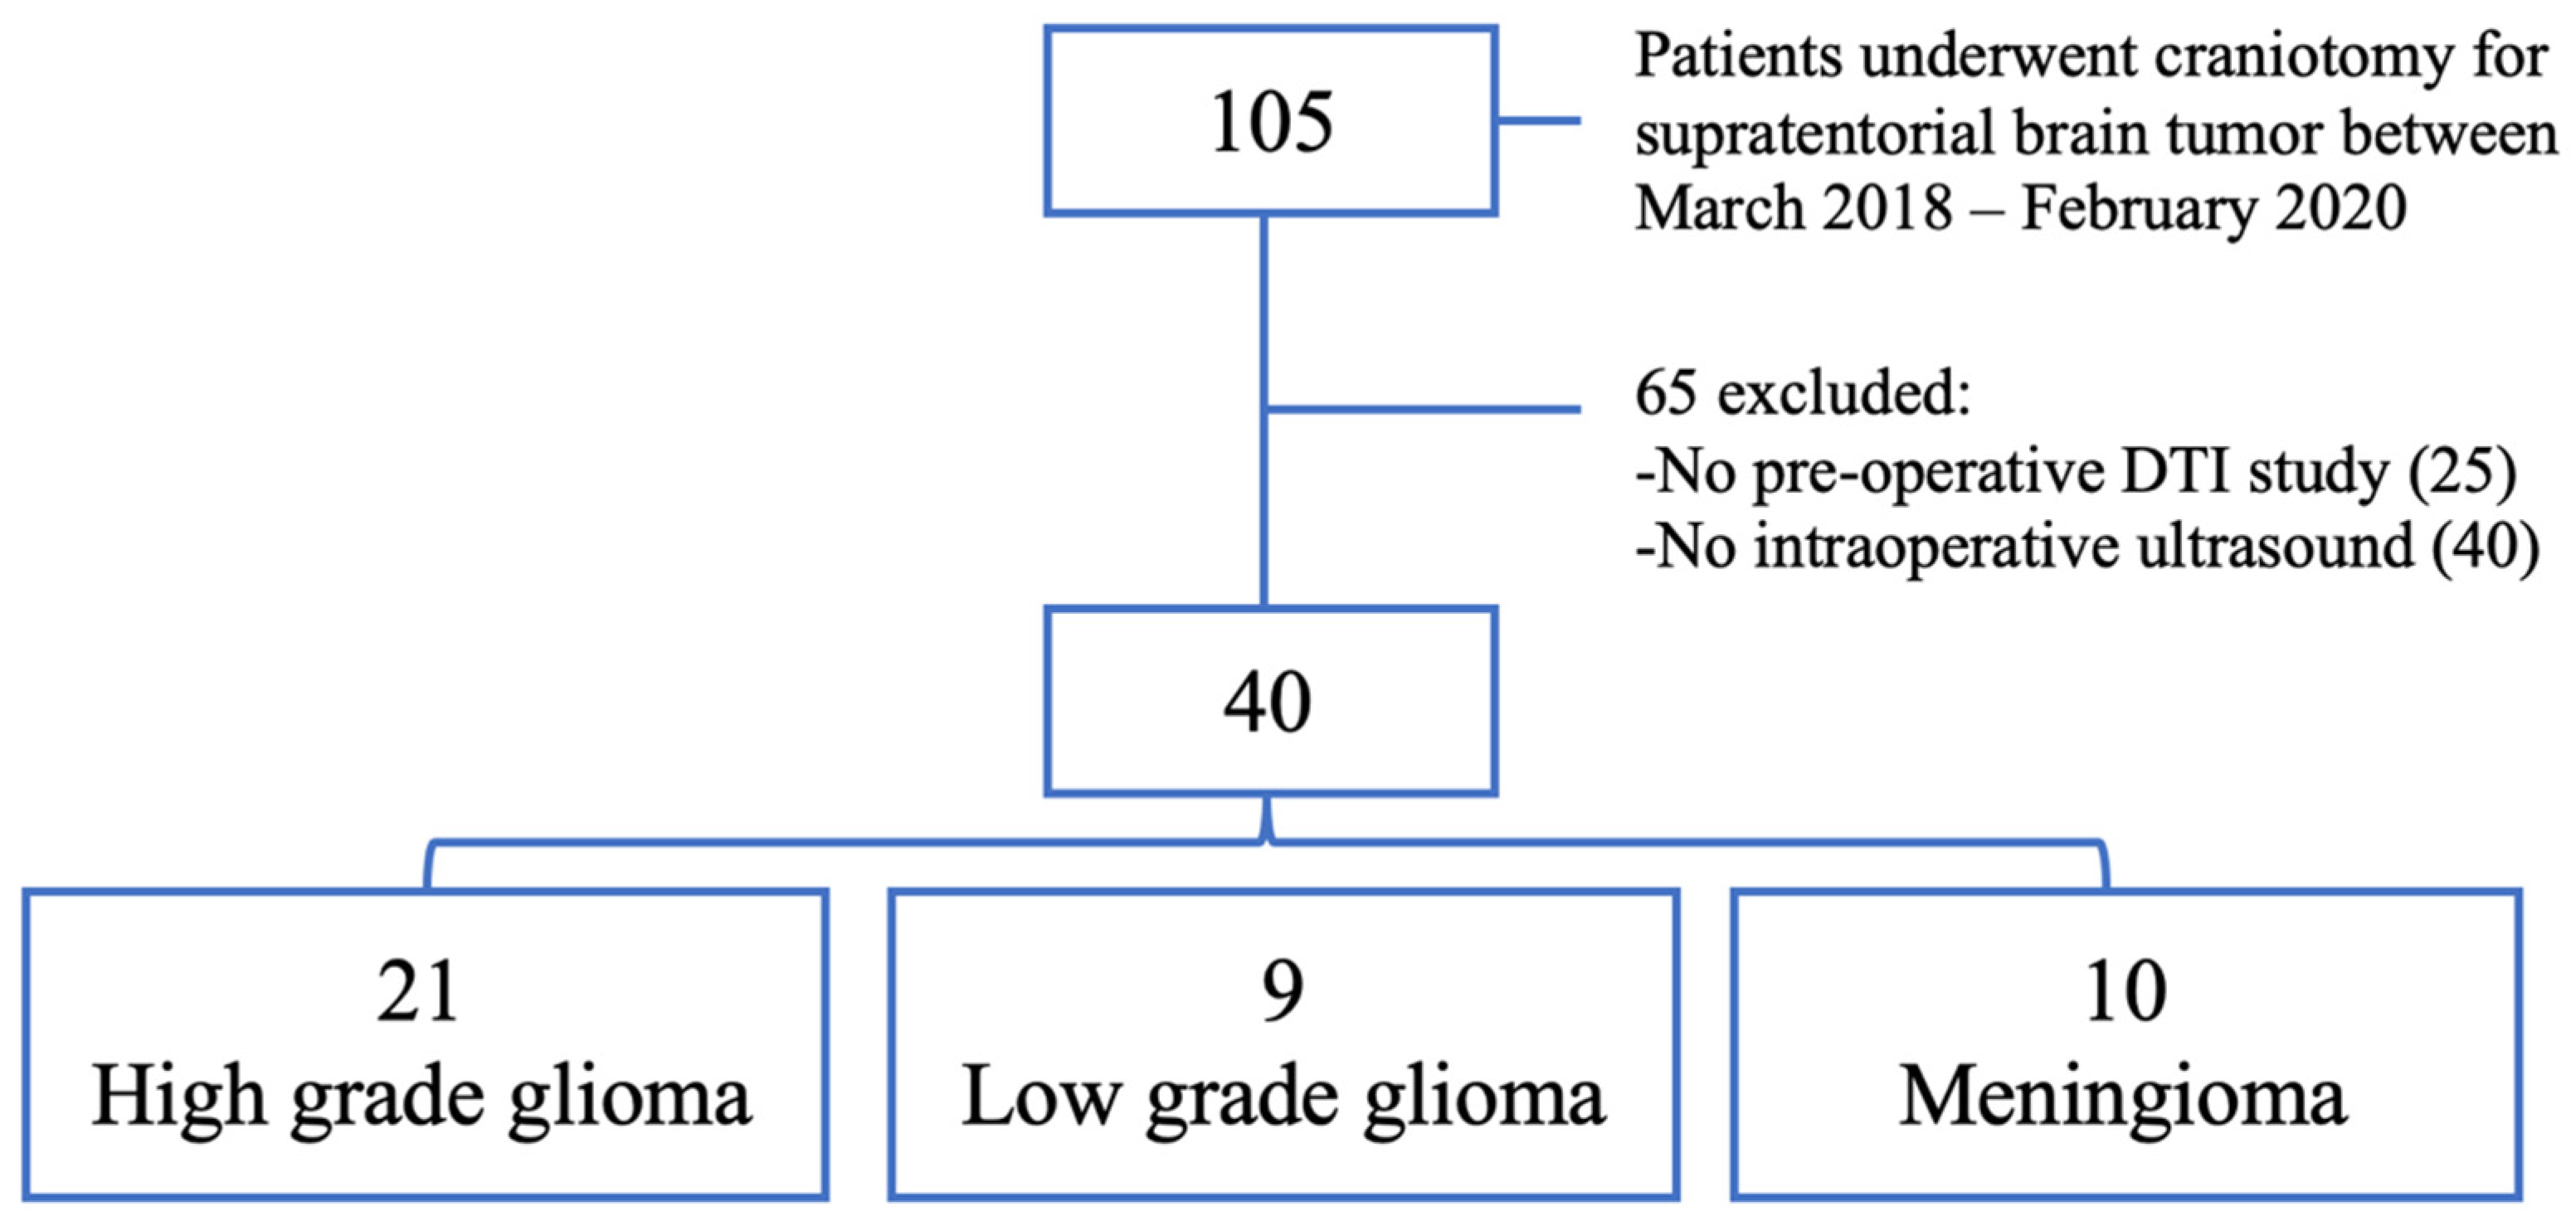
2.1. Patient Selection
2.2. Histological Technique
2.3. Acquisition and Image Processing
2.4. Statistical Analysis
3. Results
4. Discussion
5. Conclusions
Supplementary Materials
Author Contributions
Funding
Institutional Review Board Statement
Informed Consent Statement
Data Availability Statement
Acknowledgments
Conflicts of Interest
References
- Berg, W.A.; Cosgrove, D.O.; Doré, C.J.; Schäfer, F.K.W.; Svensson, W.E.; Hooley, R.J.; Ohlinger, R.; Mendelson, E.B.; Balu-Maestro, C.; Locatelli, M.; et al. Shear-wave elastography improves the specificity of breast US: The BE1 multinational study of 939 masses. Radiology 2012, 262, 435–449. [Google Scholar] [CrossRef] [PubMed]
- Bhatia, K.S.S.; Tong, C.S.L.; Cho, C.C.M.; Yuen, E.H.Y.; Lee, Y.Y.P.; Ahuja, A.T. Shear wave elastography of thyroid nodules in routine clinical practice: Preliminary observations and utility for detecting malignancy. Eur. Radiol. 2012, 22, 2397–2406. [Google Scholar] [CrossRef]
- Ferraioli, G.; Parekh, P.; Levitov, A.B.; Filice, C. Shear wave elastography for evaluation of liver fibrosis. J. Ultrasound Med. 2014, 33, 197–203. [Google Scholar] [CrossRef] [PubMed]
- Chakraborty, A.; Berry, G.; Bamber, J.; Dorward, N. Intra-operative ultrasound elastography and registered magnetic resonance imaging of brain tumours: A feasibility study. Ultrasound 2006, 14, 43–49. [Google Scholar] [CrossRef]
- Wu, D.-F.; He, W.; Lin, S.; Zee, C.-S.; Han, B. The real-time ultrasonography for fusion image in glioma neurosugery. Clin. Neurol. Neurosurg. 2018, 175, 84–90. [Google Scholar] [CrossRef]
- Chauvet, D.; Imbault, M.; Capelle, L.; Demene, C.; Mossad, M.; Karachi, C.; Boch, A.-L.; Gennisson, J.-L.; Tanter, M. In vivo measurement of brain tumor elasticity using intraoperative shear wave elastography. Ultraschall Med. Eur. J. Ultrasound 2015, 37, 584–590. [Google Scholar] [CrossRef]
- Selbekk, T.; Bang, J.; Unsgaard, G. Strain processing of intraoperative ultrasound images of brain tumours: Initial results. Ultrasound Med. Biol. 2005, 31, 45–51. [Google Scholar] [CrossRef]
- Selbekk, T.; Brekken, R.; Indergaard, M.; Solheim, O.; Unsgård, G. Comparison of contrast in brightness mode and strain ultrasonography of glial brain tumours. BMC Med. Imaging 2012, 12, 11. [Google Scholar] [CrossRef]
- Prada, F.; Del Bene, M.; Rampini, A.; Mattei, L.; Casali, C.; Vetrano, I.G.; Gennari, A.G.; Sdao, S.; Saini, M.; Sconfienza, L.M.; et al. Intraoperative strain elastosonography in brain tumor surgery. Oper. Neurosurg. 2018, 17, 227–236. [Google Scholar] [CrossRef] [PubMed]
- Scholz, M.; Noack, V.; Pechlivanis, I.; Engelhardt, M.; Fricke, B.; Linstedt, U.; Brendel, B.; Schmieder, K.; Ermert, H.; Harders, A. Vibrography during tumor neurosurgery. J. Ultrasound Med. 2005, 24, 985–992. [Google Scholar] [CrossRef]
- Cepeda, S.; Barrena, C.; Arrese, I.; Fernandez-Pérez, G.; Sarabia, R. Intraoperative ultrasonographic elastography: A semi-quantitative analysis of brain tumor elasticity patterns and peritumoral region. World Neurosurg. 2020, 135, e258–e270. [Google Scholar] [CrossRef] [PubMed]
- Clark, C.A.; Barrick, T.R.; Murphy, M.M.; Bell, B. White matter fiber tracking in patients with space-occupying lesions of the brain: A new technique for neurosurgical planning? NeuroImage 2003, 20, 1601–1608. [Google Scholar] [CrossRef] [PubMed]
- Goebell, E.; Paustenbach, S.; Vaeterlein, O.; Ding, X.-Q.; Heese, O.; Fiehler, J.; Kucinski, T.; Hagel, C.; Westphal, M.; Zeumer, H. Low-grade and anaplastic gliomas: Differences in architecture evaluated with diffusion-tensor MR imaging. Radiology 2006, 239, 217–222. [Google Scholar] [CrossRef]
- Chen, W.-J.; He, D.-S.; Tang, R.-X.; Ren, F.-H.; Chen, G. Ki-67 is a valuable prognostic factor in gliomas: Evidence from a systematic review and meta-analysis. Asian Pac. J. Cancer Prev. 2015, 16, 411–420. [Google Scholar] [CrossRef] [PubMed] [Green Version]
- Paparo, F.; Corradi, F.; Cevasco, L.; Revelli, M.; Marziano, A.; Molini, L.; Cenderello, G.; Cassola, G.; Rollandi, G.A. Real-time elastography in the assessment of liver fibrosis: A review of qualitative and semi-quantitative methods for elastogram analysis. Ultrasound Med. Biol. 2014, 40, 1923–1933. [Google Scholar] [CrossRef] [PubMed] [Green Version]
- Orlacchio, A.; Bolacchi, F.; Antonicoli, M.; Coco, I.; Costanzo, E.; Tosti, D.; Francioso, S.; Angelico, M.; Simonetti, G. Liver elasticity in NASH patients evaluated with real-time lastography (RTE). Ultrasound Med. Biol. 2012, 38, 537–544. [Google Scholar] [CrossRef]
- Willmott, C.J.; Robeson, S.M.; Matsuura, K. A refined index of model performance. Int. J. Clim. 2012, 32, 2088–2094. [Google Scholar] [CrossRef]
- LeGates, D.R.; McCabe, G.J. Evaluating the use of “goodness-of-fit” measures in hydrologic and hydroclimatic model validation. Water Resour. Res. 1999, 35, 233–241. [Google Scholar] [CrossRef]
- Budday, S.; Sommer, G.; Birkl, C.; Langkammer, C.; Haybaeck, J.; Kohnert, J.; Bauer, M.; Paulsen, F.; Steinmann, P.; Kuhl, E.; et al. Mechanical characterization of human brain tissue. Acta Biomater. 2017, 48, 319–340. [Google Scholar] [CrossRef]
- Feng, Y.; Okamoto, R.J.; Namani, R.; Genin, G.M.; Bayly, P.V. Measurements of mechanical anisotropy in brain tissue and implications for transversely isotropic material models of white matter. J. Mech. Behav. Biomed. Mater. 2013, 23, 117–132. [Google Scholar] [CrossRef] [Green Version]
- Velardi, F.; Fraternali, F.; Angelillo, M. Anisotropic constitutive equations and experimental tensile behavior of brain tissue. Biomech. Model. Mechanobiol. 2005, 5, 53–61. [Google Scholar] [CrossRef]
- McCracken, P.J.; Manduca, A.; Felmlee, J.; Ehman, R.L. Mechanical transient-based magnetic resonance elastography. Magn. Reson. Med. 2005, 53, 628–639. [Google Scholar] [CrossRef] [PubMed]
- Kruse, S.A.; Rose, G.H.; Glaser, K.J.; Manduca, A.; Felmlee, J.P.; Jack, C.R.; Ehman, R.L. Magnetic resonance elastography of the brain. NeuroImage 2008, 39, 231–237. [Google Scholar] [CrossRef] [PubMed] [Green Version]
- Reiss-Zimmermann, M.; Streitberger, K.-J.; Sack, I.; Braun, J.; Arlt, F.; Fritzsch, D.; Hoffmann, K.-T. High resolution imaging of viscoelastic properties of intracranial tumours by multi-frequency magnetic resonance elastography. Clin. Neuroradiol. 2014, 25, 371–378. [Google Scholar] [CrossRef]
- Pepin, K.; McGee, K.; Arani, A.; Lake, D.; Glaser, K.; Manduca, A.; Parney, I.; Ehman, R.; Huston, J. MR elastography analysis of glioma stiffness and IDH1-mutation status. Am. J. Neuroradiol. 2017, 39, 31–36. [Google Scholar] [CrossRef] [Green Version]
- Jamin, Y.; Boult, J.K.; Philippe, G.; Popov, S.; Garteiser, P.; Ulloa, J.L.; Cummings, C.; Box, G.; Eccles, S.A.; Jones, C.; et al. Exploring the biomechanical properties of brain malignancies and their pathologic determinants in vivo with magnetic resonance elastography. Cancer Res. 2015, 75, 1216–1224. [Google Scholar] [CrossRef] [Green Version]
- Wang, K.; Ha, T.; Chen, X.; Li, S.; Ai, L.; Ma, J.; Dai, J. A combined diffusion tensor imaging and Ki-67 labeling index study for evaluating the extent of tumor infiltration using the F98 rat glioma model. J. Neuro-Oncol. 2018, 137, 259–268. [Google Scholar] [CrossRef]
- Johnson, C.L.; McGarry, M.D.; Gharibans, A.A.; Weaver, J.B.; Paulsen, K.D.; Wang, H.; Olivero, W.C.; Sutton, B.P.; Georgiadis, J.G. Local mechanical properties of white matter structures in the human brain. NeuroImage 2013, 79, 145–152. [Google Scholar] [CrossRef] [PubMed] [Green Version]
- Gerischer, L.M.; Fehlner, A.; Köbe, T.; Prehn, K.; Antonenko, D.; Grittner, U.; Braun, J.; Sack, I.; Flöel, A. Combining viscoelasticity, diffusivity and volume of the hippocampus for the diagnosis of Alzheimer’s disease based on magnetic resonance imaging. NeuroImage Clin. 2018, 18, 485–493. [Google Scholar] [CrossRef]
- Stadlbauer, A.; Ganslandt, O.; Buslei, R.; Hammen, T.; Gruber, S.; Moser, E.; Buchfelder, M.; Salomonowitz, E.; Nimsky, C. Gliomas: Histopathologic evaluation of changes in directionality and magnitude of water diffusion at diffusion-tensor MR imaging. Radiology 2006, 240, 803–810. [Google Scholar] [CrossRef] [PubMed]
- Kinoshita, M.; Hashimoto, N.; Goto, T.; Kagawa, N.; Kishima, H.; Izumoto, S.; Tanaka, H.; Fujita, N.; Yoshimine, T. Fractional anisotropy and tumor cell density of the tumor core show positive correlation in diffusion tensor magnetic resonance imaging of malignant brain tumors. NeuroImage 2008, 43, 29–35. [Google Scholar] [CrossRef] [PubMed]
- Provenzale, J.M.; McGraw, P.; Mhatre, P.; Guo, A.C.; Delong, D. Peritumoral brain regions in gliomas and meningiomas: Investigation with isotropic diffusion-weighted MR imaging and diffusion-tensor MR imaging1. Radiology 2004, 232, 451–460. [Google Scholar] [CrossRef]
- Deng, Z.; Yan, Y.; Zhong, D.; Yang, G.; Tang, W.; Lü, F.; Xie, B.; Liu, B. Quantitative analysis of glioma cell invasion by diffusion tensor imaging. J. Clin. Neurosci. 2010, 17, 1530–1536. [Google Scholar] [CrossRef] [PubMed]
- Beppu, T.; Inoue, T.; Shibata, Y.; Yamada, N.; Kurose, A.; Ogasawara, K.; Ogawa, A.; Kabasawa, H. Fractional anisotropy value by diffusion tensor magnetic resonance imaging as a predictor of cell density and proliferation activity of glioblastomas. Surg. Neurol. 2005, 63, 56–61. [Google Scholar] [CrossRef] [PubMed]
- Beppu, T.; Inoue, T.; Shibata, Y.; Kurose, A.; Arai, H.; Ogasawara, K.; Ogawa, A.; Nakamura, S.; Kabasawa, H. Measurement of fractional anisotropy using diffusion tensor MRI in supratentorial astrocytic tumors. J. Neuro-Oncol. 2003, 63, 109–116. [Google Scholar] [CrossRef] [PubMed]


| Variable | n |
|---|---|
| Age | 59.43 ± 12.13 |
| Sex | |
| Female | 21 (52.5%) |
| Male | 19 (47.5 %) |
| Preoperative KPS | 82.27 ± 10.93 |
| Histopathology | |
| High-grade gliomas | |
| Glioblastoma | 19 (47.5%) |
| Anaplastic astrocytoma grade III | 1 (2.5%) |
| Anaplastic oligodendroglioma grade III | 1 (2.5%) |
| Low-grade gliomas | |
| Astrocytoma grade II | 4 (10%) |
| Oligodendroglioma grade II | 5 (12.5%) |
| Meningiomas | |
| Meningioma grade I | 8 (20%) |
| Meningioma grade II | 2 (5%) |
| Tumor location | |
| Frontal | 25 (62.5%) |
| Parietal | 6 (15%) |
| Temporal | 6 (15%) |
| Occipital | 1 (2.5%) |
| Insular | 2 (5%) |
| Initial volume (cm3) | 38.64 ± 31.08 |
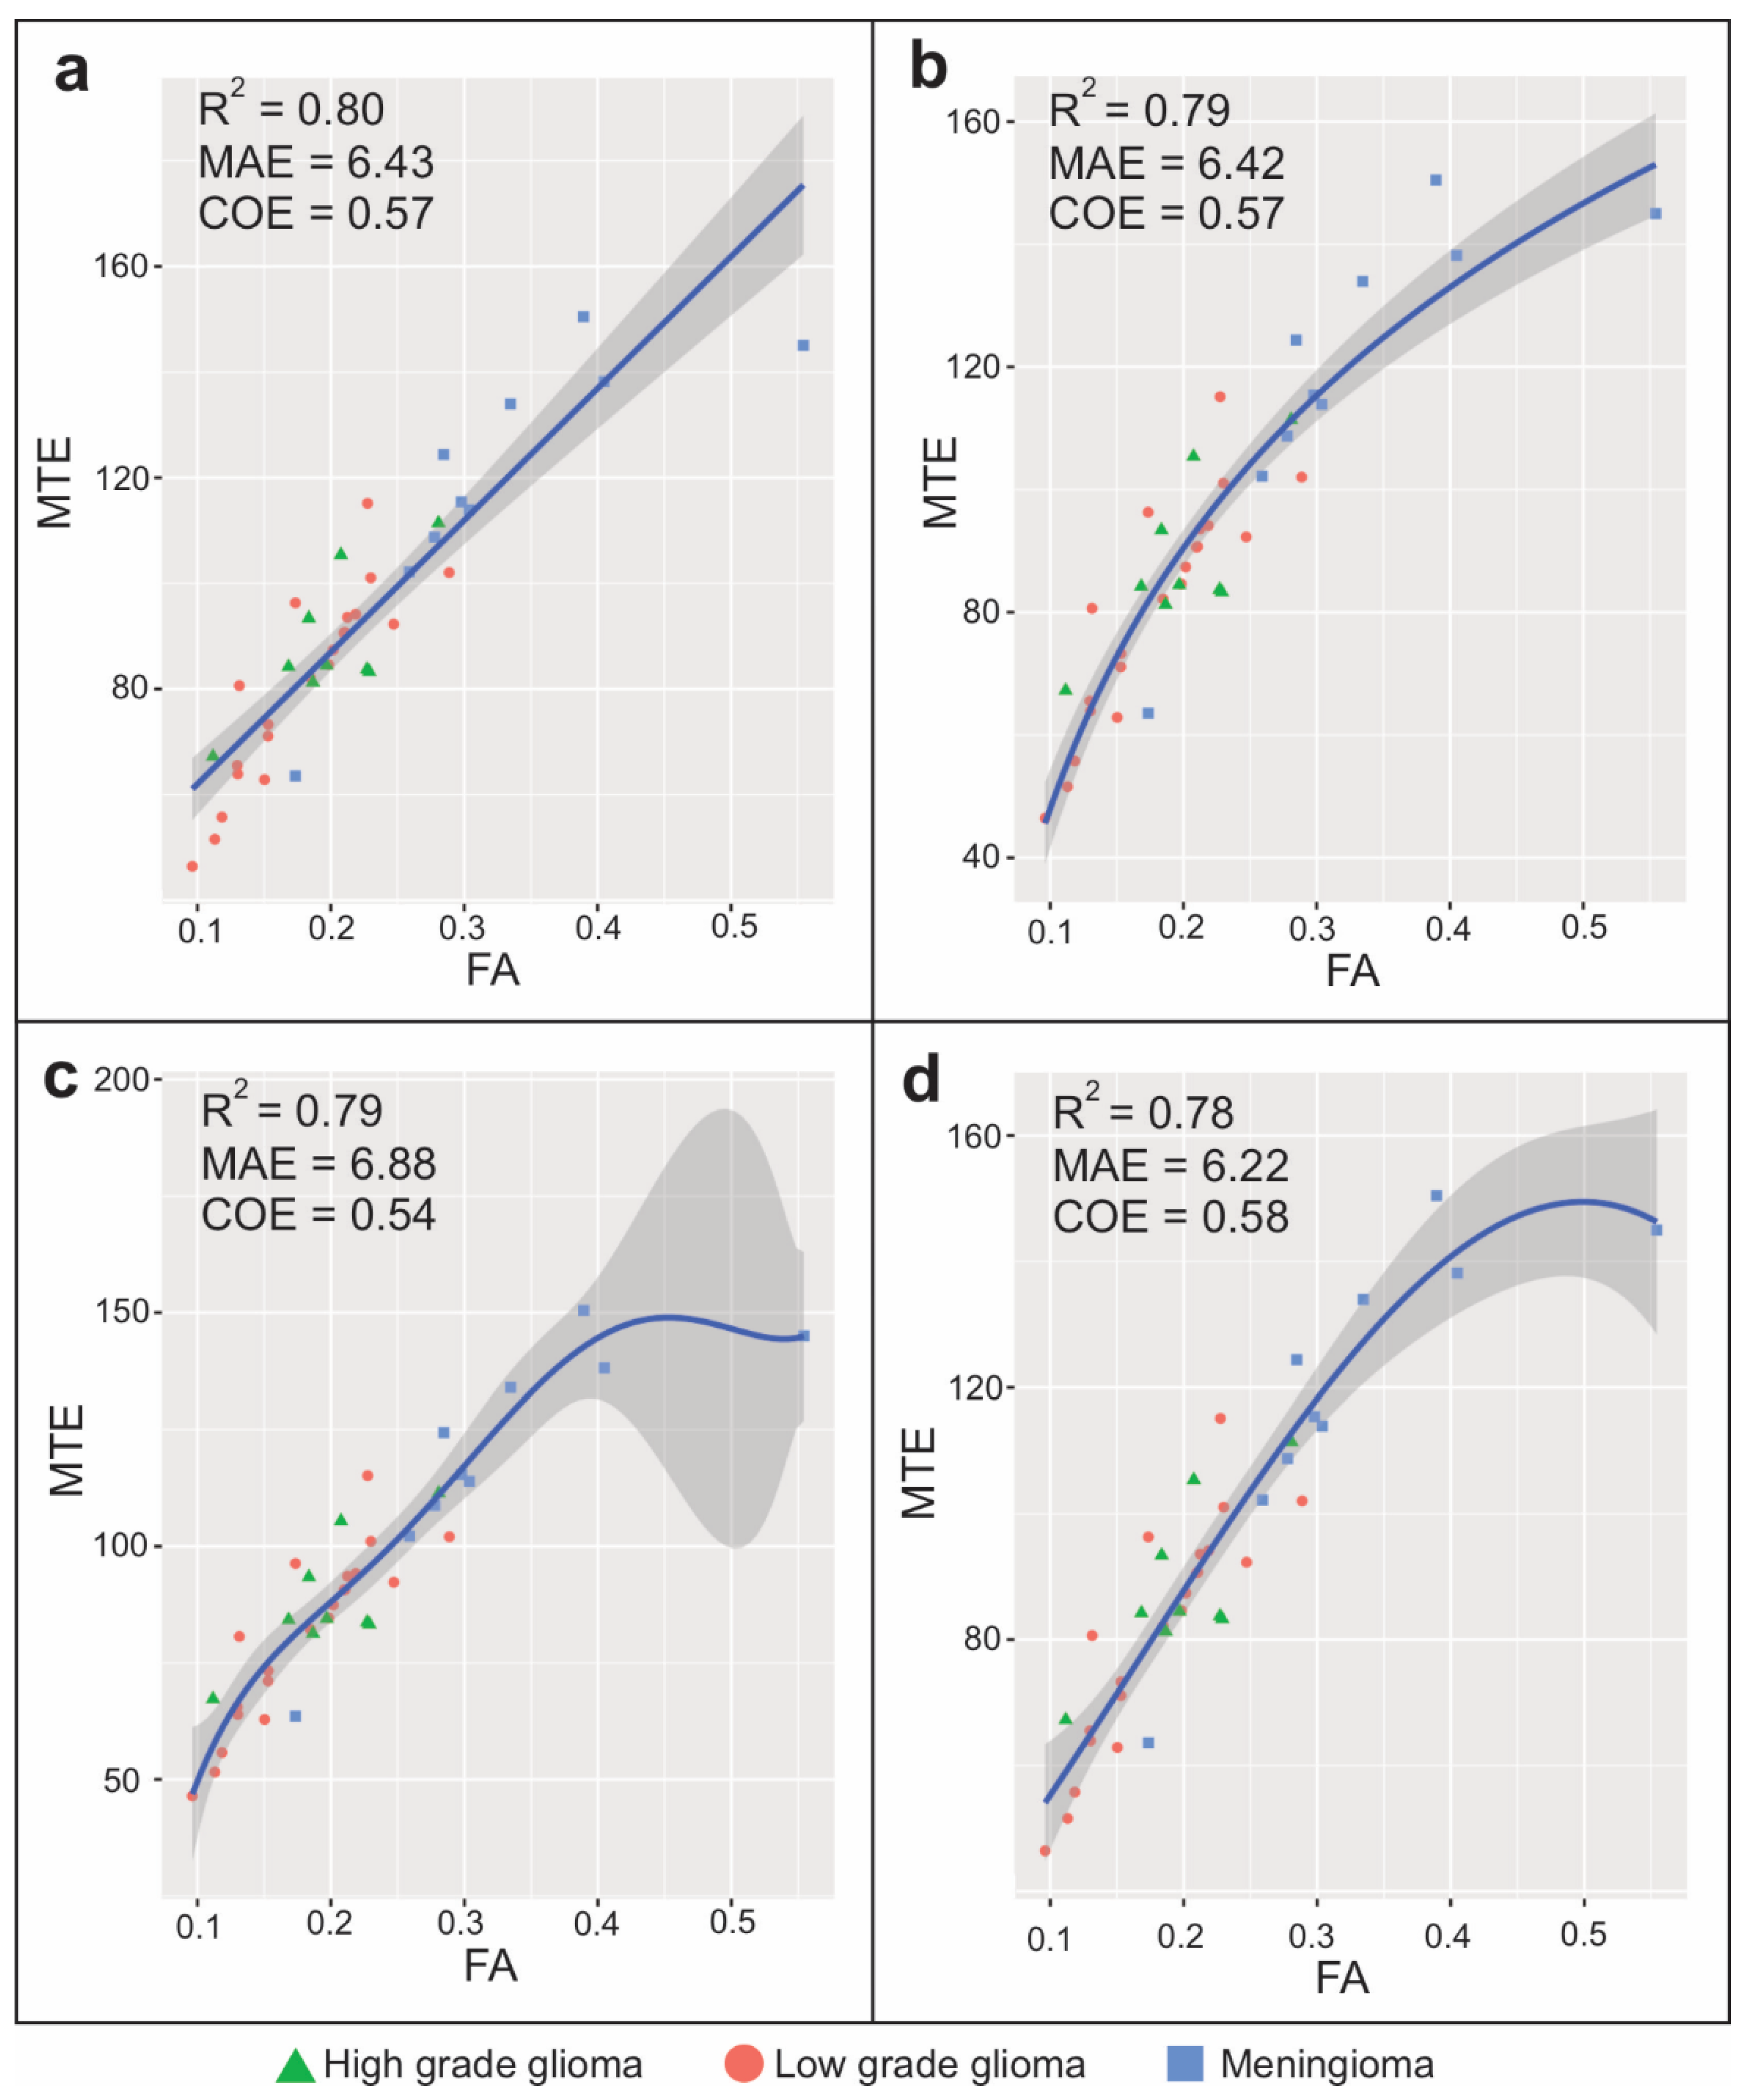
| Variable | AP | Descriptive Statistics | Kruskal–Wallis Test | Post hoc Dunn Test | Wilcoxon Rank Sum Test | ||||||||||
|---|---|---|---|---|---|---|---|---|---|---|---|---|---|---|---|
| n | Median | IQR | 95% CI | χ2 | df | p | ε2 | 95% IC | Comparison | p (Holm) | Z | p | r | ||
| MTE | 13.96 | 2 | <0.001 | 0.36 | 0.10–0.64 | ||||||||||
| High-grade glioma | 21 | 84.62 | 28.06 | 71.11–92.29 | HGG-LGG | 0.541 | |||||||||
| Low-grade glioma | 9 | 84.22 | 10.12 | 81.28–105.40 | HGG-MENINGIOMA | <0.001 | 3.59 | <0.001 | 0.65 | ||||||
| Meningioma | 10 | 119.90 | 27.08 | 108.76–139.49 | LGG-MENINGIOMA | 0.021 | 2.69 | 0.006 | 0.62 | ||||||
| FA | 16.10 | 2 | <0.001 | 0.41 | 0.18–0.66 | ||||||||||
| High-grade glioma | 21 | 0.18 | 0.08 | 0.15–0.21 | HGG-LGG | 0.549 | |||||||||
| Low-grade glioma | 9 | 0.20 | 0.04 | 0.17–0.23 | HGG-MENINGIOMA | <0.001 | 3.85 | <0.001 | 0.69 | ||||||
| Meningioma | 10 | 0.30 | 0.10 | 0.27–0.39 | LGG-MENINGIOMA | 0.011 | 2.94 | 0.002 | 0.67 | ||||||
| MD | 13.85 | 2 | <0.001 | 0.36 | 0.15–0.60 | ||||||||||
| High-grade glioma | 21 | 1.32 | 0.61 | 1.11–1.60 | HGG LGG | 0.607 | |||||||||
| Low-grade glioma | 9 | 1.36 | 0.10 | 1.26–1.40 | HGG-MENINGIOMA | 0.002 | 3.29 | 0.001 | 0.59 | ||||||
| Meningioma | 10 | 0.82 | 0.14 | 0.71–1.03 | LGG-MENINGIOMA | 0.002 | 3.27 | <0.001 | 0.75 | ||||||
| AD | 9.64 | 2 | 0.008 | 0.25 | 0.07–0.52 | ||||||||||
| High-grade glioma | 21 | 1.60 | 0.58 | 1.26–1.76 | HGG-LGG | 0.419 | |||||||||
| Low-grade glioma | 9 | 1.64 | 0.11 | 1.55–1.78 | HGG-MENINGIOMA | 0.019 | 2.58 | 0.009 | 0.46 | ||||||
| Meningioma | 10 | 1.09 | 0.22 | 0.92–1.30 | LGG-MENINGIOMA | 0.012 | 2.86 | 0.003 | 0.66 | ||||||
| RD | 15.27 | 2 | <0.001 | 0.39 | 0.19–0.60 | ||||||||||
| High-grade glioma | 21 | 1.15 | 0.58 | 1.01–1.47 | HGG-LGG | 0.602 | |||||||||
| Low-grade glioma | 9 | 1.17 | 0.12 | 1.11–1.28 | HGG-MENINGIOMA | 0.001 | 3.47 | <0.001 | 0.62 | ||||||
| Meningioma | 10 | 0.69 | 0.18 | 0.57–0.87 | LGG-MENINGIOMA | 0.001 | 3.43 | <0.001 | 0.79 | ||||||
| Ki-67 | 22.04 | 2 | <0.001 | 0.57 | 0.39–0.73 | ||||||||||
| High-grade glioma | 21 | 35 | 10 | 30–38 | HGG-LGG | 0.001 | 3.29 | <0.001 | 0.60 | ||||||
| Low-grade glioma | 9 | 10 | 17 | 2–30 | HGG-MENIN | <0.001 | 4.21 | <0.001 | 0.76 | ||||||
| Meningioma | 10 | 8 | 7.5 | 4–15.5 | LGG-MENIN | 0.609 | |||||||||
| Variable | Ki-67 | Wilcoxon–Mann–Whitney Test | ||||
|---|---|---|---|---|---|---|
| Low (<10%) | High (>10%) | U | Z | p | r | |
| MTE | 110.34 (28.03) | 79.99 (23.15) | 48 | 3.38 | <0.001 | 0.53 |
| FA | 0.24 (0.16) | 0.19 (0.06) | 86 | 2.31 | 0.020 | 0.36 |
| MD | 1.04 (0.47) | 1.22 (0.25) | 189 | 0.89 | 0.373 | 0.14 |
| AD | 1.29 (0.36) | 1.43 (0.30) | 175 | 0.47 | 0.649 | 0.07 |
| RD | 0.91 (0.53) | 1.10 (0.26) | 197 | 1.20 | 0.238 | 0.19 |
Publisher’s Note: MDPI stays neutral with regard to jurisdictional claims in published maps and institutional affiliations. |
© 2021 by the authors. Licensee MDPI, Basel, Switzerland. This article is an open access article distributed under the terms and conditions of the Creative Commons Attribution (CC BY) license (http://creativecommons.org/licenses/by/4.0/).
Share and Cite
Cepeda, S.; García-García, S.; Velasco-Casares, M.; Fernández-Pérez, G.; Zamora, T.; Arrese, I.; Sarabia, R. Is There a Relationship between the Elasticity of Brain Tumors, Changes in Diffusion Tensor Imaging, and Histological Findings? A Pilot Study Using Intraoperative Ultrasound Elastography. Brain Sci. 2021, 11, 271. https://doi.org/10.3390/brainsci11020271
Cepeda S, García-García S, Velasco-Casares M, Fernández-Pérez G, Zamora T, Arrese I, Sarabia R. Is There a Relationship between the Elasticity of Brain Tumors, Changes in Diffusion Tensor Imaging, and Histological Findings? A Pilot Study Using Intraoperative Ultrasound Elastography. Brain Sciences. 2021; 11(2):271. https://doi.org/10.3390/brainsci11020271
Chicago/Turabian StyleCepeda, Santiago, Sergio García-García, María Velasco-Casares, Gabriel Fernández-Pérez, Tomás Zamora, Ignacio Arrese, and Rosario Sarabia. 2021. "Is There a Relationship between the Elasticity of Brain Tumors, Changes in Diffusion Tensor Imaging, and Histological Findings? A Pilot Study Using Intraoperative Ultrasound Elastography" Brain Sciences 11, no. 2: 271. https://doi.org/10.3390/brainsci11020271