Cerebellar Transcranial Magnetic Stimulation Reduces the Silent Period on Hand Muscle Electromyography During Force Control

 , ,
, ,
Abstract
:1. Introduction
2. Materials and Methods
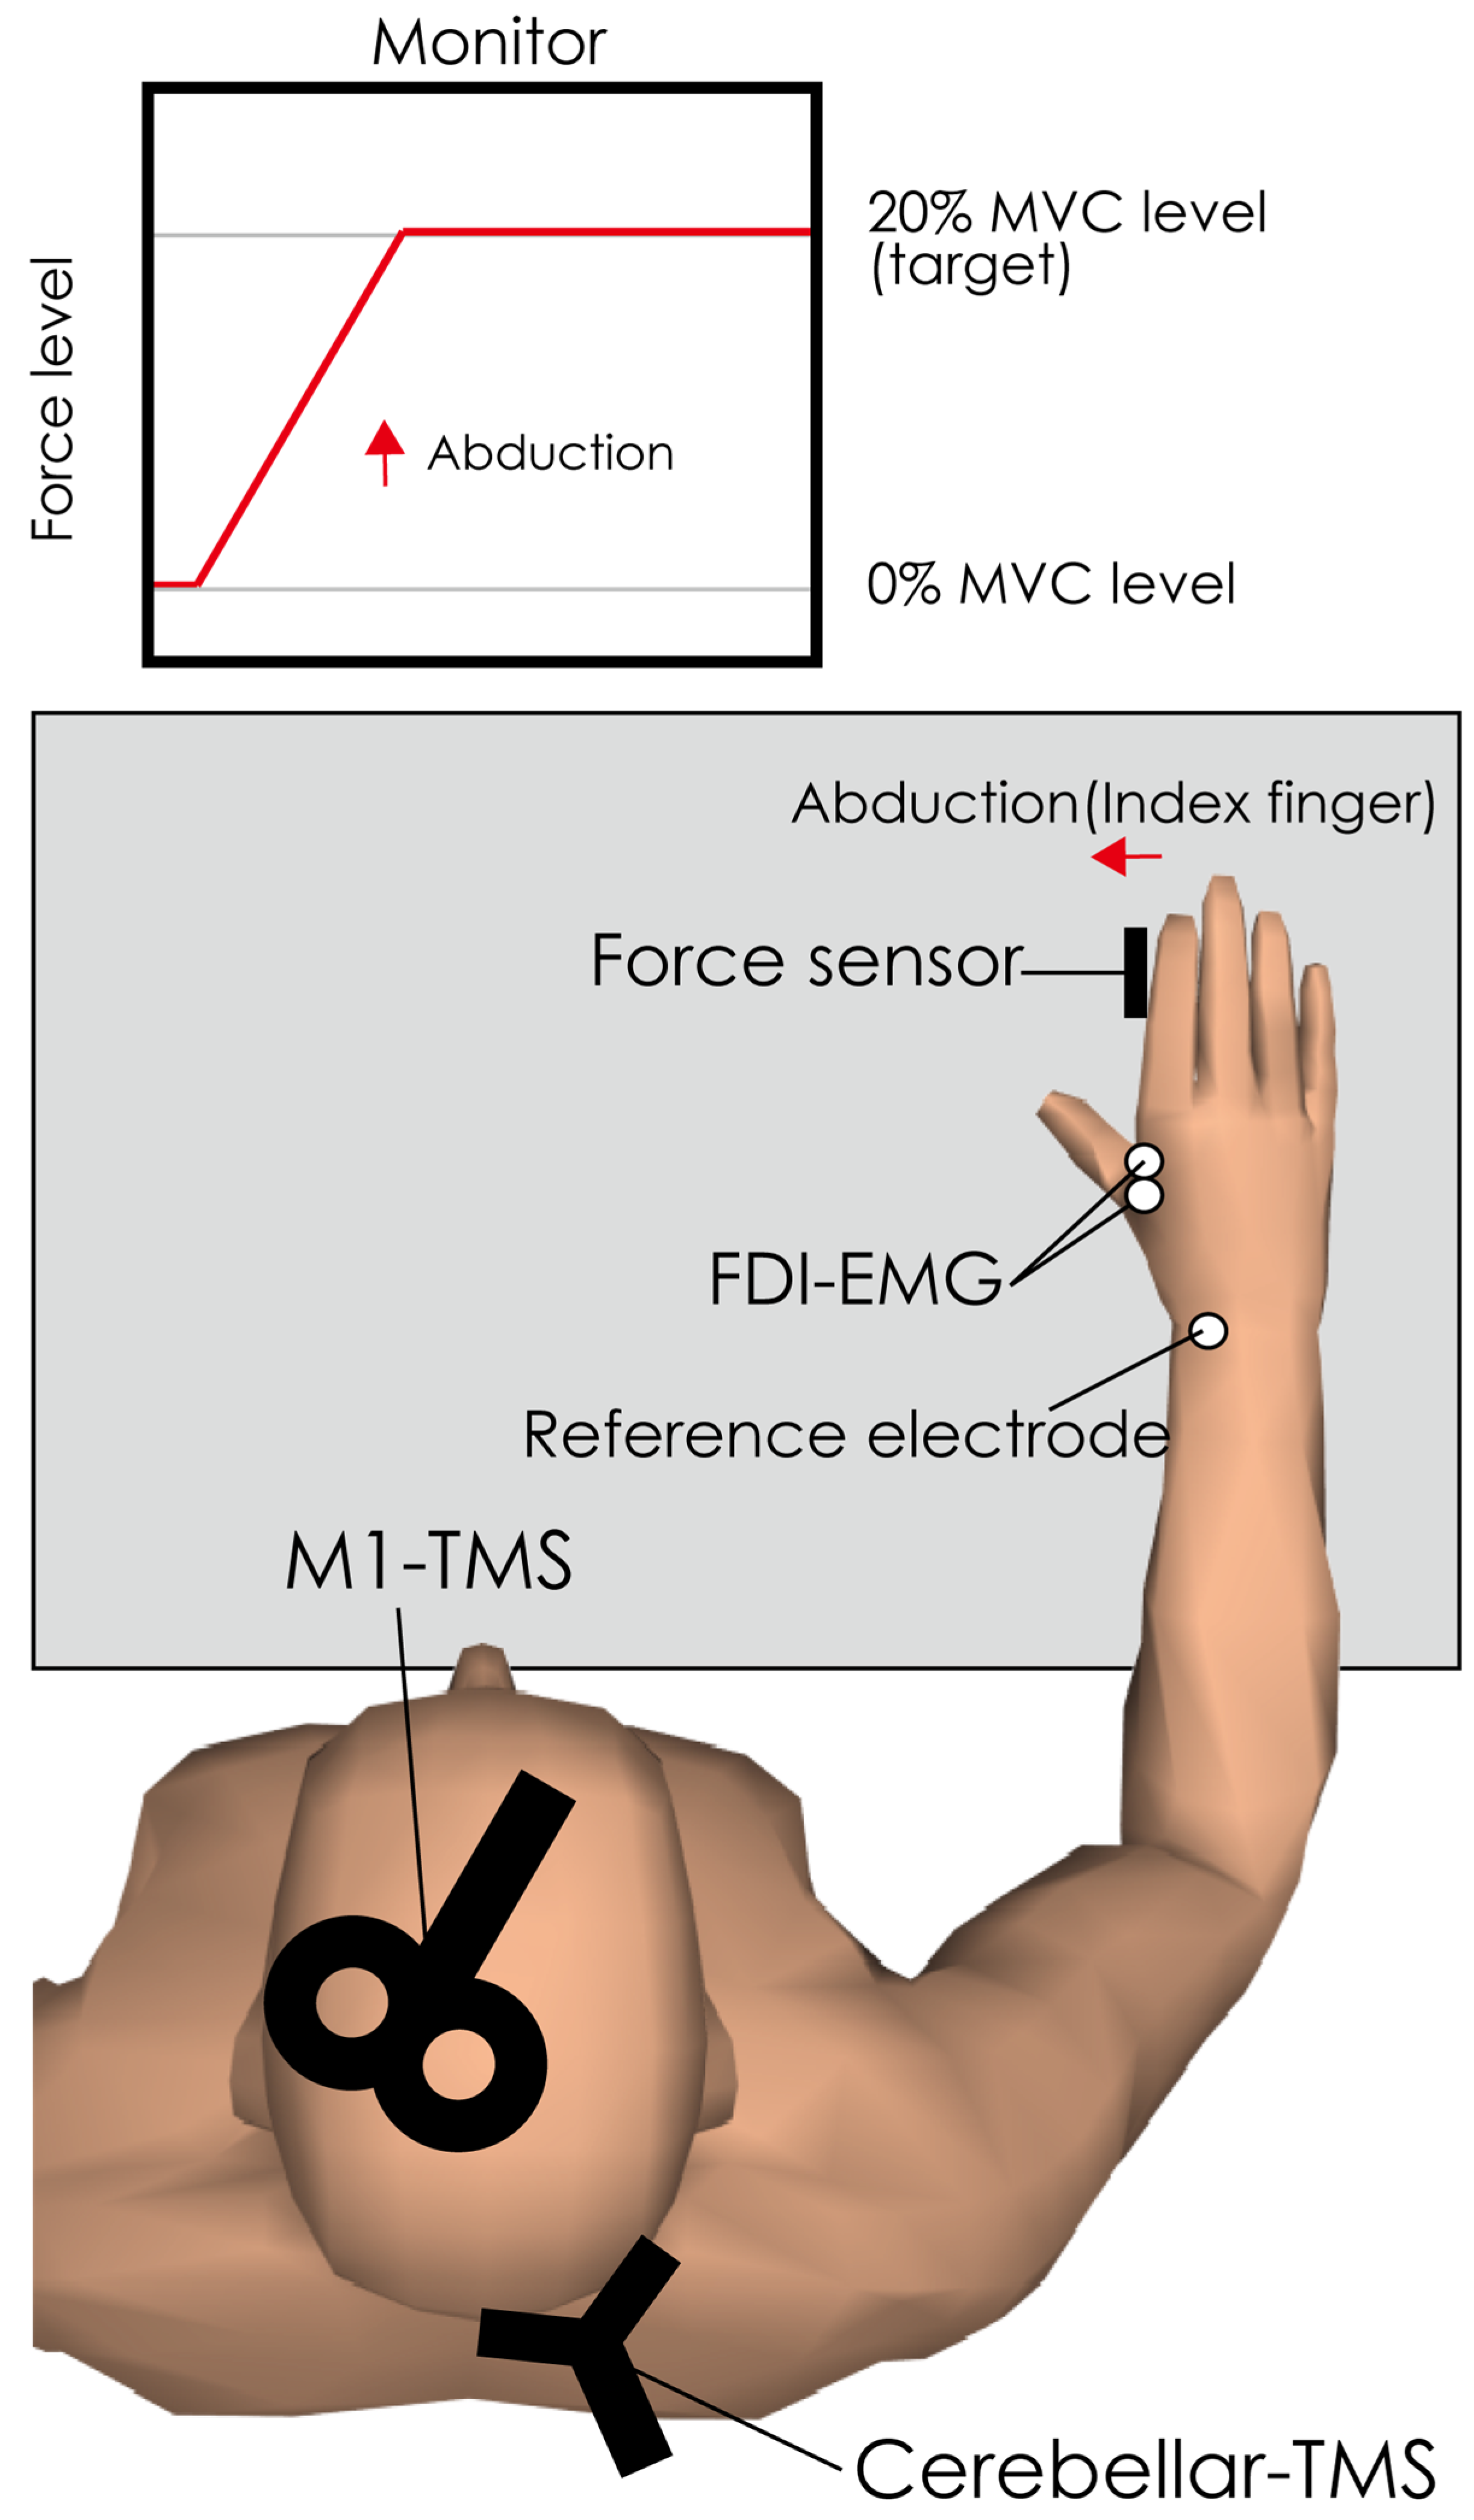
2.1. Participants
2.2. EMG Recordings
2.3. TMS over M1 (as Test Stimulation)
2.4. TMS over Cerebellum (as Conditioning Stimulation)
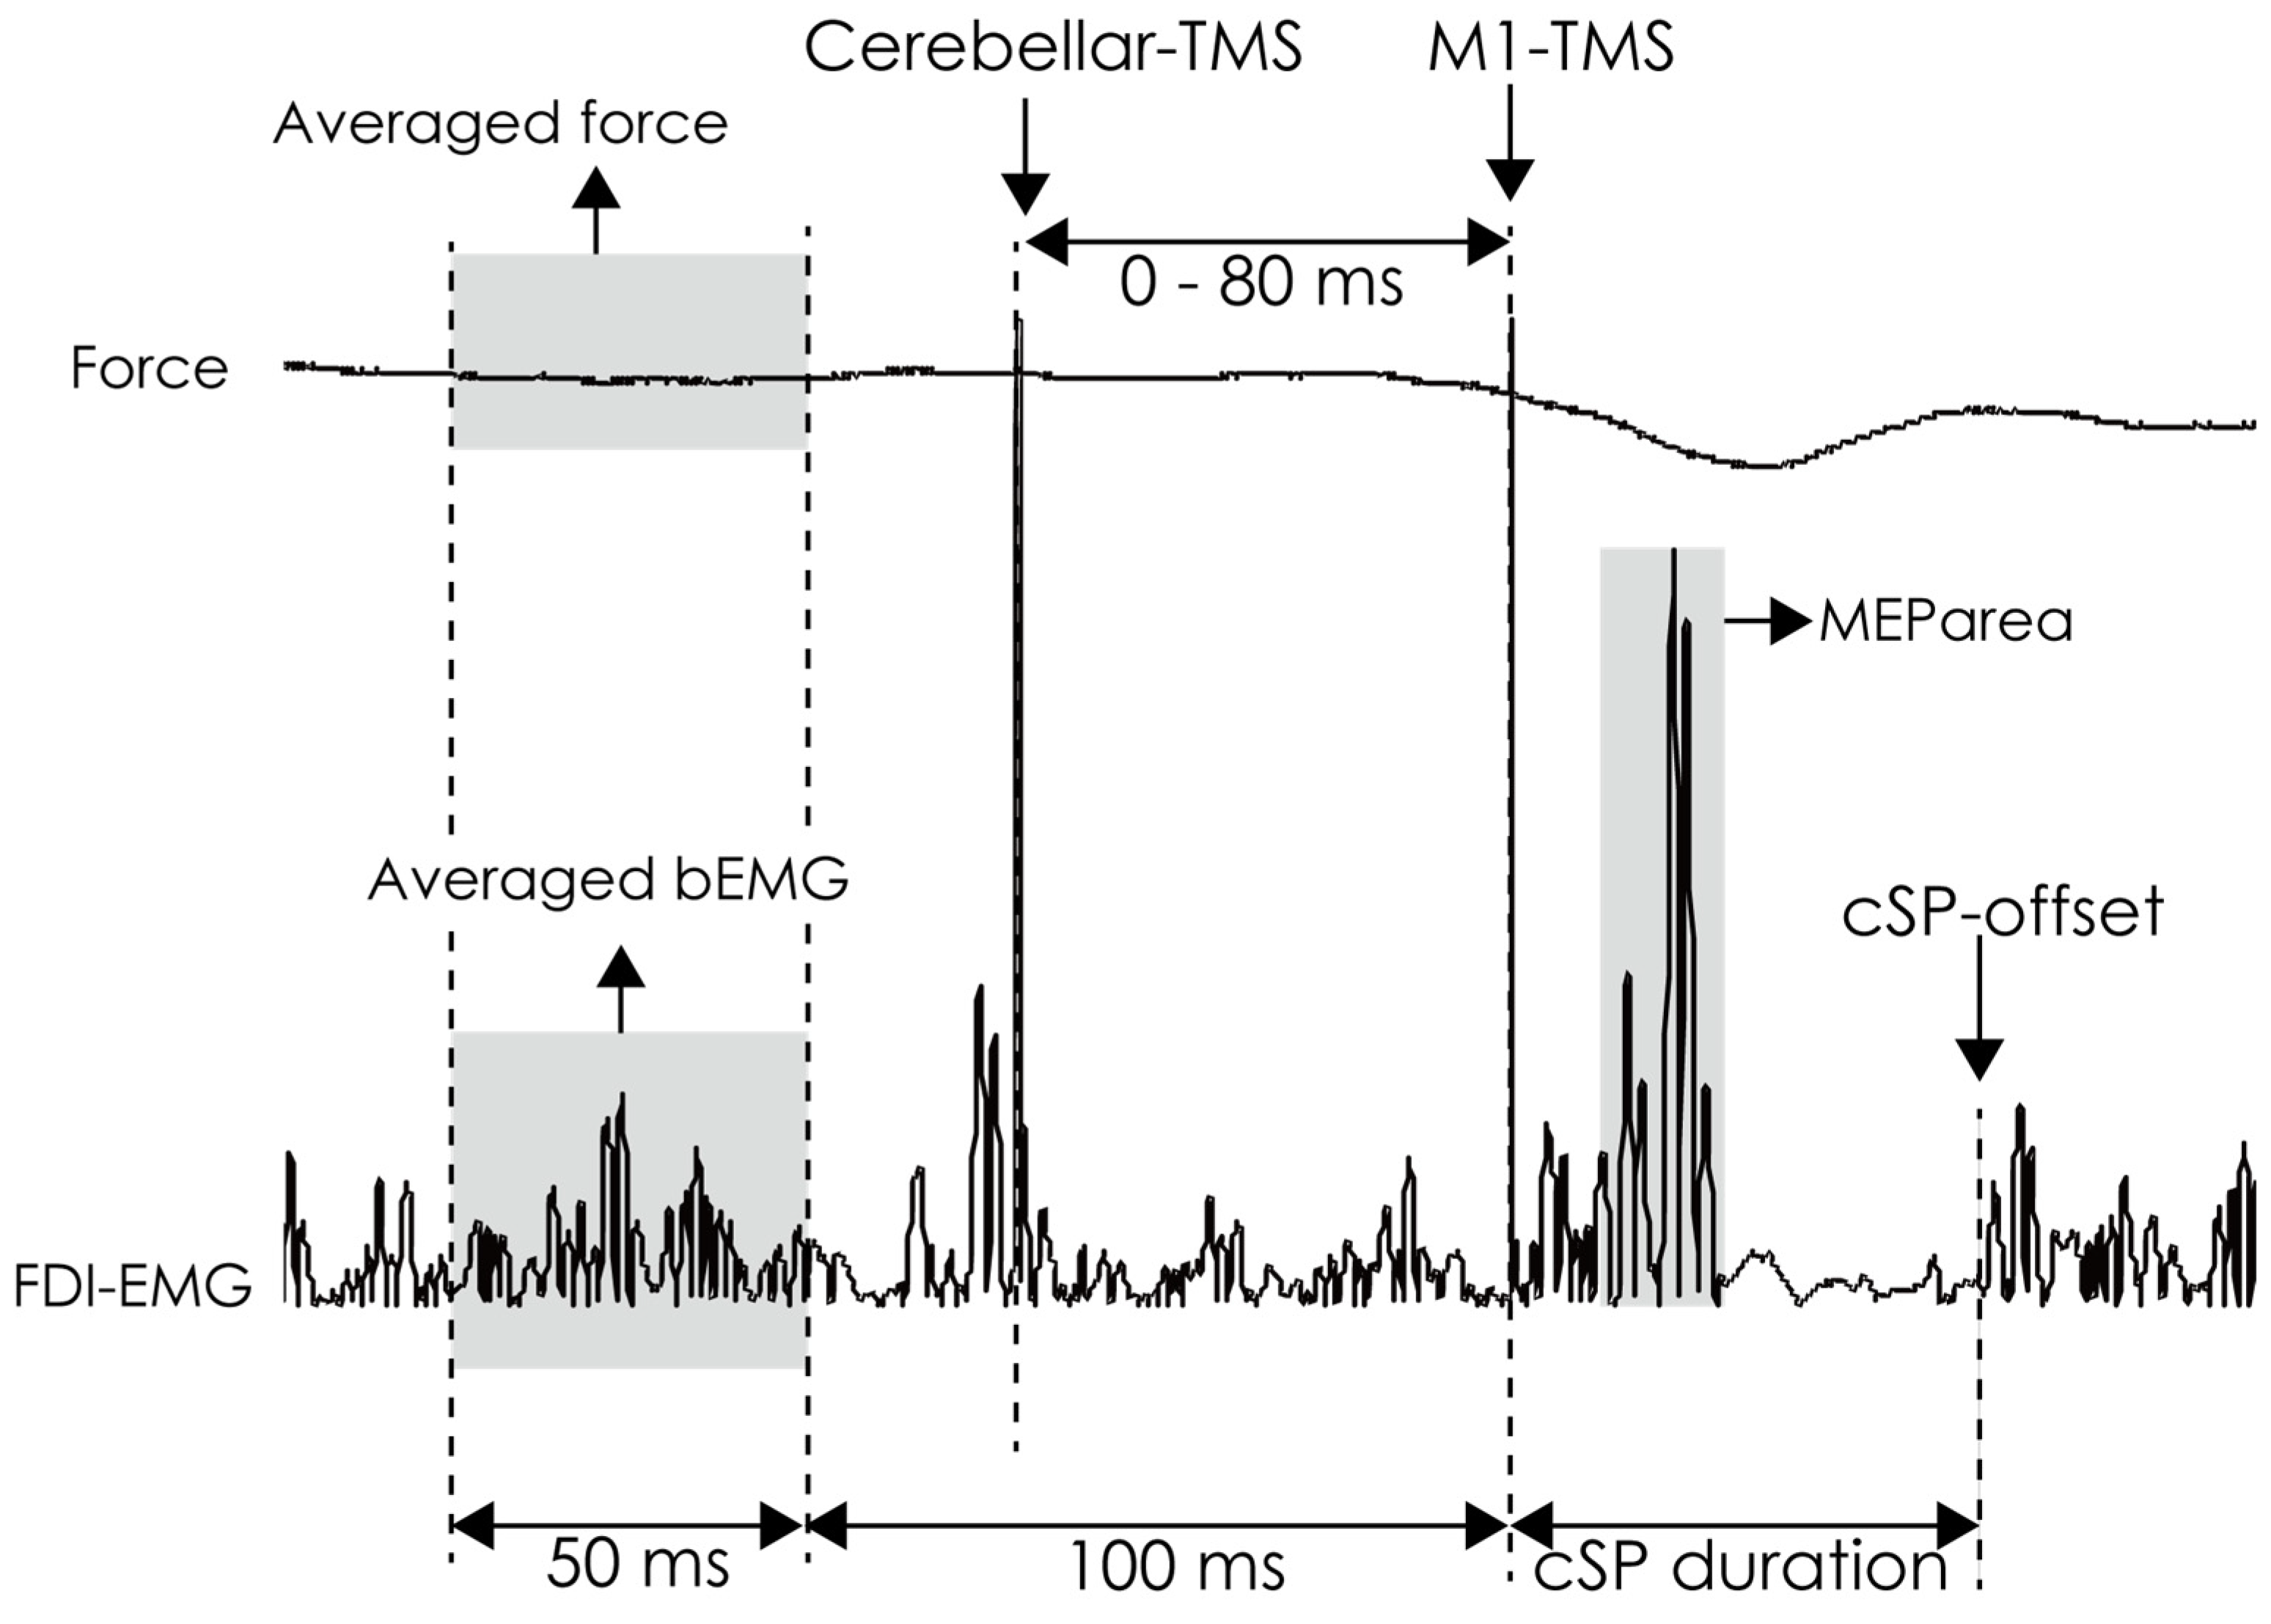
2.5. Procedure
2.6. Data Analysis
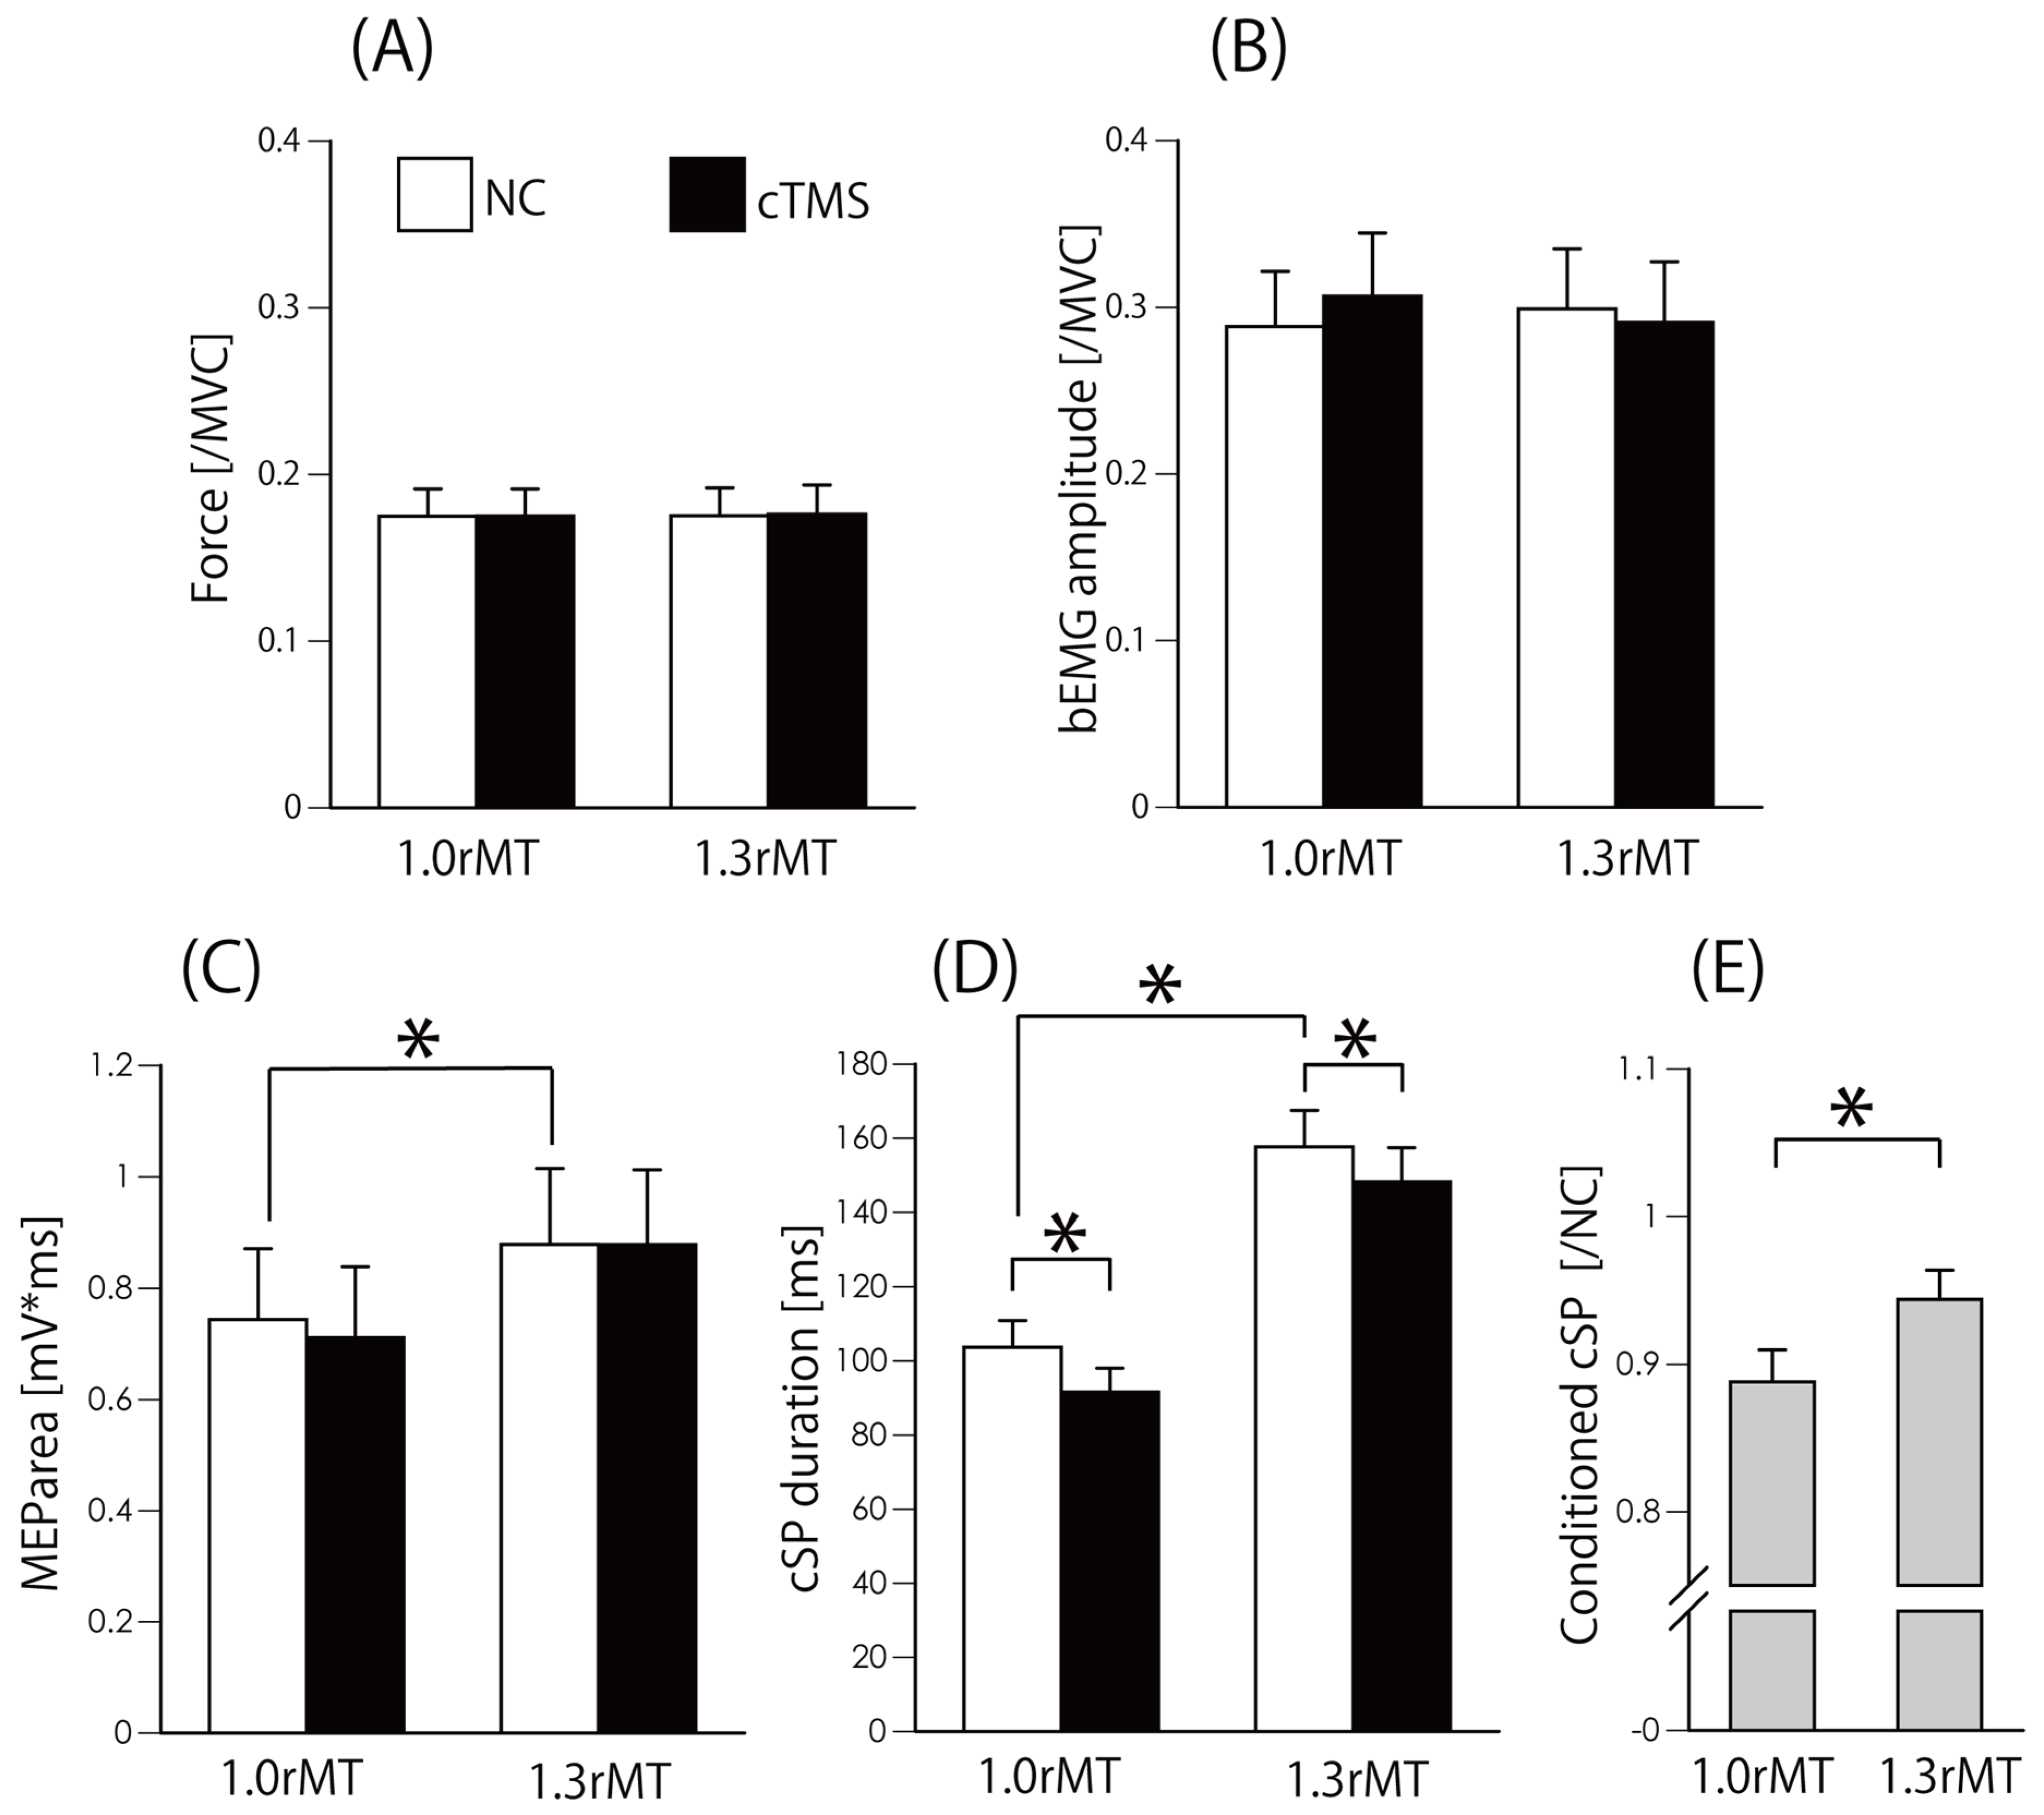
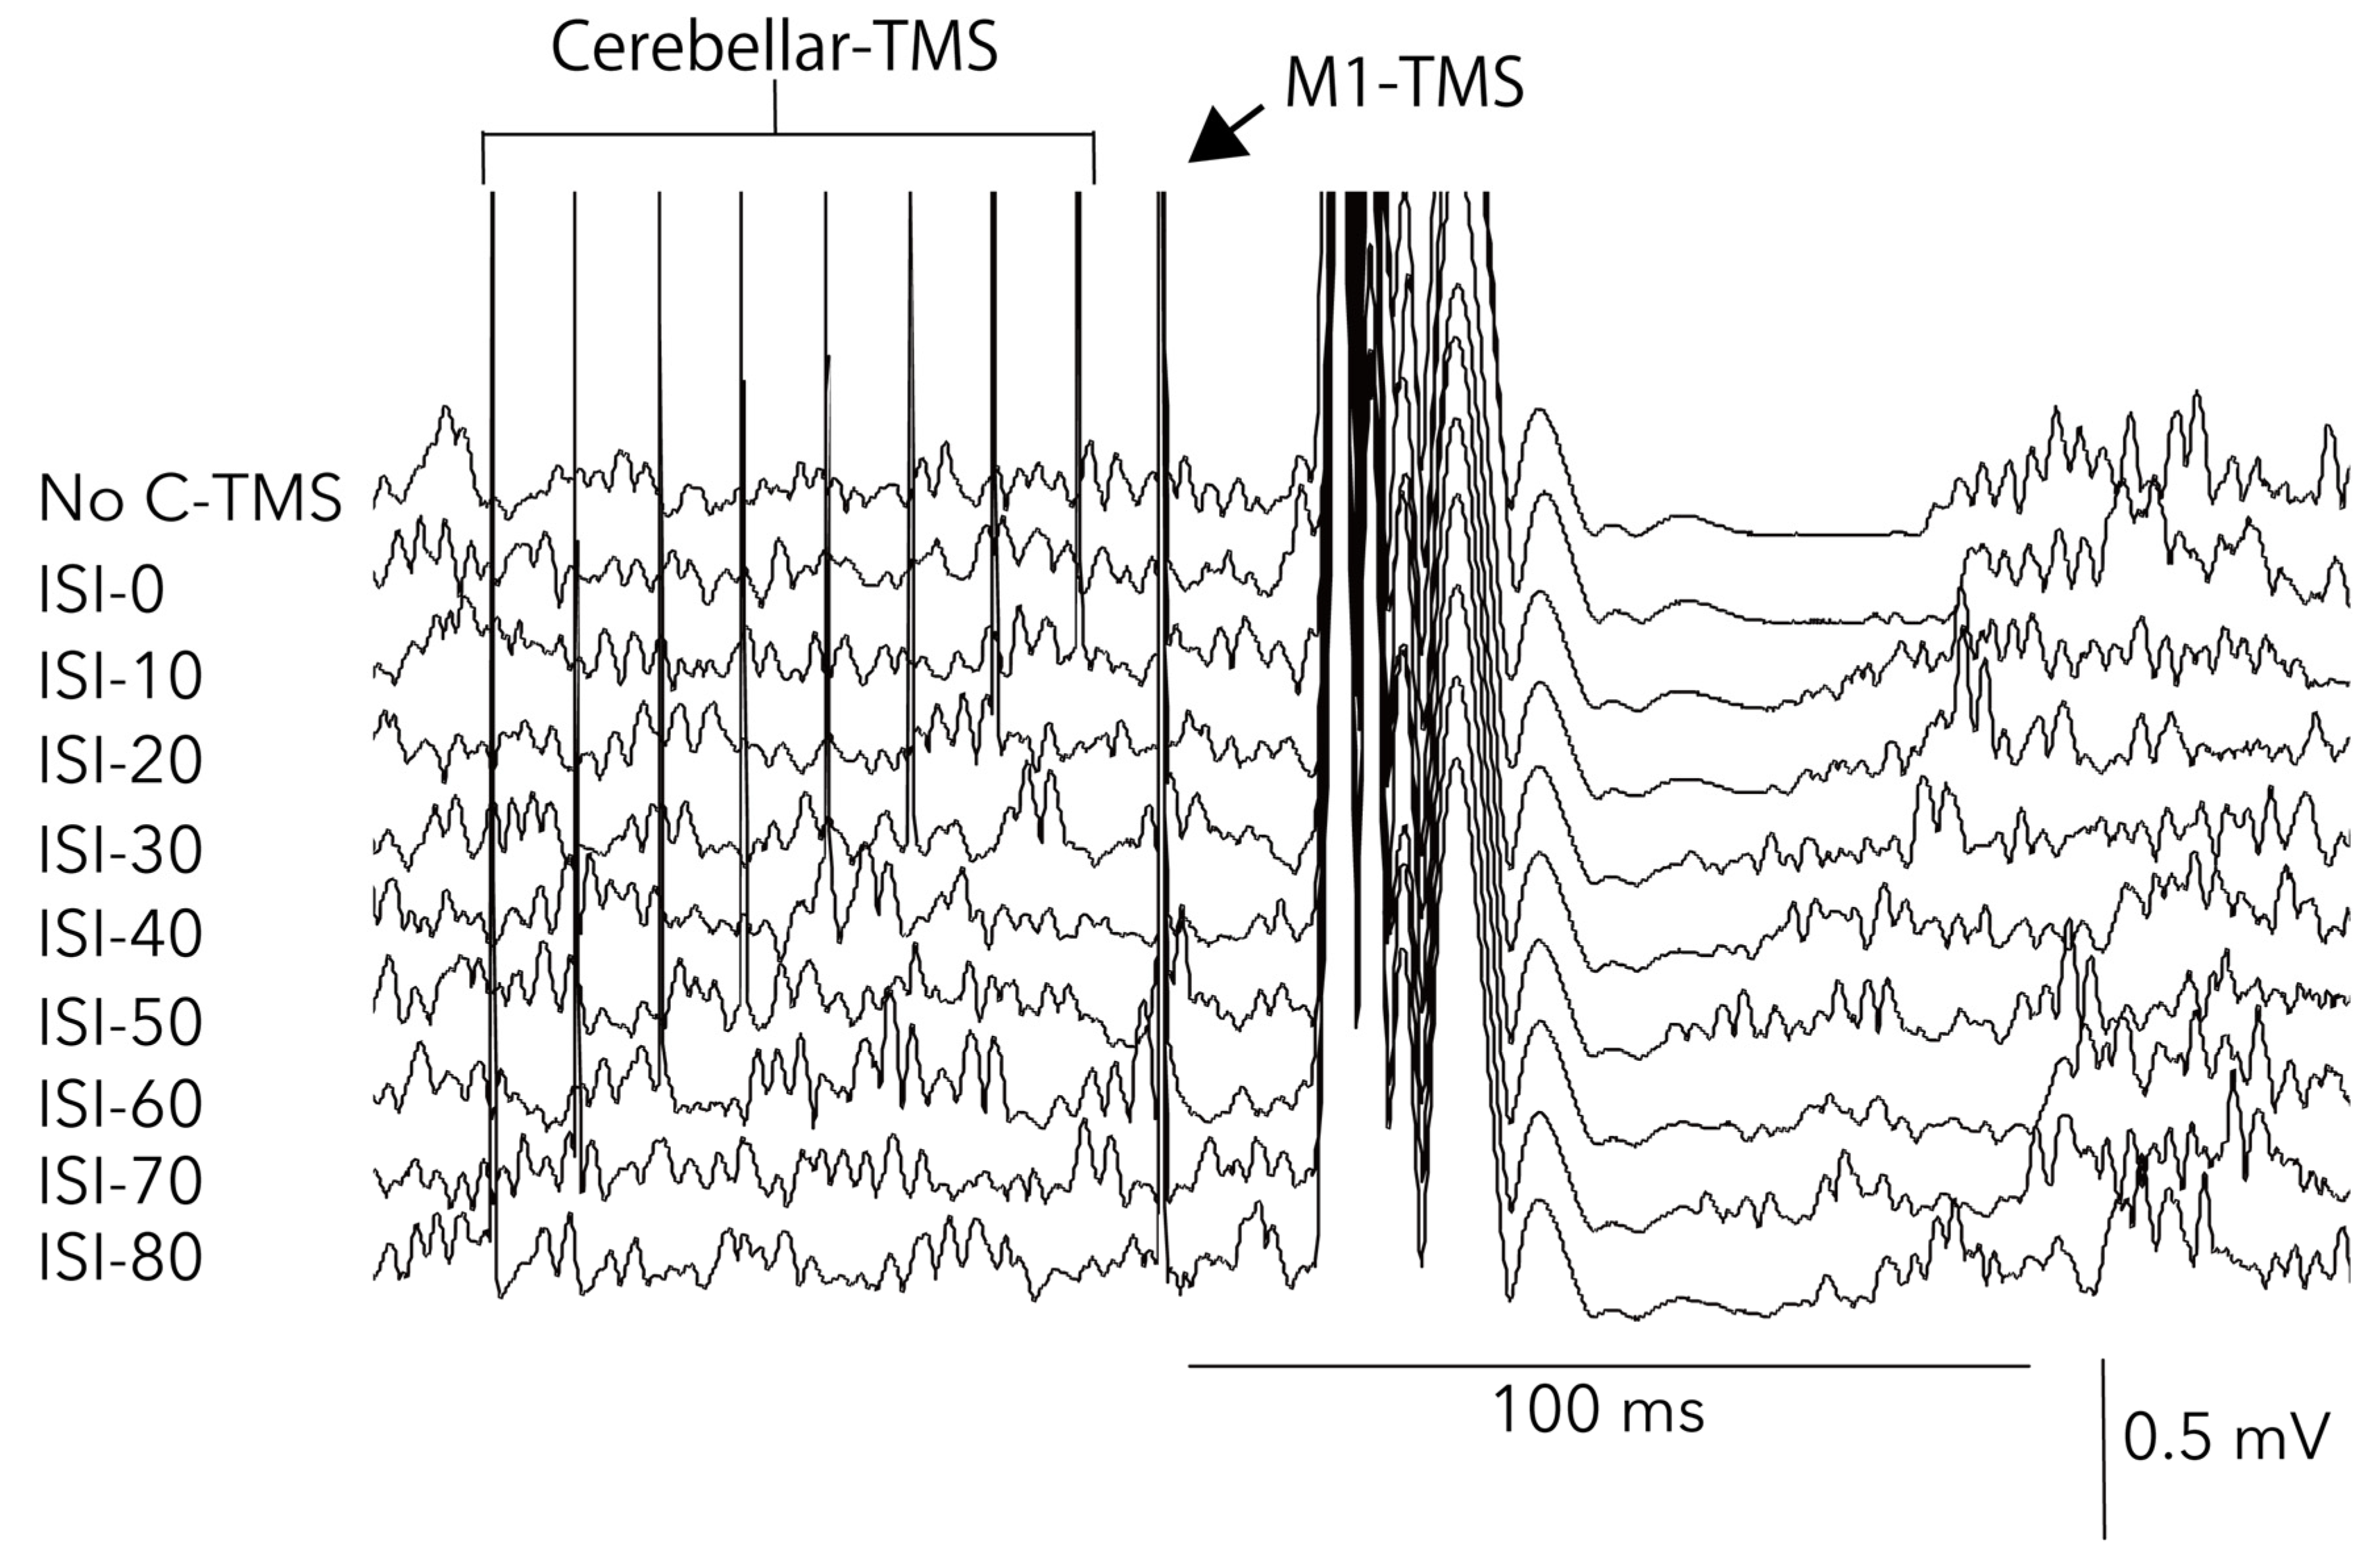
3. Results
4. Discussion
5. Conclusions
Author Contributions
Funding
Acknowledgments
Conflicts of Interest
Data Availability
References
- Klomjai, W.; Katz, R.; Lackmy-Vallee, A. Basic principles of transcranial magnetic stimulation (TMS) and repetitive TMS (rTMS). Ann. Phys. Rehabilitation Med. 2015, 58, 208–213. [Google Scholar] [CrossRef] [PubMed]
- Modugno, N.; Nakamura, Y.; MacKinnon, C.; Filipović, S.; Bestmann, S.; Berardelli, A.; Rothwell, J. Motor cortex excitability following short trains of repetitive magnetic stimuli. Exp. Brain Res. 2001, 140, 453–459. [Google Scholar] [CrossRef] [PubMed]
- Matsugi, A.; Yoshida, N.; Nishishita, S.; Okada, Y.; Mori, N.; Oku, K.; Douchi, S.; Hosomi, K.; Saitoh, Y. Cerebellum-mediated trainability of eye and head movements for dynamic gazing. PLOS ONE 2019, 14, e0224458. [Google Scholar] [CrossRef]
- Valls-Solé, J.; Pascual-Leone, A.; Wassermann, E.M.; Hallett, M. Human motor evoked responses to paired transcranial magnetic stimuli. Electroencephalogr. Clin. Neurophysiol. Potentials Sect. 1992, 85, 355–364. [Google Scholar] [CrossRef]
- Fuhr, P.; Agostino, R.; Hallett, M. Spinal motor neuron excitability during the silent period after cortical stimulation. Electroencephalogr. Clin. Neurophysiol. Potentials Sect. 1991, 81, 257–262. [Google Scholar] [CrossRef]
- Kobayashi, M.; Pascual-Leone, A. Transcranial magnetic stimulation in neurology. Lancet Neurol. 2003, 2, 145–156. [Google Scholar] [CrossRef]
- Inghilleri, M.; Berardelli, A.; Cruccu, G.; Manfredi, M. Silent period evoked by transcranial stimulation of the human cortex and cervicomedullary junction. J. Physiol. 1993, 466, 521–534. [Google Scholar]
- Werhahn, K.J.; Kunesch, E.; Noachtar, S.; Benecke, R.; Classen, J. Differential effects on motorcortical inhibition induced by blockade of GABA uptake in humans. J. Physiol. 1999, 517, 591–597. [Google Scholar] [CrossRef]
- Matsugi, A. Changes in the cortical silent period during force control. Somatosens. Mot. Res. 2019, 36, 8–13. [Google Scholar] [CrossRef]
- Tamburin, S. Stimulus-response properties of motor system in patients with cerebellar ataxia. Clin. Neurophysiol. 2004, 115, 348–355. [Google Scholar] [CrossRef]
- Matsugi, A.; Kikuchi, Y.; Kaneko, K.; Seko, Y.; Odagaki, M. Cerebellar transcranial magnetic stimulation facilitates excitability of spinal reflex, but does not affect cerebellar inhibition and facilitation in spinocerebellar ataxia. NeuroReport 2018, 29, 808–813. [Google Scholar] [CrossRef] [PubMed]
- Matsugi, A.; Okada, Y. Cerebellar transcranial static magnetic field stimulation transiently reduces cerebellar brain inhibition. Funct. Neurol. 2017, 32, 77–82. [Google Scholar] [CrossRef] [PubMed]
- Ugawa, Y.; Uesaka, Y.; Terao, Y.; Hanajima, R.; Kanazawa, I. Magnetic stimulation over the cerebellum in humans. Ann. Neurol. 1995, 37, 703–713. [Google Scholar] [CrossRef] [PubMed]
- Tanaka, H.; Matsugi, A.; Okada, Y. The effects of imaginary voluntary muscle contraction and relaxation on cerebellar brain inhibition. Neurosci. Res. 2017, 133, 15–20. [Google Scholar] [CrossRef]
- van Dun, K.; Bodranghien, F.; Manto, M.; Marien, P. Targeting the Cerebellum by Noninvasive Neurostimulation: A Review. Cerebellum 2017, 16, 695–741. [Google Scholar] [CrossRef]
- Iwahashi, M.; Koyama, Y.; Hyodo, A.; Hayami, T.; Ueno, S.; Iramina, K. Measurements of evoked electroencephalograph by transcranial magnetic stimulation applied to motor cortex and posterior parietal cortex. J. Appl. Phys. 2009, 105, 07B321. [Google Scholar] [CrossRef]
- Arimatsu, T.; Sato, H.; Ge, S.; Ueno, S.; Iramina, K. Measurements of BEG Evoked by Transcranial Magnetic Stimulation at Various Stimulus Points on the Head. In Proceedings of the 2007 Joint Meeting of the 6th International Symposium on Noninvasive Functional Source Imaging of the Brain and Heart and the International Conference on Functional Biomedical Imaging, Hangzhou, China, 12–14 October 2007; Institute of Electrical and Electronics Engineers (IEEE): New York, NY, USA, 2007; pp. 334–337. [Google Scholar]
- Garry, M.I.; Thomson, R.H. The effect of test TMS intensity on short-interval intracortical inhibition in different excitability states. Exp. Brain Res. 2009, 193, 267–274. [Google Scholar] [CrossRef]
- Säisänen, L.; Pirinen, E.; Teitti, S.; Könönen, M.; Julkunen, P.; Määttä, S.; Karhu, J. Factors influencing cortical silent period: Optimized stimulus location, intensity and muscle contraction. J. Neurosci. Methods 2008, 169, 231–238. [Google Scholar] [CrossRef]
- Ni, Z.; Charab, S.; Gunraj, C.; Nelson, A.J.; Udupa, K.; Yeh, I.-J.; Chen, R. Transcranial Magnetic Stimulation in Different Current Directions Activates Separate Cortical Circuits. J. Neurophysiol. 2011, 105, 749–756. [Google Scholar] [CrossRef]
- Sakai, K.; Ugawa, Y.; Terao, Y.; Hanajima, R.; Furubayashi, T.; Kanazawa, I. Preferential activation of different I waves by transcranial magnetic stimulation with a figure-of-eight-shaped coil. Exp. Brain Res. 1997, 113, 24–32. [Google Scholar] [CrossRef]
- Rothwell, J.; Thompson, P.; Day, B.; Boyd, S.; Marsden, C. Stimulation of the human motor cortex through the scalp. Exp. Physiol. 1991, 76, 159–200. [Google Scholar] [CrossRef] [PubMed]
- Ugawa, Y. Cerebellar Stimulation in Normal Subjects and Ataxic Patients. In Magnetic Stimulation in Clinical Neurophysiology; Elsevier BV: Amsterdam, The Netherlands, 2005; pp. 197–210. [Google Scholar]
- Groppa, S.; Oliviero, A.; Eisen, A.; Quartarone, A.; Cohen, L.; Mall, V.; Kaelin-Lang, A.; Mima, T.; Rossi, S.; Thickbroom, G.; et al. A practical guide to diagnostic transcranial magnetic stimulation: Report of an IFCN committee. Clin. Neurophysiol. 2012, 123, 858–882. [Google Scholar] [CrossRef] [PubMed] [Green Version]
- Hardwick, R.M.; Lesage, E.; Miall, R.C. Cerebellar transcranial magnetic stimulation: The role of coil geometry and tissue depth. Brain Stimul. 2014, 7, 643–649. [Google Scholar] [CrossRef] [Green Version]
- Matsugi, A.; Iwata, Y.; Mori, N.; Horino, H.; Hiraoka, K. Long latency electromyographic response induced by transcranial magnetic stimulation over the cerebellum preferentially appears during continuous visually guided manual tracking task. Cerebellum 2013, 12, 147–154. [Google Scholar] [CrossRef] [PubMed]
- Jono, Y.; Iwata, Y.; Mizusawa, H.; Hiraoka, K. Change in Excitability of Corticospinal Pathway and GABA-Mediated Inhibitory Circuits of Primary Motor Cortex Induced by Contraction of Adjacent Hand Muscle. Brain Topogr. 2016, 29, 834–846. [Google Scholar] [CrossRef] [PubMed]
- Kojima, S.; Onishi, H.; Sugawara, K.; Kirimoto, H.; Suzuki, M.; Tamaki, H. Modulation of the cortical silent period elicited by single- and paired-pulse transcranial magnetic stimulation. BMC Neurosci. 2013, 14, 43. [Google Scholar] [CrossRef] [PubMed] [Green Version]
- Koo, T.K.; Li, M.Y. A Guideline of Selecting and Reporting Intraclass Correlation Coefficients for Reliability Research. J. Chiropr. Med. 2016, 15, 155–163. [Google Scholar] [CrossRef] [Green Version]
- Faul, F.; Erdfelder, E.; Lang, A.-G.; Buchner, A. G*Power 3: A flexible statistical power analysis program for the social, behavioral, and biomedical sciences. Behav. Res. Methods 2007, 39, 175–191. [Google Scholar] [CrossRef]
- Matsugi, A.; Mori, N.; Uehara, S.; Kamata, N.; Oku, K.; Mukai, K.; Nagano, K. Task dependency of the long-latency facilitatory effect on the soleus H-reflex by cerebellar transcranial magnetic stimulation. NeuroReport 2014, 25, 1375–1380. [Google Scholar] [CrossRef]
- Matsugi, A.; Mori, N.; Uehara, S.; Kamata, N.; Oku, K.; Okada, Y.; Kikuchi, Y.; Mukai, K.; Nagano, K. Effect of cerebellar transcranial magnetic stimulation on soleus Ia presynaptic and reciprocal inhibition. NeuroReport 2015, 26, 139–143. [Google Scholar] [CrossRef]
- Wilson, S.; Lockwood, R.; Thickbroom, G.; Mastaglia, F. The muscle silent period following transcranial magnetic cortical stimulation. J. Neurol. Sci. 1993, 114, 216–222. [Google Scholar] [CrossRef]
- Hammond, G.; Vallence, A.-M. Modulation of long-interval intracortical inhibition and the silent period by voluntary contraction. Brain Res. 2007, 1158, 63–70. [Google Scholar] [CrossRef] [PubMed]
- Di Lazzaro, V.; Ziemann, U. The contribution of transcranial magnetic stimulation in the functional evaluation of microcircuits in human motor cortex. Front. Neural Circuits 2013, 7, 18. [Google Scholar] [CrossRef] [Green Version]
- Rossini, P.; Burke, D.; Chen, R.; Cohen, L.; Daskalakis, Z.; Di Iorio, R.; Di Lazzaro, V.; Ferreri, F.; Fitzgerald, P.; George, M.; et al. Non-invasive electrical and magnetic stimulation of the brain, spinal cord, roots and peripheral nerves: Basic principles and procedures for routine clinical and research application. An updated report from an I.F.C.N. Committee. Clin. Neurophysiol. 2015, 126, 1071–1107. [Google Scholar] [CrossRef] [PubMed]
- Daskalakis, Z.J.; Paradiso, G.O.; Christensen, B.K.; Fitzgerald, P.B.; Gunraj, C.; Chen, R. Exploring the connectivity between the cerebellum and motor cortex in humans. J. Physiol. 2004, 557, 689–700. [Google Scholar] [CrossRef] [PubMed]
- Middleton, F.A.; Strick, P.L. Cerebellar Projections to the Prefrontal Cortex of the Primate. J. Neurosci. 2001, 21, 700–712. [Google Scholar] [CrossRef] [PubMed]
- Franca, C.; de Andrade, D.C.; Teixeira, M.J.; Galhardoni, R.; Silva, V.; Barbosa, E.R.; Cury, R.G. Effects of cerebellar neuromodulation in movement disorders: A systematic review. Brain Stimul. 2018, 11, 249–260. [Google Scholar] [CrossRef]
- Dum, R.; Strick, P. The origin of corticospinal projections from the premotor areas in the frontal lobe. J. Neurosci. 1991, 11, 667–689. [Google Scholar] [CrossRef] [Green Version]
- Buckner, R.L.; Krienen, F.M.; Castellanos, A.; Diaz, J.C.; Yeo, B.T.T. The organization of the human cerebellum estimated by intrinsic functional connectivity. J. Neurophysiol. 2011, 106, 2322–2345. [Google Scholar] [CrossRef]
- Daskalakis, Z.J.; Christensen, B.K.; Fitzgerald, P.B.; Roshan, L.; Chen, R. The mechanisms of interhemispheric inhibition in the human motor cortex. J. Physiol. 2002, 543, 317–326. [Google Scholar] [CrossRef]
- Middleton, F. Basal ganglia and cerebellar loops: Motor and cognitive circuits. Brain Res. Rev. 2000, 31, 236–250. [Google Scholar] [CrossRef]
- Hoover, J.E.; Strick, P.L. The Organization of Cerebellar and Basal Ganglia Outputs to Primary Motor Cortex as Revealed by Retrograde Transneuronal Transport of Herpes Simplex Virus Type 1. J. Neurosci. 1999, 19, 1446–1463. [Google Scholar] [CrossRef] [PubMed]
- Groiss, S.J.; Ugawa, Y. Cerebellar stimulation in ataxia. Cerebellum 2012, 11, 440–442. [Google Scholar] [CrossRef]
- Palesi, F.; De Rinaldis, A.; Castellazzi, G.; Calamante, F.; Muhlert, N.; Chard, D.; Tournier, J.D.; Magenes, G.; D’Angelo, E.; Wheeler-Kingshott, C.A.M.G. Contralateral cortico-ponto-cerebellar pathways reconstruction in humans in vivo: Implications for reciprocal cerebro-cerebellar structural connectivity in motor and non-motor areas. Sci. Rep. 2017, 7, 12841. [Google Scholar] [CrossRef] [PubMed]
- Hallett, M.; Di Iorio, R.; Rossini, P.M.; Park, J.E.; Chen, R.; Celnik, P.; Strafella, A.P.; Matsumoto, H.; Ugawa, Y. Contribution of transcranial magnetic stimulation to assessment of brain connectivity and networks. Clin. Neurophysiol. 2017, 128, 2125–2139. [Google Scholar] [CrossRef] [PubMed]
- Brighina, F.; Romano, M.; Giglia, G.; Saia, V.; Puma, A.; Giglia, F.; Fierro, B. Effects of cerebellar TMS on motor cortex of patients with focal dystonia: A preliminary report. Exp. Brain Res. 2009, 192, 651–656. [Google Scholar] [CrossRef]
- Rona, S.; Berardelli, A.; Vacca, L.; Inghilleri, M.; Manfredi, M. Alterations of motor cortical inhibition in patients with dystonia. Mov. Disord. 1998, 13, 118–124. [Google Scholar] [CrossRef]
- Chaves, A.R.; Kelly, L.P.; Moore, C.S.; Stefanelli, M.; Ploughman, M. Prolonged cortical silent period is related to poor fitness and fatigue, but not tumor necrosis factor, in Multiple Sclerosis. Clin. Neurophysiol. 2019, 130, 474–483. [Google Scholar] [CrossRef]
- Pereira, H.M.; Keller, M.L. Understanding the mechanisms of neuromuscular fatigue with paired-pulse stimulation. J. Physiol. 2012, 590, 5–6. [Google Scholar] [CrossRef]
- Liepert, J.; Storch, P.; Fritsch, A.; Weiller, C. Motor cortex disinhibition in acute stroke. Clin. Neurophysiol. 2000, 111, 671–676. [Google Scholar] [CrossRef]


| Force [/MVC] | bEMG [/MVC] | MEParea [mV*ms] | cSP [ms] | cSP [C/NC] | ||||||||||||||||
|---|---|---|---|---|---|---|---|---|---|---|---|---|---|---|---|---|---|---|---|---|
| 1rMT_Test | 1rMT_cTMS | 1.3rMT_Test | 1.3rMT_cTMS | 1rMT_Test | 1rMT_cTMS | 1.3rMT_Test | 1.3rMT_cTMS | 1rMT_Test | 1rMT_cTMS | 1.3rMT_Test | 1.3rMT_cTMS | 1rMT_Test | 1rMT_cTMS | 1.3rMT_Test | 1.3rMT_cTMS | 1rMT | 1.3rMT | |||
| Mean | 0.17 | 0.18 | 0.18 | 0.18 | 0.29 | 0.31 | 0.30 | 0.29 | 0.74 | 0.71 | 0.88 | 0.88 | 103.7 | 91.6 | 157.6 | 148.2 | 0.89 | 0.94 | ||
| SEM | 0.02 | 0.02 | 0.02 | 0.02 | 0.03 | 0.04 | 0.04 | 0.04 | 0.13 | 0.13 | 0.14 | 0.13 | 7.2 | 6.4 | 9.8 | 9.1 | 0.02 | 0.02 | ||
| D’Agostino test | Skewness | Statistic(Z) | 2.4096 | 2.3962 | 2.4736 | 2.5681 | 0.9841 | 0.7316 | 0.6486 | 0.7409 | 1.4283 | 1.5369 | 1.2183 | 0.9032 | 2.2252 | 2.6525 | 1.6645 | 1.2351 | 0.9640 | 1.8655 |
| p | 0.0160 | 0.0166 | 0.0134 | 0.0102 | 0.3250 | 0.4644 | 0.5166 | 0.4587 | 0.1532 | 0.1243 | 0.2231 | 0.3664 | 0.0261 | 0.0080 | 0.0960 | 0.2168 | 0.3351 | 0.0621 | ||
| Kurtosis | Statistic(Z) | 17.8808 | 15.9005 | N.C. | N.C. | 6.0121 | 5.7291 | 5.8655 | 5.8438 | C.N.C. | C.N.C. | C.N.C. | C.N.C. | C.N.C. | C.N.C. | C.N.C. | C.N.C. | 12.7921 | C.N.C. | |
| p | 0.0000 | 0.0000 | N.C. | N.C. | 0.0000 | 0.0000 | 0.0000 | 0.0000 | C.N.C. | C.N.C. | C.N.C. | C.N.C. | C.N.C. | C.N.C. | C.N.C. | C.N.C. | 0.0000 | C.N.C. | ||
| Kolmogorov–Smirnov test | Statistic(D) | 0.2197 | 0.2243 | 0.2206 | 0.2335 | 0.1398 | 0.1593 | 0.1711 | 0.1434 | 0.1163 | 0.1173 | 0.1652 | 0.1503 | 0.1366 | 0.1734 | 0.1840 | 0.2254 | 0.1051 | 0.1769 | |
| d.f. | 14 | 14 | 14 | 14 | 14 | 14 | 14 | 14 | 14 | 14 | 14 | 14 | 14 | 14 | 14 | 14 | 14 | 14 | ||
| p | 0.0655 | 0.0545 | 0.0632 | 0.0372 | ≥0.10 | ≥0.10 | ≥0.10 | ≥0.10 | ≥0.10 | ≥0.10 | ≥0.10 | ≥0.10 | ≥0.10 | ≥0.10 | ≥0.10 | 0.0521 | ≥0.10 | ≥0.10 | ||
| Force[/MVC] | bEMG[/MVC] | MEParea[mV*ms] | cSP[ms] | |||||||||||||||||||||||||||||||||||||||
|---|---|---|---|---|---|---|---|---|---|---|---|---|---|---|---|---|---|---|---|---|---|---|---|---|---|---|---|---|---|---|---|---|---|---|---|---|---|---|---|---|---|---|
| NC | ISI0 | ISI10 | ISI20 | ISI30 | ISI40 | ISI50 | ISI60 | ISI70 | ISI80 | NC | ISI0 | ISI10 | ISI20 | ISI30 | ISI40 | ISI50 | ISI60 | ISI70 | ISI80 | NC | ISI0 | ISI10 | ISI20 | ISI30 | ISI40 | ISI50 | ISI60 | ISI70 | ISI80 | NC | ISI0 | ISI10 | ISI20 | ISI30 | ISI40 | ISI50 | ISI60 | ISI70 | ISI80 | |||
| Mean | 0.18 | 0.18 | 0.17 | 0.17 | 0.18 | 0.17 | 0.17 | 0.17 | 0.18 | 0.18 | 0.27 | 0.27 | 0.26 | 0.28 | 0.27 | 0.28 | 0.30 | 0.25 | 0.27 | 0.28 | 0.81 | 0.84 | 0.78 | 0.76 | 0.71 | 0.71 | 0.71 | 0.74 | 0.76 | 0.78 | 102.5 | 103.1 | 92.2 | 88.4 | 85.5 | 84.8 | 88.7 | 92.7 | 93.0 | 91.8 | ||
| SEM | 0.02 | 0.02 | 0.02 | 0.02 | 0.02 | 0.02 | 0.02 | 0.02 | 0.02 | 0.02 | 0.04 | 0.04 | 0.03 | 0.04 | 0.03 | 0.04 | 0.04 | 0.03 | 0.04 | 0.04 | 0.14 | 0.15 | 0.13 | 0.14 | 0.15 | 0.14 | 0.13 | 0.14 | 0.14 | 0.15 | 7.1 | 7.2 | 6.7 | 6.5 | 7.3 | 7.4 | 7.4 | 7.2 | 7.2 | 6.1 | ||
| D’Agostino test | Skewness | Statistic(Z) | 2.52 | 2.35 | 2.4 | 2.32 | 2.35 | 2.39 | 2.32 | 2.3 | 2.3 | 2.41 | 1.2 | 1.92 | 0.35 | 1.15 | 0.59 | 1.95 | 1.57 | 1.22 | 1.39 | 0.69 | 1.25 | 1.31 | 1.36 | 1.68 | 1.80 | 1.19 | 0.83 | 1.77 | 1.58 | 1.65 | 1.81 | 1.17 | 1.58 | 1.86 | 2.26 | 1.58 | 1.93 | 1.69 | 1.55 | 1.93 |
| p | 0.01 | 0.02 | 0.02 | 0.02 | 0.02 | 0.02 | 0.02 | 0.02 | 0.02 | 0.02 | 0.23 | 0.06 | 0.72 | 0.25 | 0.56 | 0.05 | 0.12 | 0.22 | 0.16 | 0.49 | 0.21 | 0.19 | 0.17 | 0.09 | 0.07 | 0.23 | 0.41 | 0.08 | 0.11 | 0.10 | 0.07 | 0.24 | 0.11 | 0.06 | 0.02 | 0.11 | 0.05 | 0.09 | 0.12 | 0.05 | ||
| Kurtosis | Statistic(Z) | C.N.C. | 14.93 | 18.19 | 15.06 | 16.73 | 17 | 14.37 | 13.93 | 13.91 | 18.89 | C.N.C. | C.N.C. | 6.05 | C.N.C. | 5.82 | C.N.C. | C.N.C. | C.N.C. | C.N.C. | 5.34 | C.N.C. | C.N.C. | C.N.C. | C.N.C. | C.N.C. | 2.93 | 2.53 | C.N.C. | C.N.C. | C.N.C. | C.N.C. | C.N.C. | C.N.C. | C.N.C. | C.N.C. | C.N.C. | C.N.C. | C.N.C. | C.N.C. | C.N.C. | |
| p | C.N.C. | 0.00 | 0.00 | 0.00 | 0.00 | 0.00 | 0.00 | 0.00 | 0.00 | 0.00 | C.N.C. | C.N.C. | 0.00 | C.N.C. | 0.00 | C.N.C. | C.N.C. | C.N.C. | C.N.C. | 0.00 | C.N.C. | C.N.C. | C.N.C. | C.N.C. | C.N.C. | 0.00 | 0.01 | C.N.C. | C.N.C. | C.N.C. | C.N.C. | C.N.C. | C.N.C. | C.N.C. | C.N.C. | C.N.C. | C.N.C. | C.N.C. | C.N.C. | C.N.C. | ||
| Kolmogorov–Smirnov test | Statistic(D) | 0.21 | 0.21 | 0.22 | 0.21 | 0.2 | 0.23 | 0.22 | 0.2 | 0.21 | 0.22 | 0.14 | 0.15 | 0.17 | 0.15 | 0.12 | 0.18 | 0.14 | 0.11 | 0.19 | 0.11 | 0.15 | 0.18 | 0.16 | 0.16 | 0.20 | 0.22 | 0.21 | 0.16 | 0.15 | 0.17 | 0.18 | 0.15 | 0.16 | 0.14 | 0.21 | 0.15 | 0.15 | 0.22 | 0.14 | 0.23 | |
| d.f. | 14 | 14 | 14 | 14 | 14 | 14 | 14 | 14 | 14 | 14 | 14 | 14 | 14 | 14 | 14 | 14 | 14 | 14 | 14 | 14 | 14 | 14 | 14 | 14 | 14 | 14 | 14 | 14 | 14 | 14 | 14 | 14 | 14 | 14 | 14 | 14 | 14 | 14 | 14 | 14 | ||
| p | 0.09 | 0.08 | 0.06 | ≥0.10 | ≥0.10 | 0.051 | 0.07 | ≥0.10 | 0.09 | 0.08 | ≥0.10 | ≥0.10 | ≥0.10 | ≥0.10 | ≥0.10 | ≥0.10 | ≥0.10 | ≥0.10 | ≥0.10 | ≥0.10 | ≥0.10 | ≥0.10 | ≥0.10 | ≥0.10 | ≥0.10 | ≥0.10 | ≥0.10 | ≥0.10 | ≥0.10 | ≥0.10 | ≥0.10 | ≥0.10 | ≥0.10 | ≥0.10 | ≥0.10 | ≥0.10 | ≥0.10 | 0.056 | ≥0.10 | 0.04 | ||
© 2020 by the authors. Licensee MDPI, Basel, Switzerland. This article is an open access article distributed under the terms and conditions of the Creative Commons Attribution (CC BY) license (http://creativecommons.org/licenses/by/4.0/).
Share and Cite
Matsugi, A.; Douchi, S.; Suzuki, K.; Oku, K.; Mori, N.; Tanaka, H.; Nishishita, S.; Bando, K.; Kikuchi, Y.; Okada, Y. Cerebellar Transcranial Magnetic Stimulation Reduces the Silent Period on Hand Muscle Electromyography During Force Control. Brain Sci. 2020, 10, 63. https://doi.org/10.3390/brainsci10020063
Matsugi A, Douchi S, Suzuki K, Oku K, Mori N, Tanaka H, Nishishita S, Bando K, Kikuchi Y, Okada Y. Cerebellar Transcranial Magnetic Stimulation Reduces the Silent Period on Hand Muscle Electromyography During Force Control. Brain Sciences. 2020; 10(2):63. https://doi.org/10.3390/brainsci10020063
Chicago/Turabian StyleMatsugi, Akiyoshi, Shinya Douchi, Kodai Suzuki, Kosuke Oku, Nobuhiko Mori, Hiroaki Tanaka, Satoru Nishishita, Kyota Bando, Yutaka Kikuchi, and Yohei Okada. 2020. "Cerebellar Transcranial Magnetic Stimulation Reduces the Silent Period on Hand Muscle Electromyography During Force Control" Brain Sciences 10, no. 2: 63. https://doi.org/10.3390/brainsci10020063