Sleep and Cognition in Children with Fetal Alcohol Spectrum Disorders (FASD) and Children with Autism Spectrum Disorders (ASD)


Abstract
:1. Introduction
2. Materials and Methods
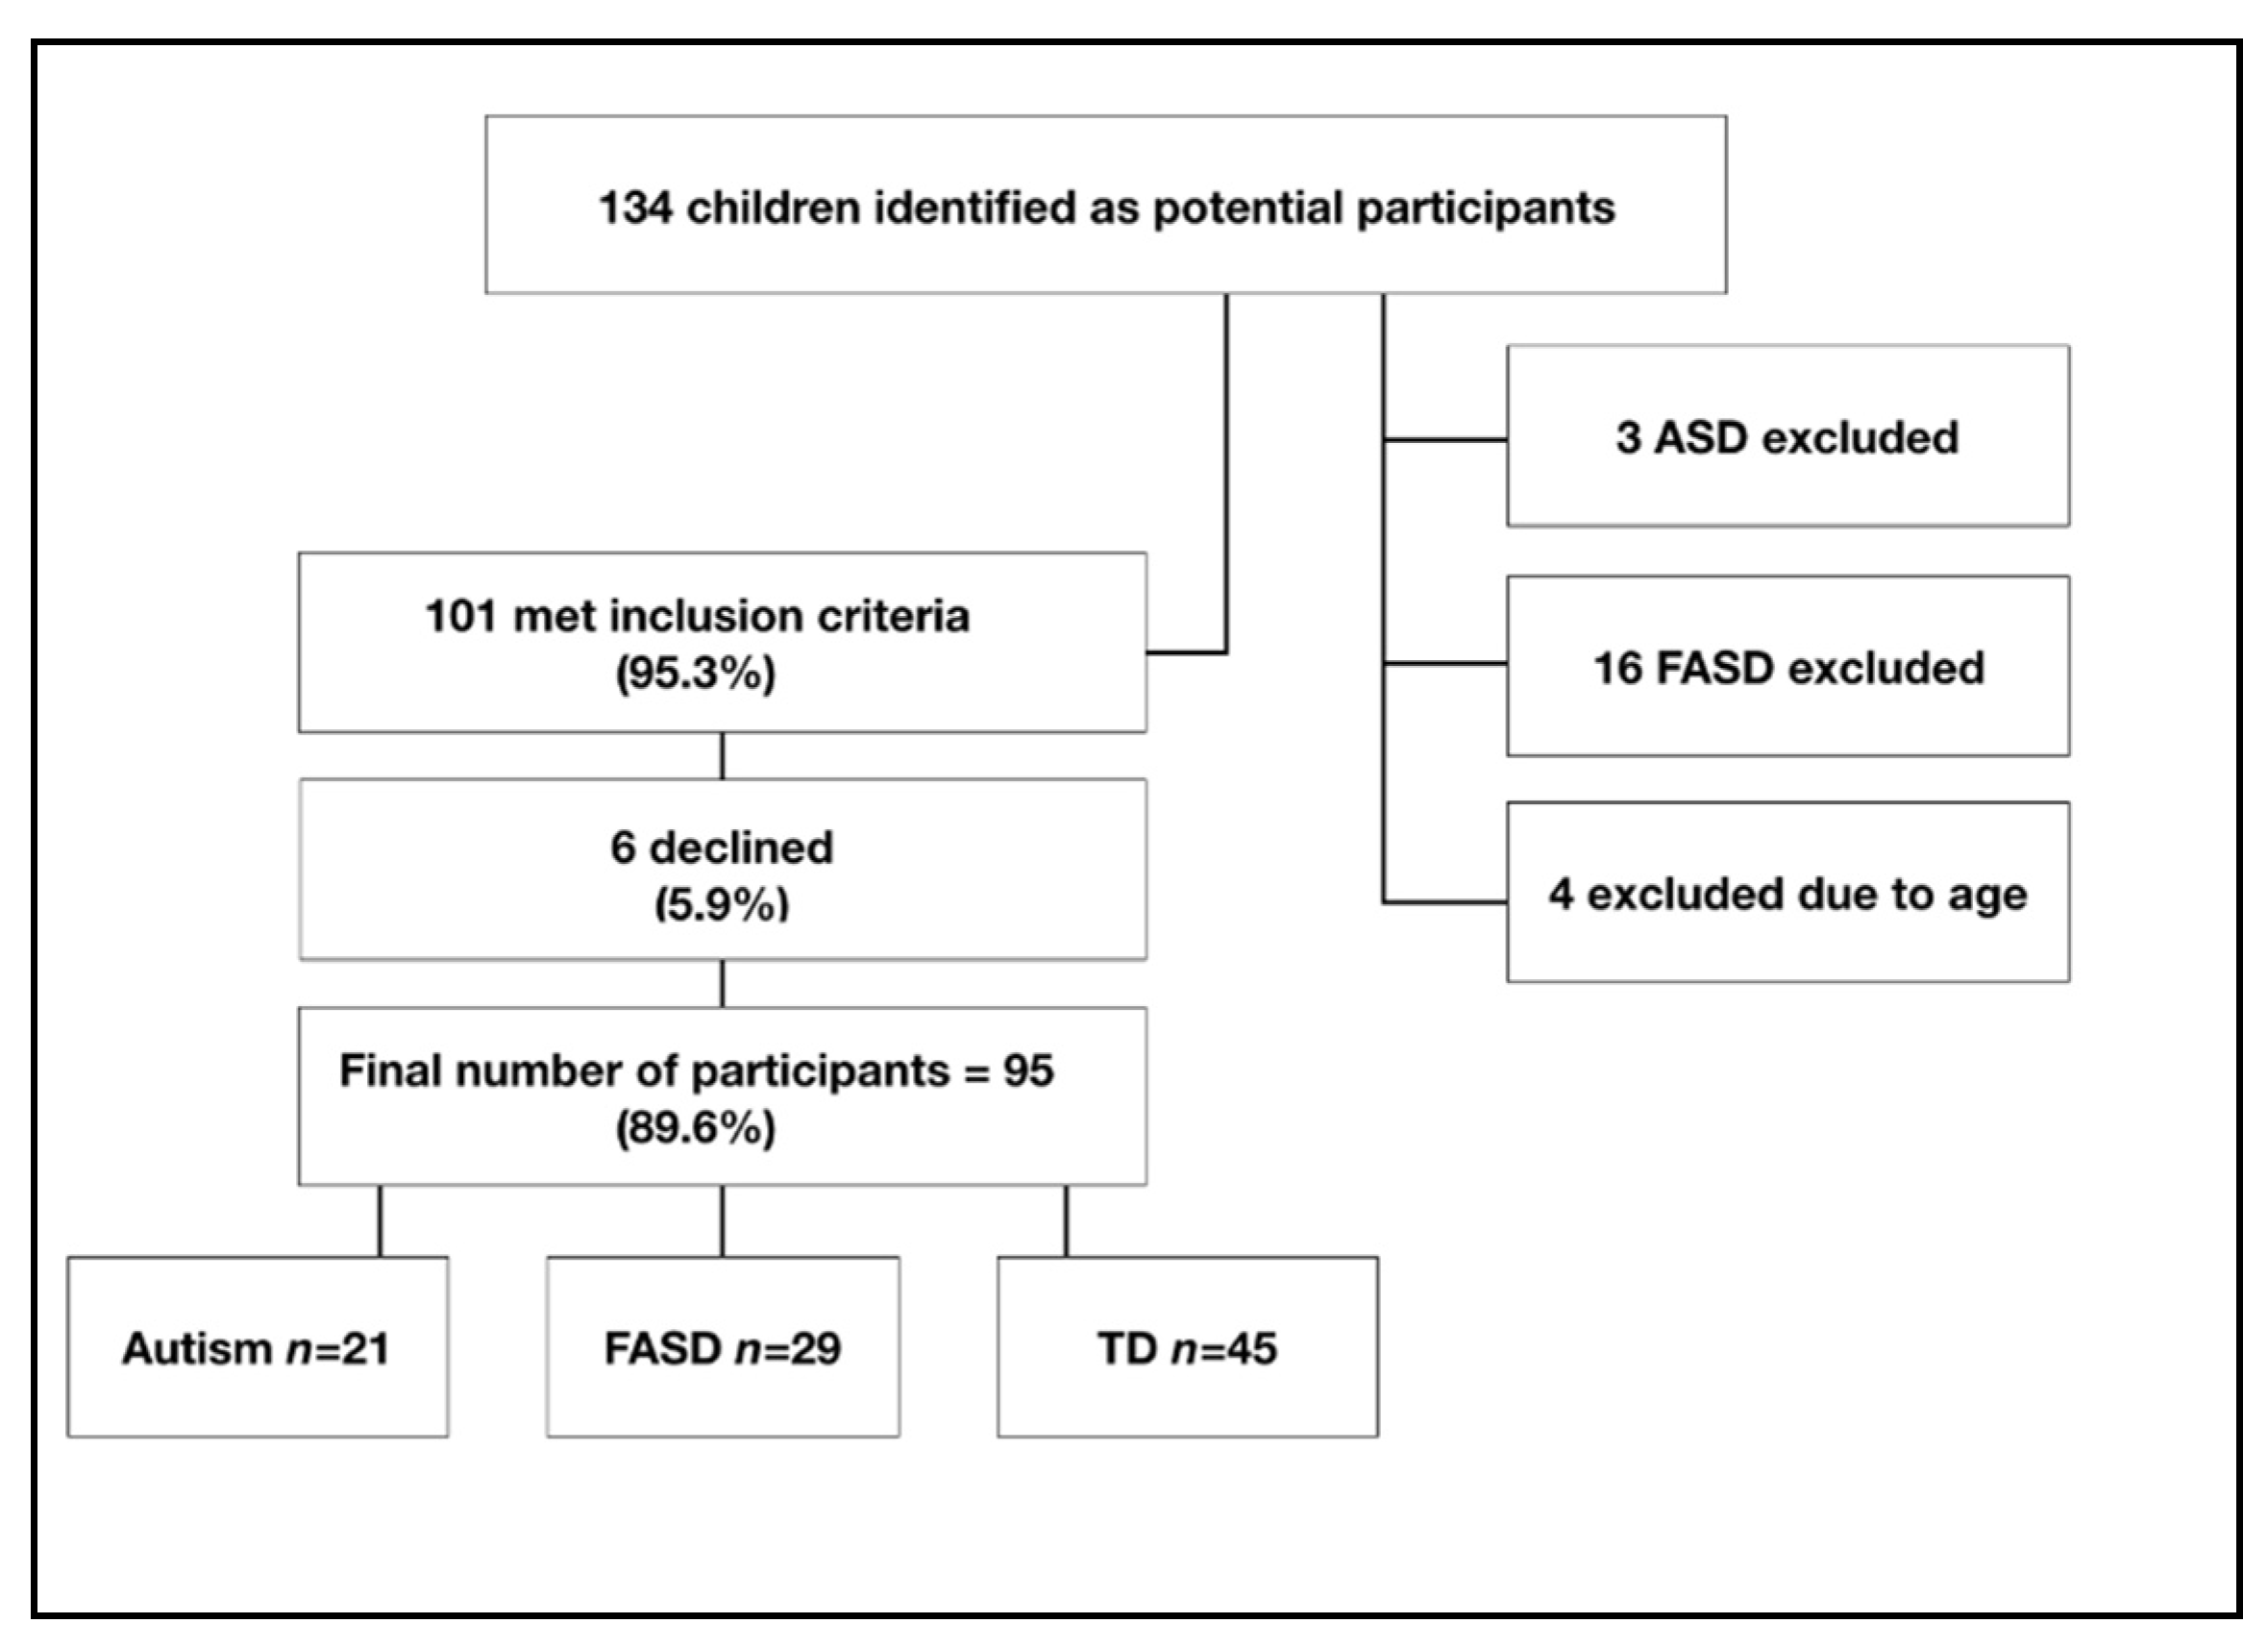
2.1. Participants
2.2. Ethical Approval
2.3. Materials
2.3.1. Background Questionnaires
2.3.2. Actigraphy
2.3.3. Sleep Diary
2.4. Cognitive Tasks
2.5. Procedure
2.6. Statistical Analysis
2.6.1. Group Comparisons
2.6.2. Regression Analysis
3. Results
3.1. Demographic Data
3.2. Sleep Characteristics Based on Actigraphy
3.2.1. Chronological Age (CA) and Sleep
3.2.2. Socioeconomic Status (SES) and Sleep
3.2.3. Sex Differences and Sleep
3.3. RSPM/Non-Verbal MA
3.4. BPVS/Receptive Vocabulary
3.5. Digit Span Test of Working Memory
3.6. Attention
3.7. Regressions between Sleep and Cognition
4. Discussion
4.1. Sleep Differences between Groups
4.2. Cognitive Profiles
4.3. Sleep and Cognition
5. Conclusions
Author Contributions
Funding
Acknowledgments
Conflicts of Interest
References
- Carskadon, M.A.; Dement, W.C. Normal Human Sleep: An Overview. Princ. Pract. Sleep Med. 2011, 16–26. [Google Scholar] [CrossRef]
- Espie, C.A.; Morin, C.M. The Oxford Handbook of Sleep and Sleep Disorders; Oxford University Press: Oxford, UK, 2012; 871p. [Google Scholar]
- Frank, M.G.; Heller, H.C. The ontogeny of mammalian sleep: A reappraisal of alternative hypotheses. J. Sleep Res. 2003, 12, 25–34. [Google Scholar] [CrossRef] [PubMed] [Green Version]
- Hill, C.M.; Hogan, A.M.; Karmiloff-Smith, A. To sleep, perchance to enrich learning? Arch. Dis. Child. 2007, 92, 637–643. [Google Scholar] [CrossRef] [PubMed] [Green Version]
- Meltzer, L.J.; Mindell, J.A. Sleep and Sleep Disorders in Children and Adolescents. Psychiatr. Clin. N. Am. 2006, 29, 1059–1076. [Google Scholar] [CrossRef] [PubMed]
- Hudson, A.N.; Van Dongen, H.P.A.; Honn, K.A. Sleep deprivation, vigilant attention, and brain function: A review. Neuropsychopharmacology 2020, 45, 21–30. [Google Scholar] [CrossRef]
- Hundley, R.J.; Shui, A.; Malow, B.A. Relationship Between Subtypes of Restricted and Repetitive Behaviors and Sleep Disturbance in Autism Spectrum Disorder. J. Autism Dev. Disord. 2016, 46, 3448–3457. [Google Scholar] [CrossRef]
- Astley, S.J. Validation of the fetal alcohol spectrum disorder (FASD) 4-Digit diagnostic code. J. Popul. Ther. Clin. Pharmacol. 2013, 20, e416. [Google Scholar]
- Khoury, J.E.; Milligan, K.; Girard, T.A. Executive Functioning in Children and Adolescents Prenatally Exposed to Alcohol: A Meta-Analytic Review. Neuropsychol. Rev. 2015, 25, 149–170. [Google Scholar] [CrossRef] [PubMed]
- Lange, S.; Rovet, J.; Rehm, J.; Popova, S. Neurodevelopmental profile of Fetal Alcohol Spectrum Disorder: A systematic review. BMC Psychol. 2017, 5, 1–12. [Google Scholar] [CrossRef] [PubMed]
- Coriale, G.; Fiorentino, D.; DiLauro, F.; Marchitelli, R.; Scalese, B.; Fiore, M.; Maviglia, M.; Ceccanti, M. Fetal Alcohol Spectrum Disorder (FASD): Neurobehavioral profile, indications for diagnosis and treatment. Riv. Psichiatr. 2013, 48, 359–369. [Google Scholar] [PubMed]
- Astley, S.J.; Aylward, E.H.; Olson, H.C.; Kerns, K.; Brooks, A.; Coggins, T.E. Functional magnetic resonance imaging outcomes from a comprehensive magnetic resonance study of children with fetal alcohol spectrum disorders. J. Neurodev. Disord. 2009, 1, 61–80. [Google Scholar] [CrossRef] [PubMed] [Green Version]
- Hanlon-Dearman, A.; Chen, M.L.; Carmichael Olson, H. Understanding and Managing Sleep Disruption in Children with FASD. Biochem. Cell Biol. 2017, 96, 267–274. [Google Scholar] [CrossRef] [PubMed] [Green Version]
- Chen, M.L.; Olson, H.C.; Picciano, J.F.; Starr, J.R.; Owens, J. Sleep Problems in Children with Fetal Alcohol Spectrum Disorders. J. Clin. Sleep Med. 2012, 8, 421–429. [Google Scholar] [CrossRef] [PubMed] [Green Version]
- Inkelis, S.M.; Thomas, J.D. Sleep in Infants and Children with Prenatal Alcohol Exposure. Alcohol. Clin. Exp. Res. 2018, 42, 1390–1405. [Google Scholar] [CrossRef] [PubMed]
- American Psychiatric Association. Diagnostic and statistical manual of mental disorders (DSM-5®); American Psychiatric Association: Philadelphia, PA, USA, 2013. [Google Scholar]
- Barendse, E.M.; Hendriks, M.P.; Jansen, J.F.; Backes, W.H.; Hofman, P.A.; Thoonen, G.; Kessels, R.P.; Aldenkamp, A.P. Working memory deficits in high-functioning adolescents with autism spectrum disorders: Neuropsychological and neuroimaging correlates. J. Neurodev. Disord. 2013, 5, 14. [Google Scholar] [CrossRef] [Green Version]
- Alloway, T.P.; Gathercole, S.E. Working Memory and Neurodevelopmental Disorders; Psychology Press: London, UK, 2012. [Google Scholar]
- Hughes, C.; Russell, J.; Robbins, T.W. Evidence for executive dysfunction in autism. Neuropsychologia 1994, 32, 477–492. [Google Scholar] [CrossRef]
- Yeung, M.K.; Lee, T.L.; Chan, A.S. Right-lateralized frontal activation underlies successful updating of verbal working memory in adolescents with high-functioning autism spectrum disorder. Biol. Psychol. 2019, 148, 107743. [Google Scholar] [CrossRef]
- Mottron, L.; Morasse, K.; Belleville, S. A study of memory functioning in individuals with autism. J. Child Psychol. Psychiatry Allied Discip. 2001, 42, 253–260. [Google Scholar] [CrossRef]
- Calhoun, S.L.; Pearl, A.M.; Fernandez-Mendoza, J.; Durica, K.C.; Mayes, S.D.; Murray, M.J. Sleep Disturbances Increase the Impact of Working Memory Deficits on Learning Problems in Adolescents with High-Functioning Autism Spectrum Disorder. J. Autism Dev. Disord. 2019, 50, 1701–1713. [Google Scholar] [CrossRef]
- Farnsworth, B. Eye Tracking and Autism. Curr. Future Res. 2018. Available online: https://imotions.com/blog/eye-tracking-autism-current-research/ (accessed on 29 August 2020).
- Senju, A.; Southgate, V.; White, S.; Frith, U. Mindblind eyes: An absence of spontaneous theory of mind in Asperger syndrome. Science 2009, 325, 883–885. [Google Scholar] [CrossRef] [Green Version]
- O’Riordan, M.A.; Plaisted, K.C.; Driver, J.; Baron-Cohen, S. Superior visual search in autism. J. Exp. Psychol. Hum. Percept. Perform. 2001, 27, 719. [Google Scholar] [CrossRef] [PubMed]
- Remington, A.; Swettenham, J.; Campbell, R.; Coleman, M. Selective attention and perceptual load in autism spectrum disorder. Psychol. Sci. 2009, 20, 1388–1393. [Google Scholar] [CrossRef] [PubMed] [Green Version]
- Al-Backer, A.; Al-Backer, N.; Alzawad, M.; Habibullah, H.; Bashir, S. The relationship between sleep and cognitive performance in Autism Spectrum Disorder (ASD): A pilot study. Children 2018, 5, 153. [Google Scholar] [CrossRef] [PubMed] [Green Version]
- Mayes, S.D.; Calhoun, S.L. Variables related to sleep problems in children with autism. Res. Autism Spectr. Disord. 2009, 3, 931–941. [Google Scholar] [CrossRef]
- Limoges, É.; Bolduc, C.; Berthiaume, C.; Mottron, L.; Godbout, R. Relationship between poor sleep and daytime cognitive performance in young adults with autism. Res. Dev. Disabil. 2013, 34, 1322–1335. [Google Scholar] [CrossRef]
- Sikora, D.M.; Johnson, K.; Clemons, T.; Katz, T. The relationship between sleep problems and daytime behavior in children of different ages with autism spectrum disorders. Pediatrics 2012, 130, S83–S90. [Google Scholar] [CrossRef] [Green Version]
- Gabriels, R.L.; Cuccaro, M.L.; Hill, D.E.; Ivers, B.J.; Goldson, E. Repetitive behaviors in autism: Relationships with associated clinical features. Res. Dev. Disabil. 2005, 26, 169–181. [Google Scholar] [CrossRef]
- Schreck, K.A.; Mulick, J.A.; Smith, A.F. Sleep problems as possible predictors of intensified symptoms of autism. Res. Dev. Disabil. 2004, 25, 57–66. [Google Scholar] [CrossRef]
- Mazzone, L.; Postorino, V.; Siracusano, M.; Riccioni, A.; Curatolo, P. The Relationship between Sleep Problems, Neurobiological Alterations, Core Symptoms of Autism Spectrum Disorder, and Psychiatric Comorbidities. J. Clin. Med. 2018, 7, 102. [Google Scholar] [CrossRef] [Green Version]
- Weiskop, S.; Richdale, A.; Matthews, J. Behavioural treatment to reduce sleep problems in children with autism or fragile X syndrome. Dev. Med. Child Neurol. 2005, 47, 94–104. [Google Scholar] [CrossRef]
- Wiggs, L.; France, K. Behavioural treatments for sleep problems in children and adolescents with physical illness, psychological problems or intellectual disabilities. Sleep Med. Rev. 2000, 4, 299–314. [Google Scholar] [CrossRef] [PubMed]
- Malow, B.A.; Marzec, M.L.; McGrew, S.G.; Wang, L.; Henderson, L.M.; Stone, W.L. Characterizing sleep in children with autism spectrum disorders: A multidimensional approach. Sleep 2006, 29, 1563–1571. [Google Scholar] [CrossRef] [PubMed] [Green Version]
- Malow, B.; Adkins, K.W.; McGrew, S.G.; Wang, L.; Goldman, S.E.; Fawkes, D. Melatonin for sleep in children with autism: A controlled trial examining dose, tolerability, and outcomes. J. Autism Dev. Disord. 2012, 42, 1729–1737. [Google Scholar] [CrossRef] [PubMed] [Green Version]
- Mughal, R.; Joyce, A.; Hill, C.M.; Dimitriou, D. Sleep Disturbance as a Predictor of Anxiety in Children With Fetal Alcohol Spectrum Disorders and Typically Developing Children. Res. Dev. Disabil. 2020, 101, 103610. [Google Scholar] [CrossRef] [PubMed]
- Wengel, T.; Hanlon-Dearman, A.C.; Fjeldsted, B. Sleep and Sensory Characteristics in Young Children with Fetal Alcohol Spectrum Disorder. J Dev. Behav. Pediatr. 2011, 32, 384–392. [Google Scholar] [CrossRef]
- Garfin, D.G.; McCallon, D. Validity and reliability of the Childhood Autism Rating Scale with autistic adolescents. J. Autism Dev. Disord. 1988, 18, 367–378. [Google Scholar] [CrossRef]
- Nash, K.; Koren, G.; Rovet, J. A differential approach for examining the behavioural phenotype of fetal alcohol spectrum disorders. J. Popul. Ther. Clin. Pharmacol. 2011, 18, e440–e453. [Google Scholar]
- Office for National Statistics. The National Statistics Socio-Economic Classification (NS-SEC). 2016. Available online: https://www.ons.gov.uk/methodology/classificationsandstandards/otherclassifications/thenationalstatisticssocioeconomicclassificationnssecrebasedonsoc2010 (accessed on 29 August 2020).
- CamNTech. Key Sleep Parameters. 2020. Available online: https://www.camntech.com/motionware-software/ (accessed on 29 August 2020).
- Ashworth, A.; Hill, C.M.; Karmiloff-Smith, A.; Dimitriou, D. Cross syndrome comparison of sleep problems in children with Down syndrome and Williams syndrome. Res. Dev. Disabil. 2013, 34, 1572–1580. Available online: http://www.sciencedirect.com/science/article/pii/S0891422213000449 (accessed on 8 March 2015). [CrossRef]
- Sadeh, A.; Sharkey, K.M.; Carskadon, M.A. Activity-based sleep-wake identification: An empirical test of methodological issues. Sleep 1994, 17, 201–207. [Google Scholar] [CrossRef] [Green Version]
- Sadeh, A. The role and validity of actigraphy in sleep medicine: An update. Sleep Med. Rev. 2011, 15, 259–267. [Google Scholar] [CrossRef]
- Raven, J.; Raven, J.C.; Court, J. Manual for Raven’s Progressive Matrices and Vocabulary Scale; H.K.Lewis: London, UK, 1998; p. 71. [Google Scholar]
- Abdel-Khalek, A.M. Reliability and factorial validity of the standard progressive matrices among Kuwaiti children ages 8 to 15 years. Percept. Mot. Skills 2005, 101, 409–412. [Google Scholar] [CrossRef] [PubMed]
- Dunn, L.M.; Dunn, L.M.; Whetton, C.; Burley, J. British Picture Vocabulary Scale 2nd edition (BPVS-II). 1997. Available online: https://www.gl-assessment.co.uk/products/british-picture-vocabulary-scale-bpvs3/ (accessed on 8 April 2020).
- Wechsler, D. Wechsler Adult Intelligence Scale—Third Edition (WAIS-III). 1997. Available online: https://www.pearsonassessments.com/store/usassessments/en/Store/Professional-Assessments/Cognition-%26-Neuro/-Wechsler-Adult-Intelligence-Scale-%7C-Third-Edition/p/100000243.html?tab=product-details (accessed on 8 April 2020).
- Sung, J.E. The Reliability and Validity of Short-term and Working Memory Pointing Tasks Developed for Clinical Populations with Speech and Language Disorders. Commun. Sci. Disord. 2011, 16, 185–201. [Google Scholar]
- Canivez, G.L.; Watkins, M.W.; Dombrowski, S.C. Structural validity of the Wechsler Intelligence Scale for Children-Fifth Edition: Confirmatory factor analyses with the 16 primary and secondary subtests. Psychol. Assess 2017, 29, 458. [Google Scholar] [CrossRef] [PubMed]
- Matlab, Psychtools. Psychtoolbox-3. 2020. Available online: https://uk.mathworks.com/matlabcentral/fileexchange/70391-psychtoolbox-3 (accessed on 8 April 2020).
- Rinehart, S.A.; Brereton, A.V.; Tonge, B.J. A deficit in shifting attention present in high-functioning autism but not Asperger’s disorder. Autism 2001, 5, 67–80. [Google Scholar] [CrossRef]
- Simmons, R.W.; Wass, T.; Thomas, J.D.; Riley, E.P. Fractionated simple and choice reaction time in children with prenatal exposure to alcohol. Alcohol. Clin. Exp. Res. 2002, 26, 1412–1419. [Google Scholar] [CrossRef]
- Díaz-Román, A.; Zhang, J.; Delorme, R.; Beggiato, A.; Cortese, S. Sleep in youth with autism spectrum disorders: Systematic review and meta-analysis of subjective and objective studies. Evid.-based Mental Health 2018, 21, 146–154. [Google Scholar] [CrossRef]
- Price, A.; Cook, P.; Norgate, S.; Mukherjee, R. Prenatal alcohol exposure and traumatic childhood experiences: A systematic review. Neurosci. Biobehav. Rev. 2017, 80, 89–98. [Google Scholar] [CrossRef]
- Habib, A.; Harris, L.; Pollick, F.; Melville, C. A meta-analysis of working memory in individuals with autism spectrum disorders. PLoS ONE 2019, 14, e0216198. [Google Scholar] [CrossRef] [Green Version]
- Baddeley, A.D.; Hitch, G. Working memory. In Psychology of Learning and Motivation; Academic Press: Cambridge, MA, USA, 1974; pp. 47–89. [Google Scholar]
- Karmiloff-Smith, A. Nativism Versus Neuroconstructivism: Rethinking the Study of Developmental Disorders. Dev. Psychol. 2009, 45, 56. [Google Scholar] [CrossRef]
- Chee, M.W.L.; Choo, W.C. Functional imaging of working memory after 24 h of total sleep deprivation. J. Neurosci. 2004, 24, 4560–4567. [Google Scholar] [CrossRef]
- Beebe, D. Cognitive, Behavioral, and Functional Consequences of Inadequate Sleep in Children and Adolescents. Pediatr. Clin. N. Am. 2011, 58, 649–665. [Google Scholar] [CrossRef] [PubMed] [Green Version]
- Kelly, S.J.; Day, N.; Streissguth, A.P. Effects of prenatal alcohol exposure on social behavior in humans and other species. Neurotoxicol. Teratol. 2000, 22, 143–149. [Google Scholar] [CrossRef] [Green Version]
- Kooistra, L.; Crawford, S.; Gibbard, B.; Kaplan, B.J.; Fan, J. Comparing attentional networks in fetal alcohol spectrum disorder and the inattentive and combined subtypes of attention deficit hyperactivity disorder. Dev. Neuropsychol. 2011, 36, 566–577. [Google Scholar] [CrossRef] [PubMed]
- Catterick, M.; Curran, L. Understanding Fetal Alcohol Spectrum Disorder: A Guide to FASD for Parents; Carers and Professionals; JKP Essentials Series; Jessica Kingsley Publishers: London, UK, 2014. [Google Scholar]


| Autism (n = 21) | FASD (n = 29) | TD (n = 45) | |
|---|---|---|---|
| Male/Female | 17/4 1 | 16/13 | 23/22 |
| Age (M/SD) | 8.42(1.81) | 9.60(2.48) 2 | 8.12(1.29) |
| SES 1/2/3 | 5/15/1 | 1/20/8 | 6/29/10 |
| Living with Biological parent | 21 | 1 3 | 44 |
| Living with Foster parent | 0 | 22 | 1 |
| Living with Adoptive parent | 0 | 4 | 0 |
| Living with Biological relative | 0 | 2 | 0 |
| Co-occurrence | - | SPD (n = 2); ADHD (n = 2) | - |
| Autism (n = 17) | FASD (n = 26) | TD (n = 45) | |||||||
|---|---|---|---|---|---|---|---|---|---|
| Mean | SD. | Mean | SD. | Mean | SD. | F | p | np2 | |
| Bed Time | 21:18:45 | 0:57:26 | 21:14:50 | 1:21:32 | 21:08:13 | 0:55:32 | 0.28 | 0.75 1 | 0.01 |
| Wake Time (hh:mm:ss) | 0:07:03 | 0:01:13 | 0:07:06 | 0:01:10 | 0:06:59 | 0:00:43 | 0.13 | 0.88 1 | 0.00 |
| Assumed Sleep Time (hh:mm:ss) | 9:12:52 | 1:00:52 | 9:29:20 | 0:57:11 | 9:45:58 | 1:18:25 | 1.42 | 0.25 1 | 0.03 |
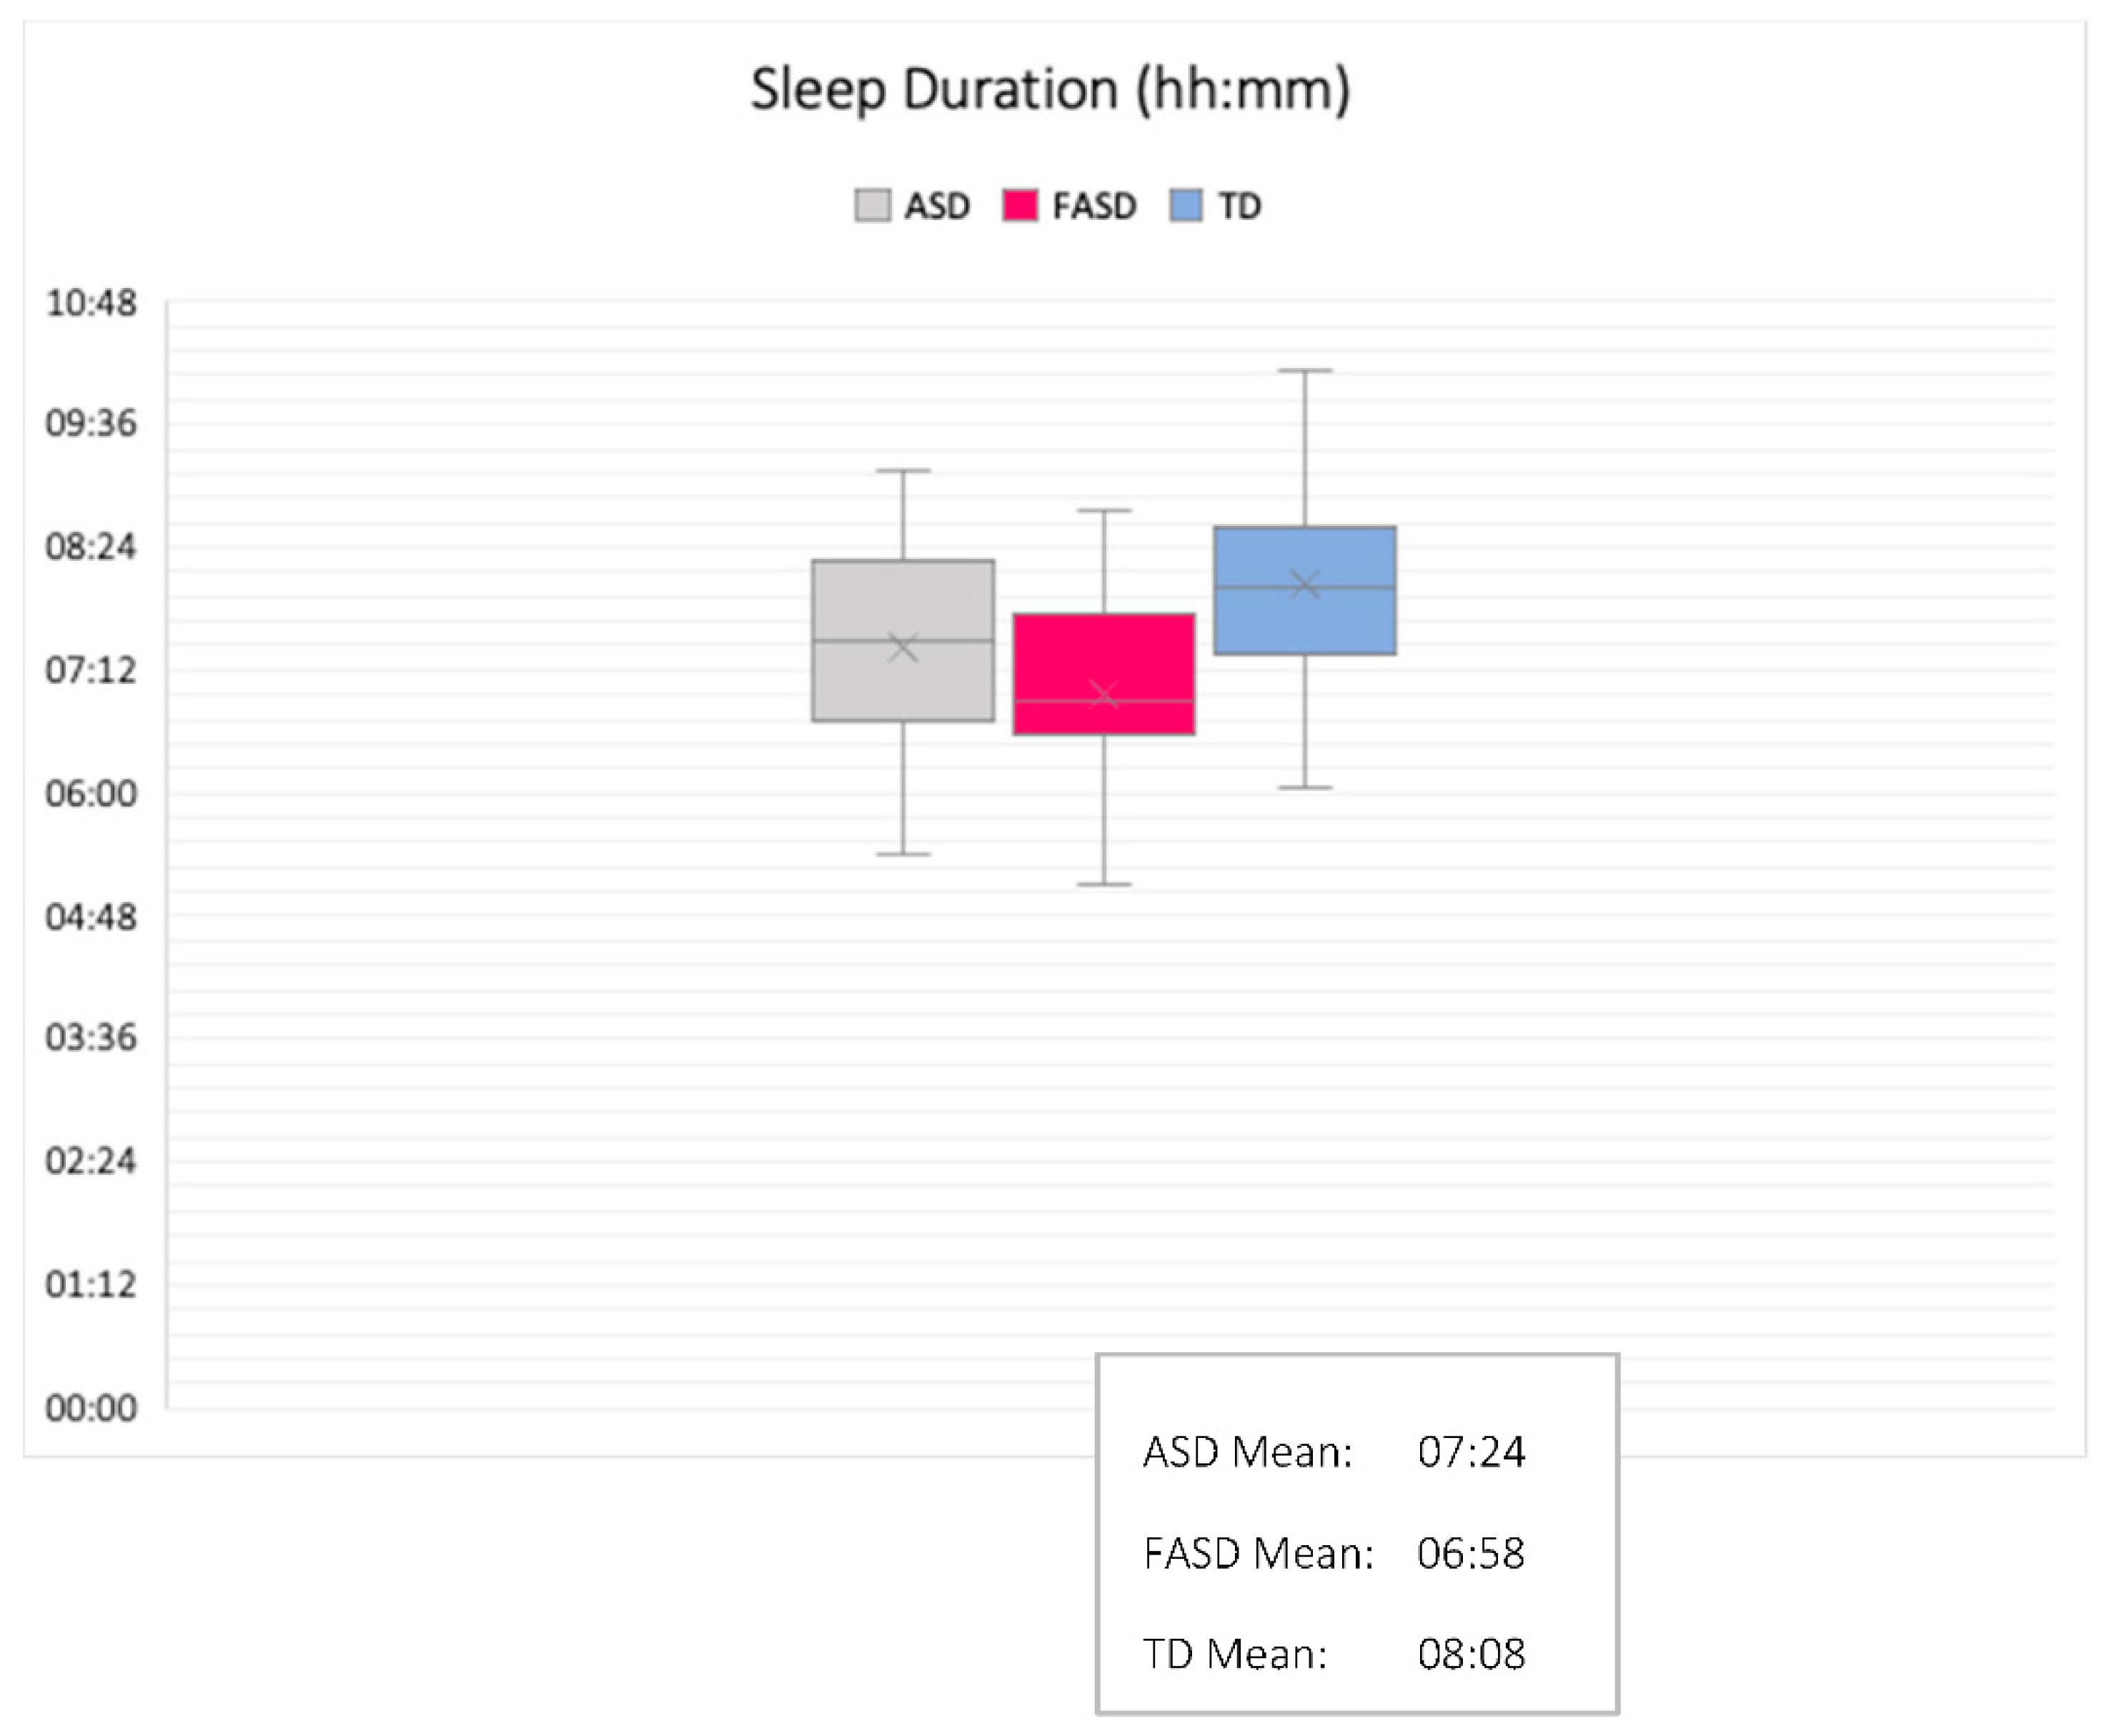
| Actual Sleep Time (hh:mm:ss) | 7:24:33 | 1:03:03 | 6:58:41 | 1:11:07 | 8:06:55 | 1:04:44 | 8.74 | <0.0012,3,4 | 0.18 * |
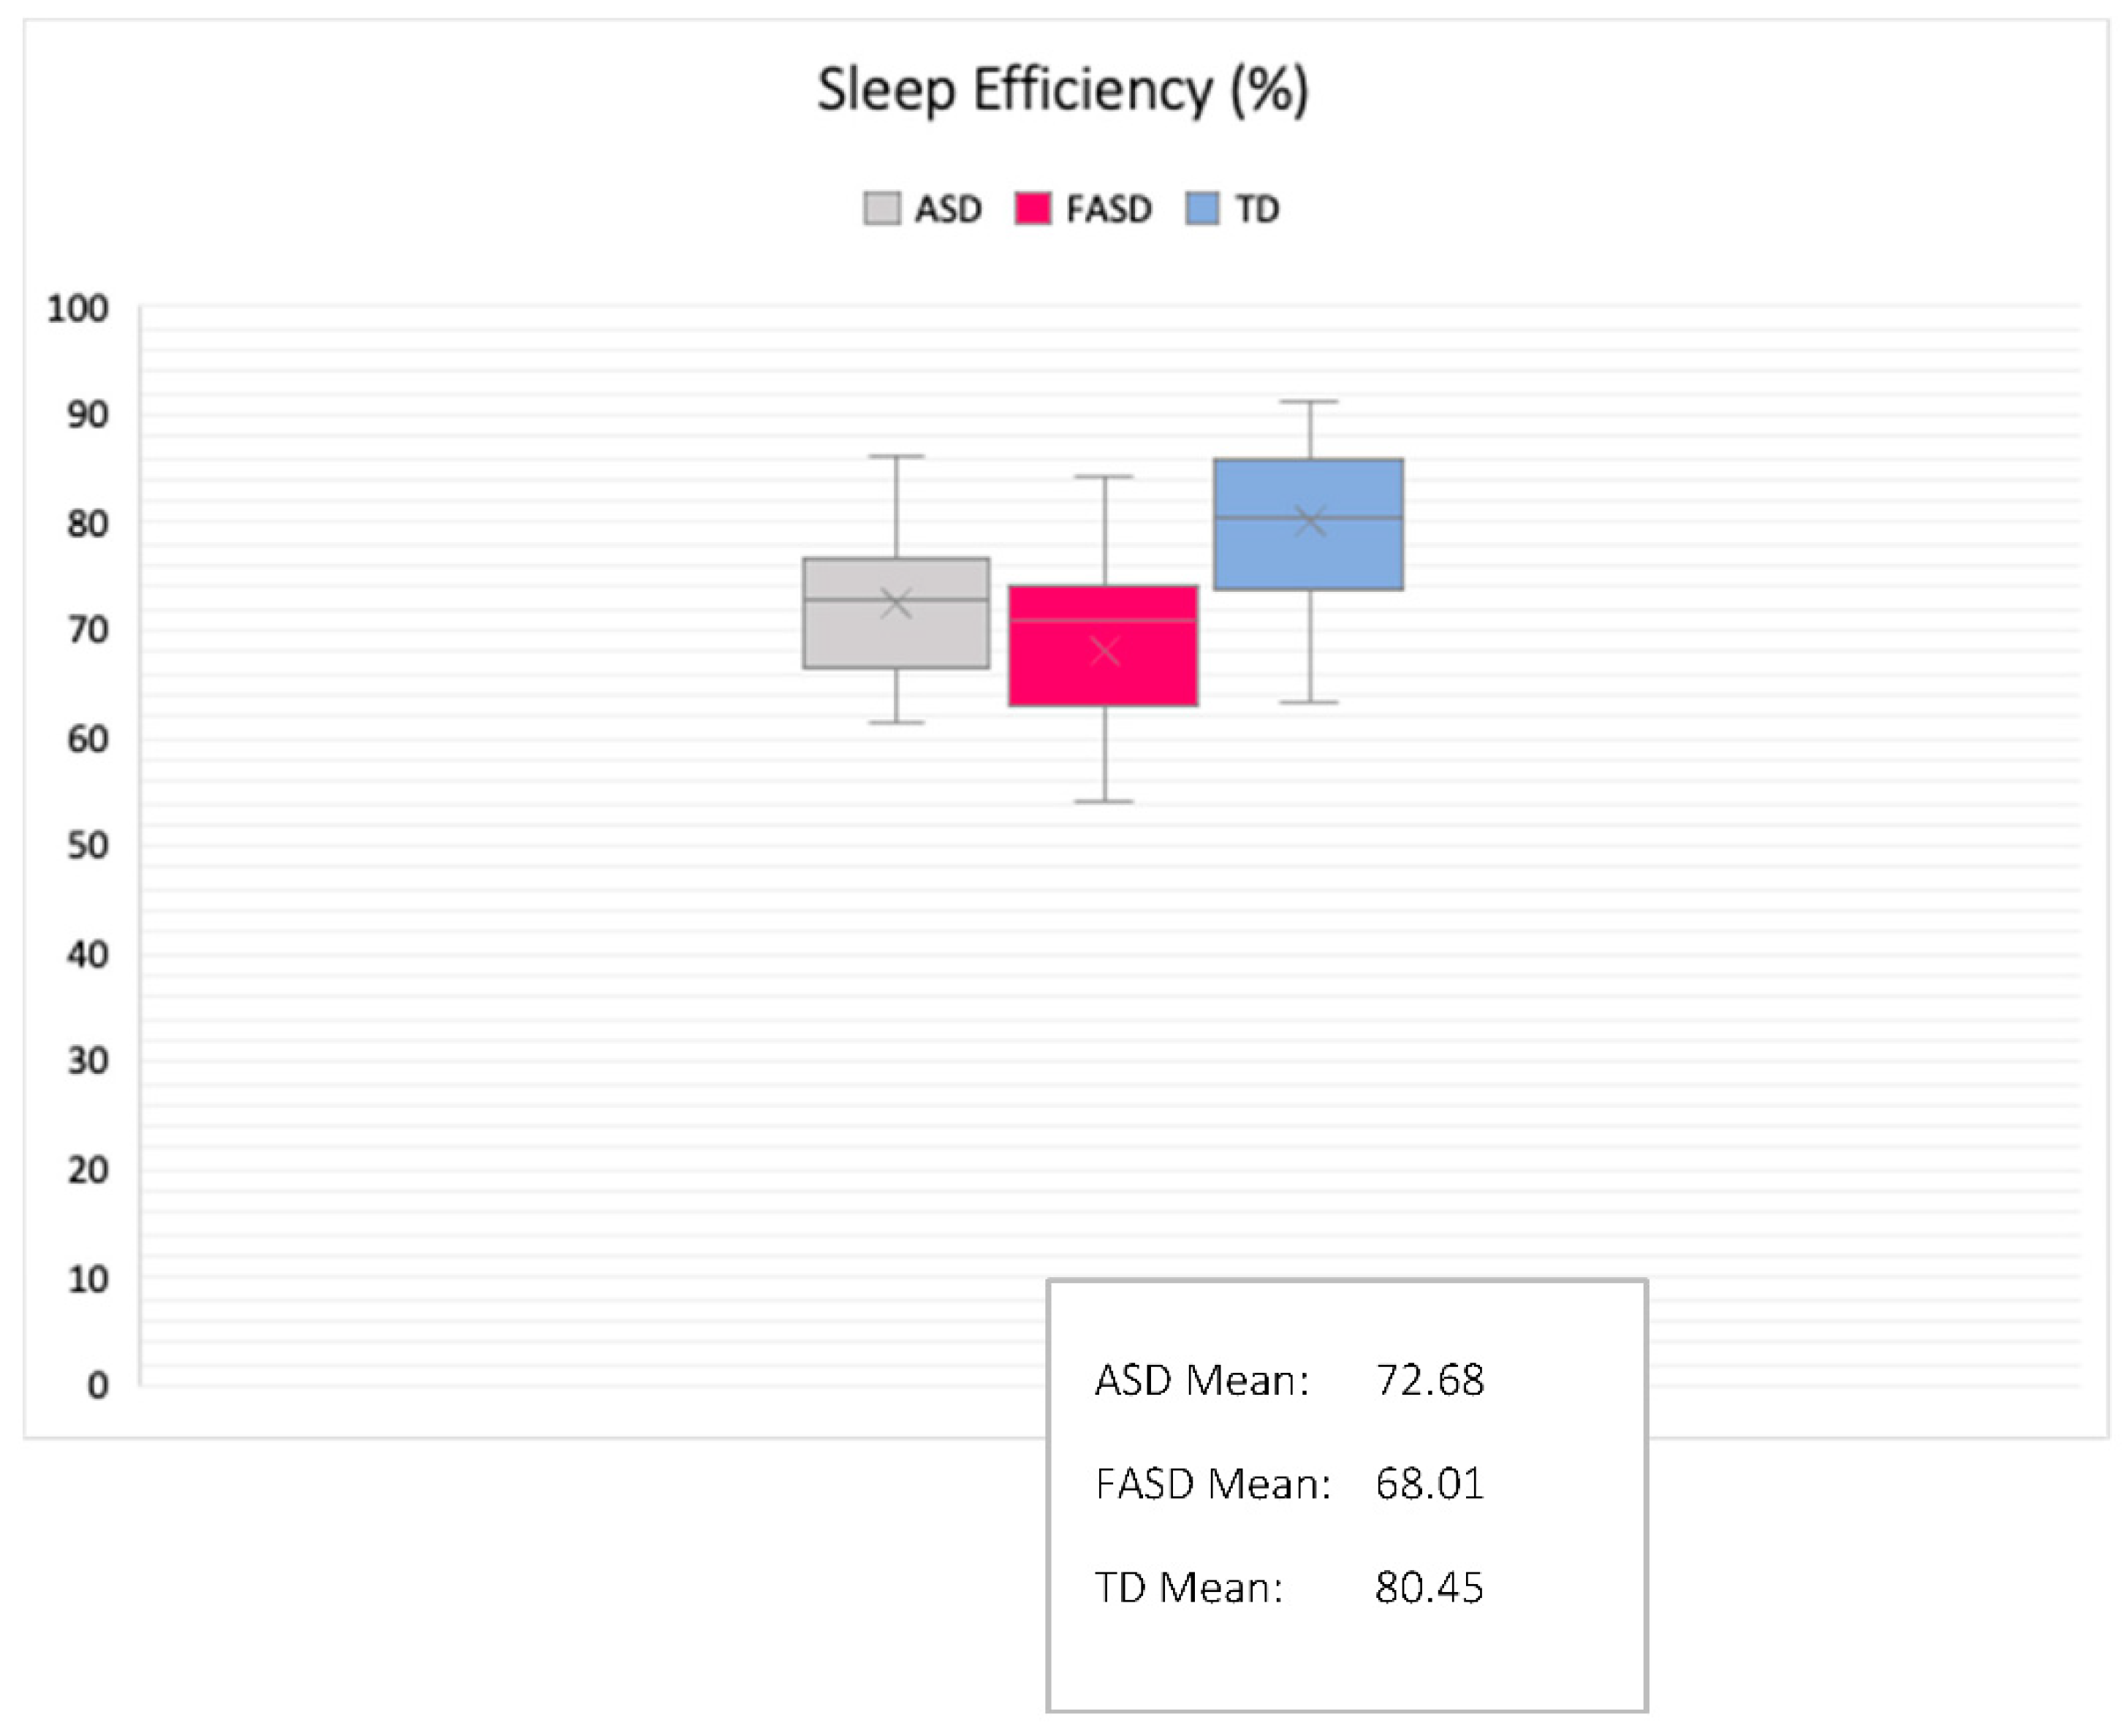
| Sleep Efficiency (%) | 72.68 | 7.55 | 68.00 | 10.82 | 80.02 | 6.99 | 16.39 | <0.0012,3,4 | 0.29 * |
| Sleep Latency (hh:mm:ss) | 0:38:18 | 0:34:12 | 0:24:30 | 0:20:20 | 0:26:08 | 0:26:49 | 1.53 | 0.22 | 0.04 |
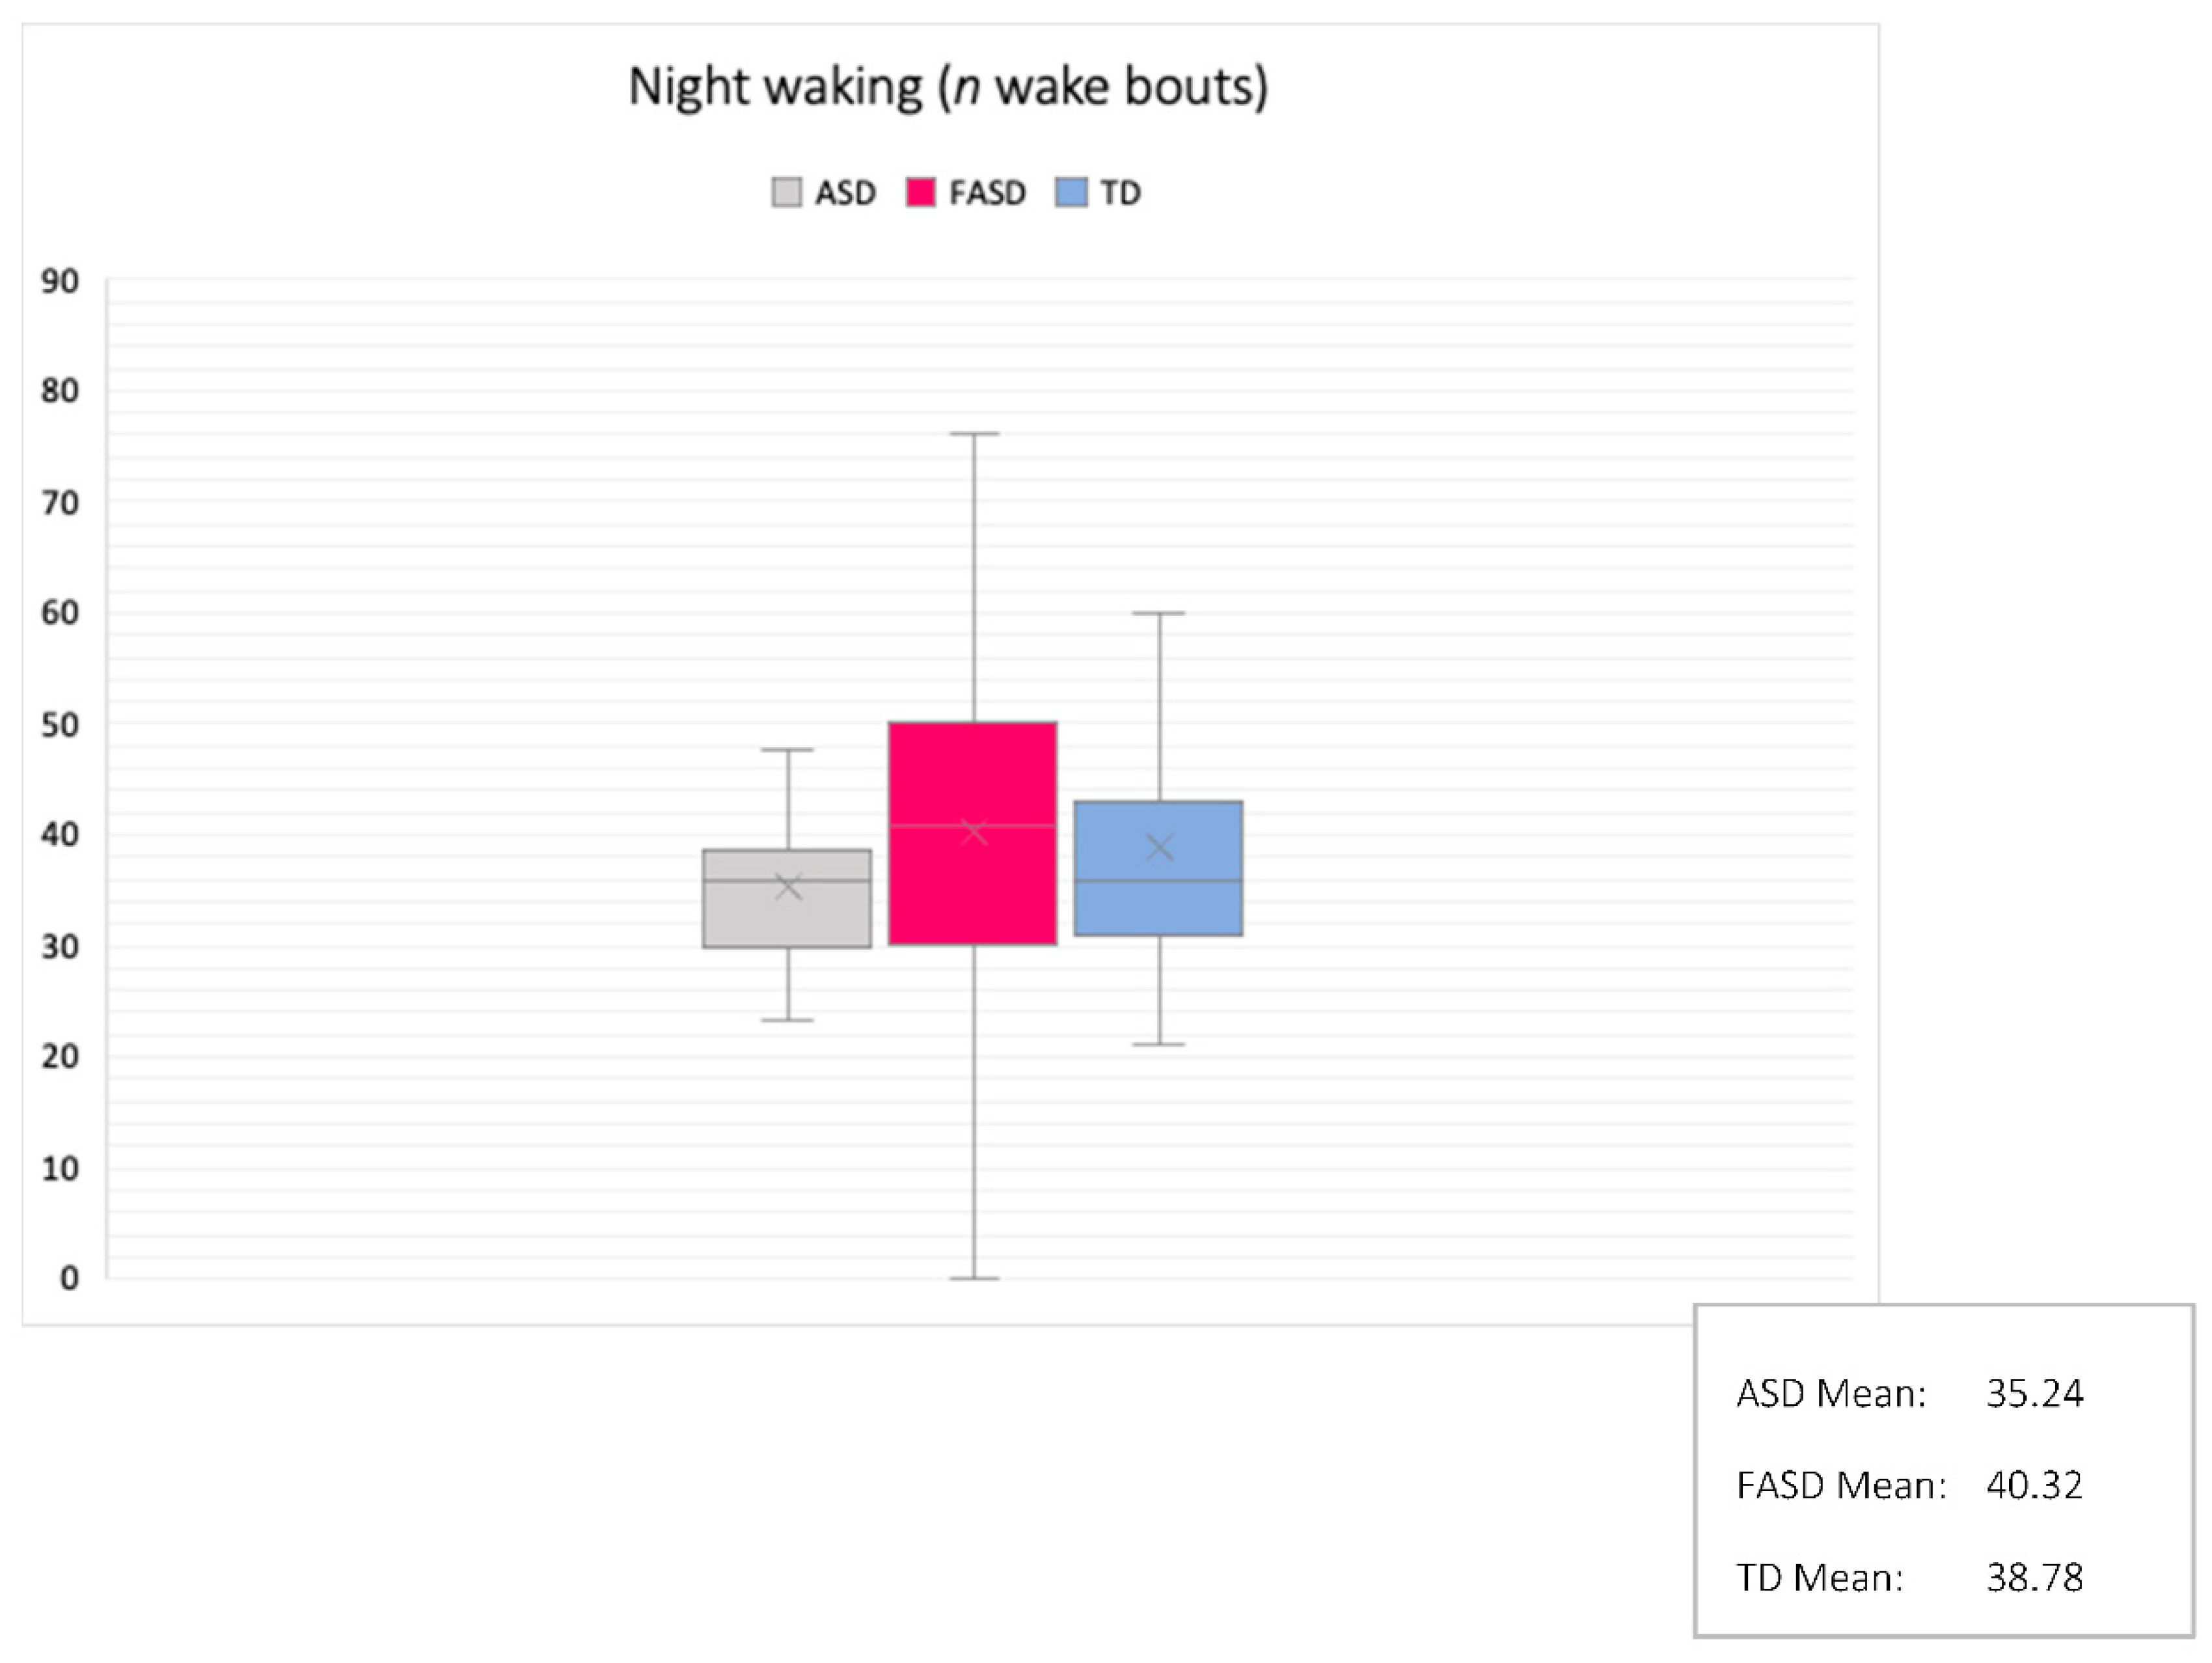
| Mean Sleep Bout (hh:mm:ss) Night Wakings (n) | 0:24:21 35.24 | 0:33:54 7.20 | 0:11:00 40.32 | 0:03:21 16.73 | 0:13:50 38.61 | 0:04:07 13.65 | 4.10 0.67 | 0.022,3 0.51 | 0.14 * 0.02 |
| Mean Night Waking (hh:mm:ss) | 0:03:07 | 0:00:46 | 0:04:18 | 0:03:31 | 0:02:36 | 0:01:03 | 4.99 | 0.012,3 | 0.11 * |
| Mean Mobile Activity | 18.15 | 8.24 | 30.32 | 32.47 | 24.73 | 10.83 | 1.85 | 0.16 | 0.09 * |
| Fragmentation Index | 31.06 | 7.60 | 40.44 | 17.08 | 36.01 | 9.76 | 2.96 | 0.052,3,4 | 0.07 * |
| β | R2 | p | |
|---|---|---|---|
| Assumed Sleep/CA | |||
| Autism | 0.26 | 0.07 | 0.79 |
| FASD | −0.15 | 0.02 | 0.10 |
| TD | 0 | <0.01 | 0.72 |
| Sleep Duration/CA | |||
| Autism | −0.33 | 0.11 | 0.14 |
| FASD | −0.14 | 0.02 | 0.49 |
| TD | −0.02 | <0.01 | 0.91 |
| Sleep Efficiency/CA | |||
| Autism | 0.11 | 0.01 | 0.69 |
| FASD | −0.16 | 0.03 | 0.43 |
| TD | 0.02 | <0.01 | 0.89 |
| Sleep Latency/CA | |||
| Autism | −0.22 | 0.05 | 0.42 |
| FASD | 0.07 | 0.01 | 0.72 |
| TD | 0.01 | <0.01 | 0.93 |
| Fragmentation/CA | |||
| Autism | −0.07 | 0.01 | 0.79 |
| FASD | 0.21 | 0.04 | 0.31 |
| TD | 0.06 | <0.01 | 0.72 |
| Autism (M (SD)) | FASD (M (SD)) | TD (M (SD)) | f | Sig | Autism/ TD | FASD/ TD | Autism/ FASD | |
|---|---|---|---|---|---|---|---|---|
| RSPM Score | 22.38 | 18.75 | 26.82 | 2.09 | 0.04 | 0.04 | 0.001 | 0.003 |
| (8.81) | (10.01) | (6.83) | ||||||
| BPVS Standard Score | 95.09 | 87.16 | 98.91 | 5.136 | 0.01 | 0.79 OR | 0.01 OR | 0.05 |
| (15.79) | (15.12) | (13.95) | ||||||
| Correct Responses (n) | 86.47 (9.75) | 85.41 (23.72) | 93.8 (7.79) | 3.56 | 0.03 | 0.12 | <0.001 | 0.05 |
| Reaction Time Correct (ms) | 1162.17 (776.78) | 942.27 (370.74) | 862.86 (289.58) | 2.93 | 0.05 | 0.04 | 0.05 | 0.05 |
| Reaction Time Incorrect (ms) | 799.67 (461.76) | 2577.27 (8435.94) | 683.61 (405.93) | 3.56 | 0.03 | 0.01 | 0.05 | 0.02 |
| Impulsivity | 4.14 (6.69) | 5.36 (21.23) | 0.27 (1.27) | 3.88 | 0.01 | 0.03 | 0.04 | 0.62 |
| Digit Span Forward | 20.62 (7.02) | 17.04 (6.33) | 22.73 (5.30) | 7.02 | 0.001 | 0.21 | 0.001 | 0.03 |
| Digit Span Backward | 10.1 (5.30) | 9.92 (4.37) | 13.47 (5.86) | 4.12 | 0.02 | 0.05 | 0.02 | 0.43 * |
| Autism (n = 20) | FASD (n = 25) | TD (n = 45) | |||||||||||||
|---|---|---|---|---|---|---|---|---|---|---|---|---|---|---|---|
| B | SEB | ß | R2 | p | B | SEB | ß | R2 | p | B | SEB | ß | R2 | p | |
| RSPM | |||||||||||||||
| Bedtime | <0.001 | 0 | 0.11 | 0.37 | 0.66 | <0.001 | <0.001 | 0.32 | 0.48 | 0.01 | 0.01 | 0 | 0.32 | 0.6 | 0.01 |
| Sleep Efficiency | 0.1 | 0.07 | 0.35 | 0.12 | 0.18 | −0.1 | 0.06 | −0.5 | 0.18 | 0.02 | −0.1 | 0.1 | −0.1 | 0.02 | 0.57 |
| Wake time | 0.09 | 16.5 | 0 | <0.001 | 0.99 | 76.1 | 23.8 | 0.58 | 0.34 | 0.004 | 44.8 | 80.6 | 0.09 | <0.001 | 0.59 |
| Mean night waking | −0.3 | 4.94 | −0.2 | 0.03 | 0.56 | 2.89 | 1.4 | 0.42 | 0.14 | 0.05 | −0.2 | 0.95 | −0.3 | 0.03 | 0.87 |
| Mean mobile activity | 0.01 | 0.09 | 0.02 | <0.001 | 0.96 | 0.42 | 0.14 | 0.56 | 0.28 | 0.01 | −0.1 | 0.16 | −0.1 | 0.01 | 0.65 |
| BPVS | |||||||||||||||
| Bedtime | <0.001 | 0 | 0.11 | 0.37 | 0.66 | <0.001 | <0.001 | 0.32 | 0.48 | 0.01 | 0.01 | 0 | 0.32 | 0.6 | 0.01 |
| Sleep Efficiency | 1.78 | 1.28 | 0.34 | 0.16 | 0.18 | −2.1 | 0.86 | −0.5 | 0.22 | 0.03 | −0.4 | 0.35 | −0.2 | 0.04 | 0.23 |
| Mean mobile activity | −0.1 | 1.13 | −0.1 | 0.01 | 0.96 | 1.05 | 0.31 | 0.59 | 0.36 | 0.003 | −0.1 | 0.23 | −0.1 | 0.09 | 0.55 |
| Sleep Fragmentation | −1.6 | 1.26 | −0.3 | 0.1 | 0.23 | 0.97 | 0.41 | 0.44 | 0.21 | 0.03 | −0.5 | 0.26 | −0.3 | 0.01 | 0.84 |
| Reaction Time Correct | |||||||||||||||
| Sleep Bouts | 1.25 | 0.31 | 0.29 | 0.32 | 0.04 | 0.97 | 0.4 | 0.09 | 0.03 | 0.57 | 2.97 | 0.34 | 0.47 | 0.24 | 0.01 |
| Impulsivity | |||||||||||||||
| Sleep Fragmentation | 0.85 | 0.03 | 0.39 | 0.31 | 0.01 | 1.23 | 1.11 | 0.06 | 0.01 | 0.32 | 2.32 | 1.24 | 0.12 | 0.14 | 0.34 |
| Digit Span Forwards | |||||||||||||||
| Sleep Efficiency | 1.78 | 0.01 | 0.33 | 0.24 | 0.01 | 0.02 | 0 | 0.19 | 0.09 | 0.21 | 1.68 | 0.01 | 0.41 | 0.32 | 0.01 |
| Digit Span Backwards | |||||||||||||||
| Bedtime | 1.68 | 0.12 | 0.42 | 0.21 | 0.22 | 2.36 | 0.21 | 0.54 | 0.29 | 0.05 | 1.7 | 0.02 | 0.38 | 0.26 | 0.04 |
| Actual Sleep | 1.35 | 0.15 | 0.39 | 0.24 | 0.01 | 2.55 | 1.01 | 0.03 | 0.42 | 0.23 | 0.01 | 0 | 0.01 | 0.05 | 0.57 |
Publisher’s Note: MDPI stays neutral with regard to jurisdictional claims in published maps and institutional affiliations. |
© 2020 by the authors. Licensee MDPI, Basel, Switzerland. This article is an open access article distributed under the terms and conditions of the Creative Commons Attribution (CC BY) license (http://creativecommons.org/licenses/by/4.0/).
Share and Cite
Mughal, R.; Hill, C.M.; Joyce, A.; Dimitriou, D. Sleep and Cognition in Children with Fetal Alcohol Spectrum Disorders (FASD) and Children with Autism Spectrum Disorders (ASD). Brain Sci. 2020, 10, 863. https://doi.org/10.3390/brainsci10110863
Mughal R, Hill CM, Joyce A, Dimitriou D. Sleep and Cognition in Children with Fetal Alcohol Spectrum Disorders (FASD) and Children with Autism Spectrum Disorders (ASD). Brain Sciences. 2020; 10(11):863. https://doi.org/10.3390/brainsci10110863
Chicago/Turabian StyleMughal, Rabya, Catherine M. Hill, Anna Joyce, and Dagmara Dimitriou. 2020. "Sleep and Cognition in Children with Fetal Alcohol Spectrum Disorders (FASD) and Children with Autism Spectrum Disorders (ASD)" Brain Sciences 10, no. 11: 863. https://doi.org/10.3390/brainsci10110863