How the Brain Understands Spoken and Sung Sentences

 ,
,
Abstract
:1. Introduction
1.1. Electrophysiological Correlates of Semantic Processing in Speech and Song
1.2. Brain Regions Supporting Semantic Processing in Speech and Song
1.3. The Present Study
2. Materials and Methods
2.1. Participants
2.2. Materials
2.3. Experimental Procedure
2.4. Neuroscientific Recording
2.4.1. EEG Recording
2.4.2. fNIRS Recording
2.5. Data Analyses
2.5.1. Behavioral Data Analyses
2.5.2. EEG Data Analyses
2.5.3. fNIRS Data Analyses
3. Results
3.1. Behavioral Results
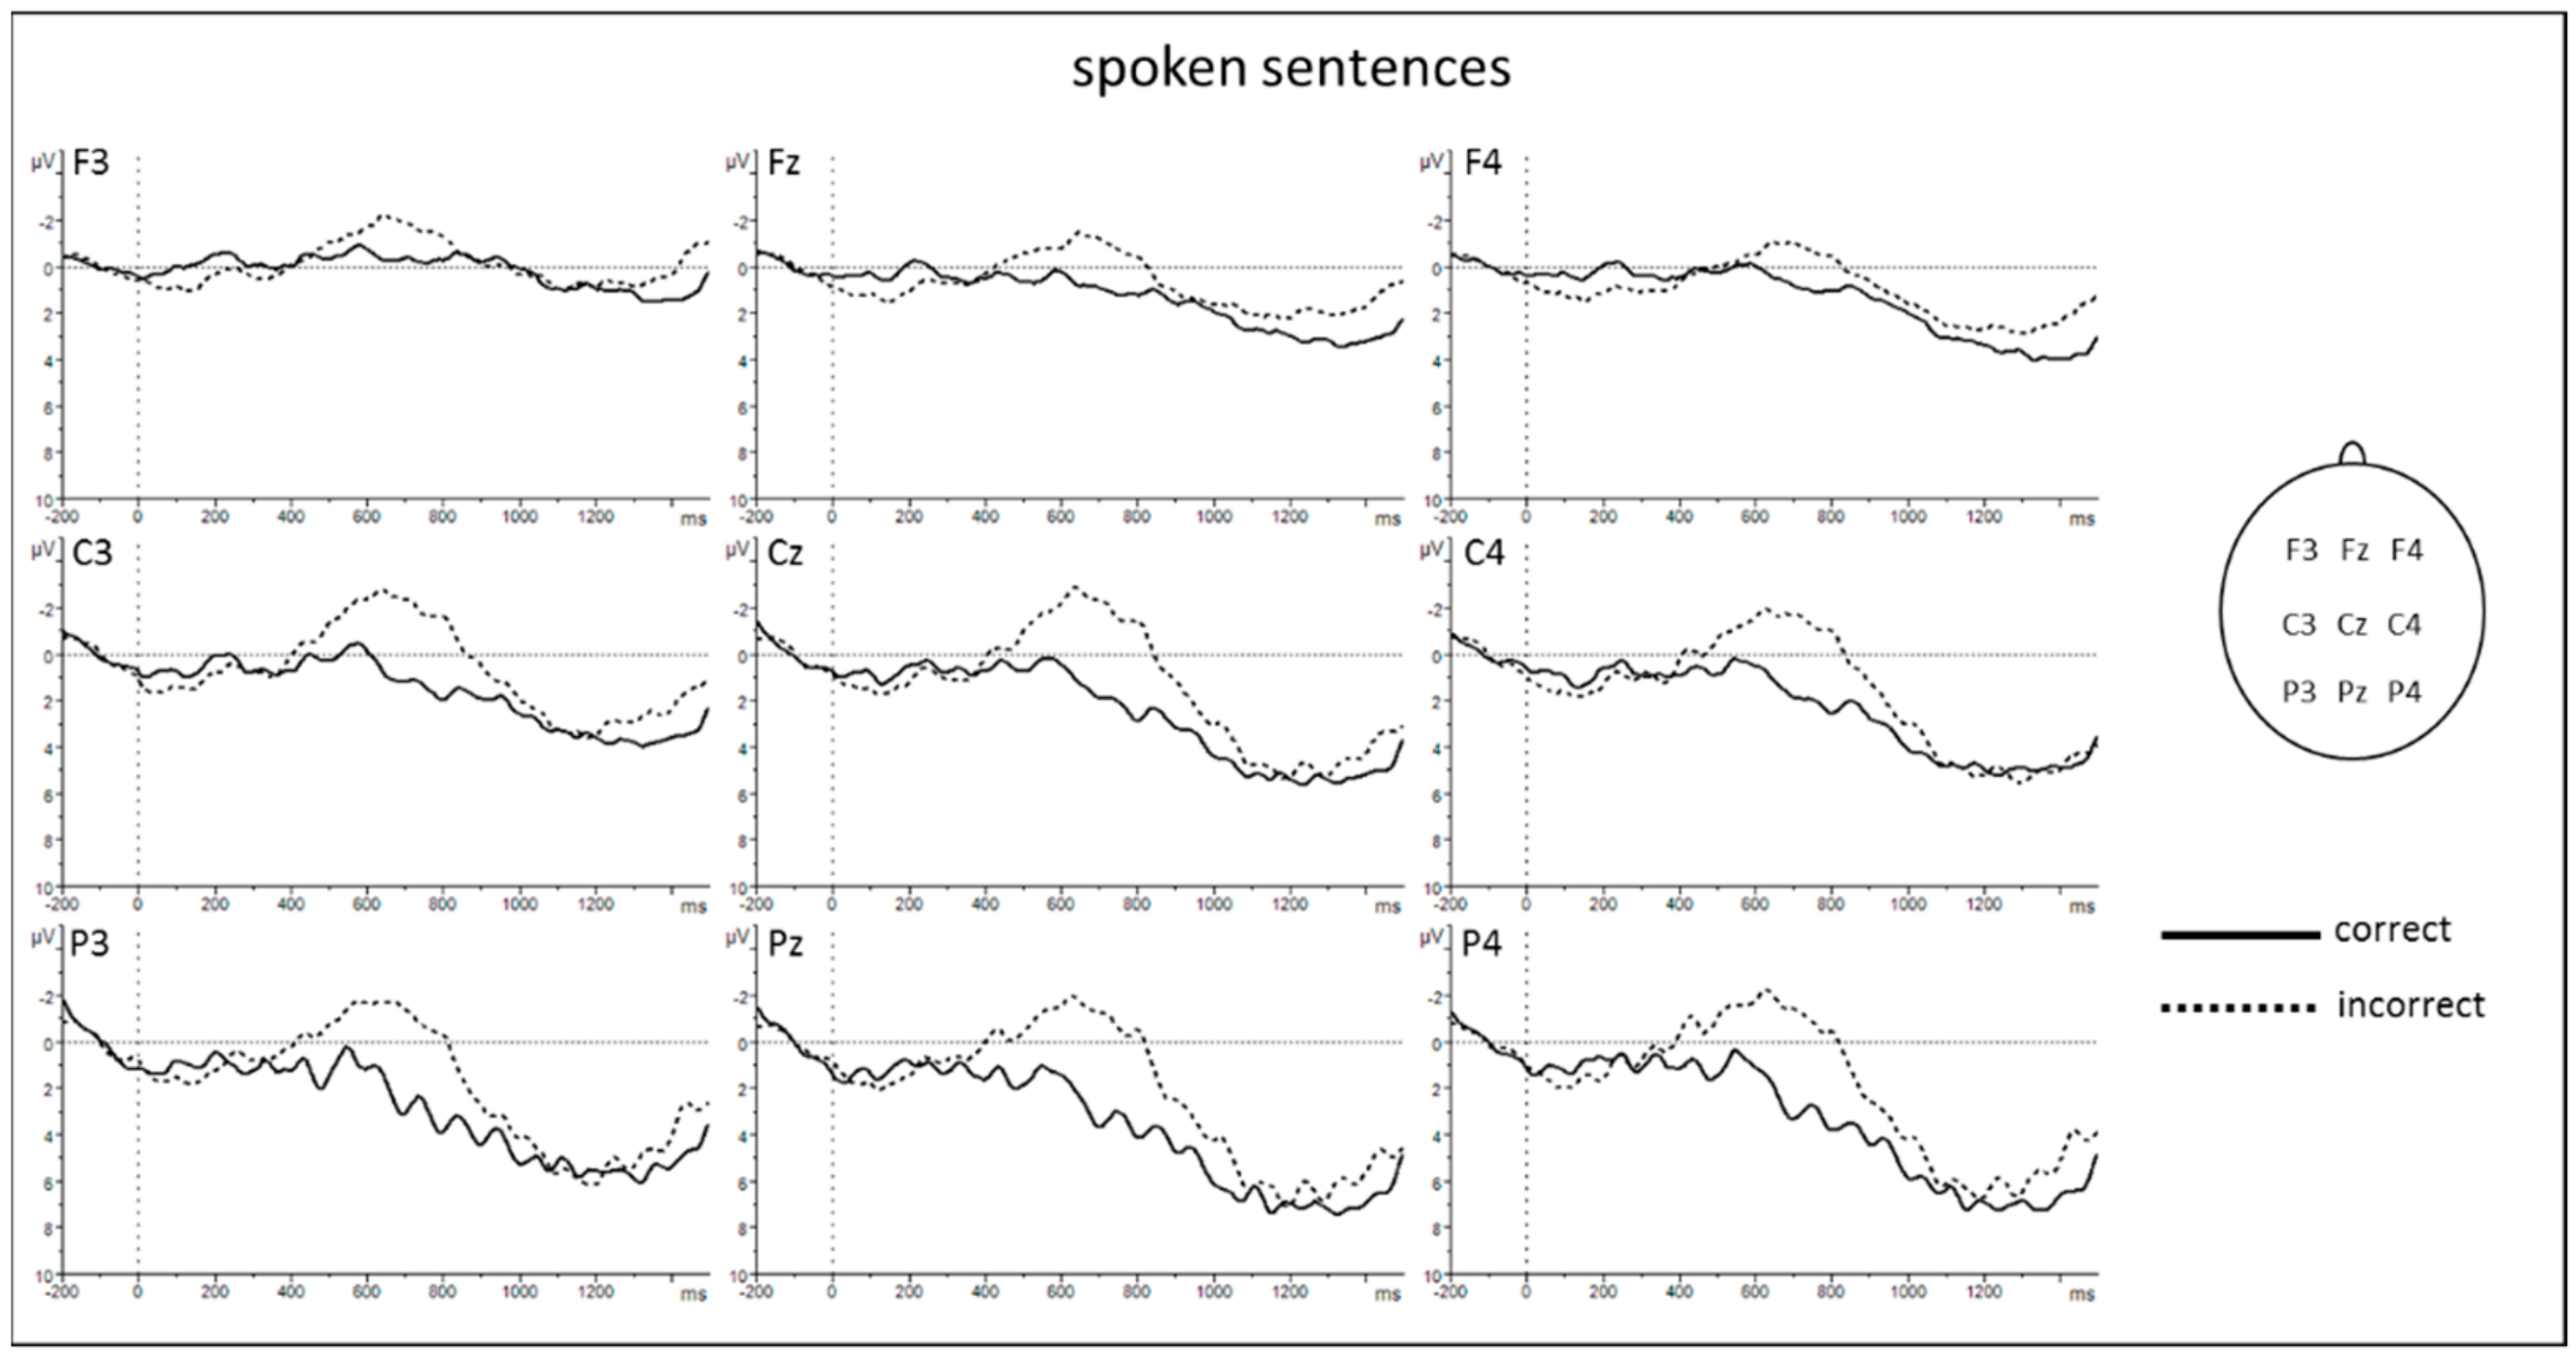
3.2. EEG Results
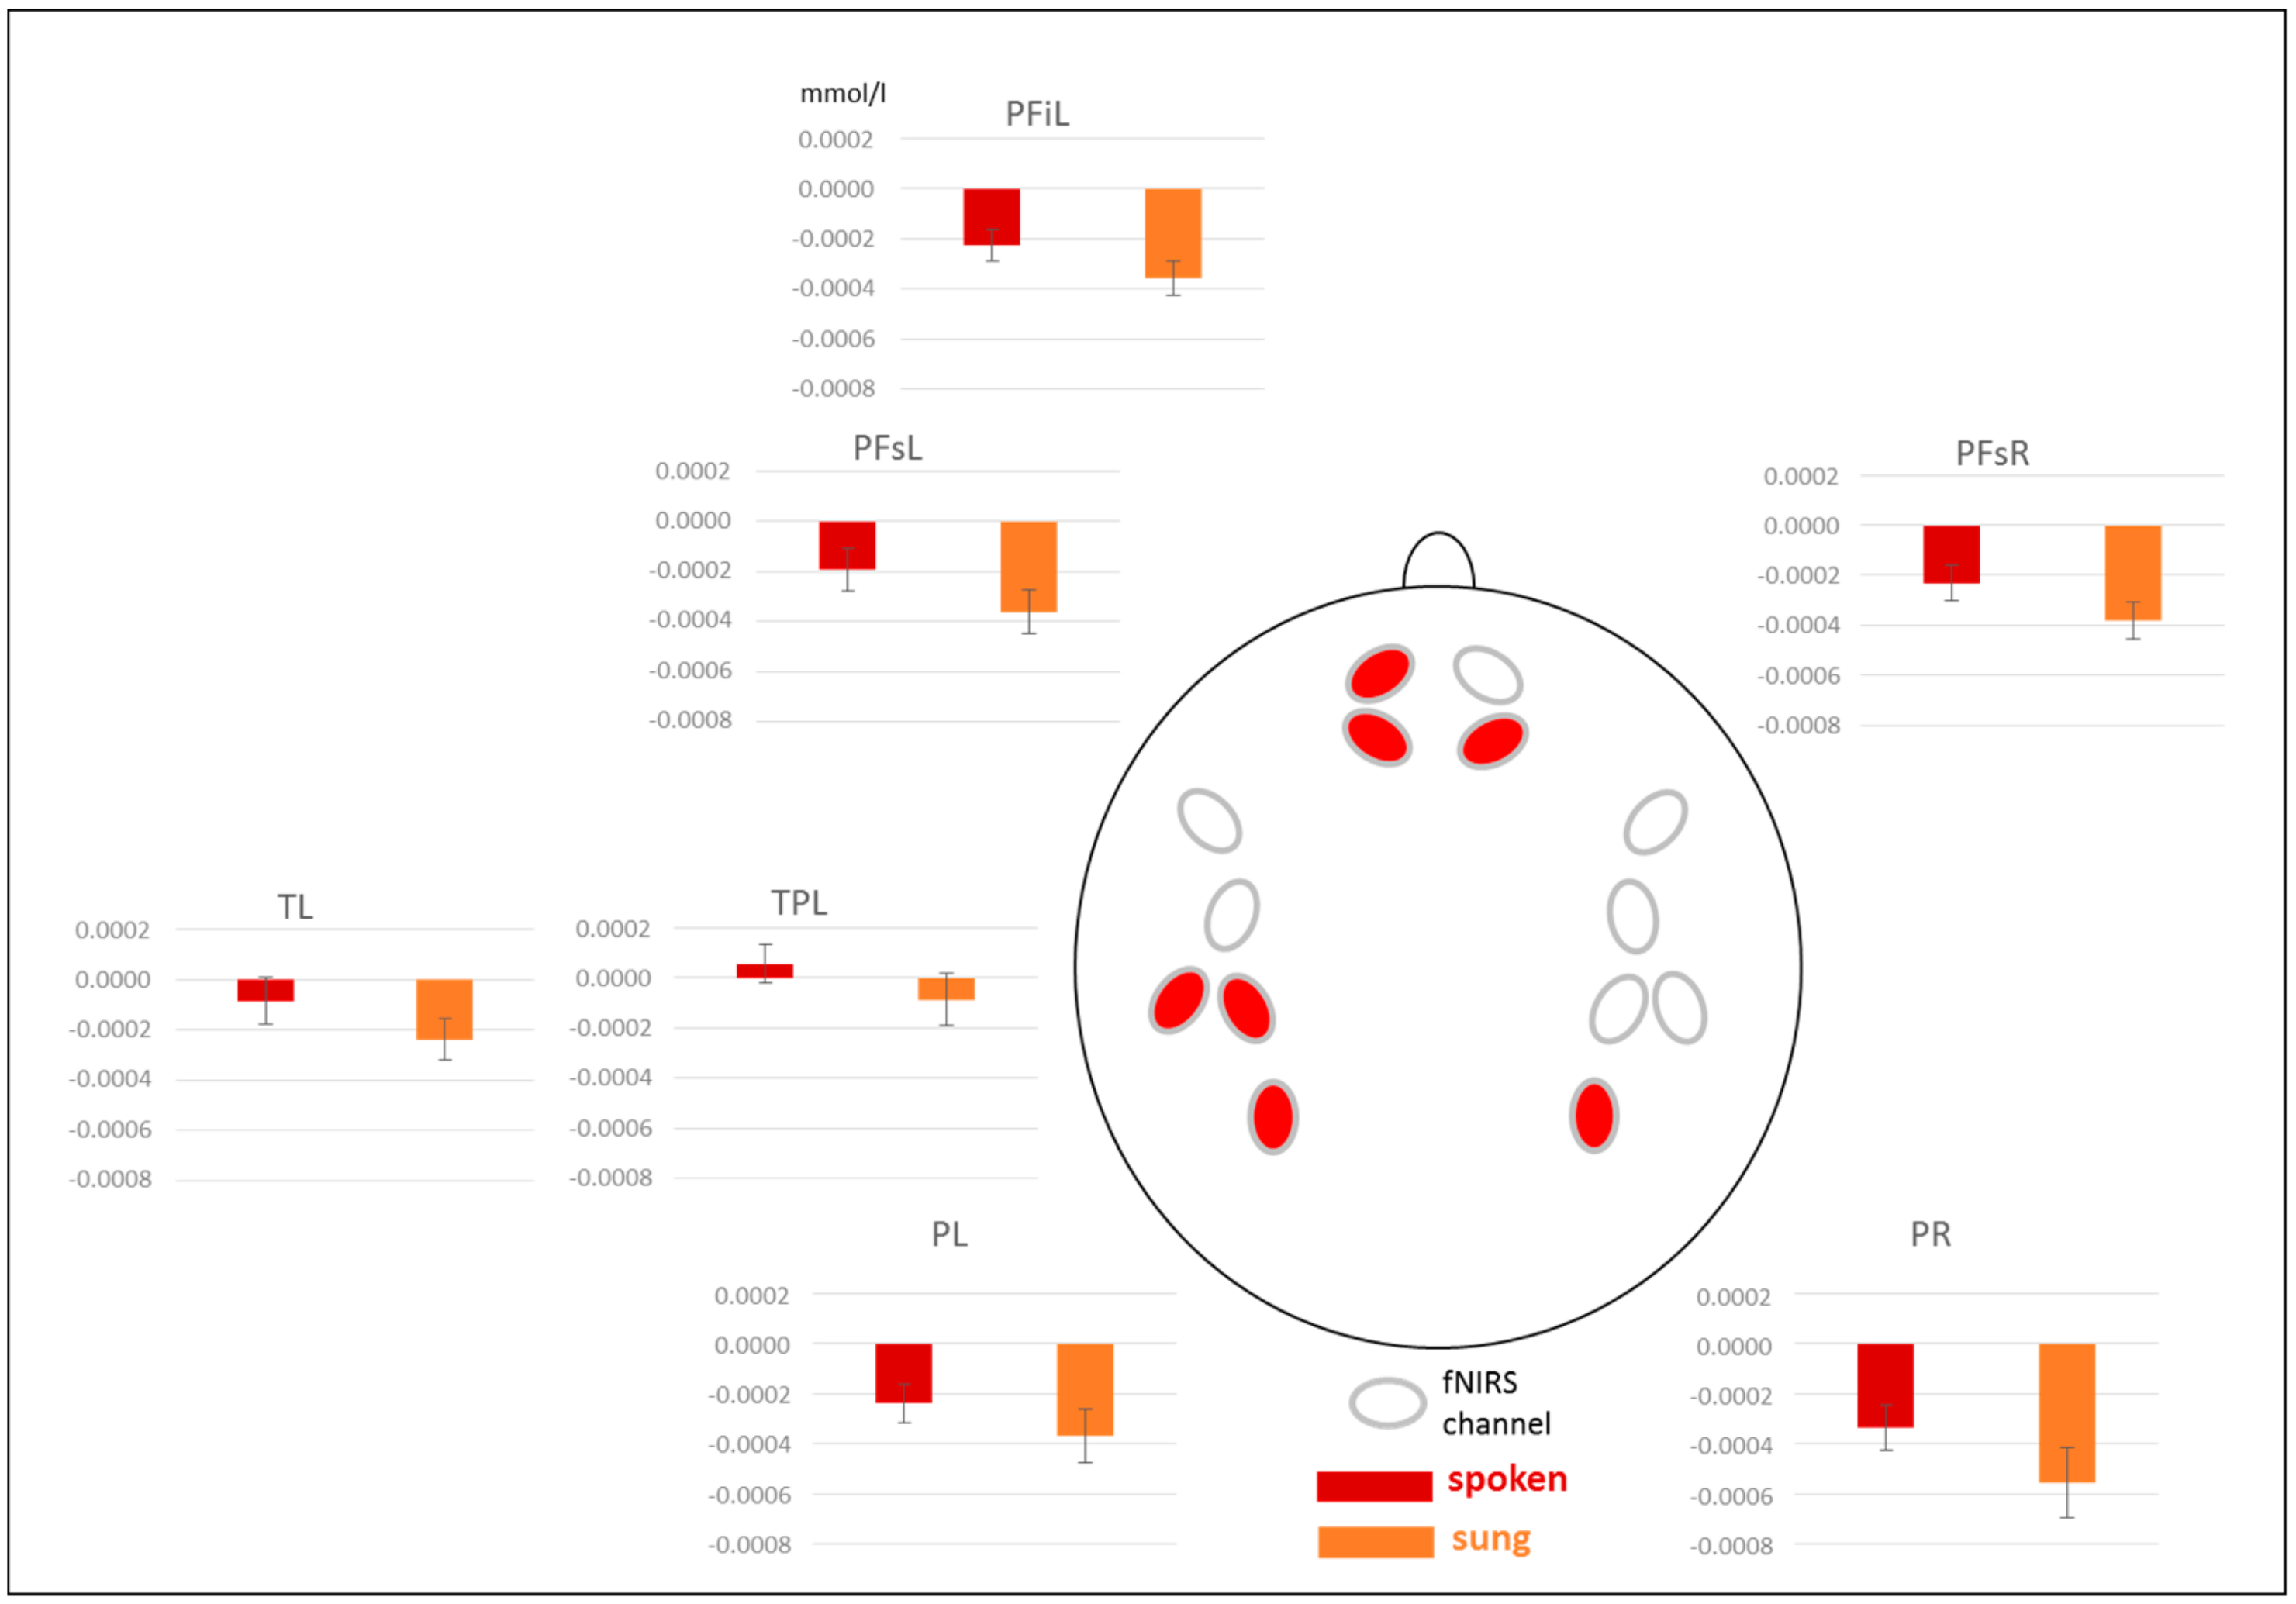
3.3. fNIRS Results
3.3.1. Results for [oxy-Hb]
3.3.2. Results for [deoxy-Hb]
4. Discussion
4.1. The N400 Differentiates between Correct and Incorrect Sentences
4.2. Brain Areas Recruited for Semantic Processing in Spoken and Sung Sentences
5. Conclusions
Supplementary Materials
Author Contributions
Funding
Acknowledgments
Conflicts of Interest
References
- Kraus, N.; Slater, J. Chapter 12-Music and language: Relations and disconnections. In Handbook of Clinical Neurology; The Human Auditory System; Aminoff, M.J., Boller, F., Swaab, D.F., Eds.; Elsevier: Amsterdam, The Netherlands, 2015; pp. 207–222. [Google Scholar]
- Seidner, W.; Wendler, J. Die Sängerstimme; Henschel Verlag: Berlin, Germany, 1978. [Google Scholar]
- Sundberg, J. Formant Structure and Articulation of Spoken and Sung Vowels. FPL (Folia Phoniatrica et Logopaedica) 1970, 22, 28–48. [Google Scholar] [CrossRef]
- Zatorre, R.J.; Baum, S.R. Musical Melody and Speech Intonation: Singing a Different Tune. PLoS Biol. 2012, 10, e1001372. [Google Scholar] [CrossRef] [Green Version]
- Mithen, S.; Morley, I.; Wray, A.; Tallerman, M.; Gamble, C. The Singing Neanderthals: The Origins of Music, Language, Mind and Body, by Steven Mithen; Weidenfeld & Nicholson: London, UK, 2005; pp. 97–112, ISBN 0-297-64317-7 hardback £20 & US$25.2; ix+374. Camb. Archaeol. J. 2006, 16, 97–112. [Google Scholar]
- De l’Etoile, S.K. Infant behavioral responses to infant-directed singing and other maternal interactions. Infant Behav. Dev. 2006, 29, 456–470. [Google Scholar] [CrossRef] [PubMed]
- Nakata, T.; Trehub, S.E. Infants’ responsiveness to maternal speech and singing. Infant Behav. Dev. 2004, 27, 455–464. [Google Scholar] [CrossRef]
- Crew, J.D.; Galvin, J.J.; Fu, Q.-J. Perception of Sung Speech in Bimodal Cochlear Implant Users. Trends Hear. 2016, 20. [Google Scholar] [CrossRef] [PubMed]
- Yu, M.; Xu, M.; Li, X.; Chen, Z.; Song, Y.; Liu, J. The shared neural basis of music and language. Neuroscience 2017, 357, 208–219. [Google Scholar] [CrossRef] [PubMed]
- Ludke, K.M.; Ferreira, F.; Overy, K. Singing can facilitate foreign language learning. Mem. Cogn. 2014, 42, 41–52. [Google Scholar] [CrossRef]
- Dittinger, E.; Barbaroux, M.; D’Imperio, M.; Jäncke, L.; Elmer, S.; Besson, M. Professional Music Training and Novel Word Learning: From Faster Semantic Encoding to Longer-lasting Word Representations. J. Cogn. Neurosci. 2016, 28, 1584–1602. [Google Scholar] [CrossRef] [Green Version]
- Kraus, N.; Chandrasekaran, B. Music training for the development of auditory skills. Nat. Rev. Neurosci. 2010, 11, 599–605. [Google Scholar] [CrossRef]
- Anderson, S.; White-Schwoch, T.; Parbery-Clark, A.; Kraus, N. A dynamic auditory-cognitive system supports speech-in-noise perception in older adults. Hear. Res. 2013, 300, 18–32. [Google Scholar] [CrossRef] [PubMed] [Green Version]
- Strait, D.L.; Kraus, N. Biological impact of auditory expertise across the life span: Musicians as a model of auditory learning. Hear. Res. 2014, 308, 109–121. [Google Scholar] [CrossRef] [PubMed] [Green Version]
- Schlaug, G.; Marchina, S.; Norton, A. From Singing to Speaking: Why Singing May Lead to Recovery of Expressive Language Function in Patients with Broca’s Aphasia. Music Percept. Interdiscip. J. 2008, 25, 315–323. [Google Scholar] [CrossRef] [PubMed] [Green Version]
- Merrett, D.L.; Peretz, I.; Wilson, S.J. Neurobiological, Cognitive, and Emotional Mechanisms in Melodic Intonation Therapy. Front. Hum. Neurosci. 2014, 8, 401. [Google Scholar] [CrossRef] [PubMed] [Green Version]
- Sihvonen, A.J.; Särkämö, T.; Leo, V.; Tervaniemi, M.; Altenmüller, E.; Soinila, S. Music-based interventions in neurological rehabilitation. Lancet Neurol. 2017, 16, 648–660. [Google Scholar] [CrossRef] [Green Version]
- Orellana, C.P.; van de Sandt-Koenderman, M.E.; Saliasi, E.; van der Meulen, I.; Klip, S.; van der Lugt, A.; Smits, M. Insight into the neurophysiological processes of melodically intoned language with functional MRI. Brain Behav. 2014, 4, 615–625. [Google Scholar] [CrossRef]
- Akanuma, K.; Meguro, K.; Satoh, M.; Tashiro, M.; Itoh, M. Singing can improve speech function in aphasics associated with intact right basal ganglia and preserve right temporal glucose metabolism: Implications for singing therapy indication. Int. J. Neurosci. 2016, 126, 39–45. [Google Scholar] [CrossRef]
- Good, A.; Gordon, K.A.; Papsin, B.C.; Nespoli, G.; Hopyan, T.; Peretz, I.; Russo, F.A. Benefits of Music Training for Perception of Emotional Speech Prosody in Deaf Children With Cochlear Implants. Ear Hear. 2017, 38, 455–464. [Google Scholar] [CrossRef] [Green Version]
- Torppa, R.; Faulkner, A.; Laasonen, M.; Lipsanen, J.; Sammler, D. Links of Prosodic Stress Perception and Musical Activities to Language Skills of Children With Cochlear Implants and Normal Hearing. Ear Hear. 2019. [Google Scholar] [CrossRef] [Green Version]
- Torppa, R.; Huotilainen, M. Why and how music can be used to rehabilitate and develop speech and language skills in hearing-impaired children. Hear. Res. 2019, 380, 108–122. [Google Scholar] [CrossRef]
- Rossi, S.; Telkemeyer, S.; Wartenburger, I.; Obrig, H. Shedding light on words and sentences: Near-infrared spectroscopy in language research. Brain Lang. 2012, 121, 152–163. [Google Scholar] [CrossRef] [PubMed]
- Holcomb, P.J. Semantic priming and stimulus degradation: Implications for the role of the N400 in language processing. Psychophysiology 1993, 30, 47–61. [Google Scholar] [CrossRef] [PubMed]
- Rugg, M.D. The Effects of Semantic Priming and Word Repetition on Event-Related Potentials. Psychophysiology 1985, 22, 642–647. [Google Scholar] [CrossRef] [PubMed]
- Matsumoto, A.; Iidaka, T.; Haneda, K.; Okada, T.; Sadato, N. Linking semantic priming effect in functional MRI and event-related potentials. NeuroImage 2005, 24, 624–634. [Google Scholar] [CrossRef] [PubMed]
- Lau, E.F.; Phillips, C.; Poeppel, D. A cortical network for semantics: (de)constructing the N400. Nat. Rev. Neurosci. 2008, 9, 920–933. [Google Scholar] [CrossRef]
- Kutas, M.; Federmeier, K.D. Thirty Years and Counting: Finding Meaning in the N400 Component of the Event-Related Brain Potential (ERP). Annu. Rev. Psychol. 2011, 62, 621–647. [Google Scholar] [CrossRef] [Green Version]
- Koelsch, S. Towards a neural basis of processing musical semantics. Phys. Life Rev. 2011, 8, 89–105. [Google Scholar] [CrossRef]
- Koelsch, S. Toward a Neural Basis of Music Perception-A Review and Updated Model. Front. Psychol. 2011, 2, 110. [Google Scholar] [CrossRef] [Green Version]
- Koelsch, S.; Kasper, E.; Sammler, D.; Schulze, K.; Gunter, T.; Friederici, A.D. Music, language and meaning: Brain signatures of semantic processing. Nat. Neurosci. 2004, 7, 302–307. [Google Scholar] [CrossRef]
- Steinbeis, N.; Koelsch, S. Comparing the Processing of Music and Language Meaning Using EEG and fMRI Provides Evidence for Similar and Distinct Neural Representations. PLoS ONE 2008, 3, e2226. [Google Scholar] [CrossRef]
- Painter, J.G.; Koelsch, S. Can out-of-context musical sounds convey meaning? An ERP study on the processing of meaning in music: Processing of meaning in music. Psychophysiology 2011, 48, 645–655. [Google Scholar] [CrossRef] [PubMed]
- Chien, P.-J.; Chan, S. Old songs can be as fresh as new: An ERP study on lyrics processing. J. Neurolinguist. 2015, 35, 55–67. [Google Scholar] [CrossRef] [Green Version]
- Gordon, R.L.; Schön, D.; Magne, C.; Astésano, C.; Besson, M. Words and Melody Are Intertwined in Perception of Sung Words: EEG and Behavioral Evidence. PLoS ONE 2010, 5, e9889. [Google Scholar] [CrossRef] [PubMed]
- Kutas, M.; Hillyard, S.A. Reading senseless sentences: Brain potentials reflect semantic incongruity. Science 1980, 207, 203–205. [Google Scholar] [CrossRef] [PubMed]
- Friederici, A.D. Towards a neural basis of auditory sentence processing. Trends Cogn. Sci. (Regul. Ed.) 2002, 6, 78–84. [Google Scholar] [CrossRef] [Green Version]
- Hahne, A.; Friederici, A.D. Differential task effects on semantic and syntactic processes as revealed by ERPs. Cogn. Brain Res. 2002, 13, 339–356. [Google Scholar] [CrossRef] [Green Version]
- Friederici, A.D.; Pfeifer, E.; Hahne, A. Event-related brain potentials during natural speech processing: Effects of semantic, morphological and syntactic violations. Cogn. Brain Res. 1993, 1, 183–192. [Google Scholar] [CrossRef] [Green Version]
- Besson, M.; Faïta, F.; Peretz, I.; Bonnel, A.-M.; Requin, J. Singing in the Brain: Independence of Lyrics and Tunes. Psychol. Sci. 1998, 9, 494–498. [Google Scholar] [CrossRef]
- Rosslau, K.; Herholz, S.C.; Knief, A.; Ortmann, M.; Deuster, D.; Schmidt, C.-M.; Zehnhoff-Dinnesen, A.; Pantev, C.; Dobel, C. Song Perception by Professional Singers and Actors: An MEG Study. PLoS ONE 2016, 11, e0147986. [Google Scholar] [CrossRef]
- Besson, M.; Schön, D. Comparison between Language and Music. Ann. N. Y. Acad. Sci. 2001, 930, 232–258. [Google Scholar] [CrossRef]
- Zatorre, R.J.; Belin, P.; Penhune, V.B. Structure and function of auditory cortex: Music and speech. Trends Cogn. Sci. 2002, 6, 37–46. [Google Scholar] [CrossRef]
- Zatorre, R.J.; Belin, P. Spectral and Temporal Processing in Human Auditory Cortex. Cereb. Cortex 2001, 11, 946–953. [Google Scholar] [CrossRef]
- Poeppel, D.; Idsardi, W.J.; van Wassenhove, V. Speech perception at the interface of neurobiology and linguistics. Philos. Trans. R. Soc. B Biol. Sci. 2008, 363, 1071–1086. [Google Scholar] [CrossRef] [PubMed] [Green Version]
- Telkemeyer, S.; Rossi, S.; Koch, S.P.; Nierhaus, T.; Steinbrink, J.; Poeppel, D.; Obrig, H.; Wartenburger, I. Sensitivity of Newborn Auditory Cortex to the Temporal Structure of Sounds. J. Neurosci. 2009, 29, 14726–14733. [Google Scholar] [CrossRef] [PubMed]
- Friederici, A.D.; Alter, K. Lateralization of auditory language functions: A dynamic dual pathway model. Brain Lang. 2004, 89, 267–276. [Google Scholar] [CrossRef]
- Hickok, G.; Poeppel, D. The cortical organization of speech processing. Nat. Rev. Neurosci. 2007, 8, 393–402. [Google Scholar] [CrossRef]
- Mummery, C.J.; Shallice, T.; Price, C.J. Dual-Process Model in Semantic Priming: A Functional Imaging Perspective. NeuroImage 1999, 9, 516–525. [Google Scholar] [CrossRef] [PubMed] [Green Version]
- Fang, Y.; Han, Z.; Zhong, S.; Gong, G.; Song, L.; Liu, F.; Huang, R.; Du, X.; Sun, R.; Wang, Q.; et al. The Semantic Anatomical Network: Evidence from Healthy and Brain-Damaged Patient Populations. Available online: https://onlinelibrary.wiley.com/doi/abs/10.1002/hbm.22858 (accessed on 6 August 2019).
- Rissman, J.; Eliassen, J.C.; Blumstein, S.E. An event-related FMRI investigation of implicit semantic priming. J. Cogn. Neurosci. 2003, 15, 1160–1175. [Google Scholar] [CrossRef] [PubMed] [Green Version]
- Sammler, D.; Baird, A.; Valabrègue, R.; Clément, S.; Dupont, S.; Belin, P.; Samson, S. The Relationship of Lyrics and Tunes in the Processing of Unfamiliar Songs: A Functional Magnetic Resonance Adaptation Study. J. Neurosci. 2010, 30, 3572–3578. [Google Scholar] [CrossRef] [Green Version]
- Schön, D.; Gordon, R.; Campagne, A.; Magne, C.; Astésano, C.; Anton, J.-L.; Besson, M. Similar cerebral networks in language, music and song perception. NeuroImage 2010, 51, 450–461. [Google Scholar] [CrossRef]
- Merrill, J.; Sammler, D.; Bangert, M.; Goldhahn, D.; Lohmann, G.; Turner, R.; Friederici, A.D. Perception of Words and Pitch Patterns in Song and Speech. Front. Psychol. 2012, 3, 76. [Google Scholar] [CrossRef] [PubMed] [Green Version]
- Kreitewolf, J.; Friederici, A.D.; von Kriegstein, K. Hemispheric lateralization of linguistic prosody recognition in comparison to speech and speaker recognition. NeuroImage 2014, 102, 332–344. [Google Scholar] [CrossRef]
- Callan, D.E.; Tsytsarev, V.; Hanakawa, T.; Callan, A.M.; Katsuhara, M.; Fukuyama, H.; Turner, R. Song and speech: Brain regions involved with perception and covert production. NeuroImage 2006, 31, 1327–1342. [Google Scholar] [CrossRef] [PubMed]
- Whitehead, J.C.; Armony, J.L. Singing in the brain: Neural representation of music and voice as revealed by fMRI. Hum. Brain Mapp. 2018, 39, 4913–4924. [Google Scholar] [CrossRef] [PubMed] [Green Version]
- Özdemir, E.; Norton, A.; Schlaug, G. Shared and distinct neural correlates of singing and speaking. NeuroImage 2006, 33, 628–635. [Google Scholar] [CrossRef]
- Humphries, C.; Binder, J.R.; Medler, D.A.; Liebenthal, E. Syntactic and Semantic Modulation of Neural Activity during Auditory Sentence Comprehension. J. Cogn. Neurosci. 2006, 18, 665–679. [Google Scholar] [CrossRef] [Green Version]
- Kuperberg, G.R.; McGuire, P.K.; Bullmore, E.T.; Brammer, M.J.; Rabe-Hesketh, S.; Wright, I.C.; Lythgoe, D.J.; Williams, S.C.R.; David, A.S. Common and Distinct Neural Substrates for Pragmatic, Semantic, and Syntactic Processing of Spoken Sentences: An fMRI Study. J. Cogn. Neurosci. 2000, 12, 321–341. [Google Scholar] [CrossRef]
- Rüschemeyer, S.-A.; Fiebach, C.J.; Kempe, V.; Friederici, A.D. Processing Lexical Semantic and Syntactic Information in First and Second Language: fMRI Evidence from German and Russian. Available online: https://onlinelibrary.wiley.com/doi/abs/10.1002/hbm.20098 (accessed on 6 August 2019).
- Friederici, A.D.; Rüschemeyer, S.-A.; Hahne, A.; Fiebach, C.J. The Role of Left Inferior Frontal and Superior Temporal Cortex in Sentence Comprehension: Localizing Syntactic and Semantic Processes. Cereb. Cortex 2003, 13, 170–177. [Google Scholar] [CrossRef] [Green Version]
- Rogalsky, C.; Hickok, G. Selective Attention to Semantic and Syntactic Features Modulates Sentence Processing Networks in Anterior Temporal Cortex. Cereb. Cortex 2009, 19, 786–796. [Google Scholar] [CrossRef]
- Oldfield, R.C. The assessment and analysis of handedness: The Edinburgh inventory. Neuropsychologia 1971, 9, 97–113. [Google Scholar] [CrossRef]
- Huettel, S.A.; Song, A.W.; McCarthy, G. Functional Magnetic Resonance Imaging, 2nd ed.; Sinauer Associates, Inc.: Sunderland, MA, USA, 2008. [Google Scholar]
- Benjamini, Y.; Hochberg, Y. Controlling the False Discovery Rate: A Practical and Powerful Approach to Multiple Testing. J. R. Stat. Soc. Ser. B (Methodological) 1995, 57, 289–300. [Google Scholar] [CrossRef]
- Gratton, G.; Coles, M.G.; Donchin, E. A new method for off-line removal of ocular artifact. Electroencephalogr. Clin. Neurophysiol. 1983, 55, 468–484. [Google Scholar] [CrossRef]
- Greenhouse, S.W.; Geisser, S. On methods in the analysis of profile data. Psychometrika 1959, 24, 95–112. [Google Scholar] [CrossRef]
- Scholkmann, F.; Spichtig, S.; Muehlemann, T.; Wolf, M. How to detect and reduce movement artifacts in near-infrared imaging using moving standard deviation and spline interpolation. Physiol. Meas. 2010, 31, 649–662. [Google Scholar] [CrossRef] [Green Version]
- Cope, M.; Delpy, D.T.; Wray, S.; Wyatt, J.S.; Reynolds, E.O.R. A CCD Spectrophotometer to Quantitate the Concentration of Chromophores in Living Tissue Utilising the Absorption Peak of Water at 975 nm. In Oxygen Transport to Tissue XI; Advances in Experimental Medicine and Biology; Springer: Boston, MA, USA, 1989; pp. 33–40. ISBN 978-1-4684-5645-5. [Google Scholar]
- Boynton, G.M.; Engel, S.A.; Heeger, D.J. Linear systems analysis of the fMRI signal. NeuroImage 2012, 62, 975–984. [Google Scholar] [CrossRef] [Green Version]
- Cheimariou, S.; Farmer, T.A.; Gordon, J.K. Lexical prediction in the aging brain: The effects of predictiveness and congruency on the N400 ERP component. Aging Neuropsychol. Cogn. 2019, 26, 781–806. [Google Scholar] [CrossRef]
- Kutas, M.; Iragui, V. The N400 in a semantic categorization task across 6 decades. Electroencephalogr. Clin. Neurophysiol. Evoked Potentials Sect. 1998, 108, 456–471. [Google Scholar] [CrossRef]
- Hunter, C.R. Is the time course of lexical activation and competition in spoken word recognition affected by adult aging? An event-related potential (ERP) study. Neuropsychologia 2016, 91, 451–464. [Google Scholar] [CrossRef]
- Mohan, R.; Weber, C. Neural activity reveals effects of aging on inhibitory processes during word retrieval. Aging Neuropsychol. Cogn. 2019, 26, 660–687. [Google Scholar] [CrossRef] [Green Version]
- Federmeier, K.D.; Van Petten, C.; Schwartz, T.J.; Kutas, M. Sounds, Words, Sentences: Age-Related Changes Across Levels of Language Processing. Psychol. Aging 2003, 18, 858–872. [Google Scholar] [CrossRef] [Green Version]
- Friederici, A.D.; von Cramon, D.Y.; Kotz, S.A. Language related brain potentials in patients with cortical and subcortical left hemisphere lesions. Brain 1999, 122, 1033–1047. [Google Scholar] [CrossRef] [PubMed] [Green Version]
- Hagoort, P.; Brown, C.M.; Swaab, T.Y. Lexical-semantic event–related potential effects in patients with left hemisphere lesions and aphasia, and patients with right hemisphere lesions without aphasia. Brain 1996, 119, 627–649. [Google Scholar] [CrossRef] [PubMed]
- Swaab, T.; Brown, C.; Hagoort, P. Spoken Sentence Comprehension in Aphasia: Event-related Potential Evidence for a Lexical Integration Deficit. J. Cogn. Neurosci. 1997, 9, 39–66. [Google Scholar] [CrossRef] [PubMed] [Green Version]


| Effect Lateral Electrodes | df | F | p |
|---|---|---|---|
| condition | 1,17 | 8.498 | 0.010 |
| modality | 1,17 | 8.572 | 0.009 |
| condition × modality | 1,17 | 0.221 | 0.644 |
| condition × region | 2,34 | 6.316 | 0.010 |
| modality × region | 2,34 | 6.929 | 0.010 |
| condition × modality × region | 2,34 | 0.159 | 0.761 |
| condition × hemisphere | 1,17 | 0.258 | 0.618 |
| modality × hemisphere | 1,17 | 0.008 | 0.932 |
| condition × modality × hemisphere | 1,17 | 0.041 | 0.842 |
| condition × region × hemisphere | 2,34 | 0.956 | 0.372 |
| modality × region × hemisphere | 2,34 | 0.288 | 0.751 |
| condition × modality × region × hemisphere | 2,34 | 1.553 | 0.226 |
| Effect Midline Electrodes | df | F | p |
|---|---|---|---|
| condition | 1,16 | 14.749 | 0.001 |
| modality | 1,16 | 8.033 | 0.012 |
| condition × modality | 1,16 | 0.191 | 0.668 |
| condition × electrodes | 2,32 | 5.428 | 0.009 |
| modality × electrodes | 2,32 | 3.142 | 0.057 |
| condition × modality × electrodes | 2,32 | 0.159 | 0.745 |
| Effect [oxy-Hb] | df | F | p |
|---|---|---|---|
| condition | 1,17 | 2.100 | 0.166 |
| modality | 1,17 | 4.897 | 0.041 |
| condition × modality | 1,17 | 0.041 | 0.841 |
| condition × region | 6,102 | 0.392 | 0.592 |
| modality × region | 6,102 | 3.211 | 0.046 |
| condition × modality × region | 6,102 | 0.614 | 0.624 |
| condition × hemisphere | 1,17 | 1.249 | 0.279 |
| modality × hemisphere | 1,17 | 1.012 | 0.329 |
| condition × modality × hemisphere | 1,17 | 0.018 | 0.896 |
| condition × region × hemisphere | 6,102 | 1.025 | 0.391 |
| modality × region × hemisphere | 6,102 | 4.165 | 0.008 |
| condition × modality × region × hemisphere | 6,102 | 1.615 | 0.198 |
| Effect [deoxy-Hb] | df | F | p |
|---|---|---|---|
| condition | 1,17 | 12.530 | 0.003 |
| modality | 1,17 | 1.153 | 0.298 |
| condition × modality | 1,17 | 0.020 | 0.889 |
| condition × region | 6,102 | 1.183 | 0.316 |
| modality × region | 6,102 | 0.936 | 0.416 |
| condition × modality × region | 6,102 | 1.555 | 0.210 |
| condition × hemisphere | 1,17 | 0.330 | 0.572 |
| modality × hemisphere | 1,17 | 0.675 | 0.423 |
| condition × modality × hemisphere | 1,17 | 1.573 | 0.227 |
| condition × region × hemisphere | 6,102 | 0.849 | 0.405 |
| modality × region × hemisphere | 6,102 | 0.669 | 0.520 |
| condition × modality × region × hemisphere | 6,102 | 0.532 | 0.648 |
© 2020 by the authors. Licensee MDPI, Basel, Switzerland. This article is an open access article distributed under the terms and conditions of the Creative Commons Attribution (CC BY) license (http://creativecommons.org/licenses/by/4.0/).
Share and Cite
Rossi, S.; Gugler, M.F.; Rungger, M.; Galvan, O.; Zorowka, P.G.; Seebacher, J. How the Brain Understands Spoken and Sung Sentences. Brain Sci. 2020, 10, 36. https://doi.org/10.3390/brainsci10010036
Rossi S, Gugler MF, Rungger M, Galvan O, Zorowka PG, Seebacher J. How the Brain Understands Spoken and Sung Sentences. Brain Sciences. 2020; 10(1):36. https://doi.org/10.3390/brainsci10010036
Chicago/Turabian StyleRossi, Sonja, Manfred F. Gugler, Markus Rungger, Oliver Galvan, Patrick G. Zorowka, and Josef Seebacher. 2020. "How the Brain Understands Spoken and Sung Sentences" Brain Sciences 10, no. 1: 36. https://doi.org/10.3390/brainsci10010036