Article

Potential on Energy Performance Upgrade of National Stadiums: A Case Study for the Pancretan Stadium, Crete, Greece

by
Dimitris Al. Katsaprakakis
1,*,
Irini Dakanali
1,
George Zidianakis
1,
Yiannis Yiannakoudakis
1,
Nikolaos Psarras
2 and
Spyros Kanouras
3
1
Technological Educational Institute of Crete, Department of Mechanical Engineering, Wind Energy and Power Plants Synthesis Laboratory, Estavromenos, 714 10 Heraklion Crete, Greece
2
Aid Engineering, Atrina Building, 32 Kifissias Av., 151 25 Athens, Greece
3
Diopsis Consulting Ltd., G. Papandreou 94, 546 55 Thessaloniki, Greece
*
Author to whom correspondence should be addressed.
Appl. Sci. 2019, 9(8), 1544; https://doi.org/10.3390/app9081544
Submission received: 6 March 2019 / Revised: 28 March 2019 / Accepted: 10 April 2019 / Published: 13 April 2019

Abstract

:

Featured Application

The article highlights the huge possibilities for energy saving in large size sports facilities and anticipates to constitute a benchmark reference on energy performance upgrade of similar infrastructure.

Abstract

Energy performance upgrade of stadiums constitutes a complex and demanding task because of both the size and the variety of the involved energy loads. The present article aims to summarize the basic results of the implemented study on the energy performance upgrade of the Pancretan Stadium, Crete, Greece. This target was approached with a cluster of passive and active measures: replacement of old openings, a photovoltaic station, an open loop geothermal system, installation of energy-efficient lighting devices, a solar-biomass combi system and a Building Energy Management System (BEMS) for the control of the main energy consumptions. The dimensioning of all the proposed active systems is optimized through the computational simulation of their annual operation. With the applied technologies, the achieved annual energy saving percentage exceeds 83%. The Renewable Energy Sources annual penetration percentage is calculated at 82% versus the annual energy consumption. The Stadium’s energy performance is upgraded from rank D to rank A+, according to the European Union’s directives. The set-up cost of the under consideration energy performance upgrade systems is approximately calculated at 2,700,000 €, with a payback period of 12 years, calculated versus the achieved monetary savings due to the reduction of the consumed energy resources.

1. Introduction

1.1. Existing Work on Energy Performance Upgrade of Stadiums

Large stadiums exhibit high energy needs for a variety of consumptions. This is because, apart from the main outdoor ground, the indoor space below the stadiums’ stands is most commonly exploited to host a series of sports facilities, offices, etc., imposing energy consumptions for:
  • indoor space heating, cooling and air conditioning,
  • hot water for the changing rooms,
  • lighting for both the outdoor and the indoor space,
  • swimming pools heating,
  • power consumed in large size pumps and circulators for the water supply and the hot water distribution networks, and in fans, for the air conditioning network.
Although the potentially available energy saving measures do not change with regard to buildings energy performance upgrade applications, the size of the consumptions and the variety of the involved energy loads in large size sports facilities convert their energy performance upgrade into a demanding and challenging task. So far, the relevant research is considerably limited. There is not any article in all of the scientific literature investigating the energy performance upgrade of stadiums. There is only one article dealing with energy performance upgrade of sports facilities, with a case study for a sports centre in Dubai, focusing on the introduction of hydrogen technologies [1]. Additionally, there are two more articles investigating and evaluating alternative passive and active technologies for athletic swimming pools heating [2,3]. However, apart from these articles, there is no other relevant work in the scientific literature approaching the topic of the present article.
The optimum mixture of the most feasible available technologies on energy performance upgrade of stadiums depends on several parameters, such as the geographical location, affecting the available Renewable Energy Sources (R.E.S.) potential and the prevailing climate conditions, as well as the size of the stadium and the existing final energy needs.
Traditionally, indoor space conditioning constitutes the most important energy consuming process. Geothermal Heat Exchangers (GHE) seem to be the most attractive technology for indoor space conditioning, offering the possibility for both heating and cooling production [4]. Annual electricity consumption saving percentages of 30–40%, with regard to electricity consumption from air-to-air heat pumps, can be achieved with geothermal systems, according to statistical data and simulation results [5,6]. GHE have been widely studied in the relevant scientific literature. Several simulation methods have been developed and proposed for closed loop heat exchangers of horizontal [7,8] and vertical [9,10] layout. Heat transfer analysis have also been executed for open loop geothermal systems [11]. A review of the involved design aspects of GHE can be found in [12].
Alternatively, in cold climates with significant heating loads, the use of Combined Heat and Power (CHP) cogeneration compact units features as a highly attractive option [13]. These plants can exhibit increased economic feasibility in the case of compact steam turbines, operating with locally available biomass fuel [14]. The overall efficiency of such systems, referring to both electricity and heating production, can be in the range of 95% [13]. In common implementations, CHP systems are proposed for commercial and residential buildings for combined heat and electricity production [15,16]. In advanced applications, the combined operation of CHP systems with thermal energy storage have been studied [17] aiming at the minimization of the daily operation cost. Finally, by employing particular technologies, such as chilled ice or absorption chillers, the concept of tri-generation has been introduced, combining the production of heating, cooling and electricity [18,19,20].
Thermal energy needs constitute a major energy consumption in stadiums. Most commonly, thermal energy is required in sports facilities for the coverage of hot water needs (e.g., in changing rooms) and heating of any possibly involved swimming pools. The most feasible technology for the coverage of thermal energy needs is the combined operation of solar collectors (selective coating or vacuum tubes for colder climates) with conventional heaters [21,22,23]. To maximize the economic feasibility and the energy saving results, biomass heaters can be alternatively introduced [24]. In the most conservative implementations, thermal energy from either the solar collectors’ field or the heater is stored in a common thermal storage tank, to be provided for the heating distribution network [24,25]. In more advanced approaches, thermal energy from the solar collectors can be directly provided for the heating distribution network [26]. Additionally, solar combi-systems can be also utilized for combined cooling production, by being co-operated with absorption chillers [27]. Finally, a novel approach is the combined production of thermal energy and electricity with photovoltaic hybrid solar thermal panels, maximizing the overall efficiency of the involved technology and the economic feasibility of the project [28,29].
The significant lighting needs for both indoor and outdoor space can be covered with the installation of low energy consumption electrical bulbs, i.e., of LED technology, leading to overall annual energy saving percentages higher than 30% [30,31,32]. Further energy saving can be achieved with the central management of the lighting system, i.e., with a Building Energy Management System (BEMS). In general, these systems can offer an additional energy saving percentage of 15–20% [33]. Lighting management is most commonly performed with signals received by occupancy detection or luminosity sensors [34], according to which, through advanced operation algorithms [35], the lighting lamps luminosity is regulated and their switching on and off functions are performed.
Other energy consumptions related with indoor space conditioning and hot water production (pumps, circulators and fans) should be also controlled by BEMS. The use of cyclo-converters in such inductive loads enables their operation with varied rotational speed, and, hence, reduced power consumption, in case of partial load operation. Traditionally, BEMS are locally introduced in buildings for energy consumption management [36,37]. In modern applications, BEMS are integrated within the frame of smart grids, to provide advanced demand side management options, providing access to demand management for both sides, namely the customer and the grid’s operator [38]. Distributed energy production and storage can be also inspected and regulated by BEMS, realizing the relevant regulation framework (e.g., within electricity wholesale markets) [39,40].
Finally, the introduction of passive measures for indoor space envelope, such as the insulation of opaque surfaces or the installation of energy-efficient openings, can lead to considerable reduction of the existing annual heating and cooling loads (up to 40%) [41]. Bioclimatic elements, starting from the building’s orientation with the appropriate positioning and shading of the openings and expanding to more advanced systems, can have a considerable contribution to the natural achievement of thermal comfort conditions [42]. The optimum mixture of passive measures differs versus the prevailing climate conditions, as indicated in studies performed for cold [43], mild [44] and hot and dry climates [45,46]. Advanced research focuses on the effects of phase change materials integrated in the buildings’ envelope, favoring the solar radiation absorption in the form of latent instead of sensible heat [47,48] or the effects of high reflectivity buildings [49]. A special case is the introduction of passive lighting systems, e.g., the installation of tubular daylight systems, favoring the maximisation of the natural lighting for indoor space through the whole daytime period [50].

1.2. Scope of the Article

The lack of any similar articles in the relevant scientific literature manifests the novelty and the necessity of the presented work. The scope of this article is to indicate the optimum mixture of passive and active measures, from both technical and economic points of view, towards the energy performance upgrade of stadiums, given the available climate conditions and R.E.S. potential. The optimization of the finally proposed mixture will be justified with the calculation of specific evaluation technical and economic indices, in other words, Key Performance Indices (KPIs).
Additionally, the article also anticipates to highlight the huge possibilities for energy savings in large size, national stadiums and to constitute a benchmark reference on energy performance upgrade of stadiums, given the lack of former similar works.
The above tasks are approached with the application of the introduced methodology for the energy performance upgrade of the Pancretan Stadium, Heraklion, Crete, Greece. The implemented work had to face an ultimate challenge: the energy performance upgrade of a highly energy-consuming infrastructure, such as a national stadium, from rank D to rank A+, optimizing, at the same time, specific KPIs. The significance of the proposed project, as a whole, is maximized due to its pilot and demonstrative attribute, given the use of the Stadium’s facilities on a daily basis from a large number of young users, either as spectators or athletes, a fact that can remarkably contribute to the cultivation of “energy culture” in Crete’s new generations.

1.3. Structure of the Article

The structure of the article follows the logical realization route of the several distinct steps involved in the executed study. Specifically:
Section 2 presents the current conditions met in the under examination infrastructure, namely its location, the prevailing climate and the existing energy resources annual consumption. The section is integrated with a synopsis of the most feasible energy performance upgrade passive and active measures to be introduced in the examined Stadium.
The energy performance upgrade study starts with the evaluation of the existing condition of the Stadium’s indoor space envelope and the definition of the proposed passive measures. The section is integrated with the calculation of the indoor space heating and cooling loads in the envelope’s existing condition and with the realization of the proposed passive measures.
Once the indoor space heating and cooling loads potential reduction, anticipated through the proposed passive measures, has been estimated in the previous section, Section 4 investigates the most technically feasible active energy saving systems, given the existing forms of final energy consumption in the Stadium and the available R.E.S. potential. The section starts with the investigation of active systems for indoor space conditioning, moves to the thermal energy production for the hot water needs coverage and the swimming pools heating and finally examines the possible energy savings on indoor and outdoor space lighting systems. Finally, the possibility for electricity production from R.E.S. technologies is investigated. Finally, a Building Energy Management System (BEMS) is proposed for the automatic and integrated operation of the under consideration active systems.
Section 5 summarizes the energy saving and production results from the passive and active systems investigated in Section 3 and Section 4, taking also into account the reactive electricity consumption saving. The primary energy annual total saving and the new energy resources annual consumption are calculated and, eventually, the new energy performance rank is determined.
The realization order of the involved steps in the present study are graphically depicted in the flow chart shown in Figure 1.
Section 6 gives a short economic evaluation of the examined project with the estimation of the total set-up cost and the annual monetary saving due to the introduced energy saving and production systems.
Finally, Section 7 presents some very characteristic KPIs, such as the annual achieved R.E.S. penetration percentage, the investment’s payback period, the annual achieved primary energy saving percentage and the CO2 emission annual reduction.

2. The Pancretan Stadium Crete

2.1. Location, Essential Features

The construction of the Pancretan Stadium’s was integrated in 2004. The Stadium was firstly used to host specific sports for the 2004 Olympic Games. It is located at the western suburb of Heraklion, Crete, Greece, next to the north coastline of the island (Figure 2). Since its construction, the main Stadium’s ground regularly hosts football matches for the first or the second Greek football national categories and the Greek national football team, as well as national championships or international events on athletics.
The overall sports facilities consist of the main stadium, an auxiliary court, cars parking outdoor space, crowd passage or gathering spaces, etc. The main stadium also hosts below its stands a total covered area of approximately 19,400 m2 with a volume of 89,535.7 m3, distributed in 25 sports halls, two swimming pools and a number of offices and stock rooms, employed on a daily basis by the Municipal and private sports clubs, along with their administrative support offices. The conditioned thermal zones cover a total area of 10,637.7 m2.

2.2. The Available R.E.S. Potential and the Prevailing Climate

The climate at the location of the Pancretan Stadium is typical Mediterranean. It is characterized by relatively warm winters, with temperatures rarely lower than 5 °C and often higher than 15 °C, due to the frequently blowing south winds, and cool summers with temperatures that rarely exceed 32 °C and relative humidity almost constantly lower than 75%, due to the almost continuously blowing local northwest winds from the open Aegean Sea.
The location is characterized with abundant solar radiation. As shown in Figure 3a, the incident solar radiation on the horizontal plane often exceeds 1000 W/m2 during summer, with a yearly global irradiation at 1780 kWh/m2. The presented solar radiation annual times series is based on the measurements captured by a meteorological station installed in the Wind Energy and Power Plants Synthesis Laboratory, of the Technological Educational Institute of Crete (T.E.I. of Crete), roughly 2.7 km to the south from the Stadium’s location.
In Figure 3b, the ambient temperature annual time series is presented, measured by the same meteorological station. The temperature and solar radiation annual time series will be employed in this work for the calculation of:
  • the thermal power production from the introduced solar collectors;
  • the electrical power production from the introduced photovoltaic (PV) station;
  • the indoor space heating and cooling loads.
Wind potential measurements were also used in this work for the calculation of:
  • the thermal losses rate from the solar collectors and the photovoltaic station to the ambient;
  • the indoor space heating and cooling loads.
The required wind potential data were provided by certified measurements (according to ISO 17,025: 2005) captured by a 40 m height wind mast, also installed at the above-mentioned Laboratory of T.E.I. of Crete. The wind velocity time series is presented in Figure 4a. The annual average wind velocity is calculated at 4.95 m/s and the Weibull parameters at C = 6.43 m/s and k = 1.90.
Finally, the location of the Pancretan Stadium next to the shore creates favorable conditions for the coverage of the indoor space conditioning needs with an open loop geothermal system. The computational simulation of the Geothermal Heat Pumps (GHP) operation will be performed with the utilization of seawater temperature annual time series. This time series was provided by the measuring, forecasting and information system “Poseidon”, of the Hellenic Centre of Marine Research (H.C.M.R.). The provided time series comes from a measuring station installed in the open sea, 28.1 nautical miles north from Heraklion and at the depth of 50 m from the sea surface [51]. The annual fluctuation of the seawater temperature is presented in Figure 4b.

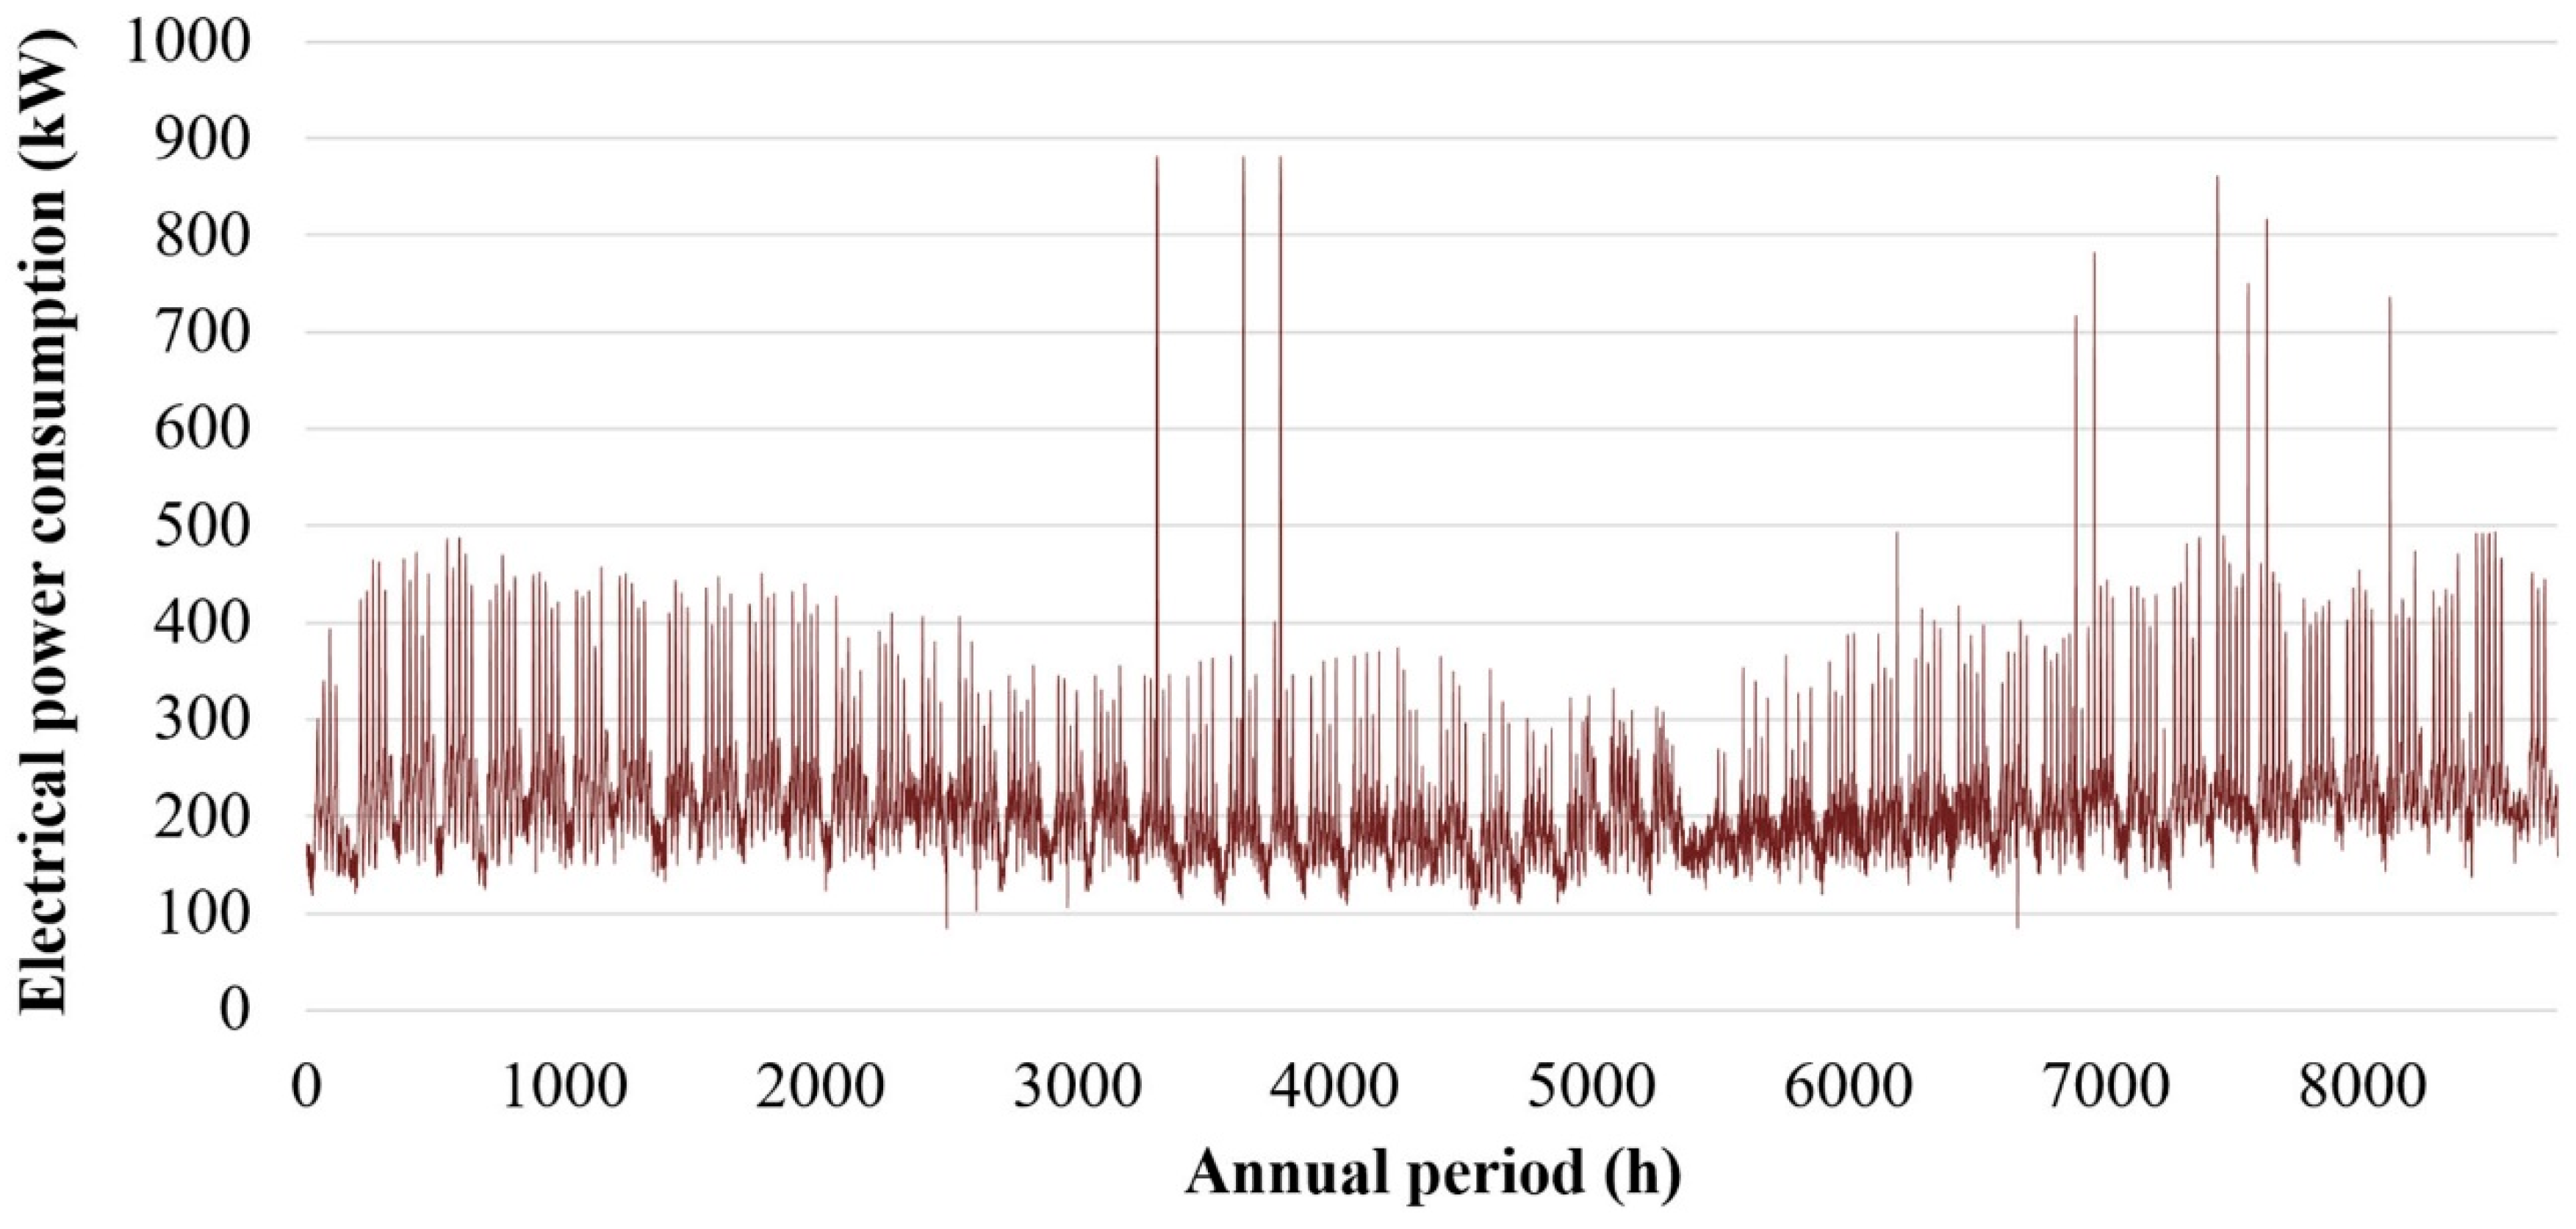
2.3. Energy Consumption in the Stadium’s Current Operation

In the current operation of the Pancretan Stadium, the final energy needs coverage is based on electricity and diesel oil. Electricity is consumed for the indoor space heating and cooling with a central chiller and remote split units, the lighting of the outdoor and indoor space, the production of hot water with electrical resistances installed in four thermal storage tanks, the indoor swimming pools heating with two air-to-air heat pumps, the operation of the circulators and fans of the hot water hydraulic network and the air duct network and for smaller office devices. Additionally, diesel oil is also consumed exclusively for the production of hot water.
The electricity consumption annual time series for 2016 is presented in Figure 5, as measured by the local electrical grid’s operator. The total annual electricity consumption is calculated at 1,889,198 kWh, while the total annual procurement cost for the same year was 241,889 €, leading to the annual average electricity procurement price of 0.1277 €/kWh. The remarkably high power demand peaks observed in Figure 5, which almost doubled compared to the average hourly values, are due to the main Stadium’s lighting system operation. Finally, the total annual reactive consumption was 388,407 kWh, imposing an annual, average power coefficient of 0.976. Generally, all the monthly average power coefficients are calculated higher than 0.965, obviously, due to the reactive consumptions support with a reactive power compensation panel.
Beyond the electricity consumption, diesel oil is also consumed exclusively for the production of hot water. The annual oil consumptions were also provided by the Stadium’s Management for the years 2016 and 2017 equal to 16,500 L and 16,430 L, respectively. For the purposes of this work, the annual oil consumption in the existing operation will be assumed equal to 16,500 L. The annual average diesel oil procurement price for 2017 in Crete was configured at 0.80 €/L (VAT not included). This price will be also adopted for this study, leading to an annual diesel oil procurement cost of 13,200 €.
In total, the annual energy resources procurement cost for the coverage of the energy needs in the Stadium’s current operation, given the above facts, is calculated as presented below:
  • electricity annual procurement cost: 241,389 €;
  • diesel oil annual procurement cost: 13,200 €;
  • both energy resources annual procurement cost: 254,589 €.

2.4. Summary of the Proposed Energy Upgrade Measures

Given the above presented facts, the proposed measures towards the energy performance upgrade of the Pancretan Stadium should be focused on:
  • the reduction of the indoor space cooling and heating loads, through the passive systems introduction in the Stadium’s envelope.
  • the replacement of the existing indoor space heating and cooling active systems with alternative, more efficient technologies.
  • the installation of new, energy efficient lighting bulbs, centrally managed and controlled by a BEMS.
  • the elimination of the currently consumed diesel oil through the installation of a solar-combi system, for the swimming pools heating and the production of hot water.
  • the electricity production from R.E.S. technologies (photovoltaic station or/and small wind turbines) under net-metering operation mode (electricity production and consumption annual compensation).
  • the optimization of the active energy systems management with the installation of a BEMS, aiming at the full automatic and central control of all the active systems for the indoor and outdoor space lighting, the indoor space heating and cooling, the hot water production and the swimming pools heating.

3. Passive Systems for the Stadium’s Envelope—Heating and Cooling Loads

3.1. Existing Condition

The heating and cooling loads accurate calculation for the indoor space located below the Stadium’s stands constitutes a demanding process, due to the complexity of the overall construction. For optimum results, the TRNSYS software application (v. 14, Thermal Energy System Specialists, LLC, Madison, WI, USA) was utilized for the accomplishment of this task.
The opaque surfaces of the Stadium’s envelope are inadequately insulated. They are constructed with reinforced concrete (40%) and double brick wall with thermal insulation between (60%). A total, average U-factor of 1.87 W/m2K was analytically calculated for these surfaces, using the U-factor essential relationship, presented below:
1 U = 1 h i + j d j k j + 1 h o ,
where dj and kj the involved constructive element j thickness and thermal conductivity factor, respectively. The latter were retrieved from relevant libraries provided in ASHRAE fundamentals [52]. The thermal transition factors for indoor and outdoor space hi and ho, respectively, are given in Section 3.3. The above calculated value is considerably higher than the maximum permitted one in the relevant Greek Directive on Building’s Energy Performance [53].
Most openings (doors and windows) are in improper condition. They are constructed with aluminum frame, without thermal break, and double (windows) or single (doors) glazing. A significant amount of openings, especially those located at the north part of the Stadium, closer to the seacoast, exhibit considerable wear in their frame due to the corrosive environment, resulting in inadequate sealing and subsequent air flow penetration. The calculated U-factors for doors and windows are 6.35 W/m2K and 4.04 W/m2K, respectively—significantly higher than the maximum permitted ones in the Greek Directive. The overall average U-factors for the openings are calculated with the following relationship [52]:
U av = U cg · A cg + U eg · A eg + U f · A f A cg + A eg + A f ,
where the subscripts “cg”, “eg” and “f” stand for the center of glass, edges of glass and the frame of the openings. U and A are the U-factor and the surface, respectively, of the corresponding elements. The openings’ U-factors were calculated by TRNSYS with the use of the above relationship.

3.2. Proposed Measures

Despite the above presented inadequate conditions, the installation of new insulation on the indoor space opaque surfaces (vertical walls and roofs) was not considered feasible due to the following facts:
  • the existence of suspended ceiling, constructed with insulating materials, in sports halls and offices;
  • the existence of partial, even improper, insulation for the vertical walls;
  • a high percentage of the vertical surfaces is covered with openings, restricting the contribution of the remaining vertical opaque surfaces to the indoor space heating and cooling loads;
  • the floor of the ground level is 1.5 m below the earth surface, hence the largest part of the vertical opaque walls of this level is in contact with ground, instead of air, leading, thus, to heating or cooling loads further reduction;
  • the high set-up cost of the thermal insulation and the expecting minor contribution to the heating and cooling loads reduction, which, in turn, affects negatively the economic feasibility of the specific intervention.
Additionally, a considerable amount of the existing openings, especially those in the first floor, are located in semi-outdoor space, formulated by the main Stadium’s stands, hence most of them are permanently shaded and protected from the winds. Additionally, some windows and doors are placed in rooms not frequently used or in non-conditioned space. The replacement of these particular openings is not considered necessary.
Given the above remarks, in concert with the Stadium’s Management, only a number of openings, located in conditioned, regularly used spaces, exposed in direct incident solar radiation and winds, were chosen to be replaced; together, the windows located in the north part of the Stadium, due to the extended wears from the neighboring corrosive sea environment. In total, 73 openings with a total surface of 719.24 m2 will be replaced, all of them windows, located in sports halls and offices. All of the new windows will be from synthetic frame, with low-e double glazing of 4 mm thickness and 18 mm gap between.

3.3. Heating and Cooling Loads Calculation

The heating and cooling loads calculation for the Stadium’s indoor space was executed following the fundamental methodology describing the thermal losses and the solar gains through the buildings’ envelope [54]. As mentioned previously, the overall process was implemented with TRNSYS. The relevant simulation model and the Stadium’s profile are presented in Figure 6.
The involved thermophysical parameters were defined by either the Greek Directive on Buildings’ Energy Performance [53] or the ASHRAE Fundamentals [52]. Specifically:
  • the U-values of the envelope’s opaque and transparent surfaces are mentioned above for the existing envelope’s conditions;
  • the U-values for the new windows, with the specifications presented in the previous section, were provided by a globally acknowledged, certified manufacturer with officially submitted quotations, between 1.3 and 1.9 W/m2K;
  • the solar gain factors of the transparent surfaces are assumed equal to 0.62 and 0.39 for the existing and the new glazing, respectively [52];
  • the thermal transition coefficients hi and ho, regarding heat transfer with convection and radiation from the Stadium’s envelope to indoor non-conditioned and outdoor space, respectively, were assumed equal to:
    -
    hi = 10 W/m2Κ and ho = 25 W/m2Κ for air flow over horizontal surfaces and for average wind speed of 5 m/s [52,54];
    -
    hi = 7.7 W/m2Κ and ho = 25 W/m2Κ for air flow next to vertical surfaces and for average wind speed of 5 m/s [52,54].
  • the natural ventilation, expressed in Air Changes per Hour (ACH), which describes the air flow penetration through the openings’ frame, is calculated by the following relationship [52]:
    ACH = K1 + K2∙(Tzone − Tamb) + K3∙uw,
    where uw is the average wind velocity, Tzone and Tamb are the indoor space and the ambient environment temperature and the parameters K1, K2 and K3 are set equal to (0.100, 0.023, 0.070) for the existing, inadequate sealing condition and equal to (0.100, 0.011, 0.034) for the proposed openings [52];
  • the following indoor space thermal comfort conditions are adopted, as defined in the Greek Directive: temperature 22 °C–18 °C in winter and 26 °C–25 °C in summer for offices and changing rooms-sports halls respectively, relative humidity 50% [53];
  • the ventilation requirements, the internal heat gains from occupants, devices, etc., are retrieved from the Greek Directive on Buildings’ Energy Performance [53];
  • the daily usage schedule and the number of users for the existing facilities in the Stadium were provided by the Stadium’s Management.
The heating and cooling loads annual calculation is executed on hourly average steps, based on the available time series presented in Section 2.2 for the available incident solar radiation, the wind velocity and the ambient temperature. In this way, annual heating and cooling loads time series with average hourly values are calculated. For a more comprehensive and conceivable presentation, the heating and cooling loads annual time series are monthly summarized and presented in Table 1 and Table 2 for the existing and the proposed envelope’s condition, respectively.

3.3.1. Existing Envelope’s Condition

Given the annual final thermal energy needs for indoor space heating and cooling with the existing envelope’s condition (381.5 MWh and 436.3 MWh, respectively) and the conditioned space covered area (10,637.7 m2), the specific thermal energy consumption per unit of conditioned space covered area is calculated at 35.87 kWh/m2 and 41.02 kWh/m2 for heating and cooling, respectively. The total thermal energy specific consumption for indoor space conditioning equals 76.88 kWh/m2.
In Table 1, the monthly analysis of the electricity consumption for the indoor space heating and cooling is also presented. This calculation is based on the following assumptions:
  • The indoor space cooling is totally covered with an air-to-air central cooling device (Carrier 30 GX 267, 924 kW, Carrier, Farmington, CT, USA).
  • As already stated in Section 2.3, according to the Stadium’s Management, the existing oil burners are exclusively employed for hot water production. Hence, no oil is consumed for indoor space heating. This means that the indoor space heating needs are only partially covered with autonomous split units (air-to-air heat pumps), installed mainly in offices. Based on the on-site inspection, the percentage of these heated indoor space covered area over the total conditioned space area was calculated at 14.7%.
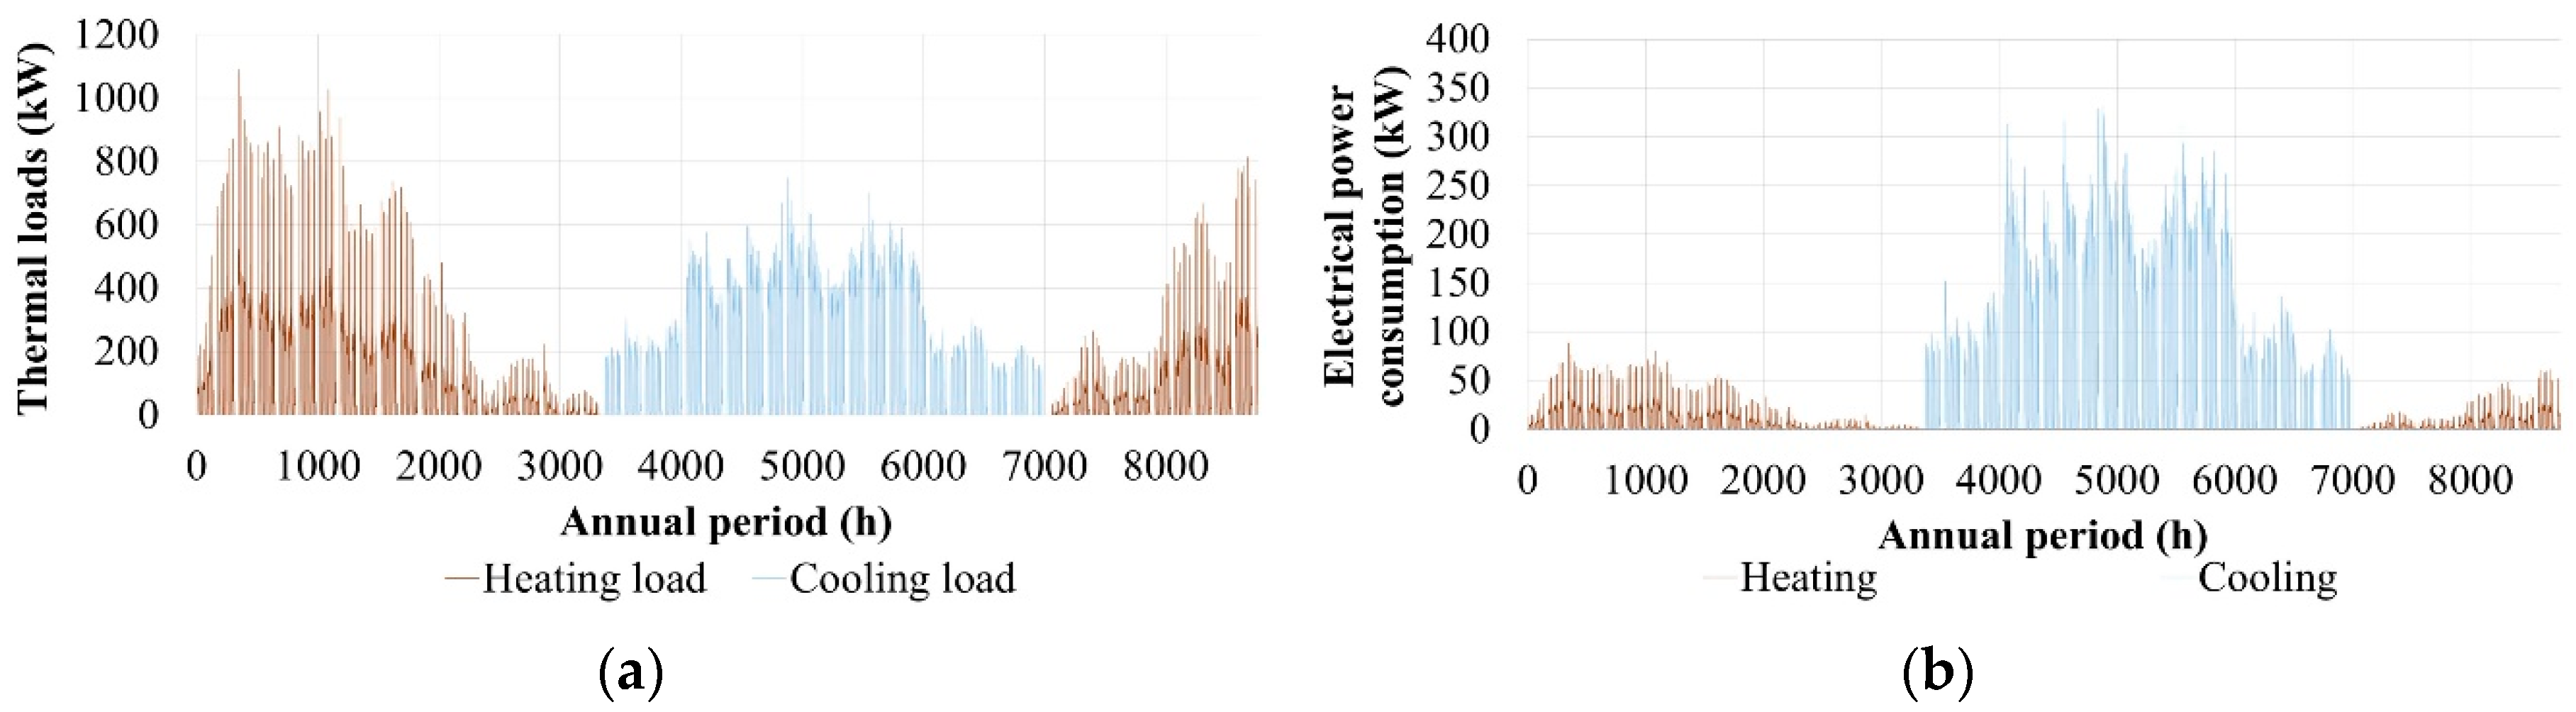
  • Based on the above approach, the electricity consumption calculation for the indoor space heating and cooling in the existing operation was executed by assuming that the cooling loads are 100% covered, while the heating loads are 14.7% covered annually.
  • The electricity consumption annual time series was calculated on the basis of the existing heating and cooling loads coverage as described above, the ambient temperature (Figure 3b, Section 2.2) and the Coefficient of Performance (COP) and the Energy Efficiency Ratio (EER) typical fluctuation curves for air-to-air heat pumps versus the ambient temperature, presented in Figure 7. These curves are retrieved from real, commercial heat pumps models.
Given the heating Q ˙ h or the cooling Q ˙ c load, the electrical power consumption Pel is simply calculated with the following relationship:
P el c   = Q ˙ c EER   or   P el h = Q ˙ h COP ,
where the subscripts “c” and “h” stand for cooling and heating, respectively.
The heating and cooling loads annual fluctuation in the existing operation and the corresponding electricity consumption are presented in Figure 8. The indoor space inadequate heating is characteristically revealed by comparing Figure 8a,b.

3.3.2. With the Proposed Passive Measures Realization

With the replacement of the selected openings, the annual final thermal energy consumption for the indoor space heating is reduced at 318.4 MWh (16.5% reduction compared to the existing operation) and for cooling at 411.3 MWh (5.7% reduction). The specific final thermal energy consumption per unit of conditioned space covered area (10,637.7 m2) is calculated at 29.93 kWh/m2 and 38.67 kWh/m2 for heating and cooling, respectively, giving a total final thermal energy specific consumption for indoor space conditioning at 68.60 kWh/m2 (10.8% reduction compared to the existing operation).

4. Active Systems

4.1. Active Systems for Indoor Space Conditioning

The vicinity of the Stadium with the seacoast and the significant indoor space heating and cooling needs create the prerequisites for the installation of an open loop geothermal system, which will operate with seawater, pumped from and disposed back to the aquifer. The geothermal system will co-operate with water-to-water GHPs. The basic structure of the proposed geothermal system is depicted Figure 9 [7,55].
According to the heating and cooling loads’ calculation results after the existing openings replacement, the annual peak thermal power demand equals to 868 kW and 680 kW for heating and cooling, respectively. A commercial GHP model is selected with final heating and cooling nominal capacity of 110 kW and 90 kW, respectively. In total, eight (8) GHP units should be installed in two similar, parallel groups, as presented in Figure 9.
According to Figure 9, through a closed, primary loop, seawater is provided for the source heat tank, pumped from the aquifer by two independent supply boreholes and cleaned in two hydro-cyclone devices, where it is separated from algae, sand, stones and, generally, any type of debris. Once heat has been provided for or absorbed from the secondary heat pumps loop, during winter and summer, respectively, seawater is disposed back to the aquifer through the disposal boreholes. The heated or cooled water is then pumped, through the secondary closed loop, from the source heat tank to the GHPs’ condenser, to offer or remove heat, during winter or summer respectively. The produced heating or cooling in the GHPs is then provided for the load heat tank, through a third closed loop, from which it is finally provided for the thermal energy distribution network. The supply and disposal boreholes should be at a minimum distance of roughly 50 m, to eliminate any possible impact on the supplied seawater temperature from the disposed seawater [11].
The electricity consumption for the indoor space heating and cooling with the introduction of the proposed geothermal system and the implementation of the proposed passive measure (openings replacement) is calculated using relationship (4) and following the data and parameters below:
  • the COP and EER fluctuation curves versus the seawater temperature of the employed GHP model, presented in Figure 10;
  • the heating and cooling loads annual time series after the replacement of selected openings (Figure 11a);
  • the seawater temperature annual time series, presented in Section 2.2 (Figure 4b).
With the above data available, a straightforward calculation of the electricity consumption from the GHPs is executed. The annual electricity consumption time series for the indoor space conditioning with the realization of the proposed passive and active systems is presented in Figure 11b. In Figure 11b, it is clearly seen that both the heating and cooling loads are fully covered with the proposed system, unlike the heating loads incomplete coverage in the existing operation.
The annual heating and cooling loads, together with the electricity consumption from the GHPs are analyzed per month in Table 3.
By comparing Table 1 and Table 3, it is seen that, in total, a saving percentage of 48% on the annual primary energy consumption is achieved, despite the fact of the inadequate indoor space heating in the existing operation and the corresponding 100% coverage with the proposed geothermal system.

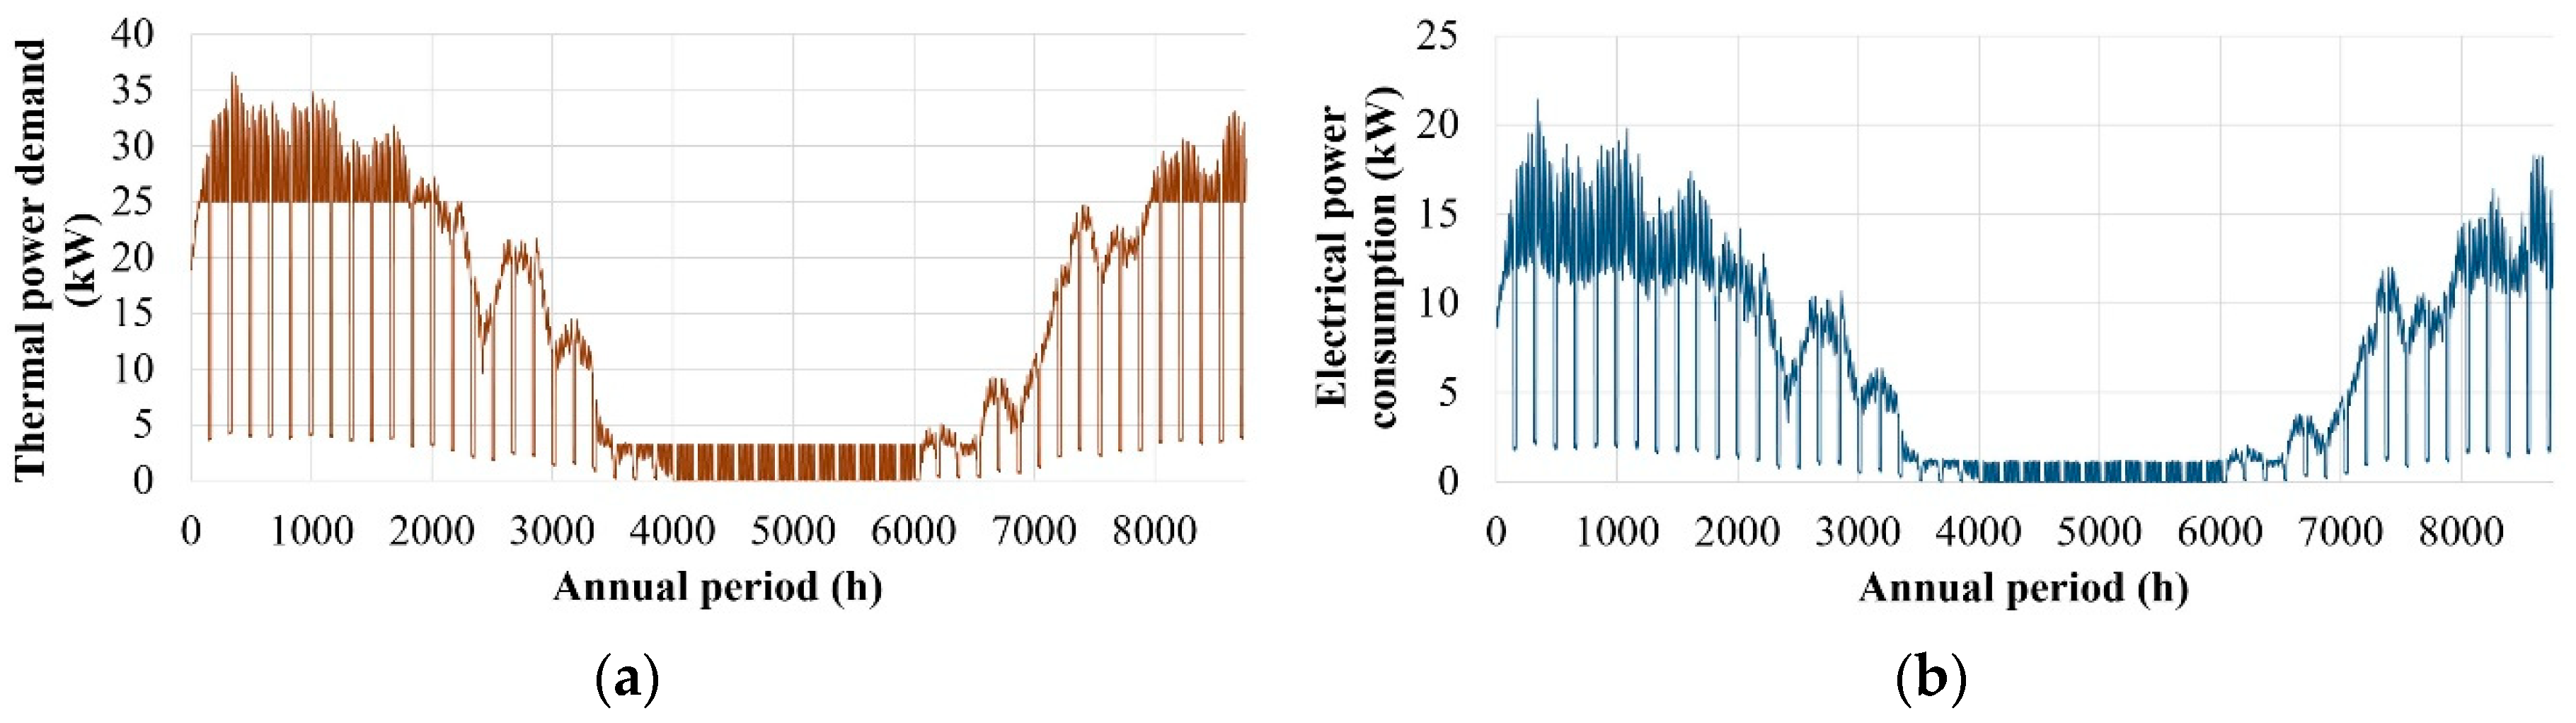
4.2. Hot Water Production and Swimming Pools Heating

Two swimming pools are hosted in the indoor space below the main Stadium’s stands, a large one, with dimensions 25 × 12.5 m, and a training one, with dimensions 12.5 × 6 m. Additionally, below the main Stadium’s stands, there are 25 sports halls, supported by exclusive changing rooms, equipped with showers and, configuring, thus, a considerable amount of hot water daily consumption. The above facilities impose significant final thermal energy needs for the production of hot water, consumed in the changing rooms, and the swimming pools heating.

4.2.1. Existing Thermal Energy Demand

Firstly, the adopted approach for the calculation of the annual thermal energy required for the production of hot water will be presented. It was based on the data provided by the Stadium’s Management, such as:
  • on a daily basis, roughly 1400 users make use of the Stadium’s available sports facilities; around 500 of them are swimming pools users and 900 of them make use of the rest sports halls;
  • it is estimated that each user of the swimming pools consumes V = 30 L of hot water per visit, while each user of the rest sports halls consumes V = 20 L per visit;
  • it is additionally estimated that 50% of the sports halls users, namely 450 users per day, do not make use of the changing rooms, hence they do not contribute to the daily hot water consumption;
  • the hot water temperature, density and specific heat capacity are adopted equal to Th = 45 °C [53], ρ = 990 kg/m3 and cp = 4180 J/kgK, respectively;
  • following the above assumptions and facts, the hot water consumption daily profile was developed, presented in Figure 12a.
Eventually, the final thermal energy consumption Q is calculated on a daily basis with the following essential relationship:
Q   =   m · c p · ( T h     T c ) ,
where m is the hot water mass consumption, calculated as the product of the consumed hot water volume V with its density ρ and Tc is the water temperature from the supply network. The annual fluctuation of the average monthly values of the temperature Tc is given in the Greek Directive of Buildings’ Energy Performance [53] for the climatic zone of Crete.
By replicating the thermal power demand daily profile day by day for the whole annual period, the corresponding annual time series is developed, presented in Figure 12b. By integrating this curve, the annual final thermal energy demand for hot water production is calculated at 261,015 kWh.
The calculation of the heat losses from the swimming pools’ free surfaces to the indoor ambient environment leads to the calculation of the thermal power required for the maintenance of the water temperature in the swimming pools at the desirable level. To this end, firstly, the calculation of the indoor space heating loads to the outdoor ambient is required, from which the annual fluctuation of the indoor space temperature Tin will be calculated. Secondly, the swimming pools heating loads Q ˙ sp are calculated with the following general relationship:
Q ˙ sp   =   A · U · ( T w T in ) ,
where:
A:
the swimming pools upper surface area, from which heat is transferred to the ambient environment (in m2).
U:
the U-factor determining the heat transfer rate from the swimming pools free surface to the ambient environment (in W/m2K).
Tw:
the desirable water temperature in the swimming pools, adopted equal to 26 °C.
Tin:
the indoor space temperature (in °C).
In the existing operation condition, heat is transferred directly from the water to the ambient with convection and radiation, hence the U-factor is given by the relationship:
U w   =   h rw   +   h c ,
where hc = 2.5 W/(m2∙K) the convective heat transfer factor for indoor space air flows above horizontal surfaces [52,54] and hrw the heat transfer factor with radiation, given by the following relationship:
h rw   =   4 · ε w · σ · ( T w   +   T a 2 ) 3 ,
where:
  • εw = 0.957 is the emissivity coefficient of water;
  • σ is the Stefan-Boltzman constant, equal to 5.67 × 10⁻⁸ W/(m2⋅K4);
  • Tw = 26 °C is the required water temperature in the swimming pools;
  • Ta is the ambient temperature above the swimming pools, calculated within the indoor space heating and cooling loads’ calculation procedure.
The term inside the parenthesis in the last relationship stands for the average temperature between the water in the swimming pools and the ambient indoor environment.
The annual fluctuation of the final thermal power required for the swimming pools heating is presented in Figure 13a. By integrating this annual time series, the corresponding annual final thermal energy demand is calculated at 112,216 kWh.

4.2.2. Primary Energy Consumption in Existing Operation

Diesel oil is exclusively consumed in Pancretan Stadium for hot water production. The annual consumed amount of 16,500 L corresponds to 128,550 kWh of final thermal energy, if we take into account the specific heat capacity of diesel oil equal to 10.25 kWh/L [53] and the efficiencies of the existing diesel oil burner and the heating distribution network equal to 80% and 95%, respectively, according to the issued energy performance audit for the existing heating production and distribution system.
The total final thermal energy required for hot water production has been previously calculated at 261,015 kWh. The remaining thermal energy is supplementary produced by 12 electrical resistances of 12 kW each. These electrical resistances are evenly installed in four thermal storage water tanks (three resistances, 36 kW installed in each tank), of 5000 L volume capacity each, allocated in the four corners of the main Stadium. The same tanks are also supplied with the thermal energy produced by the diesel burner, before being distributed in the hot water network. The existing electricity consumption on the electrical resistances for hot water production is simply calculated by introducing the heating network distribution efficiency and by assuming the electricity to thermal energy conversion efficiency at 100%: (261,015 − 128,550) kWh/0.95 = 139,436 kWh.
Two air-to-air heat pumps are currently employed in the Stadium, with 25.8 kW and 16.8 kW electrical power input, which exclusively undertake the task of swimming pools heating. The imposed annual electricity consumption is calculated with the relationship (4), where Q ˙ h is the swimming pools heating load (Figure 13a) and COP the involved air-to-air heat pumps coefficient of performance, retrieved from Figure 7a. The electrical power consumption from the existing air-to-air heat pumps for the swimming pools heating is presented in Figure 13b. By integrating the latter annual time series, the corresponding annual electricity consumption is calculated at 52,198 kWh.

4.2.3. Proposed Passive and Active Systems for Hot Water Production and Swimming Pools Heating

The swimming pools heating loads can be reduced with the placement on their upper surfaces of an insulating, floating cover, during the time periods they are not used. Due to this passive measure, in the proposed operation, the U-factor regarding the heat losses from the swimming pools free surface to the indoor ambient environment will either take the values already calculated in Section 4.2.1, whenever the swimming pools are in use, hence no insulating cover is placed on their surfaces, or the values calculated with the process presented below. Specifically, when the swimming pools are not in used and the insulating floating cover is placed on their surfaces, heat will be transferred from the water to the insulating floating cover with convection, then through the cover with conduction and finally from the cover to the ambient environment with convection and radiation. The U-factor regarding the overall heat transfer process is given by the relationship:
U c   =   1 1 h w + d k + 1 h fc ,
where:
  • hw = 50 W/(m2K) is the convective heat transfer factor of still water [52,54];
  • d = 2 cm is the floating insulating cover thickness, given by certified manufacturer;
  • k = 0.025 W/(m∙K) is the floating insulating cover conduction coefficient, given by the manufacturer; the material of the insulating cover is polyethylene;
  • hfc = hrc + hc is the total heat transfer factor from the insulating cover to the ambient, equal to the sum of the convective heat transfer factor hc = 2.5 W/(m2∙K) for indoor space air flows above horizontal surfaces and the radiation heat transfer factor hrc of the insulating material; the latter is given by a relationship similar to Label (5), by replacing the emissivity of water with the emissivity of the insulating material εc = 0.55, as provided by a certified manufacturer.
Given the introduced passive measure, the swimming pools heating loads are calculated again. Their annual fluctuation is depicted in Figure 14a. The direct impact of the insulating floating cover is the reduction of the annual thermal energy demand for the swimming pools heating at 54,620 kWh. This means that a 51.3% reduction percentage is achieved, compared to the existing annual thermal energy demand (112,216 kWh).
For thermal power production, a solar-combi system is proposed. Solar-combi systems are practically hybrid thermal plants, aiming at the maximization of the thermal power production from the R.E.S. unit, namely the solar collectors, with the support of thermal storage tanks. In the present study, water thermal storage tanks are utilized. The system is integrated with a biomass heater [56]. In the Pancretan Stadium, four new thermal storage tanks will be introduced, replacing the existing ones, due to their ageing, with double hydraulic inlet for concurrent thermal power storage from both the solar collectors’ field and the biomass heater. Each thermal storage tank will be connected to a particular solar collectors’ group, formulating, in this way, four independent solar-combi systems. Thermal power inlets from the biomass heater will be connected to all four thermal storage tanks, supplementing the thermal power production from the solar collectors. Each thermal storage tank will serve a particular, neighboring part of the overall hot water distribution system.
The essential theory on solar collectors’ thermal processes and thermal storage processes is applied for the dimensioning of the introduced solar-combi system [57]. It consists of a complex and extensive set of relationships, due to the involvement of a large amount of thermophysical and geometric parameters regarding the specifications of the employed solar collectors and thermal storage tank models. The ultimate target of the dimensioning procedure is to ensure an annual penetration percentage at least 50% for the thermal energy produced or stored by the solar collectors versus the total annual thermal energy demand for both hot water production and swimming pools heating, ensuring, at the same time, the project’s economic feasibility.
The operation algorithm of the proposed solar-combi systems is analyzed in the following steps:
  • For the current calculation hourly time step i, the water temperature Ts (i−1) in each thermal storage tank from the previous time step i−1 is compared to the outlet temperature Tout of the corresponding solar collectors’ field. If Tout > Ts(i−1), then the thermal energy produced by the solar collectors can be stored in the thermal storage tank. In a different case, the provided thermal energy by the solar collectors’ field cannot be exploited and is rejected. Practically, there is no working medium’s flow in the solar collectors’ primary hydraulic loop.
  • At the same time, any potential thermal power demand Q ˙ d must be covered by thermal power stored Q ˙ st in the thermal storage tank. In case of not enough stored thermal power, the thermal power demand shortage: Q ˙ b = Q ˙ d Q ˙ st is undertaken by the biomass heater.
  • Taking into account the above thermal power flows from and to the thermal storage tank ( Q ˙ d , Q ˙ st , Q ˙ b ) and the heat losses from the tank to the ambient, the new water temperature in the tank, at the end of the current time step, is calculated.
The execution of the dimensioning optimization methodology concluded to the configuration of four independent solar collectors’ fields, each one of them consisting of 32 collectors and connected to a different thermal storage tank. In total, 128 solar collectors will be installed in all four solar-combi systems. The connectivity of each solar collectors’ field is depicted in Figure 15a, formulated by eight parallel groups, with four collectors connected in series in each one of them. The siting of the overall solar collector field is presented in Figure 15b. The inclination angle versus the horizontal level is selected at 45°, which maximizes the thermal energy production for the whole annual period, as calculated by iterative calculations of the thermal power production from one solar collector for different inclination angles.
The concluded dimensioning led to the calculation of the annual time series of the thermal power stored from the solar collectors to the thermal tanks, in total, depicted in Figure 14b.
The results from the calculation of the final thermal energy needs, the consumed energy resources (oil, electricity and biomass) and the corresponding primary energy (PE) consumption on annual basis are summarized in Table 4, for the coverage of the hot water production (HWP) demand and the swimming pools’ heating (SPH) loads both in the existing and the proposed operation. Additionally, the annual primary energy saving (PES) is also presented.
Primary energy consumption is calculated versus the consumed energy resources by introducing the following factors defined in the Greek Directive on Buildings’ Energy Performance [53]:
  • 1.1 for diesel oil, multiplied with the initial chemical energy contained in the consumed fuel;
  • 2.9 for electricity produced from thermal power plants, multiplied with the corresponding electricity consumption.

4.3. Interventions on Lighting Equipment

Electricity consumption for lighting represents a major percentage of the total energy consumption in the Pancretan Stadium. Lighting needs in Pacretan Stadium come from:
  • outdoor space, including the main and the auxiliary stadium and the surroundings of the main stadium (pedestrian areas, cars parking areas, etc.);
  • the indoor space lighting, including the sports halls, the offices, the changing rooms, the stock rooms, the corridors, etc.
The annual electricity consumption in the existing and the proposed operation was calculated versus the total nominal power Pn of the installed lighting equipment, the daily operation period top of each distinct facility and a concurrency operation factor fc of the lighting equipment involved in each facility [58]. In general, the following relationship is applied:
E light   =   P n · t op · f c .
In total, the following distinct facilities with regard to lighting operation schedule have been classified:
  • indoor sports halls, swimming pools, changing rooms, corridors;
  • offices;
  • outdoor parking and surrounding areas;
  • main Stadium, daily usage;
  • main Stadium, events hosting;
  • auxiliary Stadium, daily usage.
For each one of the above facilities, the total electrical power input Pn of the installed lighting lamps was calculated through detailed counting of the existing lamps. The daily operation period was provided by the Stadium’s Management. With the estimation of the concurrency factor separately for each one of the above facilities [58], the annual electricity consumption for the corresponding lighting needs coverage was calculated with the above relationship.
The proposed interventions on the lighting system consist of:
  • the replacement of all the existing floodlights and lamps with new of LED technology, with the same luminosity with the existing lighting devices;
  • the full, automatic operation and management of the lighting system by a new BEMS.
The electricity consumption with the new lighting devices was calculated again by using the relationship (10), with the same operation period and concurrency factor as in the existing operation, yet with the new, lower total electrical power input of the LED lamps and floodlights. Especially for the main Stadium, a completely new lighting study was executed, according to the international standards of UEFA and IAAF [59,60].
The lighting devices will be centrally controlled by the newly introduced BEMS, which will enable several automations on the lighting system operation, such as automatic switching on and off or luminous intensity adjustment versus the human presence or the natural light luminosity. More on the new BEMS are provided in the next section.
The annual electricity consumption before and after the implementation of the proposed energy saving measures on the Stadium’s lighting system are presented in Table 5.

4.4. Electricity Production from Renewable Energy Sources

Once the potential for energy savings in the Stadium has been exhausted, the following step is the investigation for any possible electricity production from the exploitation of the locally available R.E.S. potential. In such cases, the most feasible and favorable technology is the photovoltaic panels. In the specific application, a PV station is proposed to be installed in the western roof of the main Stadium’s stands, which has been removed due to corrosion and the strong blowing winds (only the bearing structure has remained). In this way, the new PV station, apart from the obvious task of electricity production, will also act as a new roof, saving a considerable monetary amount for its restoration.
The PV station will be integrated in the local electrical grid under “net-metering” mode. This implies that the electricity consumption in the Stadium will be compensated with the production from the PV station on annual basis. The annual electricity procurement charge will be performed versus the net annual electricity consumption, derived by this annual compensation.
The siting of the PV panels is presented in Figure 16a. The photovoltaic panels are laid on the roof’s surface, hence their inclination angle versus the horizontal plane and their orientation are configured by the inclination and orientation of the roof’s surface (3° with western orientation). The total available space on the installation roof is 5585 m2. To maximize the total installed power, a PV panel of 300 Wp nominal power is selected. With the presented siting, the achieved total installed PV power is 645.30 kWp.
The calculation of the annual electricity production time series is based on the available data of the incident solar radiation, the wind velocity and the ambient temperature, presented in Section 2.2. The calculation of the annual electricity production is a simple, straightforward process, thoroughly described in [61]. The final (after losses) electricity production annual time series is presented in Figure 16b. The total annual electricity production from the photovoltaic station is calculated at 932,711 kWh, with a corresponding primary energy of 2,704,862 kWh. The annual, final (after losses) capacity factor is calculated at 16.50%.

4.5. BEMS

An advanced Building Energy Management System is proposed for the full automatic control and operation of the introduced active systems. The main tasks will be:
  • the measuring of all the electrical power consumptions in the Stadium;
  • the control and the inspection of the active energy production systems operation.
Specifically, the proposed BEMS should execute the following tasks:
  • inspection and control of the hot water production and swimming pools heating systems, by gathering temperature signals from the solar collectors primary loop, the swimming pools and the thermal storage tanks, and by sending commands towards the involved circulators and motor-valves in the hydraulic networks;
  • inspection and control of the GHP system for the indoor space conditioning, by gathering temperature signals from the indoor conditioned space and the source and load heat tanks, and by sending orders to the heat pumps, the circulators and the motor-valves in the hydraulic network and the air fans and the dampers in the air ducts network;
  • the outdoor and indoor space lighting system, by gathering data regarding the occupants’ presence and the natural available light in the indoor space, the outdoor sports facilities operation schedule, the security lighting operation schedule, etc.
Due to the BEMS introduction, 20% additional annual electricity savings is estimated, expected to occur mainly from the more efficient operation of the circulators of the hot water hydraulic network, the air fans of the air ducts network and the new circulators of the GHP system. The BEMS contribution to the annual electricity saving is not possible to be precisely calculated with a computational or empirical method, due to the too many involved parameters and the considerable amount of different operation states of the controlled systems, which make the operation simulation practically impossible. For this reason, the annual electricity saving percentage is adopted at 20% [36], based on the technical data provided by BEMSs’ developers and manufacturers.
The BEMS contribution to the annual electricity saving should be calculated on the new expecting annual electricity consumption, after the realization of the proposed passive and active systems. By applying the above presented percentage, the total annual electricity savings due to the introduction of the BEMS is calculated at 181,696 kWh.

5. Summarizing Energy Saving Results

5.1. Reactive Electricity Saving

The active electricity consumption saving imposes corresponding reduction on the reactive electricity consumption. The new calculated annual active electricity consumption, after the realization of the proposed energy performance upgrade measures, is summarized in Table 6.
Given the current electricity consumption analysis, the annual average power coefficient for the current operation state is calculated at 0.978. Although the existing infrastructure will be upgraded, leading to improved inductive performance of the Stadium’s electrical installation and, consequently, to higher power coefficient, for the calculation of the expecting annual reactive consumption saving in this study the same power coefficient with the existing operation state will be adopted. Given the total new annual electricity consumption presented in Table 6 and keeping the same annual average power coefficient, the new annual reactive consumption is calculated at 224,429 kWh. The corresponding annual reactive electricity saving percentage is calculated at 42%.

5.2. Total Energy Saving and Energy Performance Upgrade

The annual primary energy consumption in the current operation state of the Pancretan Stadium is calculated in Table 7. In the same table, the specific primary energy consumption per unit of effective covered area, adopted equal to 15,810.37 m2 according to the issued energy performance certificate, is also presented. At the same certificate, the reference primary energy specific consumption is calculated at 272 kWh/m2. The quotient of the above primary energy specific consumptions is 1.58, classifying the Stadium at its current operation state in energy performance D rank.
With the introduced energy performance upgrade measures, energy saving and production are achieved as summarized in Table 8. According to the presented summarizing results in Table 8, the primary energy new annual consumption is estimated at 1,178,012 kWh and the new primary energy annual specific consumption is calculated at 74.51 kWh/m2. The ratio of this new primary energy specific consumption versus the reference primary energy specific consumption (272 kWh/m2) equals 0.27, imposing the energy performance upgrade of the Pancretan Stadium at A+ rank.
The new electricity net consumption is calculated by subtracting the PV electricity production from the new total electricity consumption:
  • electricity new annual consumption: 1,052,186 kWh;
  • electricity annual production from the PV station: 932,711 kWh;
  • electricity new net annual production (compensated with the PV production): 119,475 kWh.

6. Economic Figures

The set-up cost of the overall proposed energy performance upgrade project, presented in Table 9 (no VAT included), was estimated on the basis of the accurate dimensioning and calculation of the required technical works. The adopted construction and equipment procurement prices were either retrieved by official quotations provided by potential suppliers or by introducing official costs and prices for the construction of public works from the relevant norms and directives. Based on the results presented in Table 9, the specific set-up cost, per unit of effective covered area (15,810.37 m2), is calculated at 169.05 €/m2.
The energy resources annual procurement cost for the Stadium’s operation after the realization of the proposed energy performance upgrade measures is configured by the annual electricity and biomass consumptions. It is calculated in Table 10, taking into account the:
  • annual average electricity procurement price: 0.1277 €/kWh (see Section 2.3);
  • annual average procurement price of biomass pellets in Crete: 300 €/tn.
In the above prices no VAT is included. In Table 10, the energy resources procurement cost annual reduction is also calculated.

7. Key Performance Indices

In this section, the economic and energetic feasibility of the proposed investment are justified with the calculation of specific Key Performance Indices (KPIs). Specifically:
• Investment payback period:
This index is calculated as the ratio of the total set-up cost of the overall proposed project (2,676,700 €) over the expecting annual monetary saving (229,973 €) (VAT is not included in either of the above amounts). The ratio of the above two amounts gives the payback period equal to 11.6 years. By assuming a discount rate of 3%, the discounted payback period is calculated at 15.5 years.
• Annual primary energy saving percentage:
The existing primary energy specific consumption equals to 429.54 kWh/m2 of effective covered area. The new primary energy specific consumption equals to 74.51 kWh/m2. The above values imply percentage reduction of the annual primary energy consumption equal to 82.65%.
• R.E.S. penetration:
The annual percentage penetration of the introduced R.E.S. technologies will be calculated on the common basis of the primary energy annual consumption and the primary energy annual production from the involved R.E.S. technologies in the proposed operation state.
Primary energy production from R.E.S. technologies in the proposed operation comes from:
-
the annual electricity production of 932,711 kWh from the PV station, corresponding to 2,704,862 kWh of primary energy;
-
the annual thermal energy production from 31.197 tn of biomass pellets, corresponding to 180,691 kWh of primary energy;
-
the thermal energy production from the solar collectors.
The primary energy that corresponds to the thermal energy produced by the solar collectors will be calculated on the basis of the avoided primary energy consumption for the same thermal energy production at the existing operation state. The solar collectors will substitute thermal energy production from diesel oil and electricity in the Stadium’s existing operation. The scope of the analysis below is the primary energy estimation that corresponds to the consumed amounts of diesel oil and electricity for the production of the same thermal energy with the solar collectors’ production in the proposed operation. Specifically:
-
The total final thermal energy consumption for the production of hot water was calculated 261,015 kWh (Section 4.2.1). The solar collectors’ contribution to this thermal energy production was calculated at 169,700 kWh (Table 4, Section 4.2.3).
-
The annual diesel oil consumption (16,500 L) implies annual thermal energy production equal to 128,550 kWh, corresponding to 186,059 kWh of primary energy (Table 4, Section 4.2.3).
-
The remaining thermal energy that will be produced by the solar collectors in the proposed operation is currently produced by the electrical resistances in the existing operation:
169,700 kWh − 128,550 kWh = 41,150 kWh
-
The avoided primary energy consumption for hot water production in the existing operation is simply calculated as 186,059 kWh + 41,150 kWh × 2.9 = 305,394 kWh.
This is the corresponding primary energy production from the solar collectors.
In the new operation state, primary energy consumption comes from:
-
The total active electricity consumption, not compensated by the PV production, equal to 1,052,186 kWh (Section 5.2) and the reactive electricity consumption of 224,429 kWh (Section 5.1), corresponding totally to 3,702,183 kWh of primary energy.
-
The annual consumption of 31.197 tn of biomass pellets, corresponding to 180,691 kWh of primary energy (Table 4, Section 4.2.3).
Given the above analysis, the annual R.E.S. production penetration percentage is analyzed in Table 11.
• Annual CO2 emissions saving:
The CO2 annual emissions savings come from the elimination of the diesel oil consumption and the achieved reduction on the annual electricity consumption. Introducing the following CO2 specific emissions for electricity and diesel oil consumptions, as defined in the Greek Directive on Buildings’ Energy Performance [53]:
-
0.989 kg CO2/kWh of corresponding primary energy consumed, for electricity production,
-
0.264 kg CO2/kWh of corresponding primary energy consumed, for diesel oil production.
The annual CO2 emission saving due to the introduced measures is analyzed in Table 12. As seen in Table 12, officially no CO2 emissions are considered for biomass consumption.

8. Conclusions

This article presents the overall roadmap towards the energy performance upgrade of a national stadium. The size of the Stadium’s facilities and the variety of the energy loads make the overall work a complex and demanding task. Aiming to summarize the quantitative results of this work, we may conclude to the following remarks:
  • High energy saving percentages are achieved by each one of the proposed interventions. Specifically, the combined replacement of particularly selected openings in the Stadium’s envelope and the geothermal system installation lead to 48% electricity savings for the indoor space conditioning, compared to the existing operation. Moreover, a total savings of 83% is also achieved on the primary energy consumption for hot water production and swimming pools heating. The introduced interventions on lighting system will also offer 52% savings on the electricity consumed for the Stadium’s lighting needs. The reduction percentage on the reactive electricity annual consumption, due to active electricity savings, exceeds 42%.
  • The Stadium’s energy performance is upgraded to rank A+ from rank D. With further production of 199,475 kWh of electricity, which can be achieved with the additional installation of roughly 85 kWp of PV panels, the Stadium will be upgraded to a zero-energy infrastructure.
  • The electricity and diesel oil annual achieved savings impose a corresponding annual CO2 emission reduction above 85%, with regard to the current operation.
  • Impressive evaluation indices are calculated, like the remarkably low payback period (12 years), the high R.E.S. annual penetration percentage (82%) and the high energy saving percentage (83%).
Beyond the above presented quantitative results, the article highlights the significant energy saving potential on large size sports facilities, such as national Stadiums. As a matter of fact, such large size facilities exhibit considerably high energy consumptions, through a variety of final energy uses, with lighting, indoor space conditioning, hot water production and swimming pools heating being the most important. The size and the variety of these loads create a huge potential for the introduction of active and passive energy performance upgrade measures, offering also the chance for the configuration of advanced systems, through the combined operation of fundamental technologies. An example from the presented case study in this article is the introduced solar-combi system for the swimming pools heating and hot water production.
Another feasible intervention could also be the introduction of the emerging technology of photovoltaic hybrid solar thermal panels, for the concurrent electricity and thermal energy production. Nevertheless, in the specific application, this option was impossible to be proposed, due to the siting of the photovoltaic panels on the roof of the main Stadium’s stands. The installation of a new hydraulic network at this particular location, for the produced thermal energy transfer, would require extensive technical works with considerable additional set-up cost. On the contrary, as underlined above, all the proposed measures were formulated according to the existing technical infrastructure in the Stadium. In this way, it was also ensured that the realization of the proposed measures will cause the minimum possible impacts on the regular operation of the offered facilities. Indeed, apart from the openings’ replacement, all the rest implied technical works are limited in specific points, either in outdoor space or in the existing boilers rooms.
The article attempted to approach an integrated methodology for energy performance upgrade of large size Stadiums. This topic, as indicated in the introductory section, has not been covered in the existing scientific literature so far. The integrated approach is based on the investigation of all the possibly available measures that could be utilized for energy savings and production. The structure of the article indicates the proper order for the investigation and the dimensioning of the potential measures, starting from passive systems, moving to indoor space conditioning and thermal energy production active systems and ending with the lighting system and the rest consumptions. Once the potential energy saving measures have been investigated, the electricity production plants are examined and dimensioned on the basis of the remaining electricity consumption. The BEMS is designed lastly, in order to control and supervise the operation and the performance of all the introduced active systems.
Another crucial point is the selection of the most appropriate active technologies for energy saving and production. In the specific case, for example, the availability of high solar radiation imposed the utilization of solar collectors and photovoltaic panels. The significant biomass potential in the island of Crete also led to the introduction of a biomass heater, while the considerable cooling loads and the vicinity of the Stadium with the coastline implied the installation of an open loop geothermal system. These systems constitute without doubt the optimum selection for this specific application. However, for a different facility at a different location, the above systems may not be applicable. The conclusion is that, in any case, the consultants should seek for the most economically and technically feasible interventions, imposed by the locally met conditions and, of course, the type and size of the existing energy loads. Generally, we could claim that the presented case study constitutes a representative application for the Mediterranean islands and for locations with similar climate conditions, significant biomass potential, perhaps from agricultural by-products, availability of aquifer, etc.
Finally, the demonstrative attitude of the overall proposed project is of considerable importance too. Taking into account the number of daily users and visitors in the Stadium, the proposed project aims at the promotion of the rational use of energy concept, through the demonstration of the introduced measures. To this end, special actions have been also proposed, such as demonstrative screens located in strategically selected points along the Stadium presenting the current energy production and consumption and relevant statistical data, school or academic educational visits, etc. In this way, the authors anticipate that this work will contribute to the cultivation of an “energy friendly education” for the next generations on the island.

Author Contributions

Conceptualization, D.A.K. and S.K.; methodology, D.A.K., G.Z., Y.Y. and N.P.; software, D.A.K. and G.Z.; validation, D.A.K., Y.Y. and S.K.; formal analysis, Y.Y.; investigation, D.A.K. and Y.Y.; resources, I.D., G.Z. and Y.Y.; data curation, I.D.; writing—original draft preparation, D.A.K.; writing—review and editing, D.A.K.; visualization, D.A.K.; supervision, D.A.K. and S.K.; project administration, D.A.K.

Funding

This research was funded by the Municipality of Heraklion, under a relevant contract with the Technological Educational Institute of Crete, Department of Mechanical Engineering, Wind Energy and Power Plants Synthesis Laboratory.

Acknowledgments

The authors of this study gratefully acknowledge the assistance and the contribution of: the Municipal Council of the Municipality of Heraklion, Crete, for the assignment and the funding of this research, especially the Vice Mayors Yiannis Anastasakis and Kostas Vardavas; the Technical Service and the Management of the Pancretan Stadium for the high quality and effective support of the research team on the required data gathering and on the understanding of the existing infrastructure in the Stadium, especially Tsirakos Dimitris, Konidakis Dimitris and Kalogerakis Vasilis; the Technical Service of the Municipality of Heraklion for the administrative support of the project, especially Albantakis Dimitris. Deligiorgis Christos, from the company Alumil S.A., for the design of the p/v panels foundation; Karoubis Pavlos, for the accomplishment of the new lighting system study of the main and the auxiliary stadiums; Michopoulos Apostolos, for his contribution on the computational simulation of the geothermal system; and Mrs Flabouri Urania, for the design and the technical configuration of the new BEMS.

Conflicts of Interest

The authors declare no conflict of interest.

References

  1. Artuso, P.; Santiangeli, A. Energy solutions for sports facilities. Int. J. Hydrogen Energy 2008, 33, 3182–3187. [Google Scholar] [CrossRef]
  2. Marinopoulos, I.S.; Katsifarakis, K.L. Optimization of Energy and Water Management of Swimming Pools. A Case Study in Thessaloniki, Greece. Procedia Environ. Sci. 2017, 38, 773–780. [Google Scholar] [CrossRef]
  3. Katsaprakakis, D.A. Comparison of swimming pools alternative passive and active heating systems based on renewable energy sources in Southern Europe. Energy 2015, 81, 738–753. [Google Scholar] [CrossRef]
  4. Gao, J.; Li, A.; Xu, X.; Gang, W.; Yan, T. Ground heat exchangers: Applications, technology integration and potentials for zero energy buildings. Renew. Energy 2018, 128, 337–349. [Google Scholar] [CrossRef]
  5. Molavi, J.; McDaniel, J. A Review of the Benefits of Geothermal Heat Pump Systems in Retail Buildings. Procedia Eng. 2016, 145, 1135–1143. [Google Scholar] [CrossRef]
  6. Lee, J.U.; Kim, T.; Leigh, S.B. Applications of building-integrated coil-type ground-coupled heat exchangers—Comparison of performances of vertical and horizontal installations. Energy Build. 2015, 93, 99–109. [Google Scholar] [CrossRef]
  7. Wang, D.; Lu, L.; Ping, C. A new analytical solution for horizontal geothermal heat exchangers with vertical spiral coils. Int. J. Heat Mass Transf. 2016, 100, 111–120. [Google Scholar] [CrossRef]
  8. Selamat, S.; Miyara, A.; Kariya, K. Numerical study of horizontal ground heat exchangers for design optimization. Renew. Energy 2016, 95, 561–573. [Google Scholar] [CrossRef]
  9. Jalili, P.; Ganji, D.D.; Nourazar, S.S. Hybrid semi analytical method for geothermal U shaped heat exchanger. Case Stud. Therm. Eng. 2018, 12, 578–586. [Google Scholar] [CrossRef]
  10. Fernández, M.; Eguía, P.; Granada, E.; Febrero, L. Sensitivity analysis of a vertical geothermal heat exchanger dynamic simulation: Calibration and error determination. Geothermics 2017, 70, 249–259. [Google Scholar] [CrossRef]
  11. Song, X.; Wang, G.; Shi, Y.; Zheng, R.; Li, J. Numerical Analysis on Thermal Characteristics of an Open Loop Geothermal System in a Single Well. Energy Procedia 2017, 158, 6112–6117. [Google Scholar] [CrossRef]
  12. Aresti, L.; Christodoulides, P.; Florides, G. A review of the design aspects of ground heat exchangers. Renew. Sustain. Energy Rev. 2018, 92, 757–773. [Google Scholar] [CrossRef]
  13. Murugan, S.; Horák, B. A review of micro combined heat and power systems for residential applications. Renew. Sustain. Energy Rev. 2016, 64, 144–162. [Google Scholar] [CrossRef]
  14. Huang, Y.; McIlveen-Wright, D.R.; Rezvani, S.; Huang, M.J.; Wang, Y.D.; Roskilly, A.P.; Hewitt, N.J. Comparative techno-economic analysis of biomass fuelled combined heat and power for commercial buildings. Appl. Energy 2013, 112, 518–525. [Google Scholar] [CrossRef]
  15. Ito, H. Economic and environmental assessment of residential micro combined heat and power system application in Japan. Int. J. Hydrogen Energy 2016, 41, 15111–15123. [Google Scholar] [CrossRef]
  16. Pirkandi, J.; Jokar, M.A.; Sameti, M.; Kasaeian, A.; Kasaeian, F. Simulation and multi-objective optimization of a combined heat and power (CHP) system integrated with low-energy buildings. J. Build. Eng. 2016, 5, 13–23. [Google Scholar] [CrossRef]
  17. Li, D.; Xu, X.; Yu, D.; Dong, M.; Liu, H. Rule Based Coordinated Control of Domestic Combined Micro-CHP and Energy Storage System for Optimal Daily Cost. Appl. Sci. 2018, 8, 8. [Google Scholar] [CrossRef]
  18. Ruan, Y.; Liu, O.; Li, Z.; Wu, J. Optimization and analysis of Building Combined Cooling, Heating and Power (BCHP) plants with chilled ice thermal storage system. Appl. Energy 2016, 179, 738–754. [Google Scholar] [CrossRef]
  19. Gu, Q.; Ren, H.; Gao, W.; Ren, J. Integrated assessment of combined cooling heating and power systems under different design and management options for residential buildings in Shanghai. Energy Build. 2012, 51, 143–152. [Google Scholar] [CrossRef]
  20. Martínez-Lera, S.; Ballester, J. A novel method for the design of CHCP (combined heat, cooling and power) systems for buildings. Energy 2010, 35, 2972–2984. [Google Scholar] [CrossRef]
  21. Kyriaki, E.; Drosou, V.; Papadopoulos, A.M. Solar Thermal Systems for Low Energy Hotel Buildings: State of The Art, Perspectives and Challenges. Energy Procedia 2015, 78, 1968–1973. [Google Scholar] [CrossRef]
  22. Chwieduk, D. Chapter 7 - Active Solar Systems in Buildings. Sol. Energy Build. 2014, 289–351. [Google Scholar]
  23. Henning, H.M.; Döll, J. Solar Systems for Heating and Cooling of Buildings. Energy Procedia 2012, 30, 633–653. [Google Scholar] [CrossRef]
  24. Katsaprakakis, D.A. Introducing a solar-combi system for hot water production and swimming pools heating in the Pancretan Stadium, Crete, Greece. In Proceedings of the Applied Energy Symposium and Forum, Renewable Energy Integration with Mini/Microgrids, REM 2018, Rhodes, Greece, 29–30 September 2018. [Google Scholar]
  25. Tsalikis, G.; Martinopoulos, G. Solar energy systems potential for nearly net zero energy residential buildings. Sol. Energy 2015, 115, 743–756. [Google Scholar] [CrossRef]
  26. Glembin, J.; Haselhorst, T.; Steinweg, J.; Rockendorf, G. Simulation and Evaluation of Solar Thermal Combi Systems with Direct Integration of Solar Heat into the Space Heating Loop. Energy Procedia 2016, 91, 450–459. [Google Scholar] [CrossRef]
  27. Drosou, V.; Kosmopoulos, P.; Papadopoulos, A. Solar cooling system using concentrating collectors for office buildings: A case study for Greece. Renew. Energy 2016, 97, 697–708. [Google Scholar] [CrossRef]
  28. Chamkha, A.J.; Selimefendigil, F. Numerical Analysis for Thermal Performance of a Photovoltaic Thermal Solar Collector with SiO2-Water Nanofluid. Appl. Sci. 2018, 8, 2223. [Google Scholar] [CrossRef]
  29. Good, C.; Andresen, I.; Hestnes, A.G. Solar energy for net zero energy buildings—A comparison between solar thermal, PV and photovoltaic–thermal (PV/T) systems. Sol. Energy 2015, 122, 986–996. [Google Scholar] [CrossRef]
  30. Ciampi, G.; Rosato, A.; Scorpio, M.; Sibilio, S. Retrofitting Solutions for Energy Saving in a Historical Building Lighting System. Energy Procedia 2015, 78, 2669–2674. [Google Scholar] [CrossRef]
  31. Boutet, M.L.; Hernández, A.L.; Jacobo, G.J. Thermo—Lighting optimization proposal for school buildings in subtropical hot–humid climates: Monitoring and computer simulation on autumn period. Energy Build. 2016, 128, 785–797. [Google Scholar] [CrossRef]
  32. Zhou, X.; Yan, D.; Hong, T.; Ren, X. Data analysis and stochastic modeling of lighting energy use in large office buildings in China. Energy Build. 2015, 86, 275–287. [Google Scholar] [CrossRef]
  33. Asif ul Haq, M.; Hassan, M.Y.; Abdullah, H.; Rahman, H.A.; Abdullah, M.P.; Hussin, F.; Said, D.M. A review on lighting control technologies in commercial buildings, their performance and affecting factors. Renew. Sustain. Energy Rev. 2014, 33, 268–279. [Google Scholar]
  34. Labeodan, T.; Bakker, C.; Rosemann, A.; Zeiler, W. On the application of wireless sensors and actuators network in existing buildings for occupancy detection and occupancy-driven lighting control. Energy Build. 2016, 127, 75–83. [Google Scholar] [CrossRef]
  35. Fathabadi, H. Ultra high benefits system for electric energy saving and management of lighting energy in buildings. Energy Convers. Manag. 2014, 80, 543–549. [Google Scholar] [CrossRef]
  36. Mauser, I.; Müller, J.; Allerding, F.; Schmeck, H. Adaptive building energy management with multiple commodities and flexible evolutionary optimization. Renew. Energy 2016, 87, 911–921. [Google Scholar] [CrossRef]
  37. Sharma, I.; Dong, J.; Malikopoulos, A.A.; Street, M.; Ostrowski, J.; Kuruganti, T.; Jackson, R. A modeling framework for optimal energy management of a residential building. Energy Build. 2016, 130, 55–63. [Google Scholar] [CrossRef]
  38. Sehar, F.; Pipattanasomporn, M.; Rahman, S. Integrated automation for optimal demand management in commercial buildings considering occupant comfort. Sustain. Cities Soc. 2017, 28, 16–29. [Google Scholar] [CrossRef]
  39. Wang, Y.; Wang, B.; Chu, C.C.; Pota, H.; Gadh, R. Energy management for a commercial building microgrid with stationary and mobile battery storage. Energy Build. 2016, 116, 141–150. [Google Scholar] [CrossRef]
  40. Chabaud, A.; Eynard, J.; Grieu, S. A new approach to energy resources management in a grid-connected building equipped with energy production and storage systems: A case study in the south of France. Energy Build. 2015, 99, 9–31. [Google Scholar] [CrossRef]
  41. Omrany, H.; Ghaffarianhoseini, A.; Ghaffarianhoseini, A.; Raahemifar, K.; Tookey, J. Application of passive wall systems for improving the energy efficiency in buildings: A comprehensive review. Renew. Sustain. Energy Rev. 2016, 62, 1252–1269. [Google Scholar] [CrossRef]
  42. Soutullo, S.; Sánchez, M.N.; Enríquez, R.; Olmedo, R.; Jiménez, M.J.; Heras, M.R. Comparative thermal study between conventional and bioclimatic office buildings. Build. Environ. 2016, 105, 95–103. [Google Scholar] [CrossRef]
  43. Dan, D.; Tanasa, C.; Stoian, V.; Brata, S.; Stoian, D.; Gyorgy, T.N.; Florut, S.C. Passive house design—An efficient solution for residential buildings in Romania. Energy Sustain. Dev. 2016, 32, 99–109. [Google Scholar] [CrossRef]
  44. Ortiz, J.; Fonseca, A.; Salom, J.; Garrido, N.; Fonseca, P.; Russo, V. Comfort and economic criteria for selecting passive measures for the energy refurbishment of residential buildings in Catalonia. Energy Build. 2016, 110, 195–210. [Google Scholar] [CrossRef]
  45. Rehman, H.U. Experimental performance evaluation of solid concrete and dry insulation materials for passive buildings in hot and humid climatic conditions. Appl. Energy 2016, 2, 1585–1594. [Google Scholar] [CrossRef]
  46. Rackes, A.; Melo, A.P.; Lamberts, R. Naturally comfortable and sustainable: Informed design guidance and performance labeling for passive commercial buildings in hot climates. Appl. Energy 2016, 174, 256–274. [Google Scholar] [CrossRef]
  47. Soares, N.; Costa, J.J.; Gaspar, A.R.; Santos, P. Review of passive PCM latent heat thermal energy storage systems towards buildings’ energy efficiency. Energy Build. 2013, 59, 82–103. [Google Scholar] [CrossRef]
  48. Marin, P.; Saffari, M.; Gracia, A.; Zhu, X.; Farid, M.M.; Cabeza, L.F.; Ushak, S. Energy savings due to the use of PCM for relocatable lightweight buildings passive heating and cooling in different weather conditions. Energy Build. 2016, 129, 274–283. [Google Scholar] [CrossRef]
  49. Park, B.; Krarti, M. Energy performance analysis of variable reflectivity envelope systems for commercial buildings. Energy Build. 2016, 124, 88–98. [Google Scholar] [CrossRef]
  50. Malet-Damour, B.; Guichard, S.; Bigot, D.; Boyer, H. Study of tubular daylight guide systems in buildings: Experimentation, modelling and validation. Energy Build. 2016, 129, 308–321. [Google Scholar] [CrossRef]
  51. Hellenic Centre of Marine Research. Available online: http://www.hcmr.gr/en/ (accessed on 5 March 2019).
  52. 2009 ASHRAE Handbook—Fundamentals (SI Edition); American Society of Heating, Refrigerating and Air-Conditioning Engineers, Inc.: Atlanta, GA, USA, 2009.
  53. Directive on Buildings’ Energy Performance. Official Governmental Gazette 2367B’/12-7-2017. Available online: http://portal.tee.gr/portal/page/portal/SCIENTIFIC_WORK/GR_ENERGEIAS/kenak/files/TOTEE_20701-1_2017_TEE_1st_Edition.pdf (accessed on 5 March 2019).
  54. Kreider, J.; Rabl, A.; Curtiss, P. Heating and Cooling of Buildings, 3rd ed.; CRC Press: Boca Raton, FL, USA, 2017. [Google Scholar]
  55. Katsaprakakis, D.A.; Georgila, K.; Zidianakis, G.; Michopoulos, A.; Psarras, N.; Christakis, D.G.; Condaxakis, C.; Kanouras, S. Energy upgrading of buildings. A holistic approach for the Natural History Museum of Crete, Greece. Renew. Energy 2017, 114B, 1306–1332. [Google Scholar] [CrossRef]
  56. Katsaprakakis, D.A.; Zidianakis, G. Upgrading Energy Efficiency for School Buildings in Greece. Procedia Environ. Sci. 2017, 38, 248–255. [Google Scholar] [CrossRef]
  57. Duffie, J.A.; Beckman, W.A. Solar Engineering of Thermal Processes, 4th ed.; Wiley: New York, NY, USA, 2013. [Google Scholar]
  58. Rahman, A.; Srikumar, V.; Smith, A.D. Predicting electricity consumption for commercial and residential buildings using deep recurrent neural networks. Appl. Energy 2018, 212, 372–385. [Google Scholar] [CrossRef]
  59. UEFA Stadium Lighting Guide 2016. Available online: https://www.uefa.com/MultimediaFiles/Download/uefaorg/General/02/36/26/72/2362672_DOWNLOAD.pdf (accessed on 5 March 2019).
  60. IAAF Track and Field Facilities Manual 2008. Chapter 5: Lighting and Power. Available online: https://www.iaaf.org/about-iaaf/documents/technical (accessed on 5 March 2019).
  61. Katsaprakakis, D.A.; Papadakis, N.; Kozirakis, G.; Minadakis, Y.; Christakis, D.; Kondaxakis, K. Electricity supply on the island of Dia based on renewable energy sources (R.E.S.). Appl. Energy 2009, 86, 516–527. [Google Scholar] [CrossRef]
Figure 1. Implementation flow chart of the presented study.
Applsci 09 01544 g001
Figure 2. 3D representation of the Pancretan Stadium from the southeast.
Applsci 09 01544 g002
Figure 3. The annual time series of the (a) available incident solar radiation on horizontal plane and (b) the ambient temperature at the town of Heraklion.
Applsci 09 01544 g003
Figure 4. The involved in the calculation annual time series of the (a) wind velocity and (b) the seawater temperature.
Applsci 09 01544 g004
Figure 5. Electricity consumption annual fluctuation in Pancretan Stadium in the existing operation.
Applsci 09 01544 g005
Figure 6. The introduced Stadium’s profile in TRNSYS (a) and the computational calculation model (b) for the indoor space conditioning loads calculation.
Applsci 09 01544 g006
Figure 7. Typical fluctuation curves of (a) COP and (b) EER versus the ambient temperature, for the existing air-to-air heat pumps and the central cooling device, respectively.
Applsci 09 01544 g007
Figure 8. Annual time series of (a) the heating and cooling loads in the existing envelope’s condition and (b) the existing electricity consumption for heating and cooling loads coverage.
Applsci 09 01544 g008
Figure 9. Vertical hydraulic diagram of the one out of the two similar open loop geothermal systems.
Applsci 09 01544 g009
Figure 10. Typical fluctuation curves of (a) COP and (b) EER versus the seawater temperature, for the proposed geothermal heat pumps.
Applsci 09 01544 g010
Figure 11. Annual time series of (a) the heating and cooling loads with the integration of the proposed passive systems and (b) the corresponding electricity consumption from the Geothermal Heat Pumps (GHPs).
Applsci 09 01544 g011
Figure 12. (a) Daily profile of final thermal power demand and (b) annual time series of final thermal power demand for hot water production.
Applsci 09 01544 g012
Figure 13. Annual time series of (a) the heating loads and (b) electricity consumption for the swimming pools heating in the existing operation.
Applsci 09 01544 g013
Figure 14. Annual time series of (a) the swimming pools new heating loads, after the application of the proposed passive measure and (b) the total thermal power stored from the solar collectors in the thermal tanks.
Applsci 09 01544 g014
Figure 15. The solar collectors’ (a) connection layout and (b) siting.
Applsci 09 01544 g015
Figure 16. (a) Siting of the photovoltaic station on the main stadium’s western roof and (b) electricity production annual time series from the proposed PV plant.
Applsci 09 01544 g016
Table 1. Monthly summarized heating and cooling loads and the corresponding electricity consumption in the Pancretan Stadium with the existing envelope’s condition.
MonthFinal Thermal Energy (kWh)Electricity Consumption (kWh)Average Efficiency
HeatingCoolingHeatingCoolingCOPEER
January99,7360694602.01
February92,7350634502.05
March64,8430425002.14
April16,8270102602.30
May335019,19419183482.462.30
June082,464037,749 2.18
July0124,415058,722 2.12
August0124,495057,250 2.17
September066,566028,387 2.34
October302219,17718277492.322.47
November26,5140166402.23
December74,5130498602.09
Annual totals381,539436,31125,591198,2042.092.20
Heating & cooling total817,849223,795
Annual primary energy consumption (kWh)649,007
Table 2. Monthly summarized heating and cooling loads in the Pancretan Stadium with the realization of the proposed passive measures.
MonthFinal Thermal Power
Monthly Peaks (kW)
Final Thermal Energy (kWh)
HeatingCoolingHeatingCooling
January868082,5550
February804079,1510
March611055,4840
April231014,3070
May118266303916,953
June0522076,782
July06800116,308
August06400117,169
September0487064,369
October90207187519,751
November281020,6510
December646061,3130
Annual totals/max868680318,376411,332
Annual final thermal energy required for indoor space conditioning (kWh):729,708
Table 3. Monthly analysis of the heating and cooling loads with the realization of the proposed passive measures and the corresponding electricity consumption.
MonthFinal Thermal Energy (kWh)Electricity Consumption (kWh)GHP Average Efficiencies
HeatingCoolingHeatingCoolingCOPEER
January82,556014,36005.75
February79,151013,97805.66
March55,4840982205.65
April14,3070251105.70
May303916,95353324225.717.00
June076,782010,999 6.98
July0116,308017,437 6.67
August0117,169017,854 6.56
September064,36909719 6.62
October187519,75130332116.186.15
November20,6510332906.20
December61,313010,26505.97
Annual totals318,376411,33255,10161,6425.786.67
Heating & cooling total729,708116,743
Annual primary energy consumption (kWh)338,554
Table 4. Summary of energy savings in total for the proposed both passive and active measures for hot water production and swimming pools heating.
Energy SourceExisting OperationProposed OperationPES
HWPSPHTotalPE (kWh)HWPSPHTotalPE (kWh)kWh(%)
Thermal energy (kWh)261,015112,216373,231-261,01554,620315,635-57,59615
Oil (L)16,500016,500186,0590000186,059100
Electricity (kWh)139,43652,198191,634555,7390000555,739100
Biomass (tn)000020.60910.58831.197180,691−180,691-
Solar collectors (kWh)0000169,7000169,7000--
741,798 180,691618,70383
Table 5. Summary of the annual saving results achieved with the proposed interventions on the lighting system.
Lighting AreaAnnual Electricity Consumption (kWh)Annual Primary Energy Consumption (kWh)Energy Saving (%)
Existing StateProposed StateExisting StateProposed StateElectricity (kWh)Primary Energy (kWh)Percentage (%)
Indoor spaces433,232164,9581,256,374478,379268,274777,99561.92
Outdoor surrounding spaces123,49475,027358,134217,57748,468140,55739.25
Main stadium-daily usage65,49438,770189,932112,43426,72377,49840.80
Main stadium-sports events35,34330,459102,49588,330488414,16413.82
Auxiliary stadium24,47016,19070,96446,950828024,01333.84
Total682,034325,4041,977,898943,671356,6301,034,22852.29
Table 6. Total annual electricity consumption savings with the introduced passive and active systems.
InterventionAnnual Electricity Saving (kWh)
Lighting356,630
Hot water production139,436
Swimming pools heating52,198
Passive and active measures for indoor spaces conditioning107,052
Building energy management system (BEMS)181,696
Total annual energy saving:837,012
Existing annual electricity consumption (kWh)1,889,198
New annual electricity consumption (kWh)1,052,186
Table 7. Primary energy consumption in the existing operation state of the Pancretan Stadium.
Energy SourceExisting StatePrimary Energy
Active electricity annual consumption (kWh)1,889,1985,478,674
Reactive electricity annual consumption (kWh)388,4071,126,380
Diesel oil (L)16,500186,059
Primary energy annual consumption (kWh)6,791,114
Primary energy specific annual consumption (kWh/m2)429.54
Table 8. Energy savings and production from R.E.S. summarizing results.
InterventionEnergy Source Production–Saving–ConsumptionPrimary Energy Production–Saving–Consumption (kWh)
Photovoltaic station932,711 kWh electricity production2,704,862
Lighting system356,630 kWh electricity saving1,034,228
Hot water production16,500 lt diesel oil saving186,059
139,436 kWh electricity saving404,366
20,609 kg biomass consumption−119,365
Swimming pools heating52,198 kWh electricity saving151,373
10,588 kg biomass consumption−61,326
Passive and active measures for air conditioning107,052 kWh electricity saving310,452
BEMS181,696 kWh electricity saving526,917
Reduction of reactive consumptions163,978 kWh electricity saving475,536
Primary energy total annual saving:5,613,102
Primary energy remaining annual consumption:1,178,012
Table 9. Set-up cost comprehensive analysis of the overall examined project.
NoCost ComponentSubtotal (€)
1Photovoltaic station750,000
2Lighting system upgrade400,000
3BEMS150,000
4Biomass heater45,000
5Solar collectors and thermal tanks200,000
6Geothermal system600,000
7Openings replacement120,000
Subtotal2,265,000
8Contractor’s fee 18%407,700
Total2,672,700
Table 10. Reduction on the energy resources annual procurement cost, due to the proposed energy upgrade measures.
Energy ResourceExisting Operation StateProposed Operation StateAnnual Monetary Saving (€)
QuantityCost (€)QuantityCost (€)
Electricity (kWh)1,889,198241,389119,47515,257226,132
Diesel oil (L)16,50013,2000013,200
Biomass (tn)0031.1979359−9359
Totals:254,58988,396229,973
Table 11. R.E.S. production annual penetration percentage calculation.
Production TechnologyPrimary Energy Production (kWh)
Photovoltaic station2,704,862
Biomass180,691
Solar collectors305,394
Total production3,190,947
Annual primary energy consumption3,882,875
R.E.S. annual penetration percentage (%):82.18
Table 12. Analysis of the annual reduction on the CO2 emission.
Energy SourceExisting OperationNew OperationCO2 Saving
Primary Energy Consumption (kWh)CO2 Emissions (tn)Primary Energy Consumption (kWh)CO2 Emissions (tn)(tn)(%)
Active electricity consumption5,478,6745418346,478343507693.68
Reactive electricity consumption1,126,3801114650,84464447042.22
Total electricity consumption6,605,0556532997,322986554684.90
Oil diesel consumption186,0591840184184100.00
Totals6,791,1146716997,322986573085.31

