Article

Analysis of the Weights of Service Quality Indicators for Drone Filming and Photography by the Fuzzy Analytic Network Process

1
Ph.D. Program in Business and Operations Management, Chang Jung Christian University, Tainan 71101, Taiwan
2
Department of Computer Science and Information Engineering, Chang Jung Christian University, Tainan 71101, Taiwan
*
Author to whom correspondence should be addressed.
Appl. Sci. 2019, 9(6), 1236; https://doi.org/10.3390/app9061236
Submission received: 2 February 2019 / Revised: 12 March 2019 / Accepted: 20 March 2019 / Published: 24 March 2019
(This article belongs to the Special Issue Applied Sciences Based on and Related to Computer and Control)

Abstract

:
The service of drone filming and photography has been getting more and more popular. However, the service provider does not have enough information about service quality indicators and its weights. Analyzing the weights of service quality indicators by the Fuzzy Analytic Network Process (FANP) combined with Similarity Aggregation Method (SAM) is an important research topic. Therefore, in order to solve this real life problem, based on the SERVQUAL scale, this research analyzes the weights and the rankings from a comprehensive consensus by FANP combined with geometric mean and SAM, and then compares the differences between them. The results reveal that both the comprehensive consensus of experts’ opinions deemed that the most important dimension and indicator are reliability and “Employees are professional and get adequate support to do their jobs well.” The 2nd to 4th indicators from a comprehensive consensus of experts’ opinions are the same but the order is different. They are: “Drone service team’s employees give custom personal attention,” “Drone service team has up-to-date equipment,” and “Drone service team provides service legally, safely, and reliably.” The findings of the research reveal the weights of dimensions and indicators and help us to keep good service quality of filming and photography by drone.

1. Introduction

Dynamic Remotely Operated Navigation Equipment (Drone) is the aircraft that can fly without humans onboard. It is also known as Unmanned Aircraft Systems (UAS) or Unmanned Aircraft Vehicle (UAV). Currently, the technology of the drone is well developed and has many applications. The service of drone filming and photography is getting more and more popular, but the service provider does not have any information about how to keep the service quality at a high level. The aim of this research is acquiring the knowledge of the service quality indicators’ weights from experienced experts precisely. In order to archive this purpose, this research discusses the SERVQUAL scale, multiple criteria decision-making (MCDM), and key publications that are related to those fields after reviewing the development and research of the drone and defines the purposes at the end of this section.
At the beginning, the research of the drone focused on fixed-wing aircraft and on military applications. Since 2012, there were many scholars and institutions researching the multi-rotor drone and promoted the development of its technology [1]. Currently, the drone is very popular and has many applications with various devices attaching to it. Therefore, there are more and more research studies being done by multi-rotor drones. For example, Turner et al. [2] measured and monitored the shoreline in Australia by multi-rotor drones attached with cameras for two years. Bulgakov et al. [3] proposed a study to build 3D models from aerial photos taken by multi-rotor drones automatically. In addition to the application of drones with the optical camera, Nishar et al. [4] researched geothermal environments with drones integrated with thermal sensors. Lin et al. [5] proposed a method to evaluate the efficiency of the solar panel by multi-rotor drones with an infrared sensor. Na and Baek [6] proposed an impedance-based non-destructive testing method combined with drones for structural health monitoring of civil infrastructures. In a real file, the application of film production or aerial photography by drones integrated with an optical camera is the most popular. Currently, there are many clips of television programs filmed by drone. The demand of drone filming and photography to record outdoor activities from organizers that do not have equipment and pilots promote the development of this newly service—drone filming and photography.
However, when the technology of filming and photography by drone is mutual, unfortunately, the research about service quality is insufficient and has become a significant research gap. Most service providers do not realize that their service can or cannot satisfy the consumer. They do not have enough information about the indicators and its weights of service quality either. Therefore, in order to solve this real life problem and fill the research gap, analyzing the weight of service quality indicators for drone filming and photography more precisely is needed.
As for the measurement of service quality, Parasuraman et al. [7,8] proposed the SERVQUAL scale and many scholars have confirmed that it has high reliability and validity [9,10,11,12,13]. SERVQUAL has become a tool for measuring the quality of service [14]. There are five dimensions and 22 indicators of SERVQUAL. The five dimensions and their connotations are described using the following [15].
  • Tangibility: physical facilities, equipment, and appearance of personnel.
  • Reliability: ability to perform the promised service reliably and accurately.
  • Responsiveness: willingness to help customers and provide prompt service.
  • Assurance: knowledge and courtesy of employees and their ability to inspire trust and confidence.
  • Empathy: caring, individualized attention provided to customers.
In order to analyze the weight of indicators and dimensions of SERVQUAL for a particular service, one of the MCDM must be selected. The main purpose of MCDM is to select the most important alternative, which is signified as the best overall value by joining the evaluation criteria values and weights to evaluation characteristics [16,17]. The purpose of MCDM in this research is not to select the alternative but to acquire the weights of criteria (indicators). The command methods of MCDM include: technique for order preference by similarity to ideal solution (TOPSIS), simple additive weighting (SAW), analytic hierarchy process (AHP), and the Analytic Network Process (ANP). Among these methods, the research steps of AHP and ANP can be divided into four steps: constructing the hierarchical structure, comparing the criteria, analyzing the weight of criteria, and then ranking the alternatives. Ziemba (2019) analyzed the weights of criteria of a decision problem that consists of selecting the location and design of a wind farm by means of the ANP method with the considered cluster of alternatives and without it and demonstrates that taking into consideration the cluster of alternatives in the decision model influences the result of criteria weights [18]. In the cases of research problems without ranking the alternatives, AHP and ANP are widely used to analyze the weights of indicators [19,20,21,22,23].
The AHP is proposed by Saaty [24] and the ANP is extended from AHP [25]. The AHP method only takes into account hierarchical dependencies between criteria and sub-criteria but ANP also considers the external dependency, internal correlation between criteria, and the feedback relationship of the cluster. Therefore, the ANP can construct a much more complex model than AHP but the complex model produces a much larger number of questions of the questionnaire [26]. Unlike the predefined weights of criteria shared evenly from the cluster in AHP, ANP predefines the weights, according to the situation of dependency and the final weights of criteria (sub-criteria) that change significantly with reference to predefined values. The effect of weight changes takes place in the case of sub-criteria, which are not mutually dependent on each other. In general, the weight of a sub-criterion, which other sub-criteria influence is increasing. Consequently, the weight of another sub-criteria in a given cluster is decreasing [18].
Although AHP and ANP have been developed and widely used, they still suffer from some theoretical disputes and have weaknesses. The weaknesses including: the rank reversal problem, the priorities derivation method, and the comparison scale [27]. The rank reversal problem and priorities derivation method refer to the preferences aggregation method used in the AHP/ANP. The rankings of alternatives and criteria obtained by using the right and left eigenvector methods for preferences aggregation from pairwise comparison matrices may be rendered differently. As for the comparison scale, several scales have been proposed. The choice of the “best” scale is a very heated debate. Some scientists argue that the choice depends on the person and the decision problem [26]. According to the advantages of ANP and the high reliability and validity of the SERVQUAL scale, even in recent years, there are many scholars doing research by ANP combined with SERVQUAL. For example, Chen [28] analyzed the guidelines of airline service quality by the Decision Making Trial and Evaluation Laboratory (DEMATEL) and ANP. Ashouri [29] researched the mobile phone service quality guidelines and customer satisfaction by ANP. Some scholars further integrated ANP with other research methods to propose new models. Jin et al. [30] proposed a multi-criteria temporary facility layout-planning model, which effectively transforms the spatial layout-planning problem into a mathematical decision problem by integrating ANP and simulation-based sensitivity evaluation.
Sometimes, in order to gather the information from the questionnaire precisely, the Fuzzy Analytic Network Process (FANP) is applied by integrating the fuzzy theory and ANP. Professor Zadeh, who is an automatic control expert at the University of California USA, first developed the fuzzy theory [31]. Zadeh made the fuzzy theory more mature by applying the fuzzy set in the probability theory in 1978. The fuzzy theory describes the fuzzy phenomenon in real life with precise mathematical language. As for the traditional questionnaire, respondents can only choose a number. If the respondent’s feeling is an interval, they may answer distortedly and the researcher cannot gather the data correctly. In recent years, some researchers combined the ANP with the Fuzzy theory as FANP to solve this problem [32,33,34,35,36,37,38,39]. However, Satty holds a different perspective. He believes that Fuzzy AHP/ANP does not improve the outcome and should not be used because the intention of fuzzy perturbs the eigenvector in calculating processing by a small amount but not in a more valid direction [40]. In this research, in order to extract the consensus, the research method adopts FANP integrating with the similarity aggregation method (SAM) that is discussed below and de-fuzzification before the step of constructing pairwise comparison matrix.
Once the FANP is applied, there are more methods to integrate the results of an assessment from every respondent of a question. Usually, the method of geometric mean is used to have the comprehensive opinion of respondents. Besides the geometric mean, if the research needs to extract the consensus part of the opinion, SAM can be used. Zwick et al. [41] proposed a method for measuring similarity in the fuzzy theory. Hsu and Chen [42] cited and published the similarity aggregation method (SAM). The main concept is to use the intersection of two respondents’ fuzzy evaluation to represent the degree of identity (consensus). As for the measurement of consensus, Alcantud et al. proposed a model that generates a consistent decision in terms of the individual preferences and then measures the consensus that arises from it. The model reaches the consensus decision via the Borda and Copeland methods, and measures consensus via the Kemeny’s measure. Different from the method of measuring the consensus of SAM, the Kemeny’s measure calculates the agreement between the individuals’ preferences and the final decision, but the SAM calculates the agreement between each expert [43]. Some research studies analyze the consensus opinion of respondents by SAM even though the method is much more complex than the geometric mean. Wang et al. [44] researched the service quality criteria of long-term care institutions by integrating SERVQUAL, FAHP, and SAM. Hsu et al. [45] analyzed the selection of lubricant regeneration technology by FANP and SAM. As for the methods to integrate the results of the assessment, the geometric mean and SAM each have its own meaning, advantages, and disadvantages. Geometric mean is affected by extreme values but combines all expert opinions to represent a comprehensive opinion. SAM only extracts the intersection of expert opinions to represent the expert consensus and, thus, ignores the expert opinions that are far from reaching an agreement. Clearly, if more experts hold different opinions, the research results by FANP with geometric mean will be different from the result with SAM. Integrating opinions is an important key research step that affects the results of FANP. However, the research studies by FANP mentioned above integrated the results of assessment from every respondent only by one method.
In recent years, some other methods of decision-making are proposed. Fatimah et al. (2018) proposed three decision-making procedures for N-soft sets. The first two procedures rank the alternatives by giving the criteria weights and then calculate their extended choice values (ECVs) or extended weight choice values (EWCVs), respectively. The third procedure ranks the alternatives by giving the criteria weights and a threshold. These three methods are flexible because the user can give weights and the threshold individually. However, it is, therefore, different from the purpose of analyzing the weights in this research [46].
After that, Zhan et al. (2019) proposed two decision-making methods based on fuzzy rough set models integrating with the fuzzy TOPSIS method (two cases) and the fuzzy aggregation operator method. The first method ranks the alternatives by the principle of fuzzy TOPSIS that the alternative with the shorter distance from the positive ideal solution (PIS) and the longer distance from the negative ideal solution (NIS) has higher priority. The second method ranks the alternatives by calculating the virtual ideal decision-making object, the lower and upper approximations, the individual ranking function, and the group ranking function using the formula derived by authors [47]. The methods are innovative and the ranking results from those three methods have a high degree of consensus (the rankings are almost the same). This paper is important and valuable but FANP is adopted by this research in consideration of the purpose of acquiring the weight of indicators and the fact of indicators’ dependency.
Liu and Chen [1] established the service quality evaluation framework for drone filming and photography and acquired the weights and rankings of indicators by ANP, but not by FANP. The purpose of this research is focused on extracting knowledge of drone filming and photography’s service quality indicators and its weights from a set of experts’ opinions precisely. After reviewing the current state of the research field carefully and key publications, it is clear that the data collected from the questionnaire by FANP will be more realistic than ANP and the information analyzed from these data can further include the comprehensive consensus. Therefore, in order to measure the indicators’ weight for drone filming and photography service quality precisely and make an in—depth study on the experts’ opinions, unlike the research of FANP with one method of integrating opinions, this research adopts two methods to integrate expert opinions at the same time and discusses it. By the FANP variant adopted in this study, the following purposes are achieved.
  • Construct the drone filming and photography service quality evaluation structure based on the SERVQUAL scale.
  • Analysis weights of the dimensions and indicators of drone filming and photography service quality from the comprehensive experts’ viewpoint by FANP combined with a geometric mean.
  • Analysis weights of the dimensions and indicators of drone filming and photography service quality from the consensus of experts’ viewpoint by FANP combined with SAM.
  • Compare and discuss the difference of the indicators and dimension’s weight of drone filming and photography service between the comprehensive consensus of the experts’ viewpoint.

2. Materials and Methods

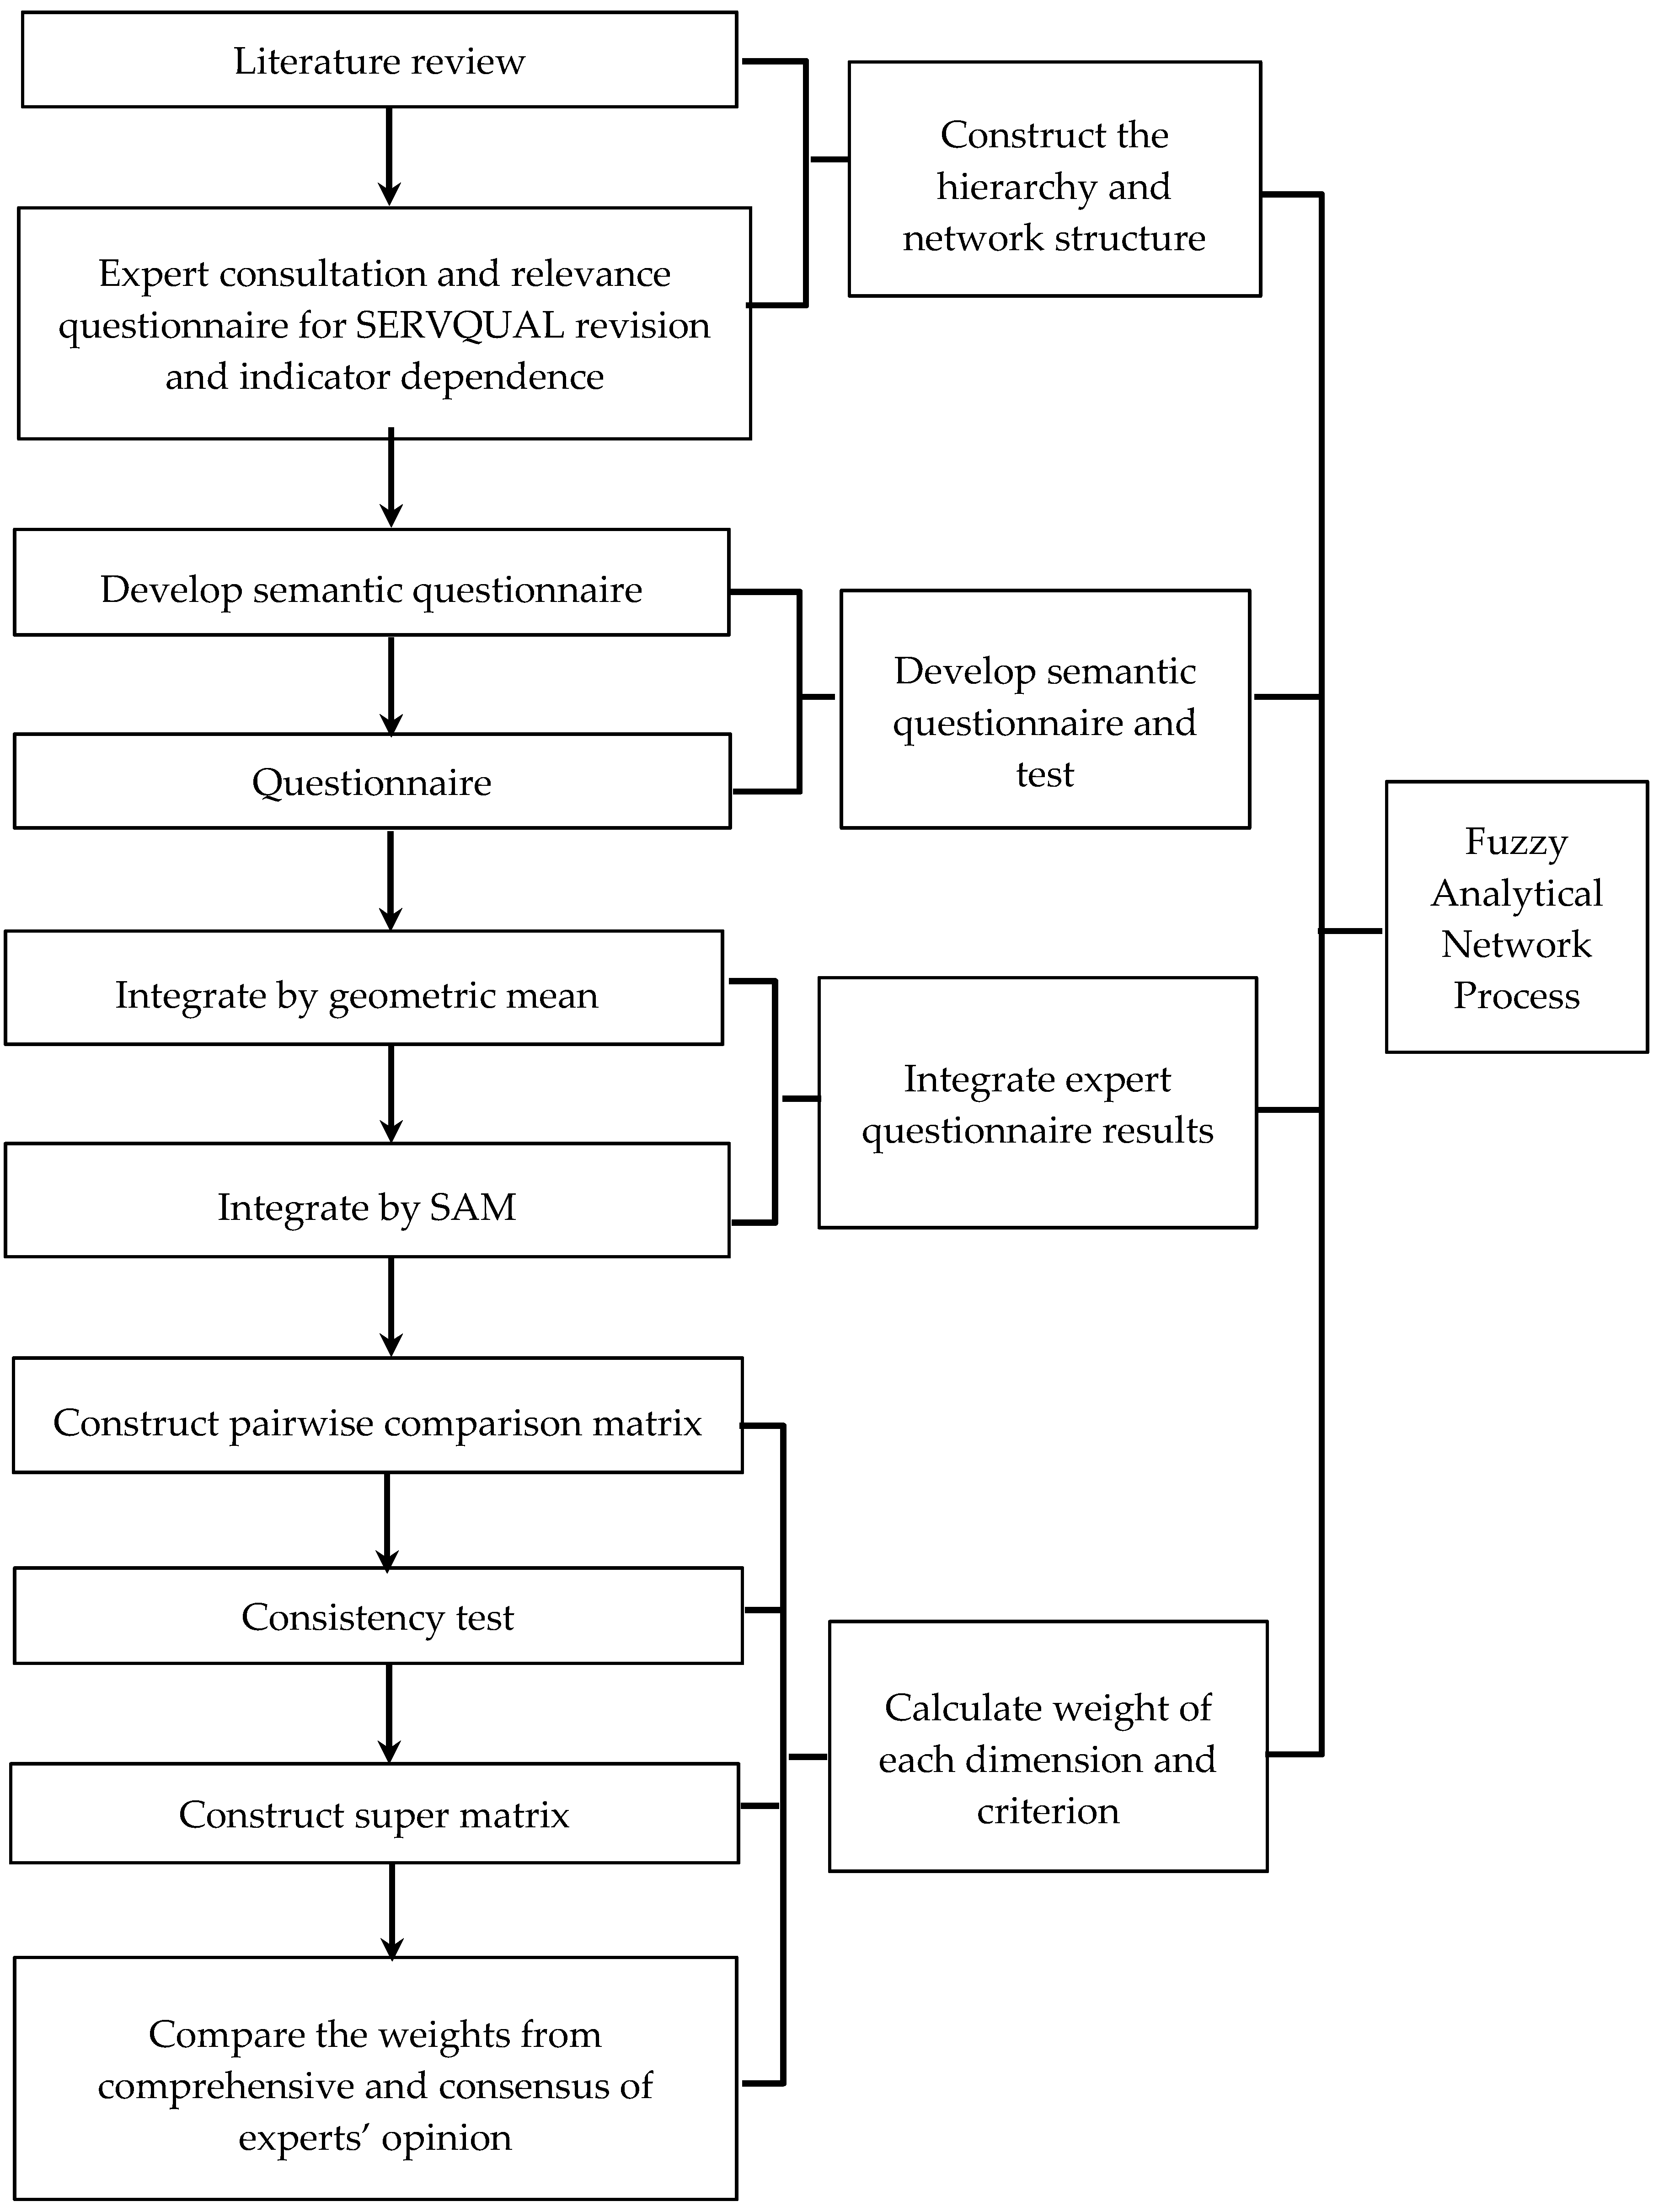
In order to analyze the service quality of the drone filming and photography, this research study analyzes the weights and the rankings from a comprehensive consensus by FANP combined with the geometric mean and SAM, and then compares the differences between them. The research method is shown in Figure 1. According to the method of FANP, the research steps can be divided into four main steps: construct the hierarchy and network structure, develop the semantic questionnaire and test, integrate expert questionnaire results, and calculate the weight of each dimension and criterion, as shown in the right side of Figure 1. Because this research adopts two methods to integrate expert opinions, the 3rd step (integrate expert questionnaire results) is divided into two parts: geometric mean and SAM. The final step is comparing the weights from a comprehensive opinion poll and a consensus of the experts’ opinions. Each step under the four major steps is shown in the left side of Figure 1 and described in the rest of this section.

2.1. Construct the Hierarchy and Network Structure

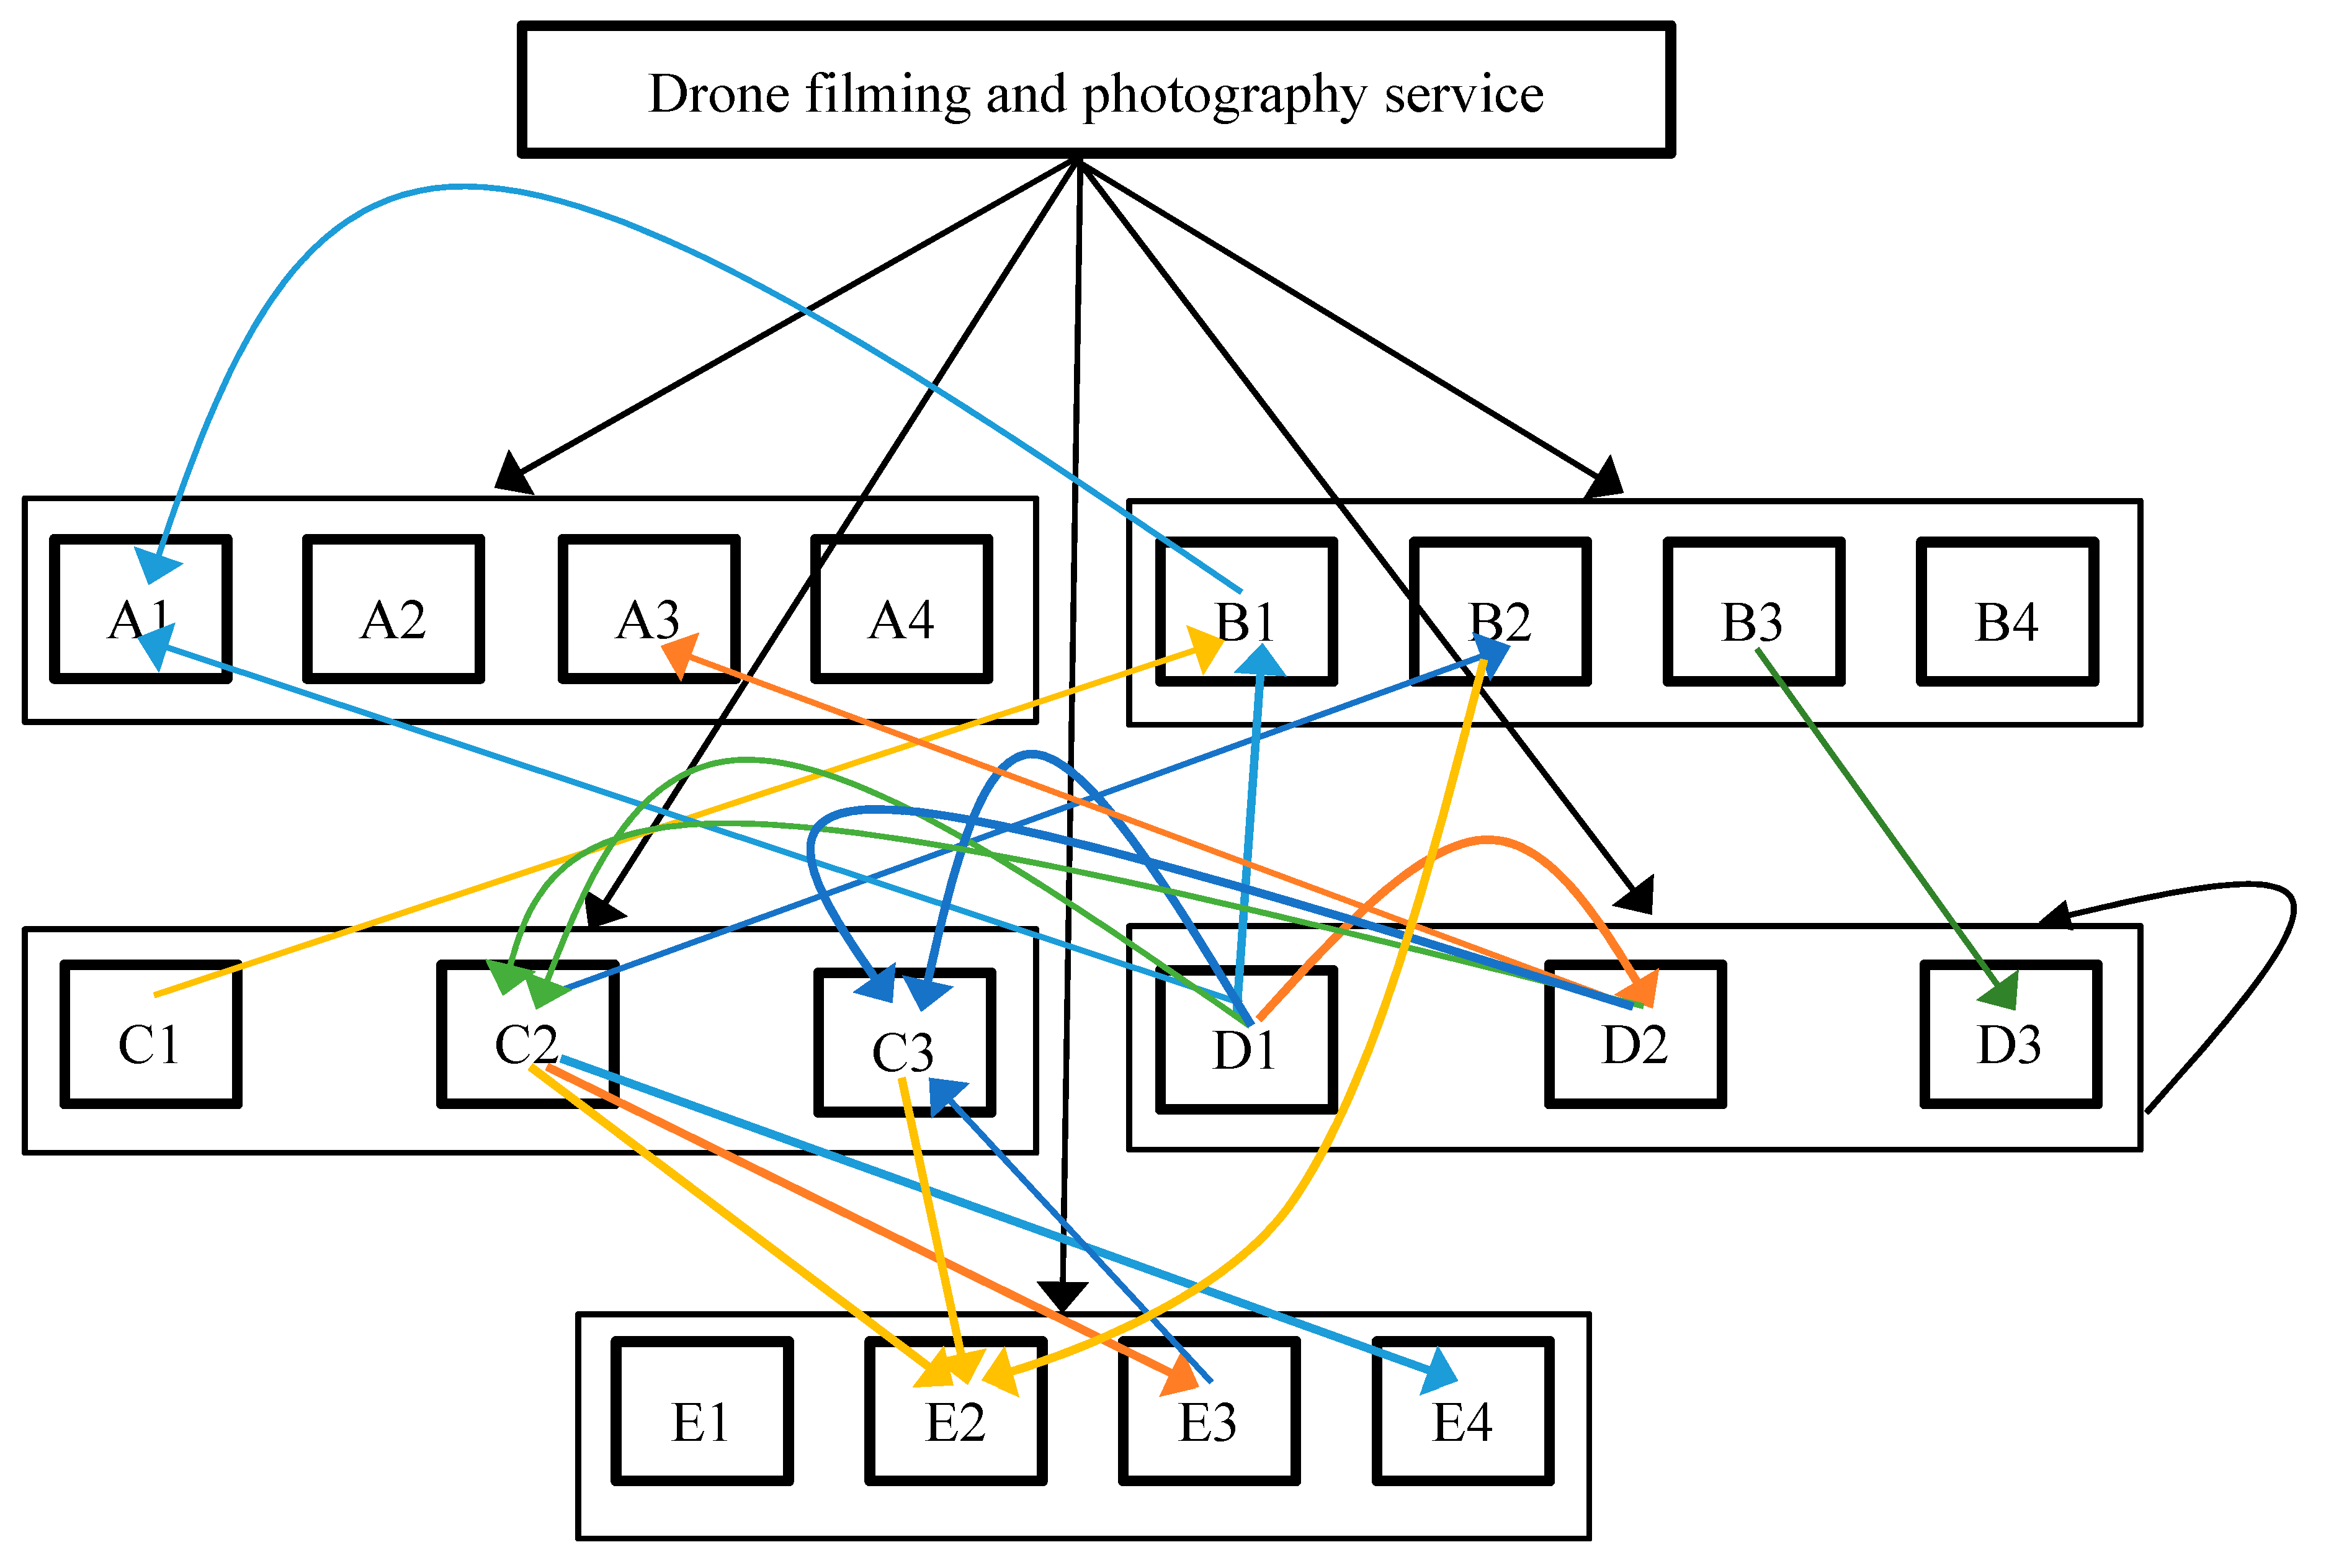
According to the research method of ANP, it is necessary to break down the problem into a number of evaluation indicators, grouping indicators to form a hierarchical structure, and then find out the relationship between them. According to the result of the literature review, this research constructs the hierarchical structure based on the SERVQUAL scale. Although the SERVQUAL scale has been widely used, since the drone service is an emerging industry, in order to make the statements of indicators meet the particularity of this service, this research rewrites the indicators, according to the result of expert consultation questionnaires and then constructs the hierarchical structure, according to the relevance questionnaire.

2.2. The Development of the Questionnaire

After constructing the hierarchy network, according to a method of ANP, it is necessary to develop a pair-wise comparison questionnaire. The ANP uses a nine-point evaluation scale to measure the relative importance of indicators, giving a weight from 1 to 9, respectively [48].
This research integrates fuzzy theory and assigns linguistic terms to fuzzy numbers to solve the problem that the respondents find difficult to answer regarding the approximate feelings in the heart with numbers. As for fuzzy numbers, the triangular fuzzy numbers and trapezoidal fuzzy numbers are used wildly. The triangular fuzzy number represents the highest degree of membership with the center point, and the most likely value of evaluation is the crisp value. The trapezoidal fuzzy number represents the highest degree of membership with the central interval and the most likely value of the evaluation is a range. The ANP measures an important indicator by the nine-point evaluation scale. Therefore, in order to evaluate the relative importance of the pairwise indicator, there are 17 linguistic terms. This research uses the triangle fuzzy number to represent the linguistic variables scale. The table of triangular fuzzy numbers, corresponding to linguistic terms, is shown in Table 1 [49].
Before the questionnaire, in addition to the pre-test, it is necessary to consider the “validity.” Questionnaire validity is divided into three categories: content validity, convergence validity, and discriminant validity. Based on the SERVQUAL scale, this research rewrites the statements by experts and keeps the original representation of dimensions and indicators. Therefore, it has high content validity [50].
In order to understand whether the meaning of the semantic questionnaire is clear and the time required, the research conducted a pre-test and rewrites the statements, according to the results of the pre-test.

2.3. Questionnaire

As for the number of the questionnaire, Parenté and Anderson-Parenté [51] suggested that there should be at least 10 or more experts. The questionnaire is applied to the drone filming and photography experts. At this stage, the purpose of sampling is to find experts who can evaluate the importance of service quality indicators.

2.4. Integrate Expert Questionnaire Results—Geometric Mean

After the questionnaires are filled, in this stage, the research first integrates the opinions of experts with a geometric mean. The triangular fuzzy number corresponding to the linguistic term selected by the experts was defuzzicated by the method of center of gravity. Then all expert opinions are integrated by geometric mean to obtain the comprehensive experts’ view.

2.5. Integrate Expert Questionnaire Results—Similarity Aggregation Method

In addition to analysis of the comprehensive experts’ view by geometric mean, this research analysis of the consensus by the similarity aggregation method (SAM), which is much more complicated than the geometric mean. The steps of SAM are as follows.

2.5.1. Calculate the Agreement Degree

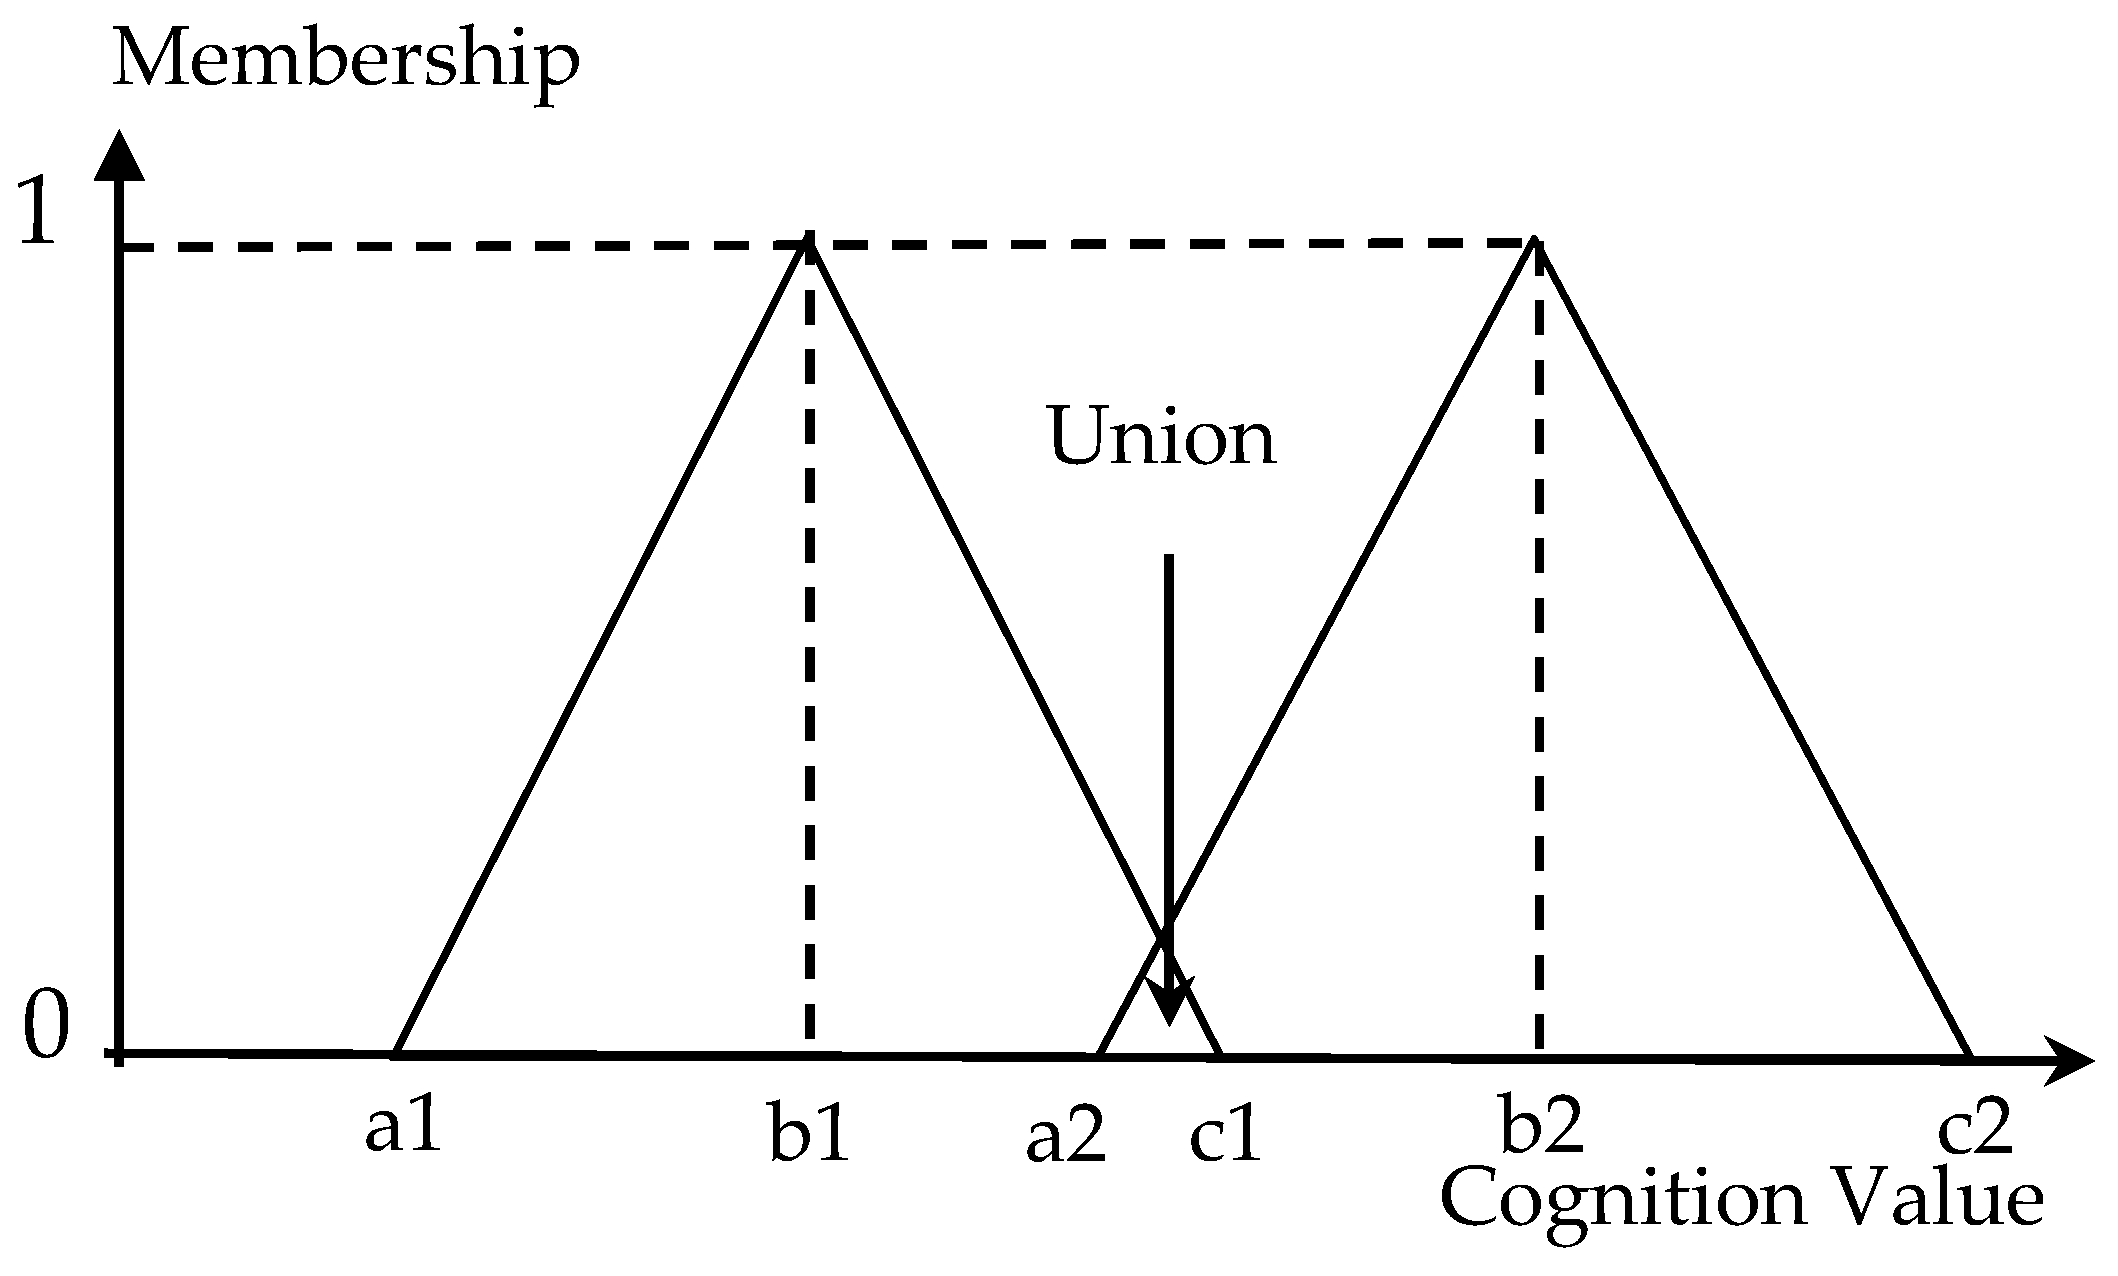
First, it is necessary to analyze the agreement degree by calculating the similarity of two triangular fuzzy numbers. The membership function of the triangle fuzzy number from two experts’ evaluations is shown in Figure 2.
The similarity of two triangular fuzzy numbers, Sij, is the ratio of the intersection to the union. The equation is:
S i j = S ( R ˜ i , R ˜ j ) = ( c 1 a 2 ) 2 ( c 1 a 1 + c 2 a 2 ) ( b 2 a 2 b 1 + c 1 ) ( c 1 a 2 ) 2

2.5.2. Establish Agreement Matrix

In this step, the Agreement Matrix (AM), AM = [Sij]n*n, i = 1, 2, … n, j = 1, 2, … n need to be established where n is the number of experts. When i = j, the similarity is 1, and when ij, the Sij = S ( R ˜ i , R ˜ j ) is calculated as Equation (1).

2.5.3. Calculate the Average Agreement Degree

In this step, the average agreement degree of each expert to other experts is calculated. Because the expert’s similarity to himself does not need to be calculated, every expert of an average agreement degree is calculated by using the formula below.
A ( E i ) = j = 1 ,   i j n S i j ,   i = 1 , 2 , n .

2.5.4. Calculate the Relative Agreement Degree

In this step, the relative agreement degree (RAD) of each expert to other experts is calculated. The equation is shown below.
RAD i = A ( E i ) i = 1 n A ( E i ) ,   i =   1 ,   2 ,     n .

2.5.5. Integrate Every Expert’s Evaluation with RAD

After calculating the relative agreement degree of each expert, the triangular fuzzy number of each expert’s evaluation is multiplied by the relative agreement degree as the weight and then is summed to form a triangle fuzzy number that represents the consensus of all the experts.

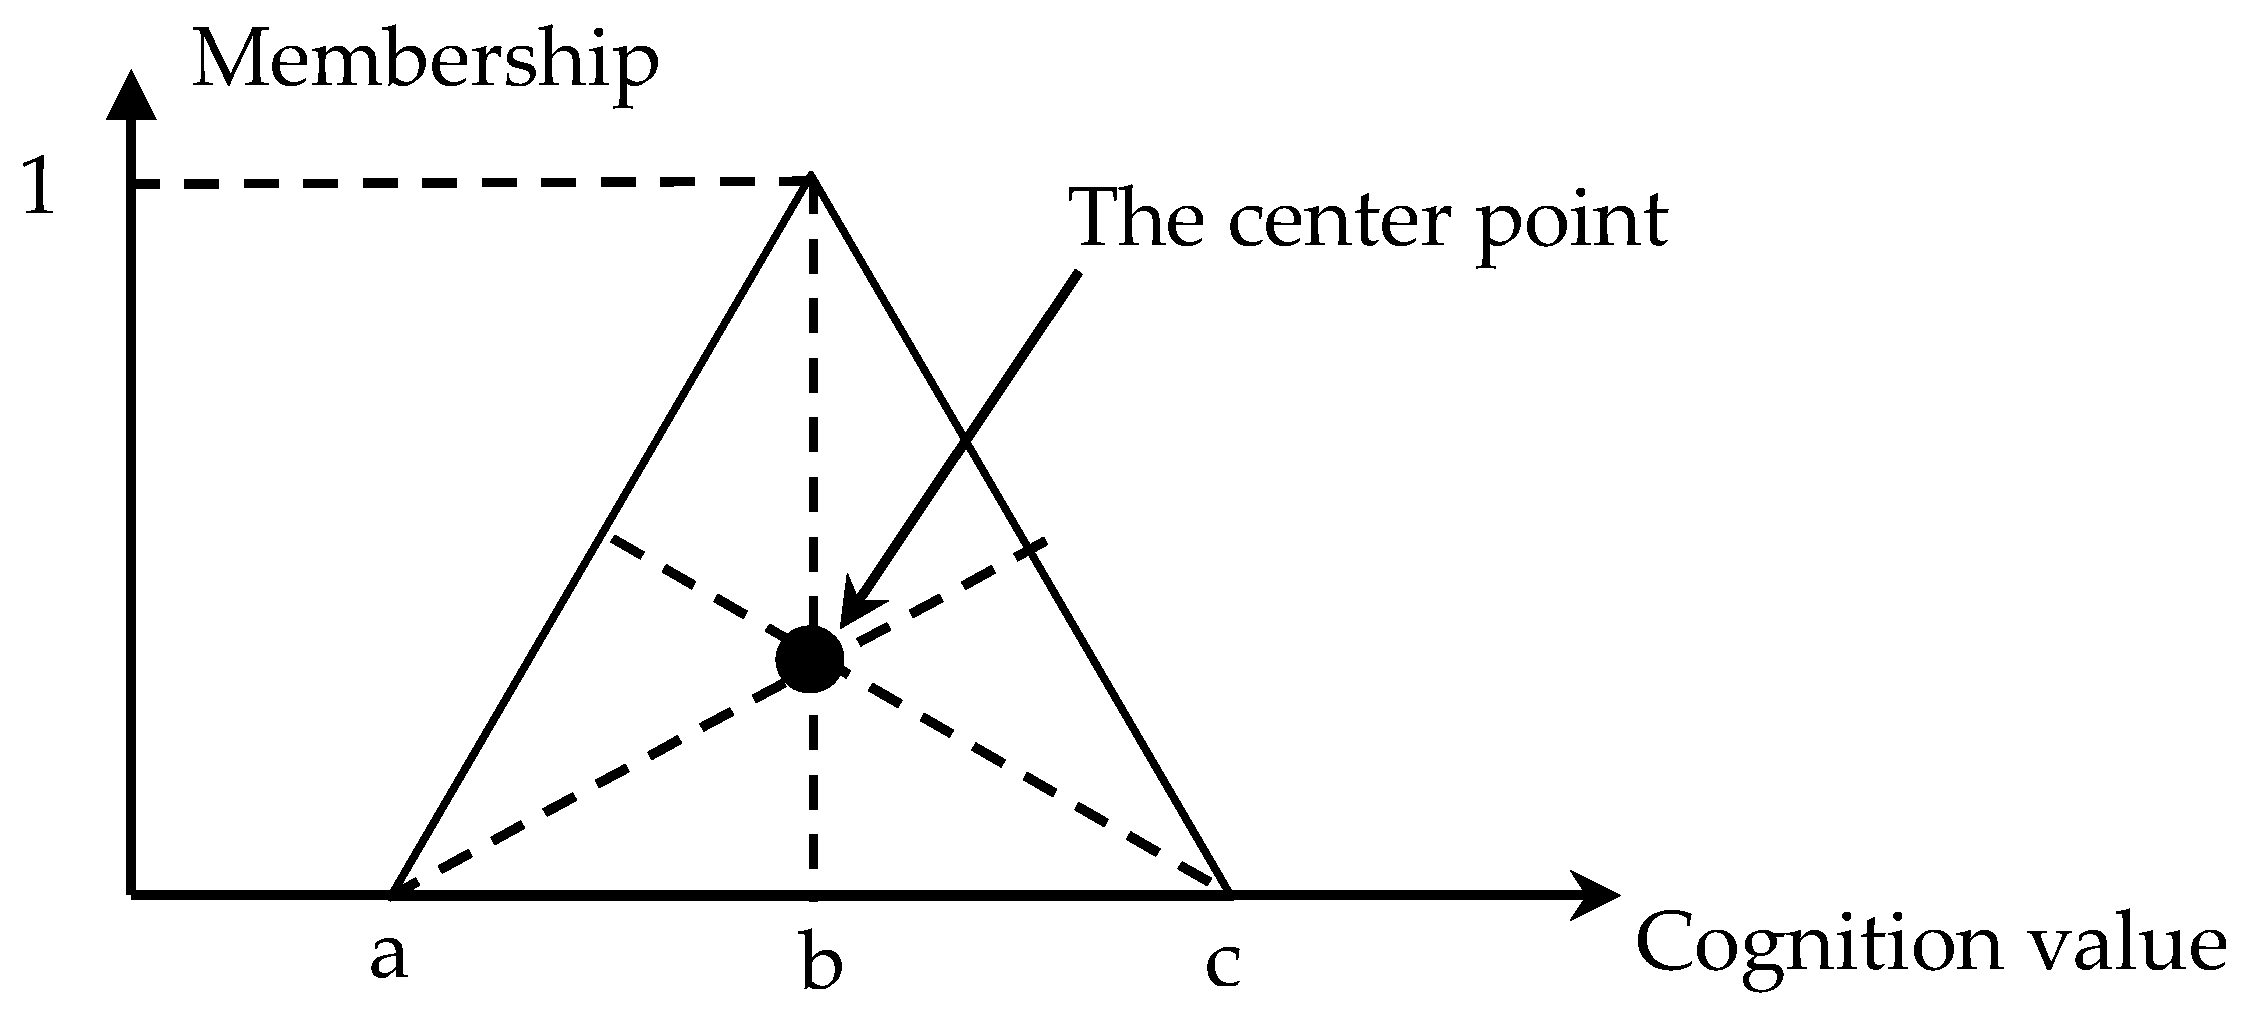
2.5.6. Defuzzification

There are many methods for defuzzification, such as: center of gravity, bisector of area, extended center of area, and more. Among these methods, the center of gravity method is reasonable and often used. When the triangular fuzzy number is used, the center of gravity method is to find the center point of the area as its representative value. The membership function of the triangle fuzzy number and its center point are shown in Figure 3 and the equation of defuzzification is shown as Equation (4).
defuzzification   =   ( b a ) + ( c a ) 3   + a     a + b + c 3

2.6. Construct a Pairwise Comparison Matrix

After integrating all expert opinions by the methods of geometric mean and SAM respectively, this research constructed the pairwise comparison judgment matrixes. When n indicators to be compared, the number of comparison will be n(n − 1)/2 times. The result of the comparison after integrating is placed on the right triangle region above the pairwise comparison matrix. The number of the angle line is 1. The number of the lower left triangle area is the reciprocal of the right triangle region. Then the eigenvalues and eigenvectors of the matrix are calculated.

2.7. Consistency Test

The main purpose of the consistency test is to understand whether experts make a reasonable comparison and whether the consistency of the entire hierarchical structure is within a reasonable range. The consistency index (C.I.) is used to determine the degree of reasonable transferability of comparison. The equation of C.I. is shown below.
C . I . = λ   m a x n n 1
When C.I. is 0, it means that the comparisons are consistent. Saaty [51] recommends that C.I. should be less than or equal to 0.1. Then the Consistency Ratio (C.R.) is used to see whether the consistency of the entire hierarchy is within a reasonable range. The equation of C.R. is shown below.
C.R. = C.I./R.I.
R.I. is the random index (R.I.) whose value increases with the order of the matrix. The values of R.I. are shown in Table 2 [28]. If the C.R. is less than 0.1, the evaluation values in the matrix are consistent [25].

2.8. Construct Super Matrix

The super matrix is formed by multiple sub-matrices that include the interaction of indicators within or without their dimensions. The super matrix is divided into an un-weighted super matrix, a weighted super matrix, and a limit super matrix. The un-weighted super matrix is the weight obtained from the original pairwise comparison. The weighted super matrix is the weight of the same element in the un-weighted matrix multiplied by the associated group weight. The limited super matrix is the multivariate operation of the weighted super matrix [52]. The convergence value presented by the limited super matrix is the priority value corresponding to each indicator.

2.9. Compare the Weights from Comprehensive and Consensus of Experts’ Opinions

After analyzing the weights and the rankings from comprehensive expert opinions and a consensus by FANP combined with geometric mean and SAM, this research compares the differences between them.

3. Results

3.1. Construct Hierarchy and Network Structure

In this stage, this research invited three supervisors responsible for drone filming’s safety and service quality, and four experienced drone pilots. The expert consultation questionnaire for modifying the statements of indicators of SERVQUAL were issued to seven experts and collected six valid questionnaires. After rewriting the statement of indicators according to the responses of experts, this research constructed the construct hierarchy and network structure by a related questionnaire that responded from the same six experts and then developed the fuzzy semantic pair comparison questionnaire. In order to understand whether the statement of the semantic questionnaire is clear and the time required, the research conducted a pre-test. The pre-test applied 23 questionnaires and 22 questionnaires were collected. According to the opinion from the pre-test, six experts modified the statements of indicators and rewrote the related questionnaire again. The five dimensions and the 18 indicators after the pre-test are shown in Table 3. Table 4 shows the number of experts that confirm the relation between indicators. This research keeps the relations of indicators if more than four experts agree on the dependency. The indicator dependency relationship table is shown in Table 5 and the indicators dependency chart is shown in Figure 4.
According to the drone filming and photography service quality evaluation structure and indicators dependency chart, the fuzzy semantic pair comparison questionnaire is developed.

3.2. Questionnaire and Analysis

The questionnaire was issued from 10 September, 2017 to 19 September, 2017. A total of 13 fuzzy semantic pair comparison questionnaires were issued to experienced experts of drone filming and photography. Ten valid questionnaires were obtained. The effective recovery rate is 77%. This research integrated all expert opinions by geometric mean and SAM by using the software of Excel and then inputted the defuzzicated result into the software of Super Decisions to analyze the weight by ANP. The C.I. and C.R. are both less than 0.1, as shown in Table 6.
After passing the consistency test, the super matrixes are calculated by the method of ANP. The value of each column of the limit super matrix is the weight of each index. The super matrix of comprehensive experts’ opinions is shown in Table 7 and the super matrix of consensus experts’ opinions is shown in Table 8.
The dimensions ordered by weight that are analyzed from the comprehensive experts’ opinions are reliability, assurance, tangibility, responsiveness, and empathy. The dimensions ordered by weight analyzed from the consensus are reliability, tangibility, assurance, responsiveness, and empathy. The weight and order of dimensions are shown in Table 9.
As for the weight of the indicator of drone filming and photography service, among the integrated opinions of experts by geometric mean (comprehensive opinion) or SAM (consensus), the top six indicators are the same but the order is different. They are: “Employees are professional and get adequate support to do their jobs well,” “Drone service team’s employees care about the needs of customers and keep them in mind,” “Drone service team has up-to-date equipment,” “Drone service team provides service legally, safely, and reliably,” “When the drone service team promises to do something by a certain time, it does so” and “Customs can trust employees of the drone service team feel safe.” The difference between the weights after the seventh is much smaller. Therefore, this research discusses and interprets those six important indicators and dimensions mentioned above in the discussion section. The weight and order of indicators are shown in Table 10.

4. Discussion

As for the weight of the dimension, which is shown in Table 9, no matter the comprehensive opinion of experts or the consensus opinion of experts, the most vital dimension of drone filming and the photography service is reliability. Reliability is not only the top one dimension by the order of weight but also have much greater weight than the top two dimension. This means that the correct implementation of service commitment, service performance, and trustworthiness are the top priority for service quality of drone filming and photography. Therefore, this research suggests that the service provider will make good preparations for service. For example, they can observe the terrain and airspace, make a plan, and prepare at least two pieces of equipment to keep the reliability of service. The top two and three dimensions are assurance and tangibility and they are in reverse order from the comprehensive and consensus opinion of experts. This means that it is very important to have the knowledge, ability, and courtesy required to perform the drone filming and photography service, as well as the equipment and tools. According to this result, this research suggests that the service provider shall pay attention both to the equipment and professionalism required to guarantee the quality of the service. As for the dimensions of responsiveness and empathy, experts consider them as the last two dimensions by the order of weight. From the consensus opinion of experts, the weights of these two dimensions are less than 0.1. It means that the service of drone filming and photography has lower demand for communication and response with customers.
As for the weight of the indicator, which is shown in Table 10, both comprehensive and the consensus opinion of experts consider the most important indicator as “Employees are professional and get adequate support to do their jobs well.” Therefore, this research suggests that the service provider of drone filming and photography shall always be professional by keeping refining skills and studying relevant knowledge. The second important indicator from comprehensive expert opinions and the consensus is “Drone service team’s employee care about the needs of customers and keep them in mind” (comprehensive opinion of experts) and “Drone service team has up-to-date equipment” (consensus opinion of experts). This means that the importance of good equipment and satisfaction of the customer’s requirements is surpassed only by the professionalism of drone filming and the photography service. As for the indicator of “Drone service team provides service legally, safely, and reliably,” the ranking is third and fourth from the consensus and comprehensive opinion of experts even though drone filming and photography should service the base legally and safely. According to this result, this research suggests that both the authority and drone industry can improve the propaganda and management of the drone safety. The indicators of “When the drone service team promises to do something by a certain time, it does so” and “Customs can trust employees of the drone service team feel safe” are the top 5 and top 6 indicators by weight. It means that the service of filming or photography by the drone on time can gain the customer’s confidence, which are very important factors, especially for outdoor activity.
In summary, reliability and doing the jobs well are the top priority for the service quality of drone filming and photography. Good equipment satisfy the customer’s requirements, and performing service on time to gain the customer’s confidence are essential. In addition to the indicators to keep the service quality at a high level, this research found that the priority of performing the service legally and safely is not the first important point but after the third point. Therefore, this research also calls for drone pilots and related personnel to pay more attention to legal and safety issues.

5. Conclusions

The service of drone filming and photography has been getting more and more popular in recent years. This research analyzes the weight of dimensions and indicators of the service quality from the comprehensive and consensus opinion of experts by FANP with a geometric mean and SAM.
The findings of this research, corresponding to the research purposes mentioned in the section of introduction, the dimension of reliability is most significant for drone filming and the photography service considered by both the comprehensive expert opinion and the consensus. The top five most important indicators are: “Employees are professional and get adequate support to do their jobs well,” “Drone service team’s employees give customers personal attention,” “Drone service team has up-to-date equipment,” “Drone service team provides service legally, safely, and reliably” and “When the drone service team promises to do something by a certain time, it does so.” This means that, for keeping excellent service of drone filming and photography, the professional, up-to-date equipment satisfy the customer’s requirements. Legality and safety are most important.
Lastly, the discovering of this research revealed that weights of dimensions and indicators from both comprehensive expert opinions and the consensus would assist us in keeping good service quality of filming and photography by the drone.

Author Contributions

In this research, C.-C.L. provided the research ideas, designed the theoretical verifications, and reviewed the manuscript. J.-J.C. analyzed the data and wrote and formatted the manuscript.

Funding

This research received no external funding.

Conflicts of Interest

The authors declare no conflict of interest.

References

  1. Liu, C.C.; Chen, J.J. Research on service quality criteria for UAV filming and photography in Taiwan-dual perspective. Int. J. Appl. Bus. 2017, 15, 101–121. [Google Scholar]
  2. Turner, I.L.; Harley, M.D.; Drummond, C.D. UAVs for coastal surveying. Coast Eng. 2016, 114, 19–24. [Google Scholar] [CrossRef]
  3. Bulgakov, A.; Evgenov, A.; Weller, C. Automation of 3D building model generation using quadrotor. Proc. Eng. 2105, 123, 101–109. [Google Scholar] [CrossRef]
  4. Nishar, A.; Richards, S.; Breen, D.; Robertson, J.; Breen, B. Thermal infrared imaging of geothermal environments and by an unmanned aerial vehicle (UAV): A case research of the Wairakei-Tauhara geothermal field, Taupo, New Zealand. Renew. Energy 2016, 86, 1256–1264. [Google Scholar] [CrossRef]
  5. Lin, C.; Chen, J.J.; Chuang, S.; Li, Y.; Chou, C. The Efficiency Evaluated System for Solar Panel by Drone with Infrared Sensor. In Proceedings of the International Conference of Computational Methods in Sciences and Engineering 2018 (ICCMSE 2018), Thessaloniki, Greece, 14–18 March 2018. [Google Scholar]
  6. Na, W.S.; Baek, J. Impedance-based non-destructive testing method combined with unmanned aerial vehicle for structural health monitoring of civil infrastructures. Appl. Sci. 2017, 7, 15. [Google Scholar] [CrossRef]
  7. Parasuraman, A.; Zeithaml, V.A.; Berry, L.L. A conceptual model of service quality and its implications for future research. J. Mark. 1985, 49, 41–50. [Google Scholar] [CrossRef]
  8. Parasuraman, A.; Zeithaml, V.A.; Berry, L.L. SERVQUAL: A multiple-item scale for measuring consumer perceptions of service quality. J. Retail. 1998, 64, 12–28. [Google Scholar]
  9. Buttle, F. SERVQUAL: Review, critique, research agenda. Eur. J. Mark. 1996, 30, 8–32. [Google Scholar] [CrossRef]
  10. Lisa, J.M.C. Measuring service quality: A review and critique of research using SERVQUAL. Int. J. Mark. Res. 2004, 46, 479–497. [Google Scholar]
  11. Gilmore, A.; McMullan, R. Scales in services marketing research: A critique and way forward. Eur. J. Mark. 2009, 43, 640–651. [Google Scholar] [CrossRef]
  12. Ladhari, R. Alternative measures of service quality: A review. Manag. Serv. Qual. 2008, 18, 65–86. [Google Scholar] [CrossRef]
  13. Ladhari, R. A review of twenty years of SERVQUAL research. Int. J. Qual. Serv. Sci. 2009, 1, 172–198. [Google Scholar] [CrossRef]
  14. Asubonteng, P.; McCleary, K.J.; Swan, J.E. SERVQUAL revisited: A critical review of service quality. J. Serv. Mark. 1996, 10, 62–81. [Google Scholar] [CrossRef]
  15. Lam, S.S. SERVQUAL: A tool for measuring patients’ opinions of hospital service quality in Hong Kong. Total Qual. Manag. 1997, 8, 145–152. [Google Scholar] [CrossRef]
  16. Dikopoulou, Z.; Napoles, G.; Papageorgiou, E.; Vanhoof, K. Ranking and aggregation of factors affecting companies’ attractiveness. Springer Int. 2015, 9095, 343–355. [Google Scholar]
  17. Cereska, A.; Zavadskas, E.K.; Bucinskas, V.; Podvezko, V.; Sutinys, E. Analysis of steel wire rope diagnostic data applying multi-criteria methods. Appl. Sci. 2018, 8, 260. [Google Scholar] [CrossRef]
  18. Ziemba, P. Inter-criteria dependencies-based decision support in the sustainable wind energy management. Energies 2019, 12, 749. [Google Scholar] [CrossRef]
  19. Öztürk, N.; Karacan, I.; Tozan, H.; Vayvay, Ö. Defining criteria weights by ahp in health technology assessment. Value Health. 2017, 20, 689. [Google Scholar] [CrossRef]
  20. Asghari, M.; Nassiri, P.; Monazzam, M.R.; Golbabaei, F.; Arabalibeik, H.; Shamsipour, A.; Allahverdy, A. Weighting criteria and prioritizing of heat stress indices in surface mining using a delphi technique and fuzzy AHP-TOPSIS Method. J. Environ. Health Sci. 2017, 15, 1–11. [Google Scholar] [CrossRef]
  21. Kim, Y.K.; Kim, T.U.; Seong-Taek Park, S.T.; Jung, J.R. Establishing the importance weight of appropriability mechanism by using AHP: The case of the China’s electronic industry. Clust. Comput. 2016, 19, 1635–1646. [Google Scholar] [CrossRef]
  22. Blagojevic, B.; Srdjevic, B.; Srdjevic, Z.; Zoranovic, T. Deriving weights of the decision makers using AHP group consistency measures. Fund Inf. 2016, 144, 383–395. [Google Scholar] [CrossRef]
  23. Li, K.; Zhang, Y.; Liu, W. Weight analysis based on ANP and QFD in software quality evaluation. Appl. Math. Inf. Sci. 2014, 8, 793–798. [Google Scholar] [CrossRef]
  24. Saaty, T.L. How to make a decision: The analytic hierarchy process. Interfaces 1994, 24, 19–43. [Google Scholar] [CrossRef]
  25. Saaty, T.L. Decision Making with Dependence and Feedback: The Analytic Network Process; RWS publications: Pittsburgh, PA, USA, 1996. [Google Scholar]
  26. Ishizaka, A.; Labib, A. Analytic hierarchy process and expert choice: Benefits and limitations. ORInsight 2009, 22, 201–220. [Google Scholar] [CrossRef]
  27. Ziemba, P.; Wątróbski, J. Selected Issues of Rank Reversal Problem in ANP Method. In Selected Issues in Experimental Economics; Nermend, K., Łatuszyńska, M., Eds.; Springer: Cham, Switzerland, 2016. [Google Scholar]
  28. Chen, S. A combined MCDM model based on DEMATEL and ANP for the selection of airline service quality improvement criteria: A research based on the Taiwan airline industry. J. Air. Transp. Manag. 2016, 57, 7–18. [Google Scholar] [CrossRef]
  29. Ashouri, F. Quality indicators in the mobile industry rankings based on indicators of customer satisfaction with the hybrid approach DEMATEL and ANP appropriate strategy based on gray system. Orig. Sci. 2016, 3, 62–72. [Google Scholar] [CrossRef]
  30. Jin, H.; Zhang, M.; Yuan, Y. analytic network process-based multi-criteria decision approach and sensitivity analysis for temporary facility layout planning in construction projects. Appl. Sci. 2018, 8, 2434. [Google Scholar] [CrossRef]
  31. Zadeh, L.A. Fuzzy sets. Inf. Control 1965, 8, 338–353. [Google Scholar] [CrossRef]
  32. Taylan, O.; Bafail, A.O.; Abdulaal, R.M.; Kabli, M.R. Construction projects selection and risk assessment by fuzzy AHP and fuzzy TOPSIS methodologies. Appl. Soft Comput. 2014, 17, 105–116. [Google Scholar] [CrossRef]
  33. Chang, B.; Kuo, C.; Wu, C.H.; Tzeng, G.H. Using fuzzy analytic network process to assess the risks in enterprise resource planning system implementation. Appl. Soft Comput. 2015, 28, 196–207. [Google Scholar] [CrossRef]
  34. Parameshwaran, R.; Baskar, C.; Karthik, T. An integrated framework for mechatronics based product development in a fuzzy environment. Appl. Soft Comput. 2015, 27, 376–390. [Google Scholar] [CrossRef]
  35. Chang, S.C.; Tsai, P.H.; Chang, S.C. A hybrid fuzzy model for selecting and evaluating the e-book business model: A case study on Taiwan e-book firms. Appl. Soft Comput. 2015, 34, 194–204. [Google Scholar] [CrossRef]
  36. Yu, M.; Keng, I.; Chen, H. Measuring service quality via a fuzzy analytical approach. Int. J. Fuzzy Syst. 2015, 17, 292–302. [Google Scholar] [CrossRef]
  37. Lupo, T. A fuzzy framework to evaluate service quality in the healthcare industry: An empirical case of public hospital service evaluation in Sicily. Appl. Soft Comput. 2016, 40, 468–478. [Google Scholar] [CrossRef]
  38. Ozdemir, Y.; Basligil, H. Aircraft selection using Fuzzy ANP and the generalized Choquet Integral method: The Turkish Airlines case. J. Intell. Fuzzy Syst. 2016, 31, 589–600. [Google Scholar] [CrossRef]
  39. Wang, C.N.; Nguyen, V.T.; Duong, D.H.; Thai, H.T.N. A hybrid fuzzy analysis network process (FANP) and the technique for order of preference by similarity to ideal solution (TOPSIS) approaches for solid waste to energy plant location selection in Vietnam. Appl. Sci. 2018, 8, 1100. [Google Scholar] [CrossRef]
  40. Saaty, T. The analytic hierarchy and analytic network measurement processes: Applications to decisions under risk. Eur. J. Pure Appl. Math. 2007, 1, 122–196. [Google Scholar]
  41. Zwick, R.; Carlstein, E.; Budescu, D.V. Measures of similarity among fuzzy concepts: A comparative analysis. Int. J. Approx. Reason 1987, 1, 221–242. [Google Scholar] [CrossRef]
  42. Hsu, H.M.; Chen, C.T. Aggregation of fuzzy opinions under group decision making. Fuzzy Sets Syst. 1996, 79, 279–285. [Google Scholar]
  43. Alcantud, J.C.R.; de Andrés Calle, R.; Cascón, J.M. A unifying model to measure consensus solutions in a society. Math. Comput. Model. 2013, 57, 1876–1883. [Google Scholar] [CrossRef]
  44. Wang, W.; Chang, H.; Liu, A.; Chen, Y. Research into care quality criteria for long-term care institutions. J. Nurs. Res. 2007, 15, 255–264. [Google Scholar] [CrossRef]
  45. Hsu, Y.; Lee, C.; Kreng, V.B. The application of fuzzy Delphi method and fuzzy AHP in lubricant regenerative technology selection. Expert Syst. Appl. 2010, 37, 419–425. [Google Scholar] [CrossRef]
  46. Fatimah, F.; Rosadi, D.; Hakim, R.F.; Alcantud, J.C.R. N-soft sets and their decision making algorithms. Soft Comput. 2018, 22, 3829–3842. [Google Scholar] [CrossRef]
  47. Zhan, J.; Sun, B.; Alcantud, J.C.R. Covering based multigranulation (I, T)-Fuzzy rough set models and applications in multi-attribute group decision-making. Inform. Sci. 2019, 476, 290–318. [Google Scholar] [CrossRef]
  48. Saaty, T.L. The Analytic Hierarchy Process: Planning, Priority Setting, Resource Allocation; McGraw-Hill: New York, NY, USA, 1980. [Google Scholar]
  49. Buckley, J.J. Fuzzy hierarchical analysis. Fuzzy Set Syst. 1985, 17, 233–247. [Google Scholar] [CrossRef]
  50. Babakus, E.; Mangold, W.G. Adapting the SERVQUAL scale to hospital services: An empirical investigation. Health Serv. Res. 1992, 26, 767–786. [Google Scholar] [PubMed]
  51. Saaty, T.L. Rank from comparisons and from ratings in the analytic hierarchy/network processes. Eur. J. Oper. Res. 2006, 168, 557–570. [Google Scholar] [CrossRef]
  52. Parenté, F.J.; Anderson-Parenté, J.K. Delphi Inquiry Systems. In Judgmental Forecasting; Wright, G., Ayton, P., Eds.; Wiley: Chichester, UK, 1987. [Google Scholar]
Figure 1. Research methodology.
Applsci 09 01236 g001
Figure 2. Membership function of triangle fuzzy numbers.
Applsci 09 01236 g002
Figure 3. Membership function of the triangle fuzzy number and its center point.
Applsci 09 01236 g003
Figure 4. Indicators dependency chart.
Applsci 09 01236 g004
Table 1. Triangular fuzzy number of the linguistic term.
Linguistic TermTriangular Fuzzy Number
Equally Preferred 1 ˜
Intermediate 2 ˜
Moderately Preferred 3 ˜
Intermediate 4 ˜
Strongly Preferred 5 ˜
Intermediate 6 ˜
Very Strongly Preferred 7 ˜
Intermediate 8 ˜
Extremely Preferred 9 ˜
Table 2. Random indexes (R.I.).
Matrix Order123456789101112131415
R.I.--0.580.901.121.241.321.411.451.491.511.531.561.571.59
Table 3. Drone filming and photography service quality evaluation structure.
GoalDimensionsIndicators
Drone filming and photography service qualityA TangibilityA1 Drone service team has up-to-date equipment.
A2 Drone service team’s physical facilities are visually appealing.
A3 Drone service team’s employees are well dressed and appear neat.
A4 Equipment matches the service.
B ReliabilityB1 When the drone service team promises to do something by a certain time, it does so.
B2 When the consumer has a problem, the drone service team is sympathetic and reassuring.
B3 Drone service team provides service legally, safely, and reliably.
B4 Drone service team keeps its records accurately.
C ResponsivenessC1 Drone service team tells customers exactly when the service will be performed.
C2 Drone service team’s employees are always willing to help customers and provide prompt service.
C3 Drone service team’s employees are never too busy to respond to customer requests promptly.
D AssuranceD1 Customers can trust employees of the drone service team and feel safe.
D2 Employees of the drone service team are polite.
D3 Employees are professional and get adequate support to do their jobs well.
E EmpathyE1 Drone service team has operating hours convenient to all their customers.
E2 Drone service team’s employees care about the needs of customers and keep them in mind.
E3 Drone service team pays attention to what the customer wants.
E4 Drone service team knows what the customer’s need are and gives care.
Table 4. Indicator dependency relationship score.
DimensionsA TangibilityB ReliabilityC ResponsivenessD AssuranceE Empathy
IndicationsA1A2A3A4B1B2B3B4C1C2C3D1D2D3E1E2E3E4
A TangibilityA1010040320005000000
A2101110200103000000
A3100000100203500100
A4100011111313011011
B ReliabilityB1101100305215103012
B2000000000632301111
B3000100000213010000
B4000100001223110111
C ResponsivenessC1000010010003101100
C2101233220026612233
C3000022020305400141
D AssuranceD1103223322330101222
D2002012111314001221
D3102102410213000011
E EmpathyE1000020002000100001
E2001024100541100011
E3000011010623200101
E4000111011633100010
Table 5. Indicator dependency relationship table.
DimensionsA TangibilityB ReliabilityC ResponsivenessD AssuranceE Empathy
IndicationsA1A2A3A4B1B2B3B4C1C2C3D1D2D3E1E2E3E4
A TangibilityA1 X X
A2
A3 X
A4
B ReliabilityB1 X X
B2 X
B3
B4
C ResponsivenessC1
C2 XX
C3 XX X
D AssuranceD1
D2 X
D3 X
E EmpathyE1
E2 X XX
E3 X
E4 X
Table 6. C.I. and C.R.
Compare Respect toGroupPairwise CompassionGeometric MeanSAM
C.I.C.R.C.I.C.R.
DimensionsGoal A and B, A and C, A and D, A and E, B and C, B and D, B and E, C and D, C and E, D and E0.016010.01780.08340.0927
B A and D, A and E, D and E0.000410.00040.04180.0418
C B and E0000
D A and B, A and C, A and D, B and C, B and D, C and D0.012650.02180.02080.0358
IndicatorGoalAA1 and A2, A1 and A3, A1 and A4, A2 and A3, A2 and A4, A3 and A40.01370.02360.05080.0876
BB1 and B2, B1 and B3, B1 and B4, B2 and B3, B2 and B4, B3 and B40.01160.020.03410.0587
CC1 and C2, C1 and C3, C2 and C30.02660.02660.01090.0109
DD1 and D2, D1 and D3, D2 and D30.00090.00090.00380.0038
EE1 and E2, E1 and E3, E1 and E4, E2 and E3, E2 and E4, E3 and E40.00330.00570.0040.0069
C2EE2 and E3, E2 and E4, E3 and E40.00940.00940.01260.0126
D1CC2 and C30000
D2CC2 and C30000
Table 7. The super matrix of comprehensive experts’ opinions.
Dimensions TangibilityResponsivenessReliabilityAssuranceEmpathy
Indicators A1A2A3A4B1B2B3B4C1C2C3D1D2D3E1E2E3E4
TangibilityA10.1170.1170.1170.1170.1170.1170.1170.1170.1170.1170.1170.1170.1170.1170.1170.1170.1170.117
A20.0100.0100.0100.0100.0100.0100.0100.0100.0100.0100.0100.0100.0100.0100.0100.0100.0100.010
A30.0290.0290.0290.0290.0290.0290.0290.0290.0290.0290.0290.0290.0290.0290.0290.0290.0290.029
A40.0300.0300.0300.0300.0300.0300.0300.0300.0300.0300.0300.0300.0300.0300.0300.0300.0300.030
ReliabilityB10.0790.0790.0790.0790.0790.0790.0790.0790.0790.0790.0790.0790.0790.0790.0790.0790.0790.079
B20.0490.0490.0490.0490.0490.0490.0490.0490.0490.0490.0490.0490.0490.0490.0490.0490.0490.049
B30.1000.1000.1000.1000.1000.1000.1000.1000.1000.1000.1000.1000.1000.1000.1000.1000.1000.100
B40.0480.0480.0480.0480.0480.0480.0480.0480.0480.0480.0480.0480.0480.0480.0480.0480.0480.048
ResponsivenessC10.0270.0270.0270.0270.0270.0270.0270.0270.0270.0270.0270.0270.0270.0270.0270.0270.0270.027
C20.0360.0360.0360.0360.0360.0360.0360.0360.0360.0360.0360.0360.0360.0360.0360.0360.0360.036
C30.0610.0610.0610.0610.0610.0610.0610.0610.0610.0610.0610.0610.0610.0610.0610.0610.0610.061
AssuranceD10.0650.0650.0650.0650.0650.0650.0650.0650.0650.0650.0650.0650.0650.0650.0650.0650.0650.065
D20.0380.0380.0380.0380.0380.0380.0380.0380.0380.0380.0380.0380.0380.0380.0380.0380.0380.038
D30.1340.1340.1340.1340.1340.1340.1340.1340.1340.1340.1340.1340.1340.1340.1340.1340.1340.134
EmpathyE10.0120.0120.0120.0120.0120.0120.0120.0120.0120.0120.0120.0120.0120.0120.0120.0120.0120.012
E20.1240.1240.1240.1240.1240.1240.1240.1240.1240.1240.1240.1240.1240.1240.1240.1240.1240.124
E30.0190.0190.0190.0190.0190.0190.0190.0190.0190.0190.0190.0190.0190.0190.0190.0190.0190.019
E40.0210.0210.0210.0210.0210.0210.0210.0210.0210.0210.0210.0210.0210.0210.0210.0210.0210.021
Table 8. The super matrix of consensus experts’ opinions.
Dimensions TangibilityResponsivenessReliabilityAssuranceEmpathy
Indicators A1A2A3A4B1B2B3B4C1C2C3D1D2D3E1E2E3E4
TangibilityA10.1420.1420.1420.1420.1420.1420.1420.1420.1420.1420.1420.1420.1420.1420.1420.1420.1420.142
A20.0150.0150.0150.0150.0150.0150.0150.0150.0150.0150.0150.0150.0150.0150.0150.0150.0150.015
A30.0310.0310.0310.0310.0310.0310.0310.0310.0310.0310.0310.0310.0310.0310.0310.0310.0310.031
A40.0330.0330.0330.0330.0330.0330.0330.0330.0330.0330.0330.0330.0330.0330.0330.0330.0330.033
ReliabilityB10.0770.0770.0770.0770.0770.0770.0770.0770.0770.0770.0770.0770.0770.0770.0770.0770.0770.077
B20.0510.0510.0510.0510.0510.0510.0510.0510.0510.0510.0510.0510.0510.0510.0510.0510.0510.051
B30.1390.1390.1390.1390.1390.1390.1390.1390.1390.1390.1390.1390.1390.1390.1390.1390.1390.139
B40.0500.0500.0500.0500.0500.0500.0500.0500.0500.0500.0500.0500.0500.0500.0500.0500.0500.050
ResponsivenessC10.0170.0170.0170.0170.0170.0170.0170.0170.0170.0170.0170.0170.0170.0170.0170.0170.0170.017
C20.0240.0240.0240.0240.0240.0240.0240.0240.0240.0240.0240.0240.0240.0240.0240.0240.0240.024
C30.0350.0350.0350.0350.0350.0350.0350.0350.0350.0350.0350.0350.0350.0350.0350.0350.0350.035
AssuranceD10.0750.0750.0750.0750.0750.0750.0750.0750.0750.0750.0750.0750.0750.0750.0750.0750.0750.075
D20.0320.0320.0320.0320.0320.0320.0320.0320.0320.0320.0320.0320.0320.0320.0320.0320.0320.032
D30.1540.1540.1540.1540.1540.1540.1540.1540.1540.1540.1540.1540.1540.1540.1540.1540.1540.154
EmpathyE10.0090.0090.0090.0090.0090.0090.0090.0090.0090.0090.0090.0090.0090.0090.0090.0090.0090.009
E20.0950.0950.0950.0950.0950.0950.0950.0950.0950.0950.0950.0950.0950.0950.0950.0950.0950.095
E30.0100.0100.0100.0100.0100.0100.0100.0100.0100.0100.0100.0100.0100.0100.0100.0100.0100.010
E40.0090.0090.0090.0090.0090.0090.0090.0090.0090.0090.0090.0090.0090.0090.0090.0090.0090.009
Table 9. Weights and orders of dimensions.
Geometric MeanSAM
DimensionsWeightOrderWeightOrder
Tangibility0.14830.206 2
Reliability0.37310.459 1
Responsiveness0.14240.076 4
Assurance0.23020.195 3
Empathy0.10750.064 5
Table 10. Weights and orders of indicators.
DimensionIndicatorGeometric MeanSAM
Weight in DimensionOverall WeightOrderWeight in DimensionOverall WeightOrder
A TangibilityA1 Drone service team has up-to-date equipment.0.6290.11730.640.1422
A2 Drone service team’s physical facilities are visually appealing.0.0530.01180.0690.01515
A3 Drone service team’s employees are well dressed and appear neat.0.1560.029130.1410.03112
A4 Equipment matches the service.0.1620.03120.150.03310
B ReliabilityB1 When the drone service team promises to do something by a certain time, it does so.0.2850.07950.2420.0775
B2 When the consumer has a problem, the drone service team is sympathetic and reassuring.0.1760.04980.1590.0517
B3 Drone service team provides service legally, safely, and reliably.0.3640.140.440.1393
B4 Drone service team keeps its records accurately.0.1750.04890.1590.058
C ResponsivenessC1 Drone service team tells customers exactly when the service will be performed.0.220.027140.2250.01714
C2 Drone service team’s employees are always willing to help customers and provide prompt service.0.290.036110.3120.02413
C3 Drone service team’s employees are never too busy to respond to customer requests promptly.0.4910.06170.4630.0359
D AssuranceD1 Customers can trust employees of the drone service team and feel safe.0.2730.06560.2870.0756
D2 Employees of the drone service team are polite.0.1620.038100.1230.03211
D4 Employees are professional and get adequate support to do their jobs well.0.5650.13410.590.1541
E EmpathyE1 Drone service team has operating hours convenient to all their customers.0.0670.012170.0740.00918
E2 Drone service team’s employees care about the needs of customers and keep them in mind.0.7060.12420.770.0954
E3 Drone service team pays attention to what the customer wants.0.110.019160.0790.0116
E4 Drone service team knows what the customer’s needs are and gives care.0.1170.021150.0770.00917

