Application of Airborne Microorganism Indexes in Offices, Gyms, and Libraries


Abstract
:1. Introduction
2. Materials and Methods
2.1. Sampling Method
2.2. Microorganisms Assessed
2.3. Data Analysis
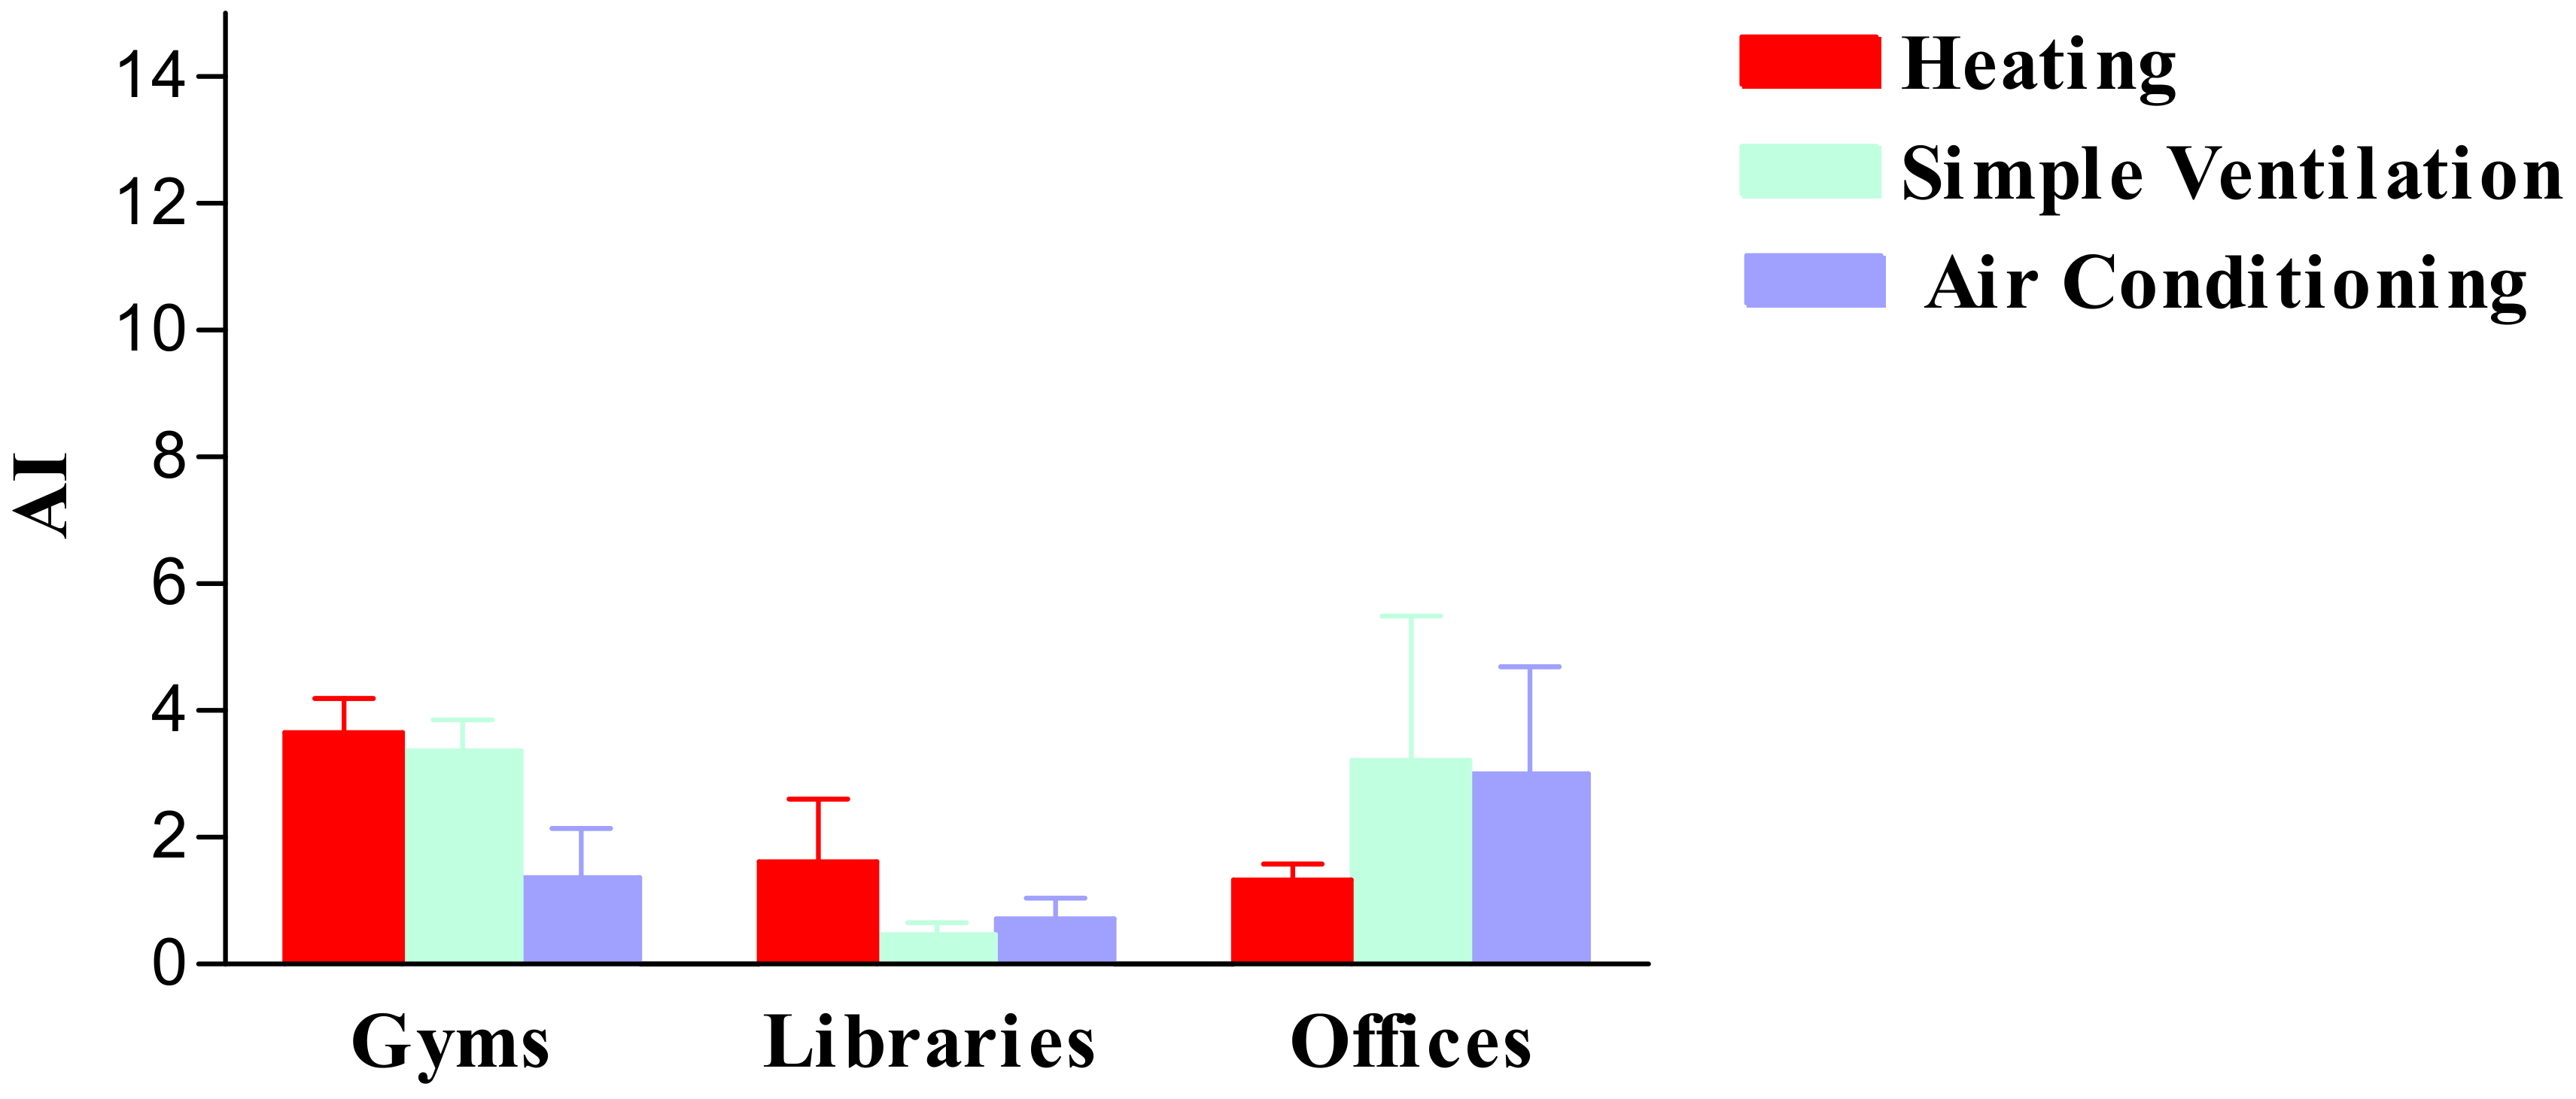
3. Results
4. Discussion
Author Contributions
Funding
Conflicts of Interest
References
- Anderson, A.M.; Weiss, N.; Raine, F.; Salkinoja-Salonen, M.S. Dust-borne bacteria in animal sheds, schools and children’s day care centers. J. Appl. Microbiol. 1999, 86, 622–634. [Google Scholar] [CrossRef]
- Bernasconi, C.; Rodolfi, M.; Picco, A.; Grisoli, P.; Dacarro, C.; Rembges, D. Pyrogenic activity of air to characterize bioaerosol exposure in public buildings: A pilot study. Lett. Appl. Microbiol. 2010, 50, 571–577. [Google Scholar] [CrossRef] [PubMed]
- Maroni, M.; Seifert, B.; Lindvall, T. Indoor Air Quality: A comprensive reference book. In Air Quality Monographs; Elsevier: Amsterdam, The Netherlands, 1995; Volume 3, ISBN 9780444816429. [Google Scholar]
- Testo unico in materia di tutela della salute e della sicurezza nei luoghi di lavoro. D.Lgs n. 81/2008. In Gazzetta Ufficiale della Repubblica Italiana; n. 101 (30 Aprile 2008); Ministero della Giustizia, Ufficio Pubblicazione Leggi e Decreti: Rome, Italy.
- Brief, R.S.; Bernath, T. Indoor pollution: guidelines for prevention and control of microbiological respiratory hazards associated with air conditioning and ventilation systems. Appl. Ind. Hyg. 1988, 3, 5–10. [Google Scholar] [CrossRef]
- Jensen, P.A.; Schafer, M.P. Sampling and characterization of bioaerosols. In NIOSH Manual of Analytical Methods Niosh/DPSE; NIOSH Publications: Washington, DC, USA, 1998; Volume 2, pp. 82–112. [Google Scholar]
- Švajlenka, J.; Kozlovská, M.; Pošiváková, T. Assessment and biomonitoring indoor environment of buildings. Int. J. Environ. Health Res. 2017, 27, 427–439. [Google Scholar] [CrossRef] [PubMed]
- Burge, P.S. Sick building syndrome. Occup. Environ. Med. 2004, 61, 185–190. [Google Scholar] [CrossRef] [PubMed] [Green Version]
- Cabo Verde, S.; Almeida, S.M.; Matos, J.; Guerreiro, D.; Meneses, M.; Faria, T.; Botelho, D.; Santos, M.; Viegas, C. Microbiological assessment of indoor air quality at different hospital sites. Res. Microb. 2015, 166, 557–563. [Google Scholar] [CrossRef] [PubMed]
- Dacarro, C.; Grisoli, P.; Del Frate, G.; Villani, S.; Grignani, E.; Cottica, D. Micro-organisms and dust exposure in an Italian grain mill. J. Appl. Microbiol. 2005, 98, 163–171. [Google Scholar] [CrossRef] [PubMed]
- Prazmo, Z.; Krysinska-Traczyk, E.; Skorska, C.; Sitkowska, J.; Cholewa, G.; Dutkiewicz, J. Exposure to bioaerosols in a municipal sewage treatment plant. Ann. Agric. Environ. Med. 2003, 10, 241–248. [Google Scholar] [PubMed]
- Mendell, M.J.; Lei-Gomez, Q.; Mirer, A.G.; Seppänen, O.; Brunner, G. Risk factors in heating, ventilating, and air-conditioning systems for occupant symptoms in US office buildings. Ind. Air 2008, 18, 301–316. [Google Scholar] [CrossRef] [PubMed]
- Qian, J.; Hospodsky, D.; Yamamoto, N.; Nazaroff, W.W.; Peccia, J. Size-resolved emission rates of airborne bacteria and fungi in an occupied classroom. Ind Air. 2012, 22, 339–351. [Google Scholar] [CrossRef] [PubMed] [Green Version]
- Wolff, C.H. Innate immunity and the pathogenicity of inhaled microbial particles. Int. J. Biol. Sci. 2011, 7, 261–268. [Google Scholar] [CrossRef] [PubMed]
- World Health Organization. Indoor Air Pollutants: Exposure and Health Effects; Report on a WHO Meeting, EURO Reports and Studies no. 78; WHO Regional Office for Europe: Copenhagen, Denmark, 1983. [Google Scholar]
- ACGIH. On-site investigation, pp. 1–8; Fungi, pp. 1–10; Bacteria, pp. 1–7. In Guidelines for the Assessment of Bioaerosols in the Indoor Environment; Committee on Bioaerosols, Ed.; American Conference of Governmental Industrial Hygienists: Cincinnati, OH, USA, 1989. [Google Scholar]
- Traistaru, E.; Moldovan, R.C.; Menelaou, A.; Kakourou, P.; Georgescu, C. A comparative study on the quality of air in offices and homes. J. Environ. Sci. Health A 2013, 48, 1806–1814. [Google Scholar] [CrossRef] [PubMed]
- Grisoli, P.; Rodolfi, M.; Villani, S.; Grignani, E.; Cottica, D.; Berri, A.; Picco, A.; Dacarro, C. Assessment of airborne microorganism contamination in an industrial area characterized by an open composting facility and a wastewater treatment plant. Environ. Res. 2009, 109, 135–142. [Google Scholar] [CrossRef] [PubMed]
- Grisoli, P.; Rodolfi, M.; Chiara, T.; Zonta, L.A.; Dacarro, C. Evaluation of microbiological air quality and of microclimate in university classrooms. Environ. Monit. Assess. 2012, 184, 4171–4180. [Google Scholar]
- Heildelberg, J.F.; Shahamat, M.; Levin, M.; Rahman, I.; Stelma, G.; Grim, C.; Colwell, R.R. Effect of aerosolization on culturability and viability of Gram-Negative bacteria. Appl. Environ. Microbiol. 1997, 63, 3585–3588. [Google Scholar]
- Macher, J.M.; Chatigny, M.A.; Burge, H.A. Sampling airborne microorganisms and aeroallergens. In Air Sampling Instruments for Evaluation of Atmospheric Contaminants, 8th ed.; Cohen, B.S., Hering, S.V., Eds.; American Conference of Governmental Industrial Hygienists Inc.: Cincinnati, OH, USA, 1995; pp. 589–617. [Google Scholar]
- Dacarro, C.; Grignani, E.; Lodola, L.; Grisoli, P.; Cottica, D. Proposta di indici microbiologici per la valutazione della qualità dell’aria degli edifici. G. Ital. Med. Lav. Ergon. 2000, XXII, 229–235. [Google Scholar]
- Gołofit-Szymczak, M.; Górny, R.L. Microbiological Air Quality in Office Buildings Equipped with Different Ventilation Systems. Ind. Air 2018, 28, 792–805. [Google Scholar] [CrossRef] [PubMed]
- Jouzaitis, A.; Willeke, K.; Grinshpun, S.A.; Donnelly, J. Impaction onto a Glass Slide or Agar versus Impingement into a Liquid for the Collection and Recovery of Airborne Microorganisms. Appl. Environ. Microbiol. 1994, 60, 861–870. [Google Scholar]
- Stewart, S.L.; Grinshpun, S.A.; Willeke, K.; Terzieva, S.; Ulevicius, V.; Donnelly, J. Effect of Impact Stress on Microbial Recovery on an Agar Surface. Appl. Environ. Microb. 1995, 61, 1232–1239. [Google Scholar]
- Walter, M.V.; Marthi, B.; Fieland, V.P.; Ganio, L.M. Effect of Aerosolization on Subsequent Bacterial Survival. Appl. Environ. Microb. 1990, 56, 3468–3472. [Google Scholar]
- Flannigan, B. Indoor microbiological pollutants—Sources, species, characterization and evaluation. In Chemical, Microbiological, Health and Comfort Aspects of Indoor Air Quality—State of the Art in SBS; Knöppel, H., Wolkoff, P., Eds.; EDSC, EEC, EAEC: The Netherlands, 1992; pp. 73–98. [Google Scholar]
- Miller, J.D. Fungi as contaminants in indoor air. Atmos. Environ. 1992, 6A, 2163–2172. [Google Scholar] [CrossRef]
- Rao, C.Y.; Burge, H.A. Review of quantitative standards and guidelines for fungi in indoor air. J. Air Waste Manag. Assoc. 1996, 46, 899–908. [Google Scholar] [CrossRef] [PubMed]
- Commission of European Communities. Indoor Air Quality & Its Impact on Man; Report n.12; Commission of European Communities: Luxembourg, 1993. [Google Scholar]
- Sofuoglu, S.C.; Moschandreas, D.J. The link between symptoms of office building occupants and in-office air pollution: The Indoor Air Pollution Index. Ind. Air 2003, 13, 332–343. [Google Scholar] [CrossRef]
- Flannigan, B.; Miller, J.D. Microbial growth in indoor environments. In Microorganisms in Home and Indoor Work Environments: Diversity, Health Impacts, Investigation and Control; Flannigan, B., Samson, R.A., Miller, J.D., Eds.; Taylor & Francis: Abingdon, UK, 2001; pp. 35–67. [Google Scholar]
- Dacarro, C.; Picco, A.M.; Grisoli, P.; Rodolfi, M. Determination of aerial microbiological contamination in scholastic sports environments. J. Appl. Microbiol. 2003, 95, 904–912. [Google Scholar] [CrossRef] [PubMed] [Green Version]


| Functioning Modes | N | Mesophilic Bacteria CFU/m3 | Psychrophilic Bacteria CFU/m3 | Fungal Count CFU/m3 | |||
|---|---|---|---|---|---|---|---|
| M ± SD | Min–max | M ± SD | Min–max | M ± SD | Min–max | ||
| Heating | 10 | 191.20 ± 144.53 | 8–450 | 176.70 ± 117.21 | 7–366 | 136.00 ± 32.80 | 22–654 |
| Simple ventilation | 10 | 667.60 ± 1602.60 | 6–5200 | 761.90 ± 1519.7 | 10–5000 | 131.50 ± 72.30 | 5–190 |
| Air Conditioning | 10 | 1089.70 ± 2392.20 | 19–7800 | 495.60 ± 307.20 | 76–860 | 119.60 ± 48.84 | 28–199 |
| Functioning Modes | N | GIMC/m3 | IMC | ||
|---|---|---|---|---|---|
| M ± SD | Min–max | M ± SD | Min–max | ||
| Heating | 10 | 503.90 ± 282.22 | 124–1111 | 7.30 ± 20.03 | 0.20–64.30 |
| Simple ventilation | 10 | 1561.00 ± 3154.80 | 21–10,450 | 0.80 ± 0.40 | 0.10–1.30 |
| Air Conditioning | 10 | 1704.90 ± 2537.57 | 229–8720 | 1.60 ± 2.67 | 0.02–9.10 |
| Functioning Modes | N | Mesophilic Bacteria CFU/m3 | Psychrophilic Bacteria CFU/m3 | Fungal Count CFU/m3 | |||
|---|---|---|---|---|---|---|---|
| M ± SD | Min–max | M ± SD. | Min–max | M ± SD | Min–max | ||
| Heating | 10 | 1096.60 ± 924.40 | 140–2850 | 1446.40 ± 1356.82 | 180–4650 | 187.50 ± 167.02 | 20–568 |
| Simple ventilation | 10 | 393.00 ± 257.00 | 120–980 | 819.00 ± 432.40 | 330–1800 | 1208.90 ± 1459.60 | 90–4848 |
| Air Conditioning | 10 | 666.50 ± 477.76 | 200–1800 | 1509.00 ± 1354.02 | 440–4400 | 2430.90 ± 3678.31 | 8–10,848 |
| Functioning Modes | N | GIMC/m3 | IMC | ||
|---|---|---|---|---|---|
| M ± SD | Min–max | M ± SD | Min–max | ||
| Heating | 10 | 2703.50 ± 2144.84 | 1160–7090 | 0.90 ± 0.74 | 0.12–2.40 |
| Simple ventilation | 10 | 2420.90 ± 1645.70 | 910–6548 | 0.50 ± 0.30 | 0.17–1.20 |
| Air Conditioning | 10 | 4606.40 ± 4428.70 | 1480–15,248 | 0.60 ± 0.39 | 0.20–1.40 |
| Functioning Modes | N | Mesophilic Bacteria CFU/m3 | Psychrophilic Bacteria CFU/m3 | Fungal Count CFU/m3 | |||
|---|---|---|---|---|---|---|---|
| M ± SD | Min–max | M ± SD | Min–max | M ± SD | Min–max | ||
| Heating | 10 | 171.20 ± 72.43 | 112–320 | 301.10 ± 237.26 | 125–725 | 123.90 ± 54.52 | 62–220 |
| Simple ventilation | 10 | 65.10 ± 29.40 | 38–110 | 152.40 ± 90.70 | 81–380 | 66.00 ± 31.70 | 32–110 |
| Air Conditioning | 10 | 71.80 ± 30.50 | 30–120 | 200.60 ± 127.65 | 97–400 | 76.60 ± 36.55 | 35–120 |
| Functioning Modes | N | GIMC/m3 | IMC | ||
|---|---|---|---|---|---|
| M ± SD | Min–max | M ± SD | Min–max | ||
| Heating | 10 | 596.20 ± 335.08 | 300–1250 | 0.70 ± 0.22 | 0.40–0.90 |
| Simple ventilation | 10 | 283.50 ± 131.70 | 153–578 | 0.50 ± 0.20 | 0.25–0.70 |
| Air Conditioning | 10 | 349.00 ± 176.43 | 182–652.50 | 0.40 ± 0.18 | 0.20–0.60 |
| Sampling Points | N | Heating GIMC/m3 | Simple Ventilation GIMC/m3 | Air Conditioning GIMC/m3 | |||
|---|---|---|---|---|---|---|---|
| M ± SD | Min–max | M ± SD | Min–max | M ± SD | Min–max | ||
| Gyms- outdoor | 10 | 714.40 ± 294.00 | 328–1268 | 703.10 ± 226.40 | 484–1236 | 3586.10 ± 2326.42 | 1325–9240 |
| Libraries outdoor | 10 | 410.65 ± 187.81 | 266–880 | 596.55 ± 167.19 | 359–892 | 508.40 ± 141,01 | 364–830 |
| Offices-outdoor | 10 | 421.70 ± 179.62 | 248–890 | 619.90 ± 169.30 | 392–933 | 703.80 ± 226.20 | 485–1068 |
© 2019 by the authors. Licensee MDPI, Basel, Switzerland. This article is an open access article distributed under the terms and conditions of the Creative Commons Attribution (CC BY) license (http://creativecommons.org/licenses/by/4.0/).
Share and Cite
Grisoli, P.; Albertoni, M.; Rodolfi, M. Application of Airborne Microorganism Indexes in Offices, Gyms, and Libraries. Appl. Sci. 2019, 9, 1101. https://doi.org/10.3390/app9061101
Grisoli P, Albertoni M, Rodolfi M. Application of Airborne Microorganism Indexes in Offices, Gyms, and Libraries. Applied Sciences. 2019; 9(6):1101. https://doi.org/10.3390/app9061101
Chicago/Turabian StyleGrisoli, Pietro, Marco Albertoni, and Marinella Rodolfi. 2019. "Application of Airborne Microorganism Indexes in Offices, Gyms, and Libraries" Applied Sciences 9, no. 6: 1101. https://doi.org/10.3390/app9061101