Article

Using Computer Simulation to Investigate Which Joint Angle Changes Have the Most Effect on Ball Release Speed in Overarm Throwing

1
Institute of Engineering Mathematics, Universiti Malaysia Perlis, Arau 02600, Malaysia
2
School of Sport, Exercise and Health Sciences, Loughborough University, Loughborough, Leicestershire LE11 3TU, UK
*
Author to whom correspondence should be addressed.
Appl. Sci. 2019, 9(5), 999; https://doi.org/10.3390/app9050999
Submission received: 31 December 2018 / Revised: 9 February 2019 / Accepted: 5 March 2019 / Published: 11 March 2019
(This article belongs to the Special Issue Computer Science in Sport)

Abstract

:
Efficient throwing mechanics is predicated on a pitcher’s ability to perform a sequence of movements of body segments, which progresses from the legs, pelvis, and trunk to the smaller, distal arm segments. Each segment plays a vital role in achieving maximum ball velocity at ball release. The perturbation of one joint angle has an effect on the ball release speed. An eight-segment angle-driven simulation model of the trunk, upper limbs and ball was developed to determine which joint angle changes have the most influence on ball release speed in overarm throwing for an experienced pitcher. Fifteen overarm throwing trials were recorded, and the joint angle time histories of each trial were input into the simulation model. Systematically replacing each joint angle time history with a constant value showed that overarm throwing was sensitive (≥5 m/s effect on ball release speed) to trunk extension/flexion and upper arm external/internal rotation, and very sensitive (≥10 m/s effect) to forearm extension/flexion. Computer simulation allows detailed analysis and complete control to investigate contributions to performance, and the key joint angle changes for overarm throwing were identified in this analysis.

1. Introduction

Overarm throwing is a fast, three-dimensional movement with complex interactions between limb segments. The general kinematics of overarm throwing are comparable across disciplines (e.g., baseball, handball, water polo, javelin). Overarm throwing movements can be divided into six events: stride foot contact, beginning of arm cocking, beginning of ball acceleration, initiation of forearm extension, initiation of upper arm internal rotation and ball release [1]. Numerous studies have been carried out to understand the biomechanics of overarm throwing as well as to propose techniques to improve performance [1,2,3,4,5,6]. Most of the previous studies have focused on the kinematics [7,8,9] and kinetics including joint force and moment [8,10,11] analysis in the upper extremities. Until recently, only foot–ground reaction forces have been studied for the lower extremity [12,13]. An electromyography (EMG) system has also been applied in baseball pitching studies and used to study muscle activations [14,15]. Contributions of body segments to ball speed have been investigated by restricting the motion of body segments involved in the throwing motion [16]. Alternatively, computer simulation models are able to replicate the movement whilst safely investigating technical strategies to enhance performance [1,8,17,18,19,20,21,22]. A simulation model can be used to determine the influence of one variable on performance, which is difficult to do using experimental studies [23,24]. An angle-driven simulation model allows individual joint angle changes to be controlled. Thus, the aim of this study was to develop an angle-driven model of overarm throwing and subsequently to use the model along with the kinematic data of overarm throwing to investigate the influence of each joint angle on ball release speed.

2. Materials and Methods
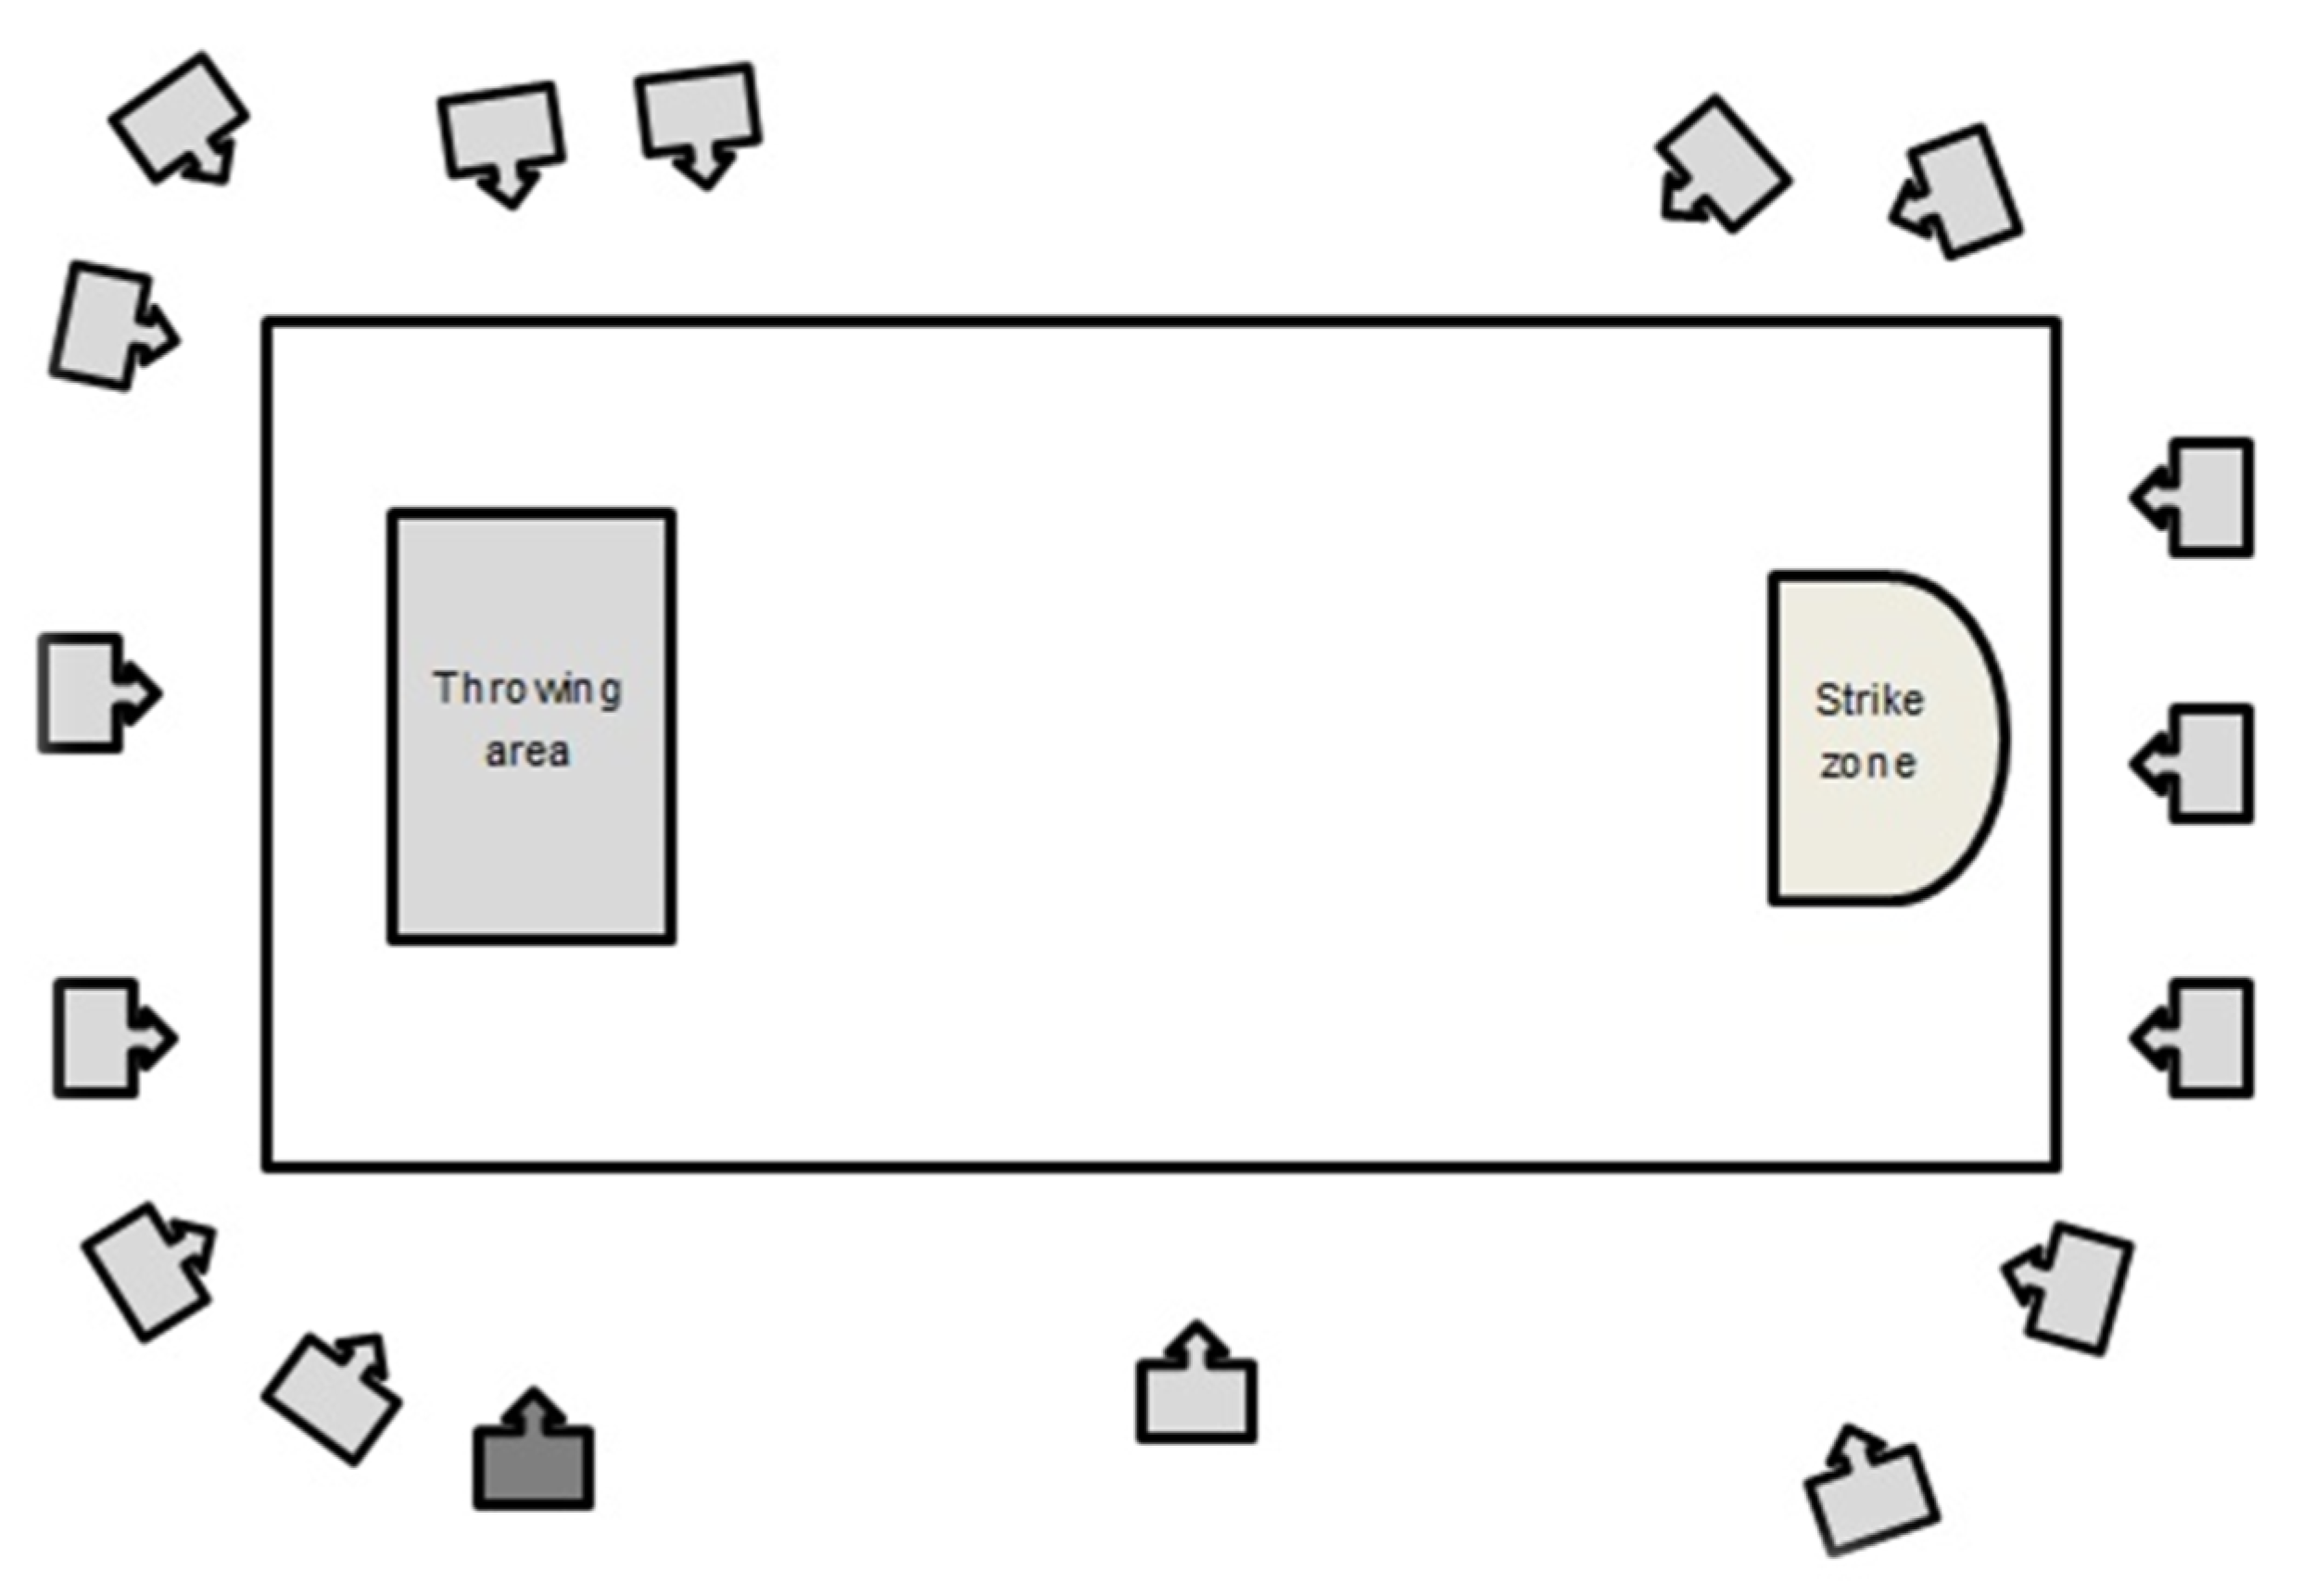
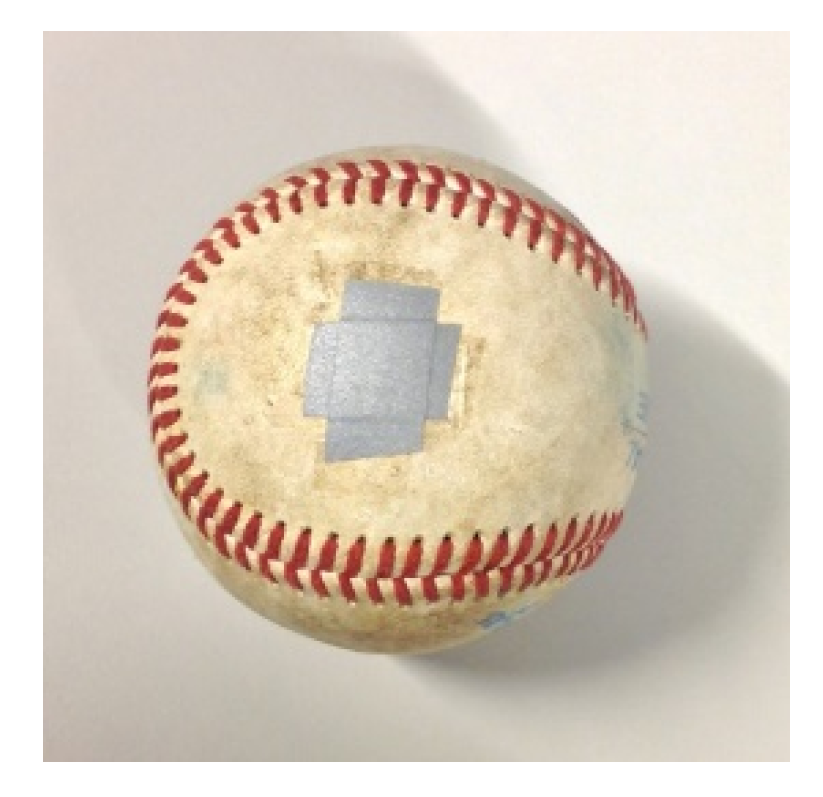
2.1. Experiment

A 16-camera motion analysis system operating at 300 Hz (Vicon, OMG Plc, Oxford, UK) was used to collect kinematic data of a male fastball pitcher (age: 28 years, mass: 89.8 kg, height: 1.89 m) who had experience of pitching at the regional level in the UK. A portable baseball practice net with a strike zone in the centre was located 11.5 m from the throwing area (Figure 1).
Forty-seven 14 mm retro-reflective markers were attached to the pitcher’s body [25,26], and four small pieces of reflective tape were attached on both sides of the ball (Figure 2).
The data collection procedures were explained to the subject in accordance with the Loughborough University ethical guidelines, and an informed consent form was signed. The subject was requested to perform 15 successful maximum effort two-seam fastballs from flat-ground towards the strike zone. Ninety-five anthropometric measurements of the subject were taken and input into an inertia model [27]. The calculated segmental inertia parameters were used in the angle-driven model.

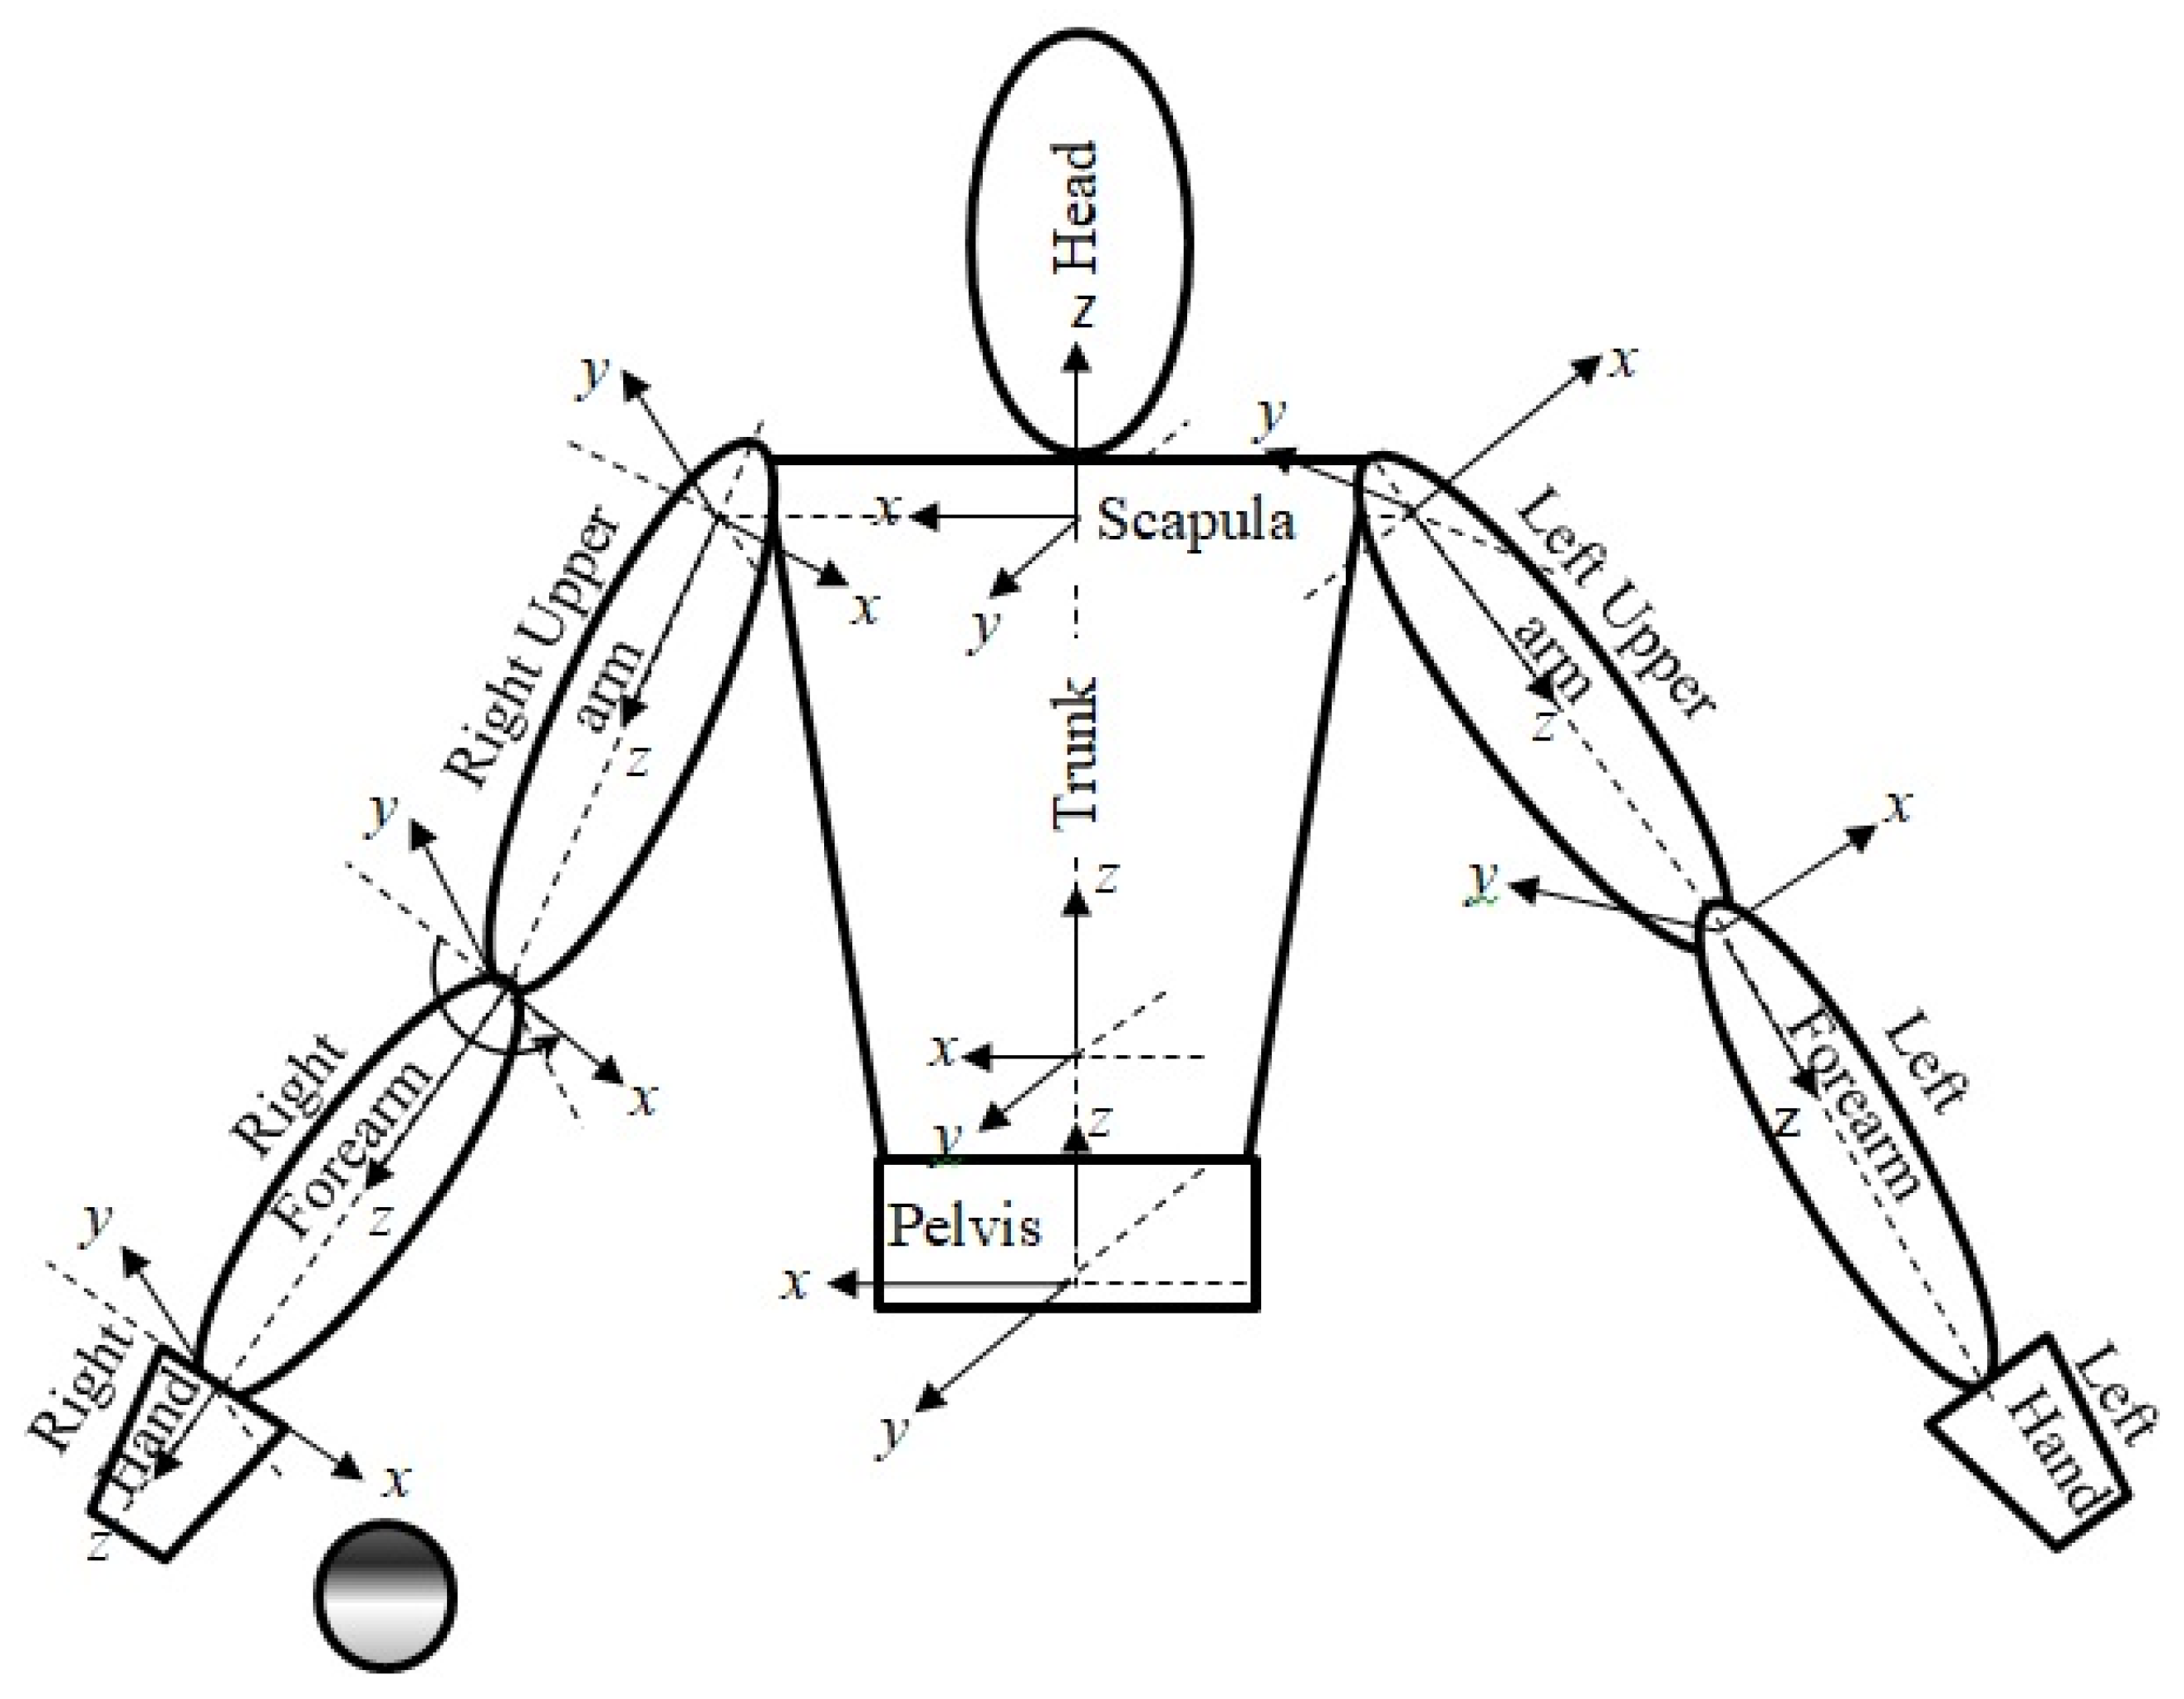
2.2. Simulation Model

The fifteen successful fastball pitching trials were manually labelled within Vicon’s Nexus software. Subsequently, Vicon BodyBuilder software was used to construct a number of segments in order to calculate segmental motion data from the marker trajectories. Rotation at each joint followed the Cardan sequence XYZ (extension–flexion, abduction–adduction, external–internal rotation) [28].
The AutolevTM software package (Version 3.4) was used to formulate the equations of motion for an eight-segment angle-driven model using Kane’s method. The contact between the hand segment and the ball was modelled using massless linear springs in three perpendicular directions with the force in the springs dependent on the displacement and velocity of the springs. The forces in the springs were defined by:
F = k x b x ˙ ,
where F is the force in the spring, k is the stiffness coefficient, b is the damping coefficient, x is the stretch/depression and x ˙ is the velocity.
By considering the ball slipping from the hand to the fingertips at release, the position of the ball in the simulation model was assumed to be at the distal end of the hand segment. Ball release in the experimental data was defined to be the first image where the ball-to-wrist distance was greater than the measured value with ball held at the finger tips in a static trial. Considering previous studies which indicated that peak knee extension of the lead leg has less of a role in transferring energy from lower limb to the ball [3] and that pitchers rely more on energy created in the core and upper extremity [2], it was decided to exclude a direct representation of the lower limbs from the angle-driven model. Instead the movement of the lower limbs was included by constraining the pelvis to move in the same way as in the recorded performances.
The model had eight segments (pelvis, trunk plus head, right and left clavicle as one segment, right and left upper arm, right forearm, right hand and left forearm plus hand), and frictionless pin joints were used to join the segments together (Figure 3). Input to the simulation model was the joint angle time histories and translation of the pelvis from the recorded performances, and the output from the model was ball release speed.

2.3. Investigating the Joint Angle Changes
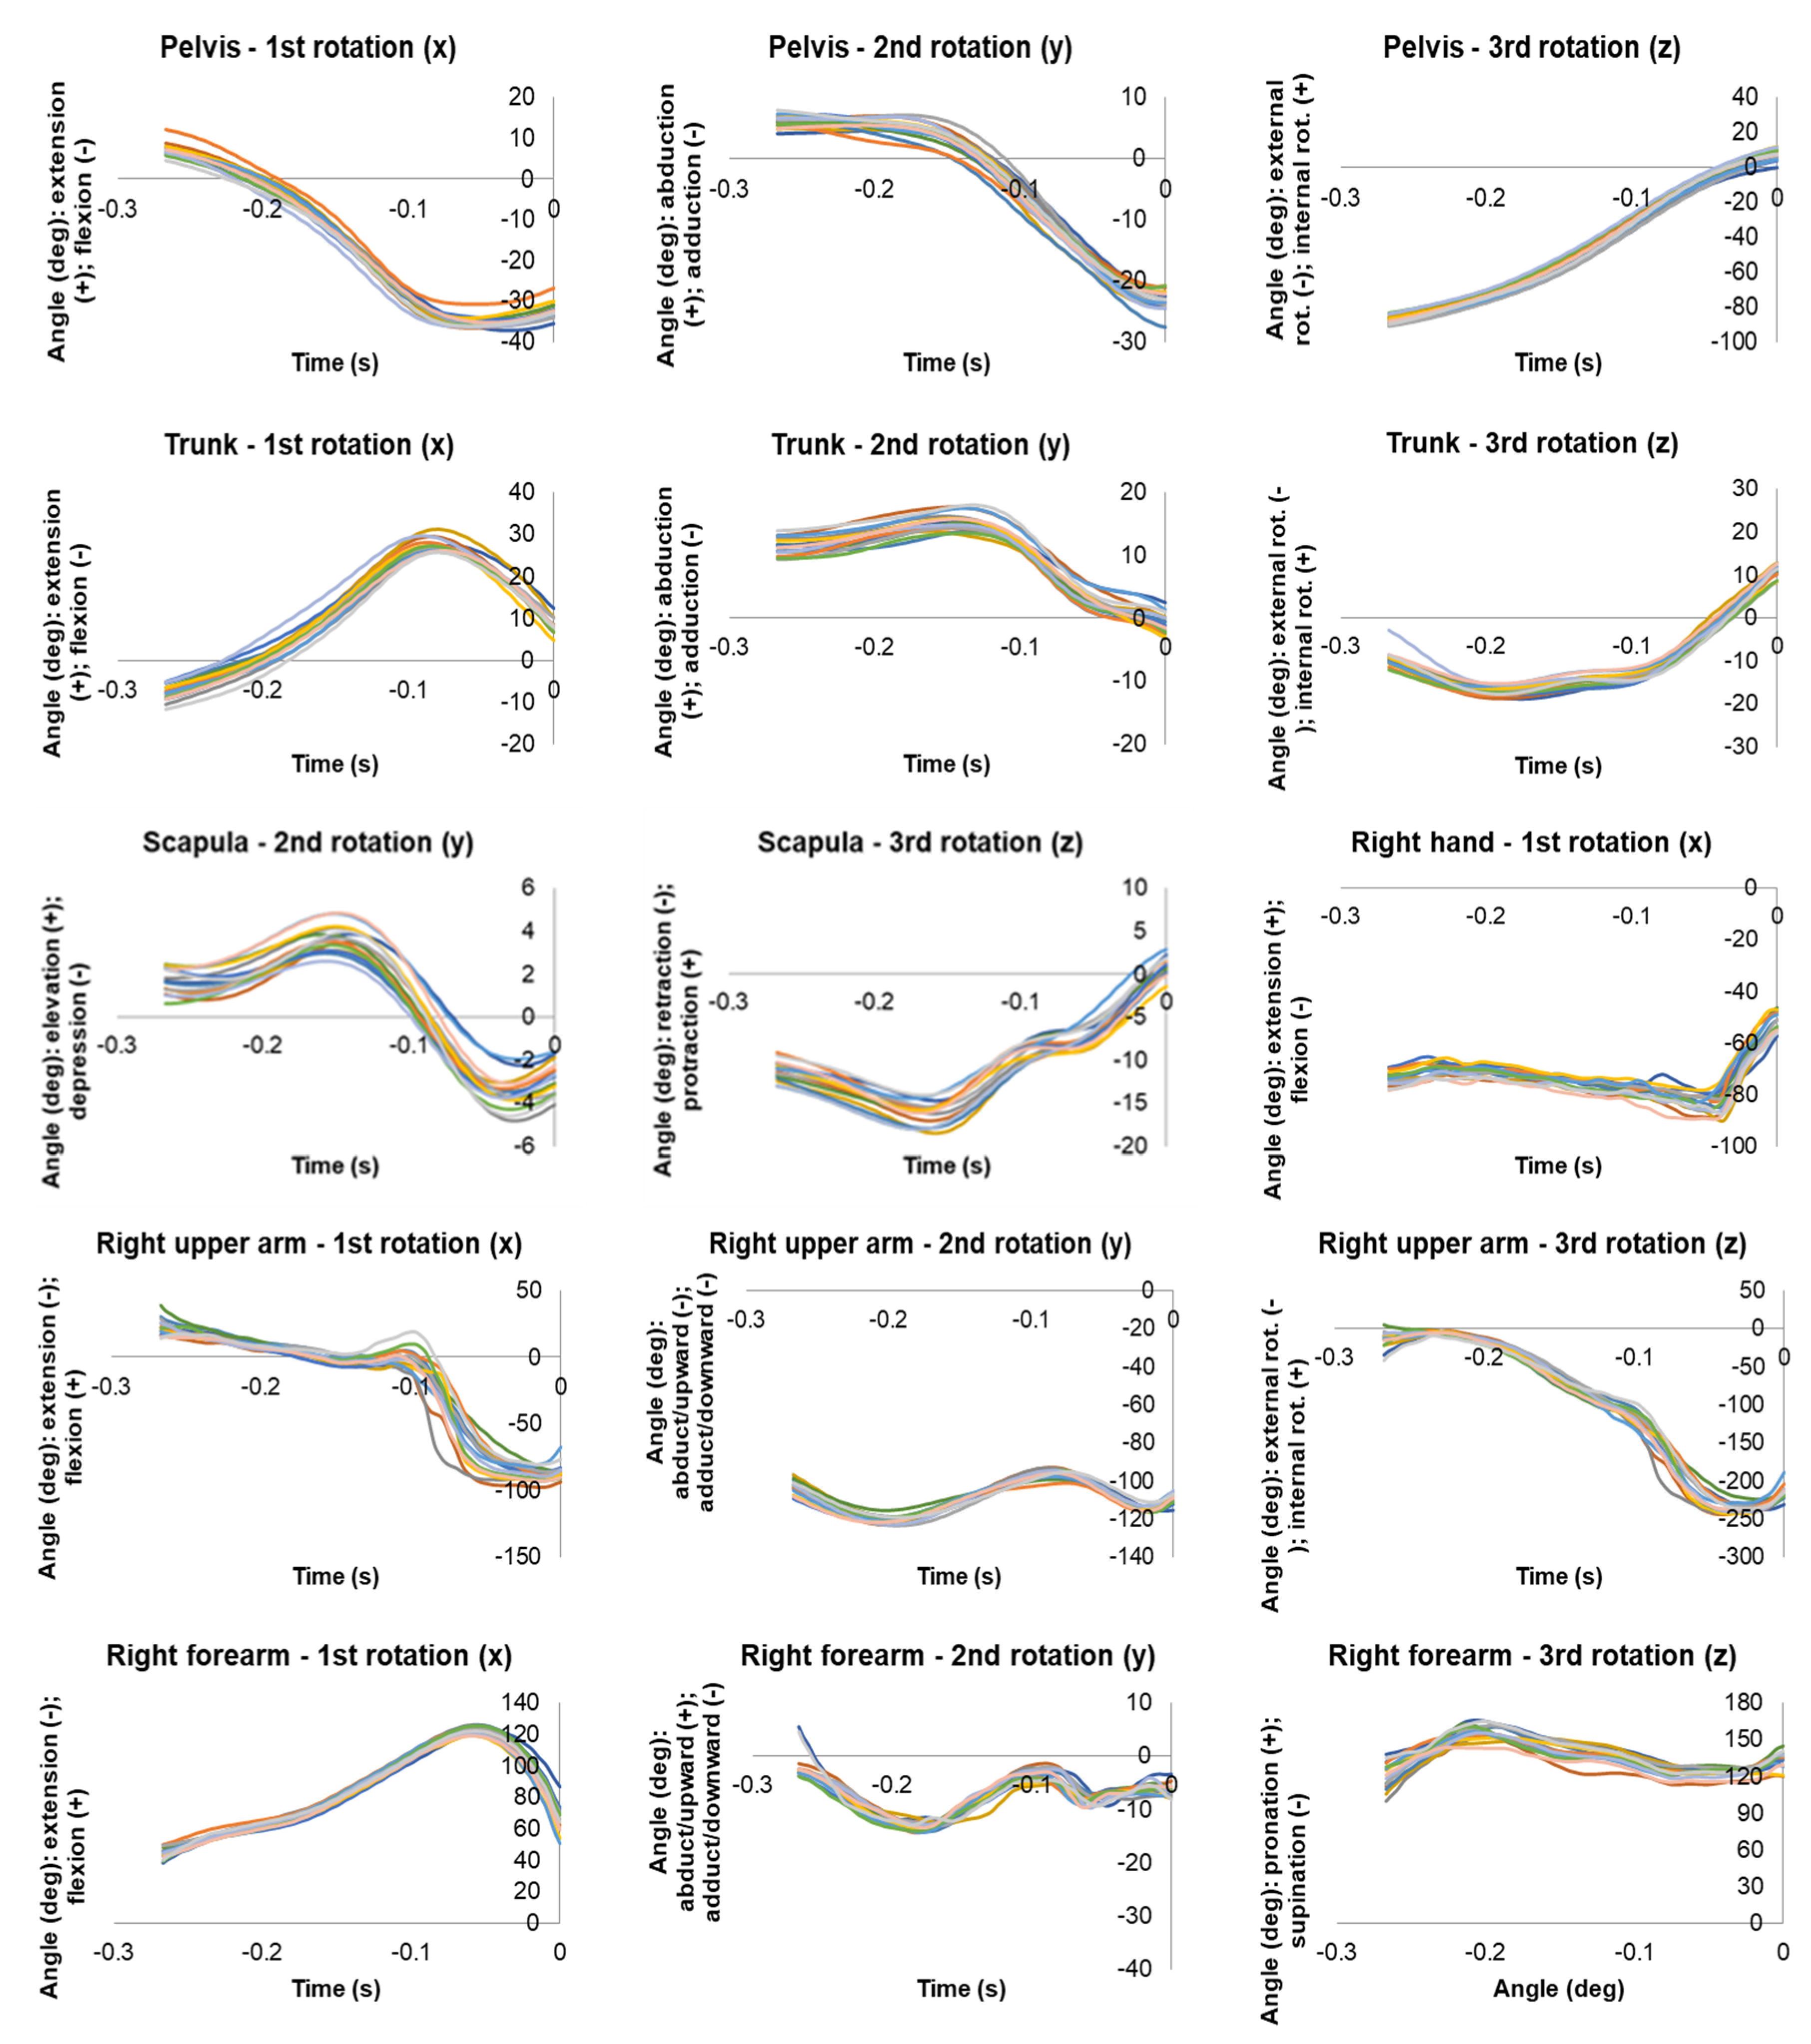
The angle-driven model together with the joint angle changes from the 15 individual trials were used to investigate which joint angle changes have the most effect on ball release speed. At first, the time history of each joint angle obtained from the 15 successful trials (Figure 4) was examined. Next, the angle-driven model was used to investigate how allowing one joint angle to be constant can affect the ball release speed. The constant joint angle was chosen to be the joint angle at ball release, so that the geometry of the system was the same at ball release and the effect of each individual angular velocity being zero could be specifically identified.

3. Results

The 15 trials performed by the male fastball pitcher were consistent in terms of both ball release speed (29.6 ± 0.9 m/s) and also the joint angle time histories with each joint angle time history following the same overall shape (Figure 1).

3.1. Evaluation

Running simulations using the joint angle time histories from each recorded performance showed that the model was appropriate, as good agreement was found with 0.6 m/s being the average absolute difference in resultant ball release speed between the angle-driven simulations and the 15 performances (29.0 m/s mean for simulation, 29.6 m/s mean for performance).

3.2. Simulation

Running simulations with individual joint angles held constant showed that overarm throwing was very sensitive to forearm extension/flexion of the throwing arm, with over 10 m/s reduction in ball speed when this angle was held constant (Table 1).

4. Discussion

The study investigated the influence of joint angle time histories on ball release speed during an overarm throwing task for one experienced pitcher. Joint angle changes at the shoulder were clearly important to overarm throwing ball release speed, as all three joint angle time histories at the shoulder had a substantial effect on ball release speed (more than 3 m/s difference), whilst the joint angle time history that had the largest effect on ball release speed was forearm extension/flexion at the elbow (Table 1). The sequence of joint angle changes that had the largest positive effect on ball release speed were trunk extension/flexion, upper arm external/internal rotation, and forearm extension/flexion. In contrast, the joint angle time histories that had only a small effect on ball release speed (i.e., less than 3 m/s difference in resultant ball speed) were: pelvis (extension/flexion, adduction/abduction, external/internal rotation) trunk (adduction/abduction, external/internal rotation), scapula (elevation/depression, retraction/protraction), right forearm (adduction/abduction, pronation/supination), right hand (extension/flexion, ulnar/radial deviation).
Starting at the origin of the simulation model, the first joint angle in the kinematic/kinetic chain that had a substantial effect on ball release speed was trunk extension/flexion, with the trunk firstly extending and then flexing in the last 100 ms prior to ball release (Figure 4). Using trunk movements to initiate the throwing motion is a key movement pattern that is also seen in other overarm throwing tasks, such as cricket fast bowling where trunk flexion has been identified as one of four factors that contributes to ball release speed [29].
The second key joint was the shoulder where all joint angle changes affected ball release speed; the upper arm remained abducted by over 90 deg throughout the throw, along with being extended and externally rotated before rapidly starting to flex and internally rotate in the last 50 ms prior to ball release. This is similar to cricket fast bowling [29], where the trunk flexes forward and the bowling arm is left circumducted behind the body. So, although the shoulder is a key joint for overarm throwing that has a substantial effect on ball release speed, the mechanisms behind the production of ball release speed start in the trunk. Of the three joint angle changes at the shoulder, upper arm external/internal rotation had the largest effect on ball release speed. The external rotation of the upper arm is produced by the inertial lag of the forearm and hand as the more proximal segments rotate forward [8]. On the other hand, the extreme external rotation of the upper arm is due mainly to the sequential actions of the flexion and abduction muscles at the shoulder [30]. The subsequent stopping of the external rotation and production of internal rotation of the upper arm is due mainly to the actions of the internal rotation proximal joint torque at the shoulder [30].
The third key joint in the kinematic/kinetic chain was the elbow, where forearm extension/flexion had the most effect on ball release speed if it was kept at a constant value (Table 1). In the last 50 ms prior to ball release, the throwing arm extended rapidly through a range of about 60 deg (Figure 4). The acceleration of the forearm in the direction of elbow extension is caused primarily by the interactive moments resulting from the linear acceleration of the shoulder and the angular velocity of the upper arm [8,31]. As the trunk is rotated counter-clockwise and the upper arm undergoes abduction and extension rotations relative to the trunk, forces applied to the forearm at the elbow and directed along the longitudinal axis of the upper arm are essential to maintain the centripetal acceleration of the elbow relative to the shoulder [8,18,31,32]. Mechanically, when a force acts on the trunk, a force with equal magnitude but in the opposite direction will act on the upper arm. These forces will propagate to the elbow joint, forearm, and further outward to produce the angular movements of the adjacent segments.
The final joint in the kinematic/kinetic chain that would appear to have some effect on ball release speed was the wrist, where if the wrist extension/flexion angle was held constant the ball speed changed by 1.6 m/s (Table 1). However, observation of the wrist extension/flexion angle from the 15 trials shows that it was almost constant prior to ball release (Figure 4). The wrist joint is not able to generate large flexion velocities which contribute to the ball speed [33] because the hand is mainly extended in either the arm-cocking phase or the arm acceleration phase, and slightly flexed at ball release [34]. The strategy used by the central nervous system (CNS) is that the elbow and shoulder contribute to the adjustments of ball speed, but the wrist does not [35,36]. As the length of the hand is shorter than that of the forearm and upper arm, the angular velocity of the wrist is less effective for increasing ball speed than the angular velocity of the elbow and shoulder, which is one of the reasons why the wrist does not contribute to the adjustment of ball speed [35]. In addition, the role of the wrist in fastball pitching is to simplify the control of the finger grip force for an accurate ball release.
One element in the kinematic/kinetic chain that surprisingly did not appear to have substantial effect on ball release speed was the motion of the scapula. The effect of scapula external/internal rotation on ball release speed was quite small when the scapula external/internal joint angle was fixed at the value at ball release (Table 1). However, examining the joint angle time histories from the 15 trials shows that prior to ball release the slope of the time history was quite high (Figure 4); this warrants further investigation.
This study focused on the role of the trunk and throwing arm on ball release speed and did not directly include a physical representation of the lower limbs beyond constraining the pelvis to move in the same way as the recorded performances. Consequently, a possible limitation of the simulation model is that the legs were not included explicitly. However, since the accuracy of the matching simulations were good and previous studies have indicated that peak knee extension of the lead leg has less of a role in transferring energy from lower limb to the ball [3] and that pitchers rely more on energy created in the core and upper extremity [2], it was not felt necessary to include an explicit representation of the lower limbs in the model. Furthermore, previous research has shown that the role of pelvis is more to help stabilise the upper body. Although the pelvis external/internal rotation does contribute to ball speed, it occurs between the periods of the beginning of ball arm-cocking to the start of ball acceleration. Starting from ball acceleration to the start of upper arm internal rotation, trunk external/internal rotation appears to be the major contributor to ball speed [5,6,35]. Another limitation is that changing angle time histories to be constant in an angle-driven model may correspond to unrealistic joint torques when this leads to an increase in ball velocity, as was the case for upper arm extension/flexion and adduction/abduction. Nevertheless, these joint angles were identified as having a substantial effect on ball velocity. This study was used to identify joint angles that have a substantial effect on ball release speed for one experienced thrower. This could help inform coaching, and could direct an optimisation of technique study using a torque-driven model. It may be that all pitchers use rather similar techniques or that pitching techniques differ; this needs to be investigated in the future.

5. Conclusions

This study described the development and use of a three-dimensional angle-driven simulation model to investigate overarm throwing. Overarm throwing is a complex 3D movement, and this study highlighted the key joint angle changes that contribute to ball release speed. Computer simulation showed that overarm throwing was sensitive to trunk extension/flexion (5.2 m/s), upper arm extension/flexion (3.4 m/s), upper arm adduction/abduction (4.8 m/s), upper arm external/internal rotation (6.0 m/s); and very sensitive to forearm extension/flexion (10.2 m/s).

Author Contributions

M.A.K. proposed the idea, conceptualized the simulation model and edited the manuscript. N.O. performed experiments, data analysis, scientific discussion and wrote the article. M.R.Y. conceptualized the simulation model, revised the clarity of the work, helping to write and organize the paper, assisted in proper preparations and English corrections.

Funding

This research was funded by Ministry of Higher Education Malaysia and Universiti Malaysia Perlis.

Conflicts of Interest

The authors declare no conflict of interest. The funders had no role in the design of the study; in the collection, analyses, or interpretation of data; in the writing of the manuscript, or in the decision to publish the results.

References

  1. Hong, D.A.; Cheung, T.K.; Roberts, E.M.A. A three-dimensional, six-segment chain analysis of forceful overarm throwing. J. Electromyogr. Kinesiol. 2001, 11, 95–112. [Google Scholar] [CrossRef]
  2. Laudner, K.G.; Moore, S.D.; Sipes, R.C.; Meister, K. Functional hip characteristics of baseball pitchers and position players. Am. J. Sports Med. 2010, 38, 383–387. [Google Scholar] [CrossRef] [PubMed]
  3. Milewski, M.D.; Õunpuu, S.; Solomito, M.; Westwell, M.; Nissen, C.W. Adolescent baseball pitching technique: Lower extremity biomechanical analysis. J. Appl. Biomech. 2012, 28, 491–501. [Google Scholar] [CrossRef] [PubMed]
  4. Oliver, G.D.; Weimar, W.H. Hip and shoulder range of motion in youth baseball pitchers. J. Strength Cond. Res. 2016, 30, 2823–2827. [Google Scholar] [CrossRef] [PubMed]
  5. Stodden, D.F.; Langendorfer, S.J.; Fleisig, G.S.; Andrews, J.R. Kinematic constraints associated with the acquisition of overarm throwing part II: Upper extremity actions. Res. Q. Exerc. Sport 2006, 77, 428–436. [Google Scholar] [CrossRef] [PubMed]
  6. Stodden, D.F.; Fleisig, G.S.; McLean, S.P.; Lyman, S.L.; Andrews, J.R. Relationship of pelvis and upper torso kinematics to pitched baseball velocity. J. Appl. Biomech. 2001, 17, 164–172. [Google Scholar] [CrossRef]
  7. Escamilla, R.F.; Barrentine, S.W.; Fleisig, G.S.; Zheng, N.; Takada, Y.; Kingsley, D.; Andrews, J.R. Pitching biomechanics as a pitcher approaches muscular fatigue during a simulated baseball game. Am. J. Sports Med. 2007, 35, 23–33. [Google Scholar] [CrossRef] [PubMed]
  8. Feltner, M.; Dapena, J. Dynamics of the shoulder and elbow joints of the throwing arm during a baseball pitch. Int. J. Sport Biomech. 1986, 2, 235–259. [Google Scholar] [CrossRef]
  9. Fleisig, G.S.; Andrews, J.R.; Dillman, C.J.; Escamilla, R.F. Kinetics of baseball pitching with implications about injury mechanisms. Am. J. Sports Med. 1995, 23, 233–239. [Google Scholar] [CrossRef] [PubMed]
  10. Fleisig, G.S.; Escamilla, R.E. Biomechanics of the elbow in the throwing athlete. Oper. Tech. Sports Med. 1996, 4, 62–68. [Google Scholar] [CrossRef]
  11. Fleisig, G.S.; Phillips, R.; Shatley, A.; Loftice, J.; Dun, S.; Drake, S.; Farris, J.W.; Andrews, J.R. Kinematics and kinetics of youth baseball pitching with standard and lightweight balls. Sports Eng. 2006, 9, 155–163. [Google Scholar] [CrossRef]
  12. Kageyama, M.; Sugiyama, T.; Takai, Y.; Kanehisa, H.; Maeda, A. Kinematic and kinetic profiles of trunk and lower limbs during baseball pitching in collegiate pitchers. J. Sports Sci. Med. 2014, 13, 742–750. [Google Scholar] [PubMed]
  13. MacWilliams, B.A.; Choi, T.; Perezous, M.K.; Chao, E.Y.; McFarland, E.G. Characteristic ground-reaction forces in baseball pitching. Am. J. Sports Med. 1998, 26, 66–71. [Google Scholar] [CrossRef] [PubMed]
  14. Glousman, R.; Jobe, F.; Tibone, J.; Moynes, D.; Antonelli, D.; Perry, J. Dynamic electromyographic analysis of the throwing shoulder with glenohumeral instability. J. Bone Joint Surg. Am. 1988, 70, 220–226. [Google Scholar] [CrossRef] [PubMed]
  15. Watkins, R.G.; Dennis, S.; Dillin, W.H.; Schnebel, B.; Schneiderman, G.; Jobe, F.; Farfan, H.; Perry, J.; Pink, M. Dynamic EMG analysis of torque transfer in professional baseball pitchers. Spine 1989, 14, 404–408. [Google Scholar] [CrossRef] [PubMed]
  16. Roach, N.T.; Lieberman, D.E. Upper Body Contributions to power generation during rapid, overhand throwing in humans. J. Exp. Biol. 2014, 217, 2139–2149. [Google Scholar] [CrossRef] [PubMed]
  17. Chowdhary, A.G.; Challis, J.H. The Biomechanics of an overarm throwing task: A simulation model examination of optimal timing of muscle activations. J. Theor. Biol. 2001, 211, 39–53. [Google Scholar] [CrossRef] [PubMed]
  18. Feltner, M.E.; Dapena, J. Three-dimensional interactions in a two-segment kinetic chain. part I: General model. Int. J. Sport Biomech. 1989, 5, 403–419. [Google Scholar] [CrossRef]
  19. Fujii, N.; Hubbard, M. Validation of a three-dimensional baseball pitching model. J. Appl. Biomech. 2002, 18, 135–154. [Google Scholar] [CrossRef]
  20. Hirashima, M.; Yamane, K.; Nakamura, Y.; Ohtsuki, T. Kinetic chain of overarm throwing in terms of joint rotations revealed by induced acceleration analysis. J. Biomech. 2008, 41, 2874–2883. [Google Scholar] [CrossRef] [PubMed]
  21. Naito, K.; Maruyama, T. Contributions of the muscular torques and motion-dependent torques to generate rapid elbow extension during overhand baseball pitching. Sports Eng. 2008, 11, 47–56. [Google Scholar] [CrossRef]
  22. Naito, K.; Takagi, H.; Yamada, N.; Hashimoto, S.; Maruyama, T. Intersegmental dynamics of 3D upper arm and forearm longitudinal axis rotations during baseball pitching. Hum. Mov. Sci. 2014, 38, 116–132. [Google Scholar] [CrossRef] [PubMed]
  23. King, M.A. Computer simulation modelling in sports biomechanics. Biomech Sports 29. Port. J. Sport Sci. 2011, 11, 19–22. [Google Scholar]
  24. Yeadon, M.R.; King, M.A. Computer simulation modelling in sport. In Biomechanical Evaluation of Movement in Sport and Exercise, 2nd ed.; Payton, C.J., Burden, A., Eds.; Routledge: London, UK, 2018; pp. 221–254. ISBN 9780415632669. [Google Scholar]
  25. Hore, J.; O’Brien, M.; Watts, S. Control of joint rotations in overarm throws of different speeds made by dominant and nondominant arms. J. Neurophysiol. 2005, 94, 3975–3986. [Google Scholar] [CrossRef] [PubMed]
  26. Jegede, E.; Watts, S.; Stitt, L.; Hore, J. Timing of ball release in overarm throws affects ball speed in unskilled but not skilled individuals. J. Sports Sci. 2005, 23, 805–816. [Google Scholar] [CrossRef] [PubMed]
  27. Yeadon, M.R. The Simulation of Aerial Movement-II. A mathematical inertia model of the human body. J. Biomech. 1990, 23, 67–74. [Google Scholar] [CrossRef]
  28. Yeadon, M.R. The Simulation of Aerial Movement-I. The determination of orientation angles from film data. J. Biomech. 1990, 23, 59–66. [Google Scholar] [CrossRef]
  29. Worthington, P.J.; King, M.A.; Ranson, C.A. Relationships between fast bowling technique and ball release speed in cricket. J. Appl. Biomech. 2013, 29, 78–84. [Google Scholar] [CrossRef] [PubMed]
  30. Feltner, M.E. Three-dimensional interactions in a two-segment kinetic chain. Part II: Application to the throwing arm in baseball pitching. Int. J. Sport Biomech. 1989, 5, 420–450. [Google Scholar] [CrossRef]
  31. Feltner, M.E.; Taylor, G. Three-dimensional kinetics of the shoulder, elbow, and wrist during a penalty throw in water polo. J. Appl. Biomech. 1997, 13, 347–372. [Google Scholar] [CrossRef]
  32. Kim, Y.K.; Hinrichs, R.N.; Dounskaia, N. Multicomponent control strategy underlying production of maximal hand velocity during arm swing. J. Neurophysiol. 2009, 102, 2889–2899. [Google Scholar] [CrossRef] [PubMed]
  33. Hirashima, M.; Kudo, K.; Ohtsuki, T. Utilization and compensation of interaction torque during ball-throwing movements. J. Neurophysiol. 2003, 89, 1784–1796. [Google Scholar] [CrossRef] [PubMed]
  34. Barrentine, S.W.; Matsuo, T.; Escamilla, R.F.; Fleisig, G.S.; Andrews, J.R. Kinematic analysis of the wrist and forearm during baseball pitching. J. Appl. Biomech. 1998, 14, 24–39. [Google Scholar] [CrossRef]
  35. Feltner, M.E.; Nelson, S.T. Three-Dimensional Kinematics of the Throwing Arm during the Penalty Throw in Water Polo. J. Appl. Biomech. 1996, 12, 359–382. [Google Scholar] [CrossRef]
  36. Atwater, A.E. Biomechanics of overarm throwing movements and of throwing injuries. Exerc. Sport Sci. Rev. 1979, 7, 43–85. [Google Scholar] [CrossRef] [PubMed]
Figure 1. Schematic of experimental set-up; light grey arrows represent Vicon cameras and dark grey arrow represents video camera.
Applsci 09 00999 g001
Figure 2. Ball with reflective markers.
Applsci 09 00999 g002
Figure 3. Segments used within the angle-driven model.
Applsci 09 00999 g003
Figure 4. Joint angle time histories for the 15 recorded trials (ball release at time zero).
Applsci 09 00999 g004
Table 1. Change in ball release speed as each joint angle was kept constant.
Constant Joint AngleMean Difference in x-Axis (m/s)Mean Difference in y-Axis (m/s)Mean Difference in z-Axis (m/s)Mean Difference in Resultant Speed (m/s)
Pelvis extension/flexion−0.031.36−0.59+1.35
Pelvis adduction/abduction0.39−0.07−0.11−0.11
Pelvis external/internal rotation−0.25−1.65−2.04−1.53
Trunk extension/flexion0.86−5.25−0.53−5.22
Trunk adduction/abduction2.08−0.01−0.760.04
Trunk external/internal rotation0.31−2.75−1.63−2.67
Scapula adduction/abduction−0.290.050.300.03
Scapula external/internal rotation0.23−1.39−2.26−1.25
Right upper arm extension/flexion−1.503.11−3.32+3.40
Right upper arm adduction/abduction1.094.75−2.26+4.84
Right upper arm external/internal rotation12.15−9.82−4.85−6.03
Right forearm extension/flexion−11.77−14.86−1.57−10.15
Right forearm adduction/abduction0.33−0.35−0.19−0.37
Right forearm pronation/supination−0.020.070.070.05
Right hand extension/flexion0.49−2.08−4.55−1.59
Right hand ulnar/radial deviation0.010.01−0.01−0.03

