1. Introduction
Transformers play a major role in power distribution systems. They are expected to be in operation for at least 30 years, sometimes even in very unfavorable conditions. One of the key values in power distribution is availability, as its increased value over longer timespans translates into less total distribution costs for operators and an increase in the volume of energy sales. When it comes to older units, owners often have to decide whether to further operate them with some technical restrictions, schedule major maintenance, or withdraw the from further operation and replace them with new units.
During their lifetime, transformers undergo maintenance and measurements to assess their technical condition. The basic measurements do not require transformers to go offline for a long period of time, therefore they are commonly used. The advanced methods are used much less frequently (usually once in a couple of years), since they are costly and more time-consuming. Regular, comprehensive measurements, however, give users detailed information about the transformers actual technical state, and using this information the operator can decide if any actions should be taken in the future.
A detailed survey [
1] has been conducted to analyze the causes of transformer failure in high voltage systems. The main failure modes across all voltage classes are dielectrical (36.6%), mechanical (20.0%), electrical (16.5%), and thermal (10.9%). The methods, which have recently been used to comprehensively assess transformer technical condition, are described in [
2]. Lately, approaches have been made to unify transformer measurement data into a single health index. Some of them [
3,
4] are already in use, but unfortunately they are not complex enough, as they mainly focus on dissolved gas analysis (DGA) and physical-chemical oil data. In a study including a mathematical Markovian model [
5], authors attempt to find the optimum timespan between two specific inspections (DGA and FRA) in order to maximize availability and optimize maintenance costs.
Frequency Response Analysis (FRA) is a test method used for assessment of mechanical condition of a transformer active parts. It is based on the measurement of winding response to a wide frequency sine signal. FRA is a comparative method, in which differences between two frequency response curves are analyzed, therefore it needs some “fingerprint” data measured in the transformer healthy state (the best option is right after installation). It is utilized as a diagnostic technique following such incidents as short circuits or lightning strikes. However, assessments using this method can provide critical information on a transformer winding state and may eventually lead to strategic decisions to remove the unit from further operation. At the current stage of FRA method development, it is possible to perform repetitive measurements. In 2012, an IEC standard on a measuring technology [
6] was published, and most available commercial devices fulfill its requirements. The biggest problem of FRA method is interpretation of test results, namely the relationship between the scale of differences between curves and decision for further operation of a given transformer. Very often, visible differences between two FRA curves recorded for the same winding over time do not mean that there is a deformation in the winding. The cause of curve shift (resonance shift or damping change) may come from other elements of the transformer, e.g., different positions of the on-load tap changer (OLTC) or core magnetization caused by previous DC measurements, which influence inductance parameters. Similarly, some changes, like bushing replacement, may influence capacitive parameters [
7,
8,
9,
10]. Usually in industrial measurements, results are recorded in one test configuration: end-to-end open. In such cases, only the winding of the measured voltage side is taken into consideration, with some capacitive influence of other windings. At present, the FRA method is one of test methods commonly used in the group of advanced diagnostics of transformers, therefore any help in understanding the relationship between the results and the tested object leads to improvement of interpretation quality.
Research on interpretation of FRA results has been conducted for years, and there are different experimental [
11,
12] or modeling techniques [
13,
14,
15] used to help find correlations between visible changes in the frequency response curve and actual mechanical or electrical problems in transformers related to capacitance or inductance changes. This paper takes under consideration the influence these two parameters have on transformer frequency response (FR). The analysis is performed with a computer model of a transformer with introduced modifications resulting in capacitance and inductance changes. Results obtained from the model, in which changes of parameters are fully controlled, allow for good understanding of the relationship between curve shape changes and object properties. These results are free from additional interferences and effects, as is usually the case in industrial measurements, therefore providing direct relationships between introduced changes and obtained conclusions. In the next step there are some experimental results presented, showing the influence of capacitance and inductance changes on the FR of real transformers. It was achieved by measuring the frequency response for different on-load tap changer positions (inductance change) and by adding an additional capacitance to the bushing in the phase that was not under measurement (capacitance change). The main aim of the paper is to provide analysis on correlations between changes in capacitive and inductive parameters and their effect on the FR curve shape. With this knowledge it will be easier to identify measurement mistakes (like wrong tap position).
2. Parameters Influencing the Frequency Response of Transformer Windings
FRA method, widely used in advanced transformer diagnostics for over a decade, has been standardized [
6,
16] and its main problem lies in interpreting detected changes in the shape of FR characteristics. Test results are usually presented as Bode plots, with amplitude values calculated as a signal damping (in dB) and phase angle shift in degrees. The amplitude is often marked as
FRA, so it can be written:
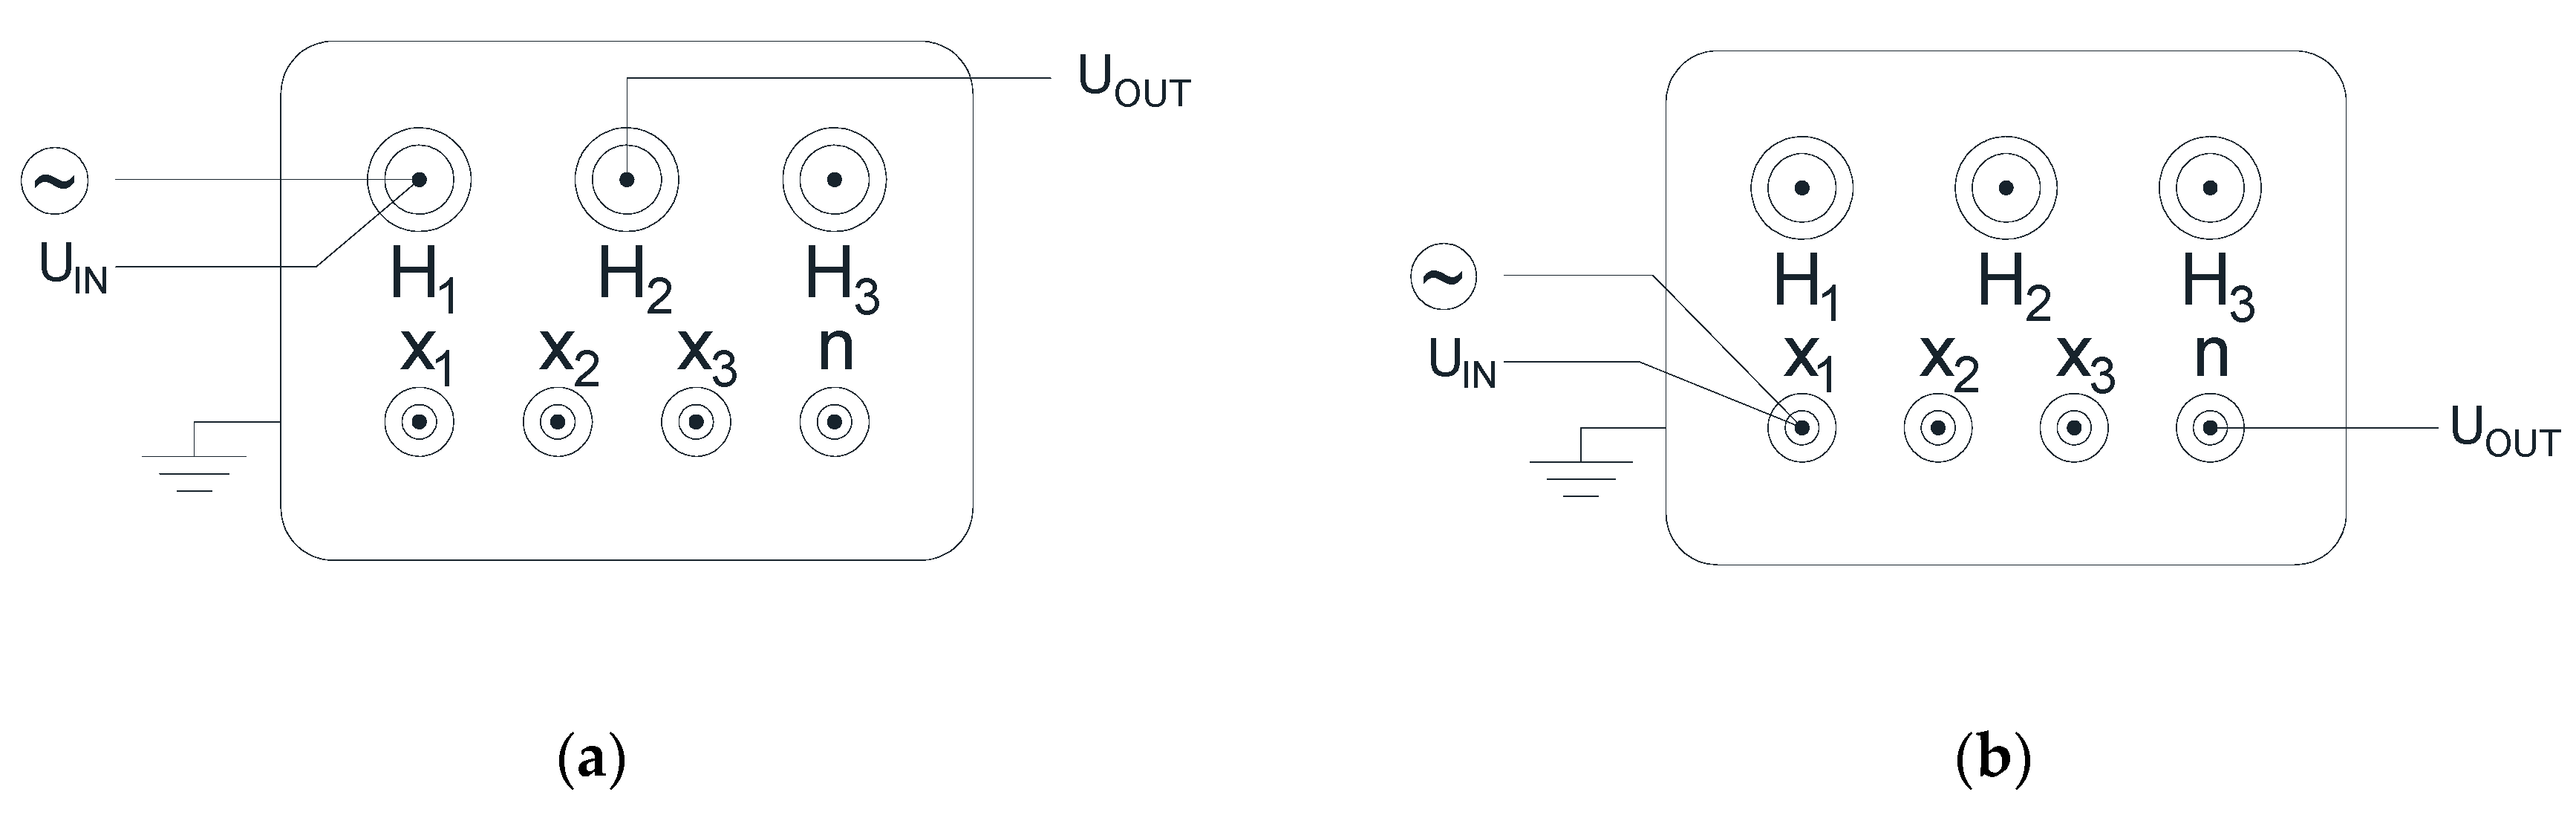
As was already mentioned, FR can be measured in various test configurations, however, according to the standard [
6], the main configuration is end-to-end open test setup, where the signal is applied to the beginning of the winding and measured at its end, with remaining windings left open. All results presented in this paper are based on this configuration, which is presented in
Figure 1. For delta connected windings, the signal is given on the bushing connected to the beginning of a tested phase and measured at this point (U
in). The second measuring channel is connected to the bushing where the end of the winding in the tested phase is led out (U
out), shown in
Figure 1a. In the delta winding configuration, part of the signal is also transferred through both remaining phases. In the case of star connected windings, input voltage (U
in) is measured on bushings connected to the beginning of the tested phase, while output voltage channel (U
out)) is connected to the neutral bushing. The signal is transferred only through the tested winding, however obvious couplings to other windings also appear in FR.
The frequency response depends also on the column on which the measurement is taken. When measurement results are compared between phases, there are always similar visible differences in the low frequency range. These changes are the effect of various magnetic flux distributions, which for the middle column is symmetrical (via two side columns) and for side columns asymmetrical (via middle one and opposite side columns). Additionally, some smaller differences in the middle frequency range can be observed, if two phases are compared.
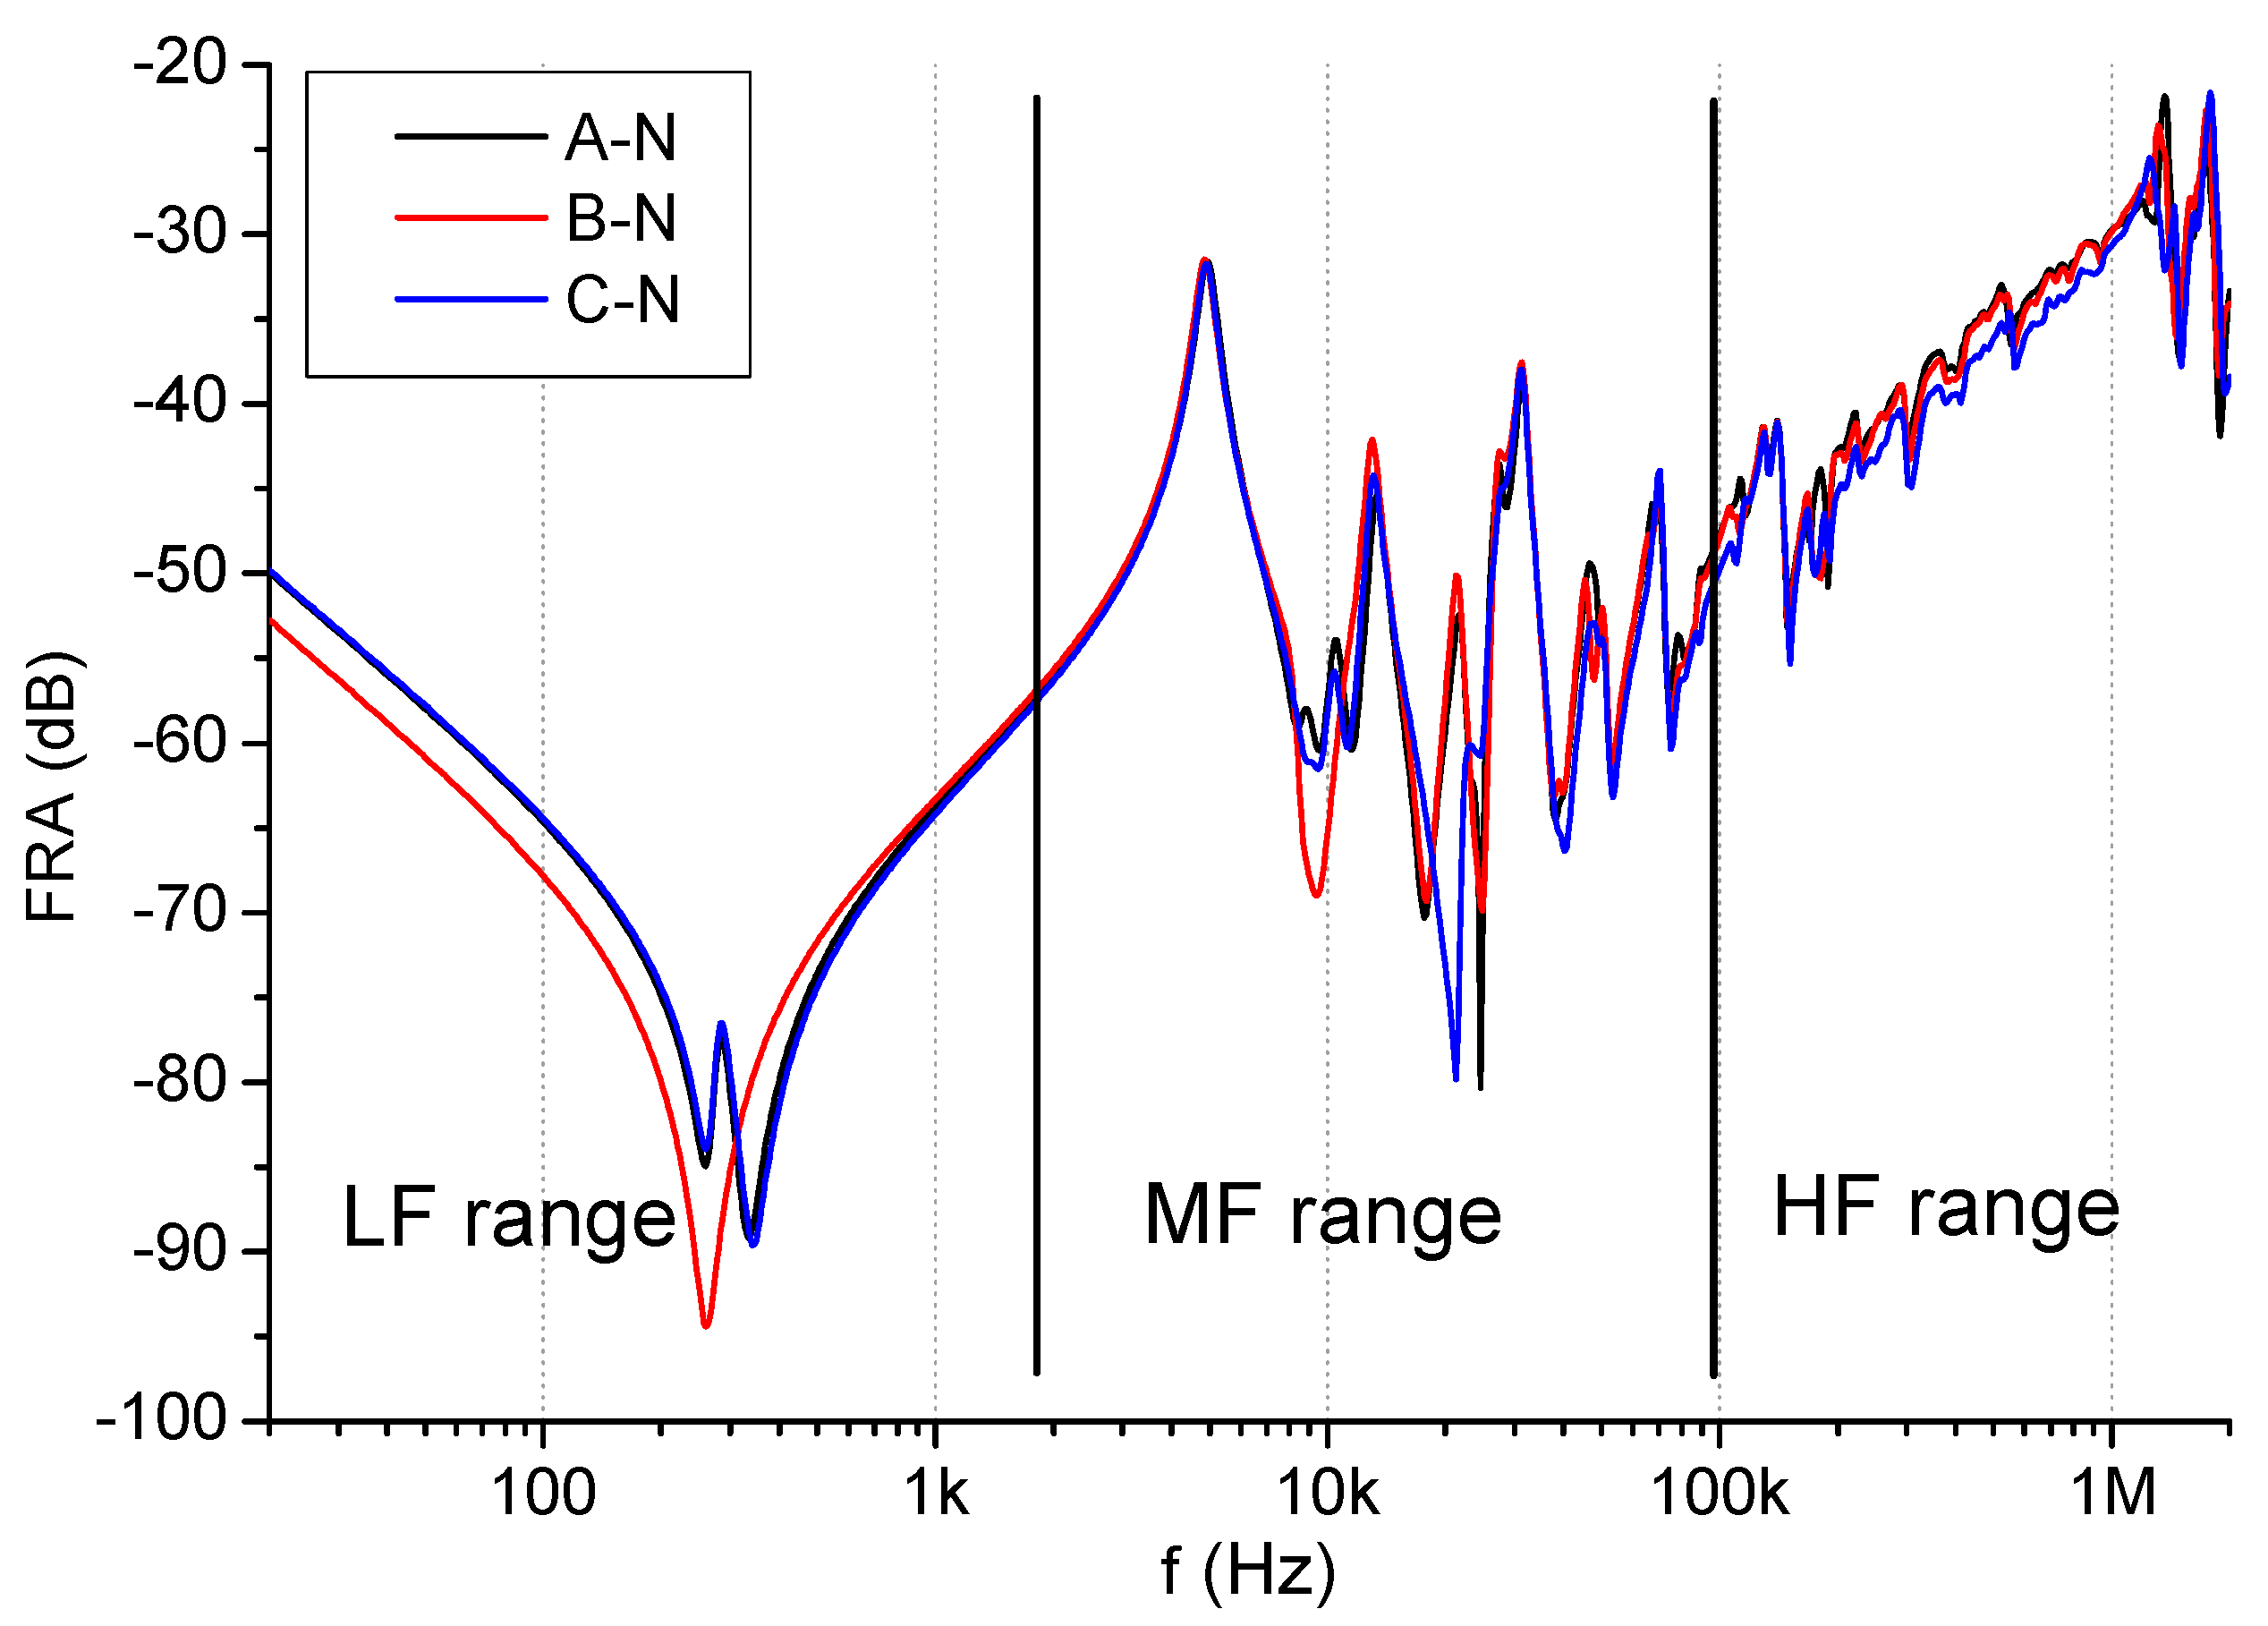
The FRA results are presented as the frequency function in logarithmic scale, allowing analysis of results in each frequency range, but occasionally linear scale is applied. The FR curve shape is mainly determined by winding inductances and capacitances. During assessment, the FR range is usually divided into three main subranges, sometimes including additional sub-bands. These ranges are as follows: low, medium, and high frequencies. Their exact borders depend on the construction of the transformer, mainly on its geometrical size, usually related to its power rating. Therefore, it is not possible to perform analysis in predefined frequency ranges. The bigger the transformer, the higher the values of inner capacitances, thus the frequency response is shifted into lower frequencies [
8]. The behavior at the low frequency (LF) range is usually considered as the interaction of the magnetizing inductance and bulk capacitance to the ground of the winding taken under consideration. In the lowest frequency range (starting at 20 Hz, according to [
6]), winding inductances are dominant, resulting in a decreasing characteristic. When the first resonance is reached, the dominant influence of the winding capacitances appears (
Figure 2), reaching the end of the LF range. This range is strongly influenced by short-circuits between the turns or coils, because the magnetic circuit still influences the response in such low frequencies [
17,
18,
19]. The low-frequency range is often omitted in test result analysis, because it shows natural differences between the three phases, due to various magnetic flux distributions in the middle and side columns of the core, which results in a single or double minimum of the main parallel resonance. This frequency range can also be affected by the previous DC measurements, resulting in core magnetization or by core construction [
17,
20]. The low frequency range finishes at the inflection point of the increasing capacitive slope of the FR curve until the next series resonance, from which FR analysis usually starts for the medium frequency range. The position of the first resonance depends on the winding self-inductance and total series and shunt capacitances.
The medium frequency (MF) range is sensitive to changes caused by local deformations or displacement, therefore it is usually used for the analysis of measured data. The high frequency HF range is influenced by test setup itself, connection quality and wave phenomena in windings, so it is usually omitted in the analysis.
The changes of inductive or capacitive parameters of the transformer have strong influence on LF range, especially on the position of the first resonance. Additionally, they also influence more complex phenomena resulting in visible changes in the medium frequency range. By observing changes in both mentioned frequency ranges it is possible to determine whether visible changes are the results of deformation or if they come from some construction changes, e.g., the wrong tap position of OLTC during transformer measurement. FRA data are usually interpreted after performing measurements on-site, therefore it is difficult to check if there were no accidental mistakes during tests (like the mentioned wrong tap position). The analysis presented in this paper allows to understand the influence of different parameters on FR curve.
3. Model of Inductance and Capacitance Changes on FR Curve
The computer model has been prepared in order to verify the conception that capacitance from other windings and additional inductances (e.g., from the tap changer) could balance out. As a result, the first parallel resonance would remain in its original position, but some changes in the MF range could be expected.
3.1. 2D Computer Model of the Winding in FEM Software
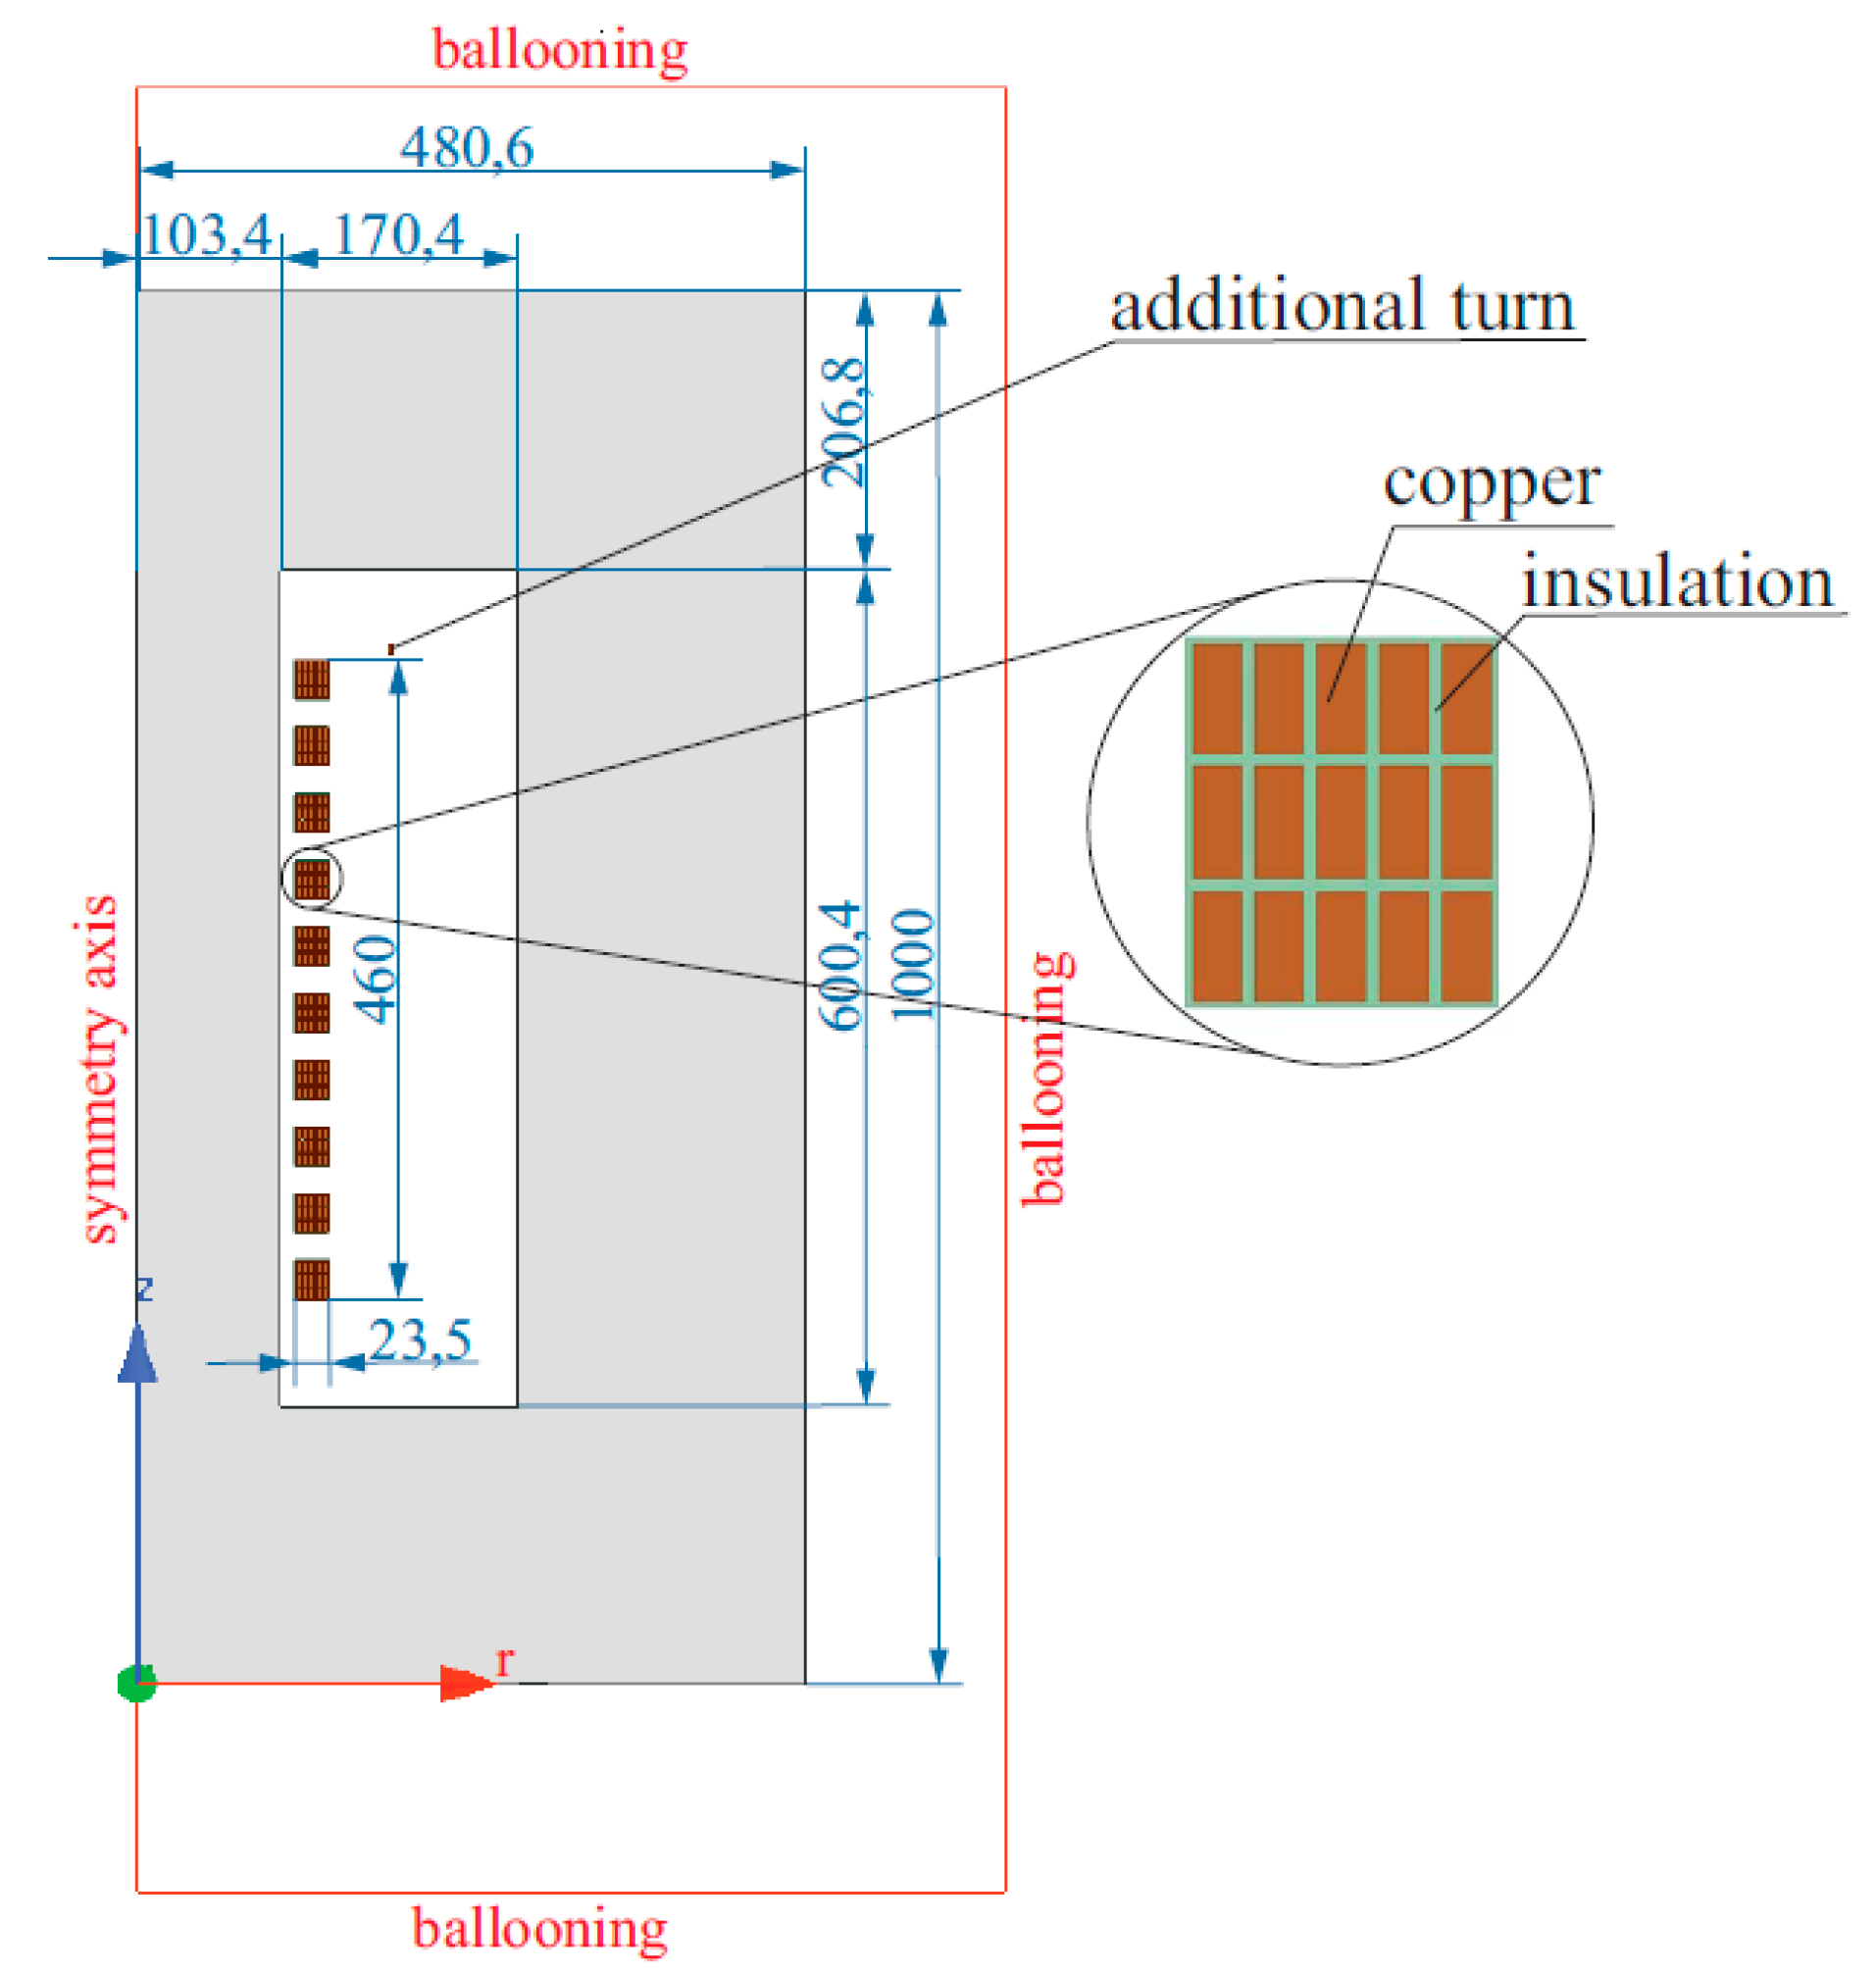
The model is based on the Finite Elements Method (FEM) in two-dimensional cylindrical symmetry. The geometry of the model shown in
Figure 3 corresponds to the dimensions of the typical LV winding of the distribution transformer (800 kVA, 15/0.4 kV, Dyn5). The complicated construction of the actual transformer makes the 3D simulation computationally costly and impractical, thus it was necessary to use the simplified 2D model. During the analysis, the solver assumed that the 2D geometry of the model being studied sweeps 360° around the z-axis of a cylindrical coordinate system. This model, in particular, does not take into account the existence of the other core columns, but it allows for the simulation to be performed, showing the influence of
C and
L parameters with satisfactory accuracy.
Simulated cross-over winding nominally has 450 turns. Separate models were made to show the influence of changing the position of the tap changer +/- 10% in tapping turn range. These models are similar to the basic one shown in
Figure 3, with the difference being that they contain 405 and 495 turns. One section of the winding has been magnified to show that all turns with inter-wire insulation were taken into account during analysis. On the top of the core window, the additional wire provides the connection to the bushing capacitance. This influence of bushings can be modeled as a single element, because during the measurement the winding is seen as a concentrated inductance and capacitance. The treatment as additional wire also allows modification of bushing capacitances [
21,
22]. On external boundaries, the so-called “ballooning” boundary condition has been stated. It allows one to cut off the region of analysis near to the object.
The software used for the simulations was ANSYS Maxwell v. 19.2, especially the 2D eddy current solver, which computes steady-state, time-varying (AC) magnetic fields at a given frequency. The following equations (3)–(10) were chosen in the Maxwell calculation package. They allow calculation of necessary
R,
L, and
C parameters. The eddy current field solver calculates the electromagnetic field by solving the magnetic vector potential and the electric scalar potential in the field equation:
where
A is magnetic vector potential,
ϕ is electric scalar potential,
μ is magnetic permeability,
ω is angular frequency at which all quantities are oscillating,
γ is conductivity, and
ε is permittivity.
The inductances of the coil, both self and mutual, have been computed by ANSYS Maxwell using the energy of the electromagnetic field delivered by FEM:
where
WAV is average energy of the magnetic field,
L is inductance,
B is magnetic flux density,
H* is magnetic field intensity conjugate, and
IPeak is peak current value.
Wire resistance values were calculated from the power losses
P due to current flow with density
J:
In order to calculate self and mutual capacitances, the following electrostatic field equation has been solved:
where
ρ is charge density,
ϕ is scalar potential of the electric field induced with charge density
ρ,
ε0 is vacuum permeability, and
εr is relative permeability of the environment.
Similarly as in the case of winding inductance, the capacitance is obtained in Maxwell using the energy stored in the electric field associated with the capacitance between two conductors:
The capacitance between conductors
i and
j is therefore:
where
Wij is energy of the electric field,
Di is electric flux density,
Ej is electric field intensity, and
V is voltage.
The computation domain is reduced due to the cylindrical symmetry of the model. The problem area was discretized with approximately 30,000 triangular elements of the second order. The parameters R, L, and C of the winding were determined as a function of frequency from the field model and used in further network calculations to evaluate the frequency response of the winding.
The values of inductances and resistances were obtained in the form of impedance matrices for given frequencies. L and R values laying between the analyzed frequency points were obtained using linear interpolation. The capacitances were determined with the assumption that they do not depend on frequency.
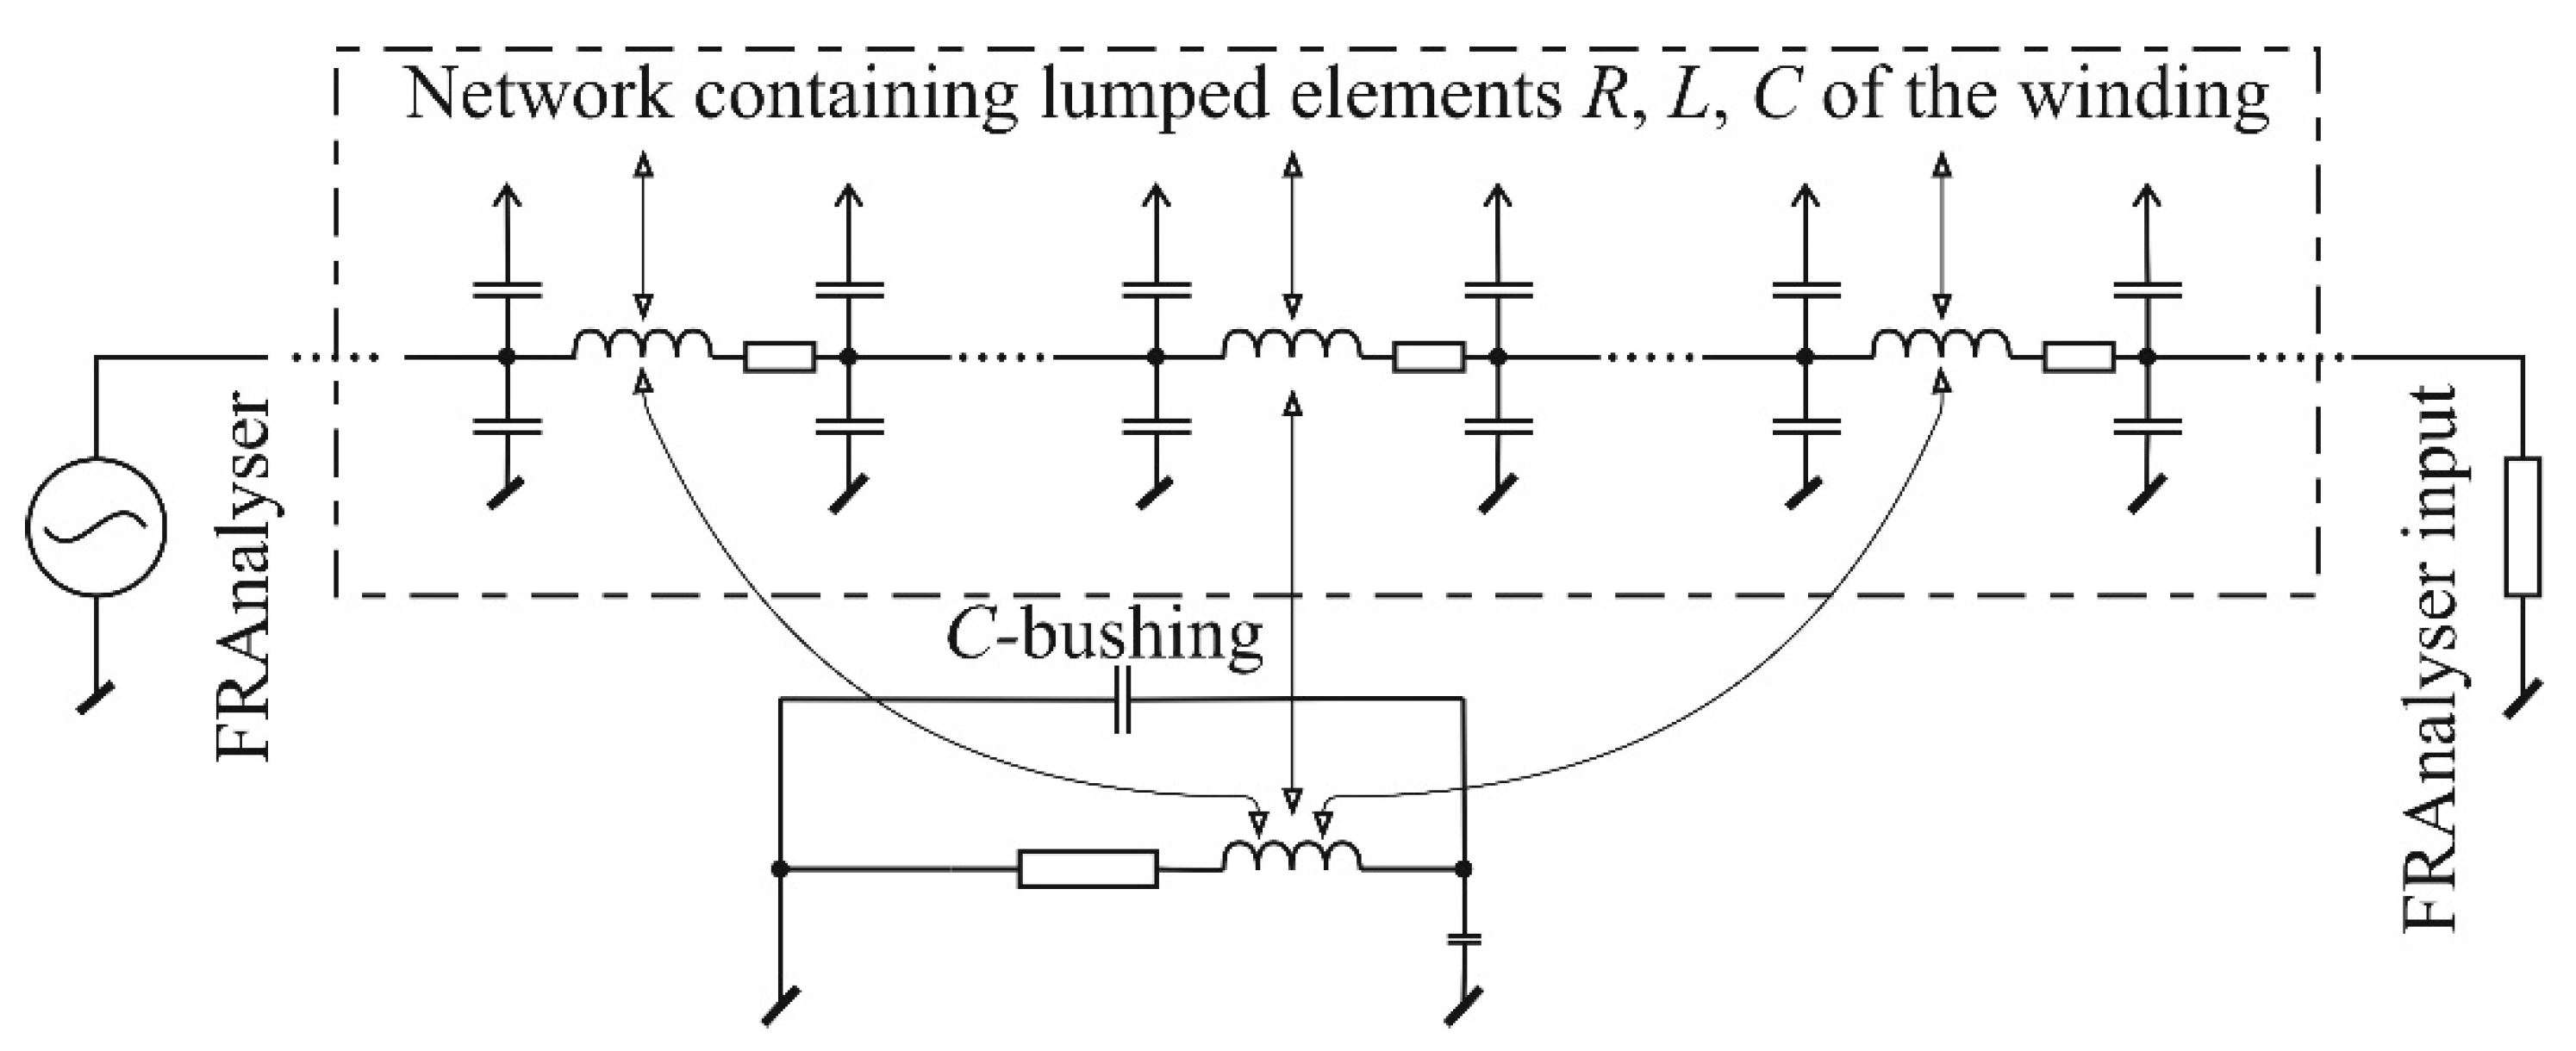
Obtained matrices served as input data for network analysis algorithm, calculating FRA-characteristics. This network, shortly presented in
Figure 4, was detailed in a previous study [
23].
3.2. Core Modeling
Proper representation of ferromagnetic core parameters is required for an accurate simulation of frequency response of the winding in the wide frequency range. The ferromagnetic core has significant influence on the frequency response of the winding below approximately 10 kHz, therefore correct simulation of the core material parameters below 10 kHz is especially important. The behavior of the core material is modeled using complex permeability. Equations (11)–(15) were used to evaluate the magnetic permeability given for Maxwell for each frequency. Eddy currents flow in the r-z plane, so it is possible to model it with only one component of magnetic vector potential
Aϕ. The model is based on an 800 kVA transformer, which is an old unit, and its core is made from cold-rolled, non-grain-oriented steel, which was assumed in the model. Assuming one-dimensional propagation of the electromagnetic wave into the laminated ferromagnetic core with 2D sheet thickness, the wave equation can be written as [
24]:
where
and
δ is the skin-depth
.
Complex permeability in laminated core is given by the equation [
25]:
where
μ is complex permeability,
Hy0 is magnetic field intensity on the surface,
is average magnetic flux density,
μ0 is vacuum permeability, and
μr is relative permeability, which can be split into real and imaginary parts:
Real and imaginary parts take the form of:
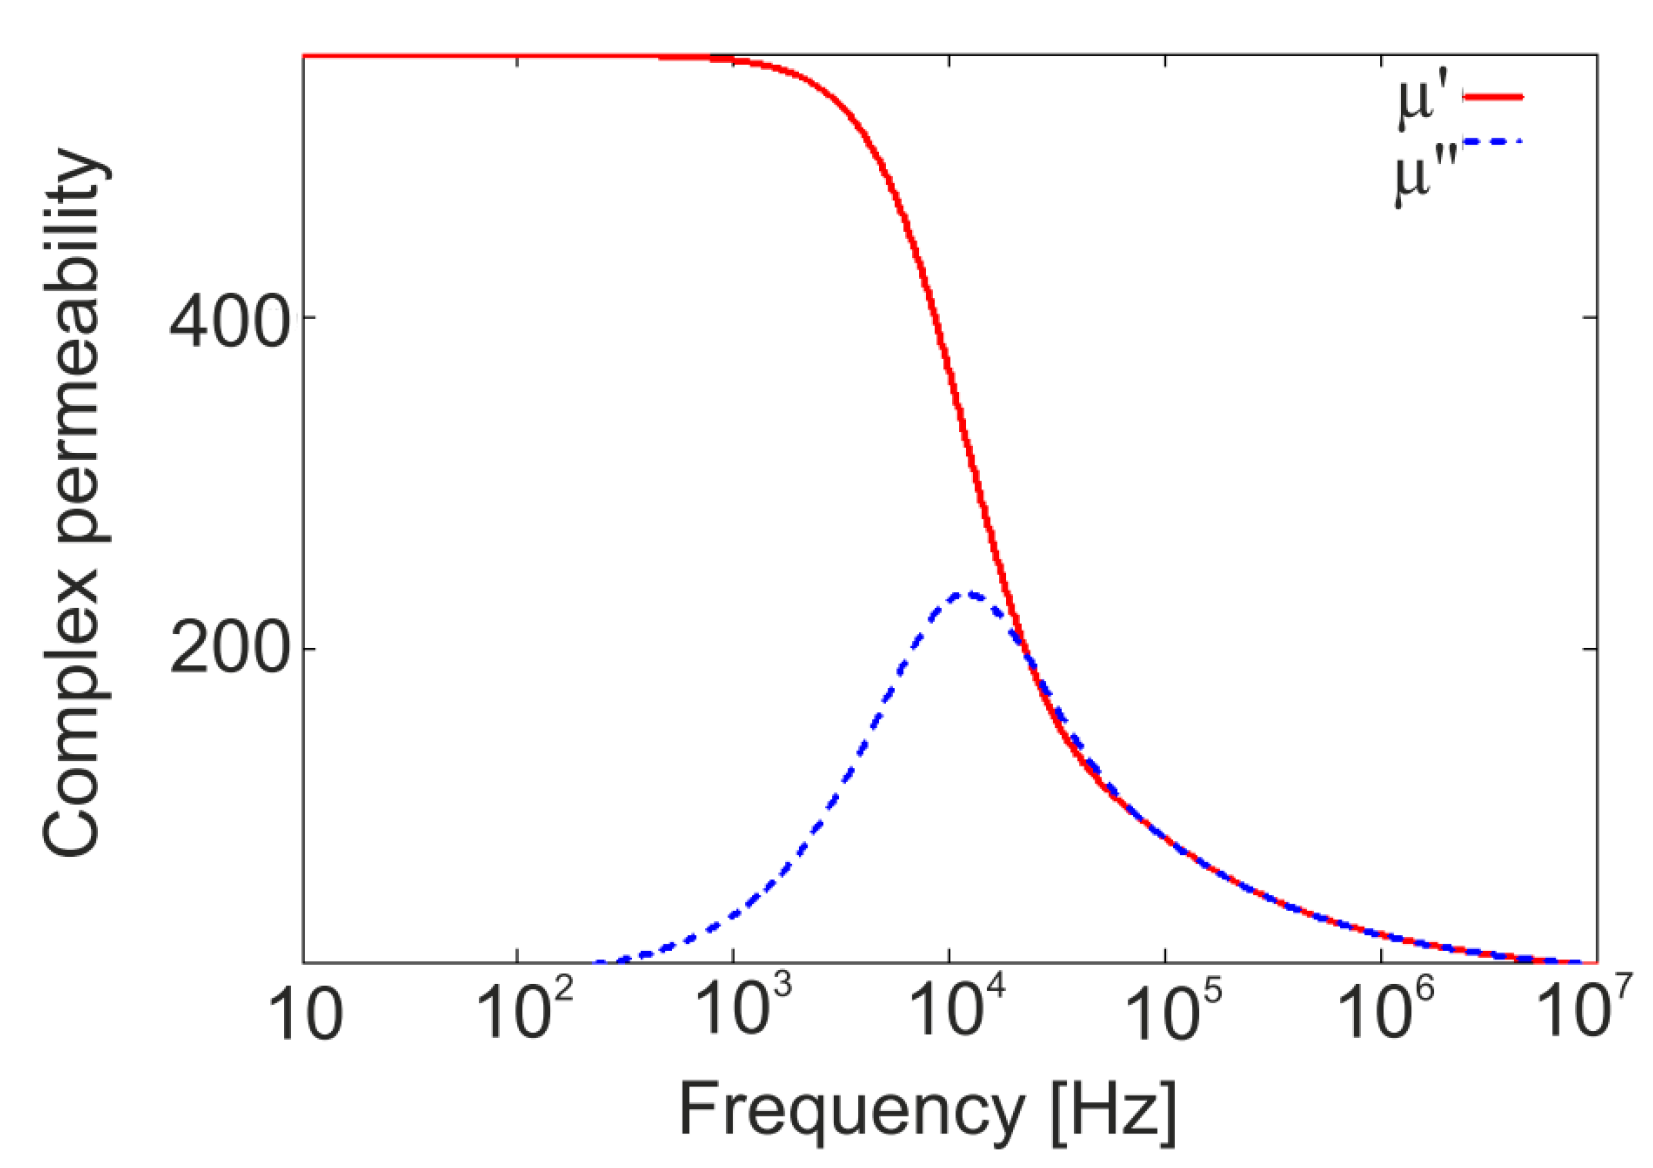
Figure 5 presents complex permeability as a function of frequency. The real part of the complex permeability represents the ability of the core material to conduct the magnetic flux, while the imaginary part represents the core losses caused by eddy currents circulating inside the laminations.
The complex permeability is calculated taking into account the maximum equivalent permeability of the ferromagnetic material, equivalent anisotropic conductivity, and the thickness of the steel sheet. In the computer analysis, it is assumed that the permeability of the material varies with the frequency of the real part of the complex permeability. The values of magnetic permeability shown in
Figure 5 were introduced in Maxwell input data for each frequency separately.
3.3. Modeling Results
The FEM models have been prepared for the three abovementioned cases: the neutral position is 450 turns, the upper position is 495 turns, and the lower position is 405 turns. In the beginning, the capacitance value in the model was assumed to be
C = 1400 pF. This value refers to the bushing capacitance, connected parallel to the winding-tank (core) capacitance. Even though the bushing capacitance is dominant, the other one was also evaluated using Maxwell. The analysis of bushing influence of FR curve can be found in the literature [
26], where changes are visible in the high frequency range. Authors’ experiments show that the FR of a transformer changes in the LF range (up to 10 kHz) after connecting additional capacitance to the bushing in the other phase rather than the tested one, and in this way modifying the total capacitance of the object [
9], which will be presented in
Section 4. The results of the modeled frequency response are given in
Figure 6.
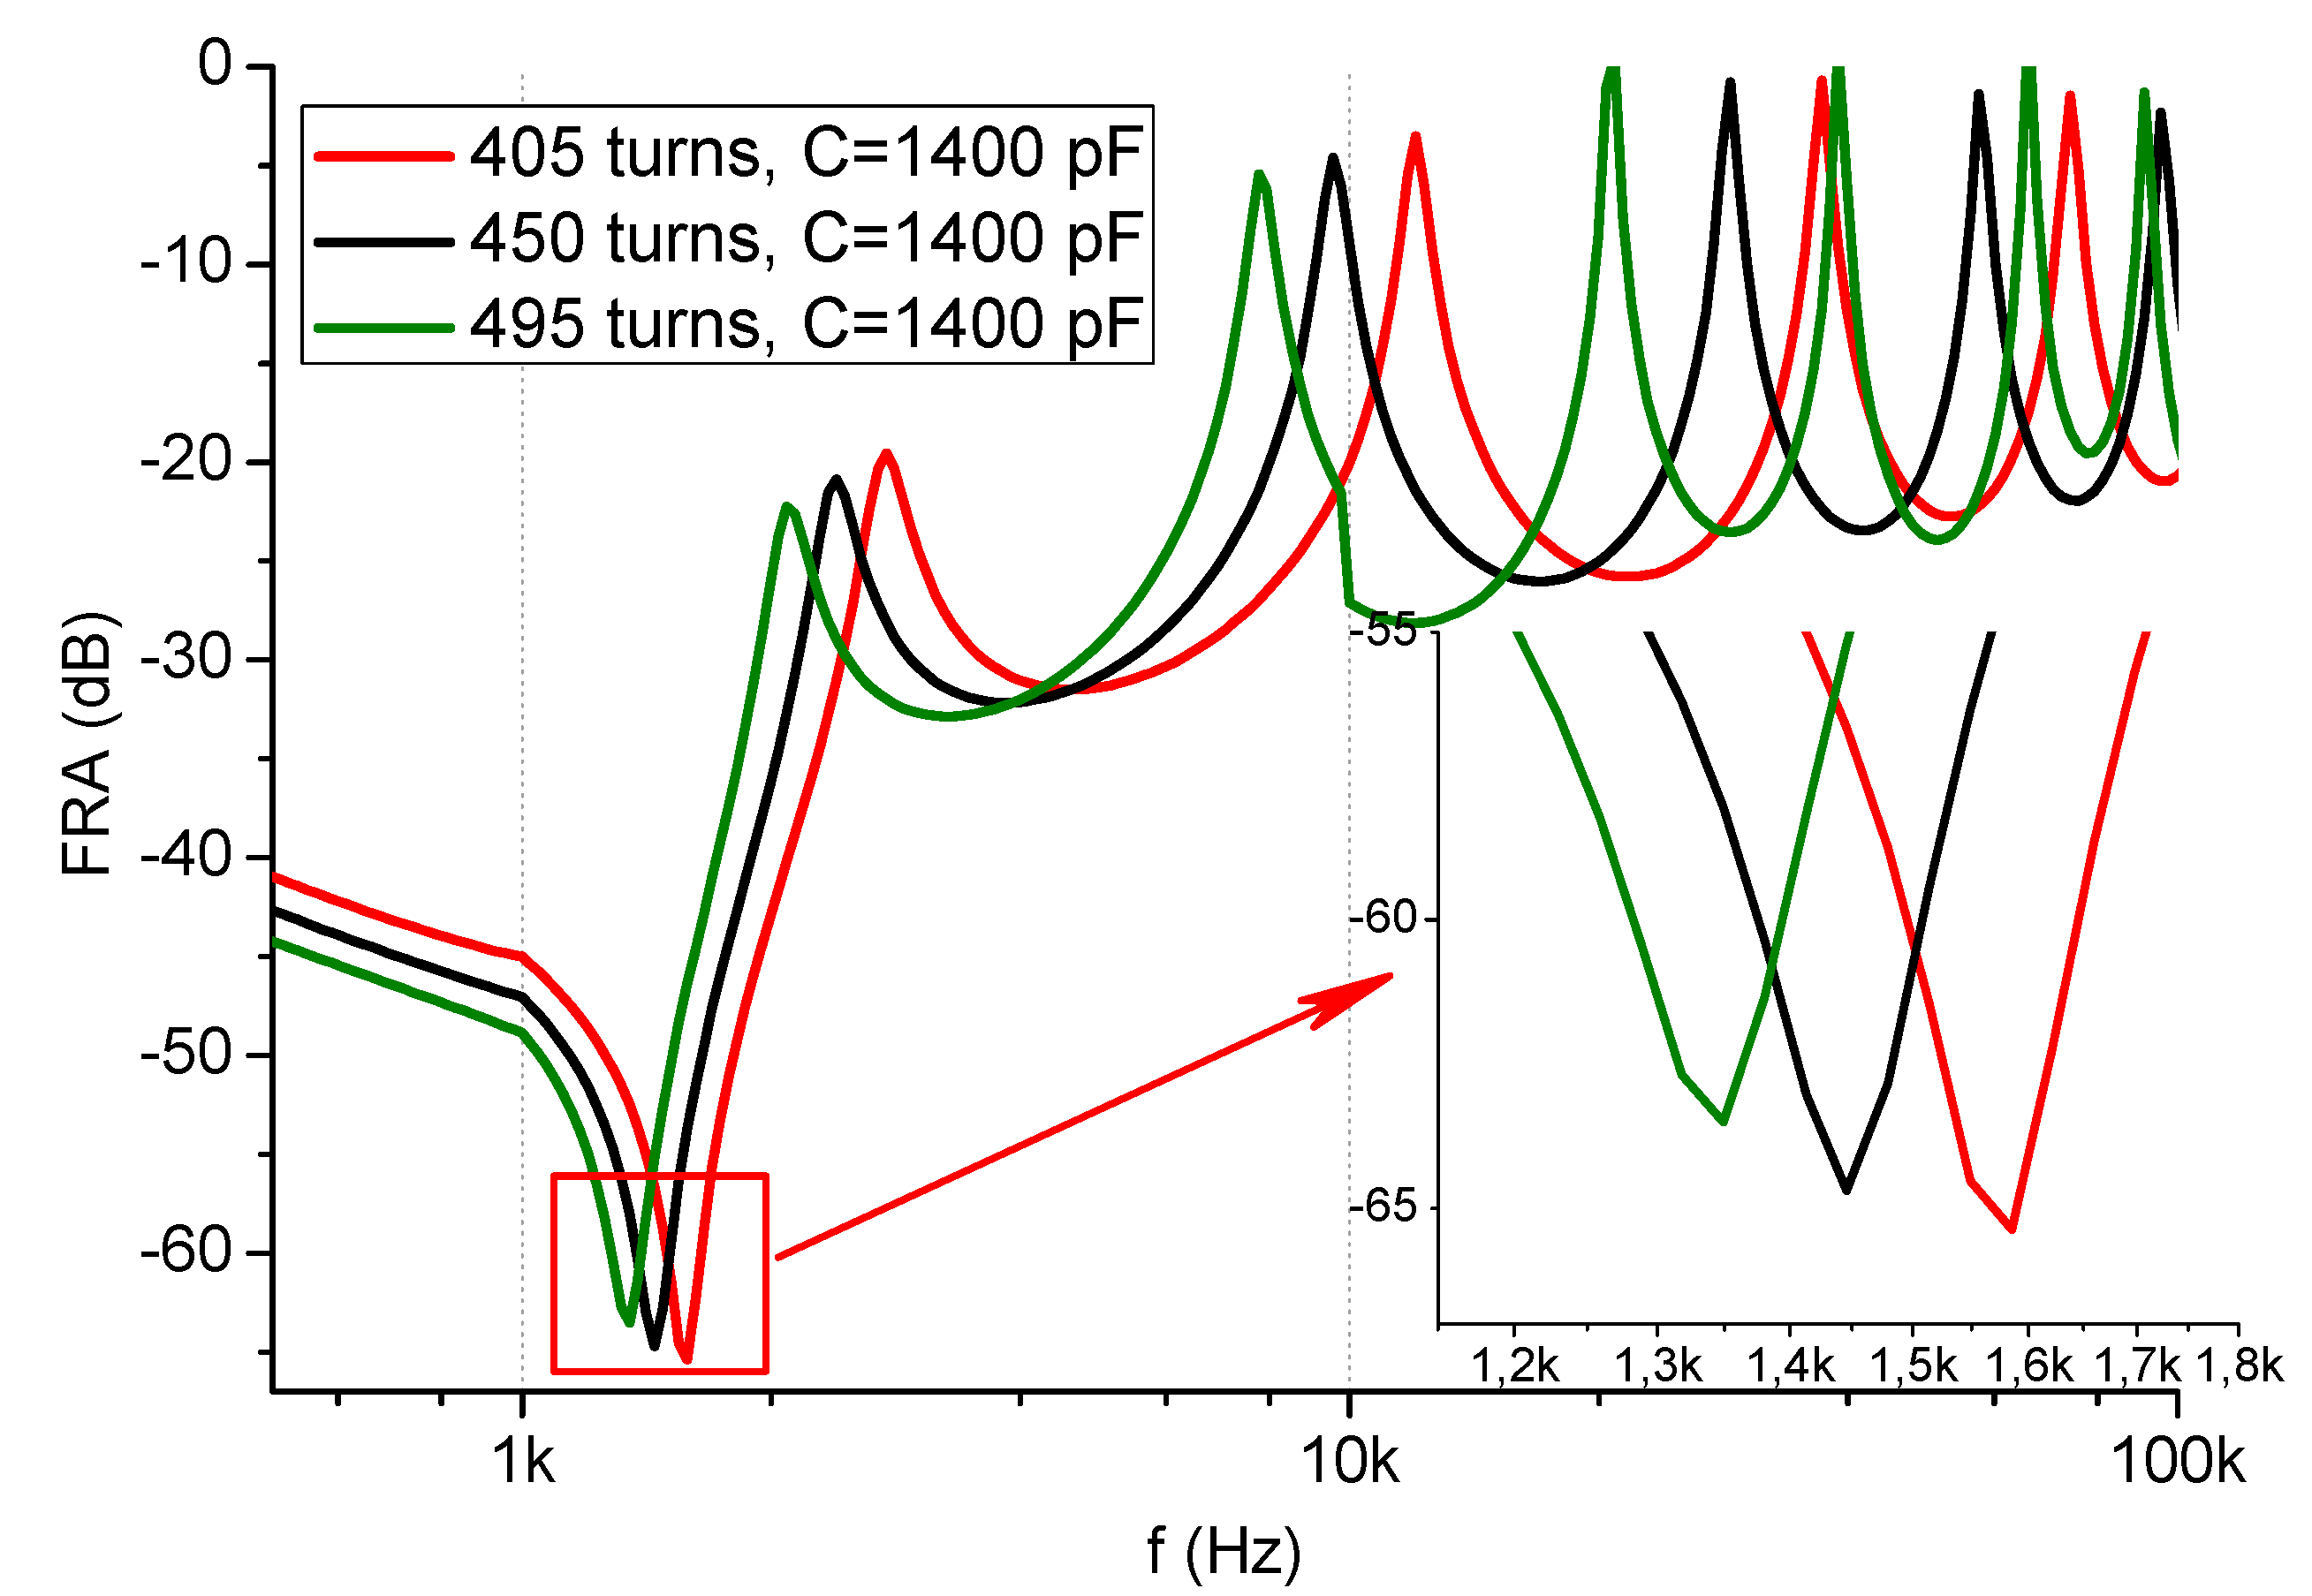
Although all resulting parameters
R, L, and
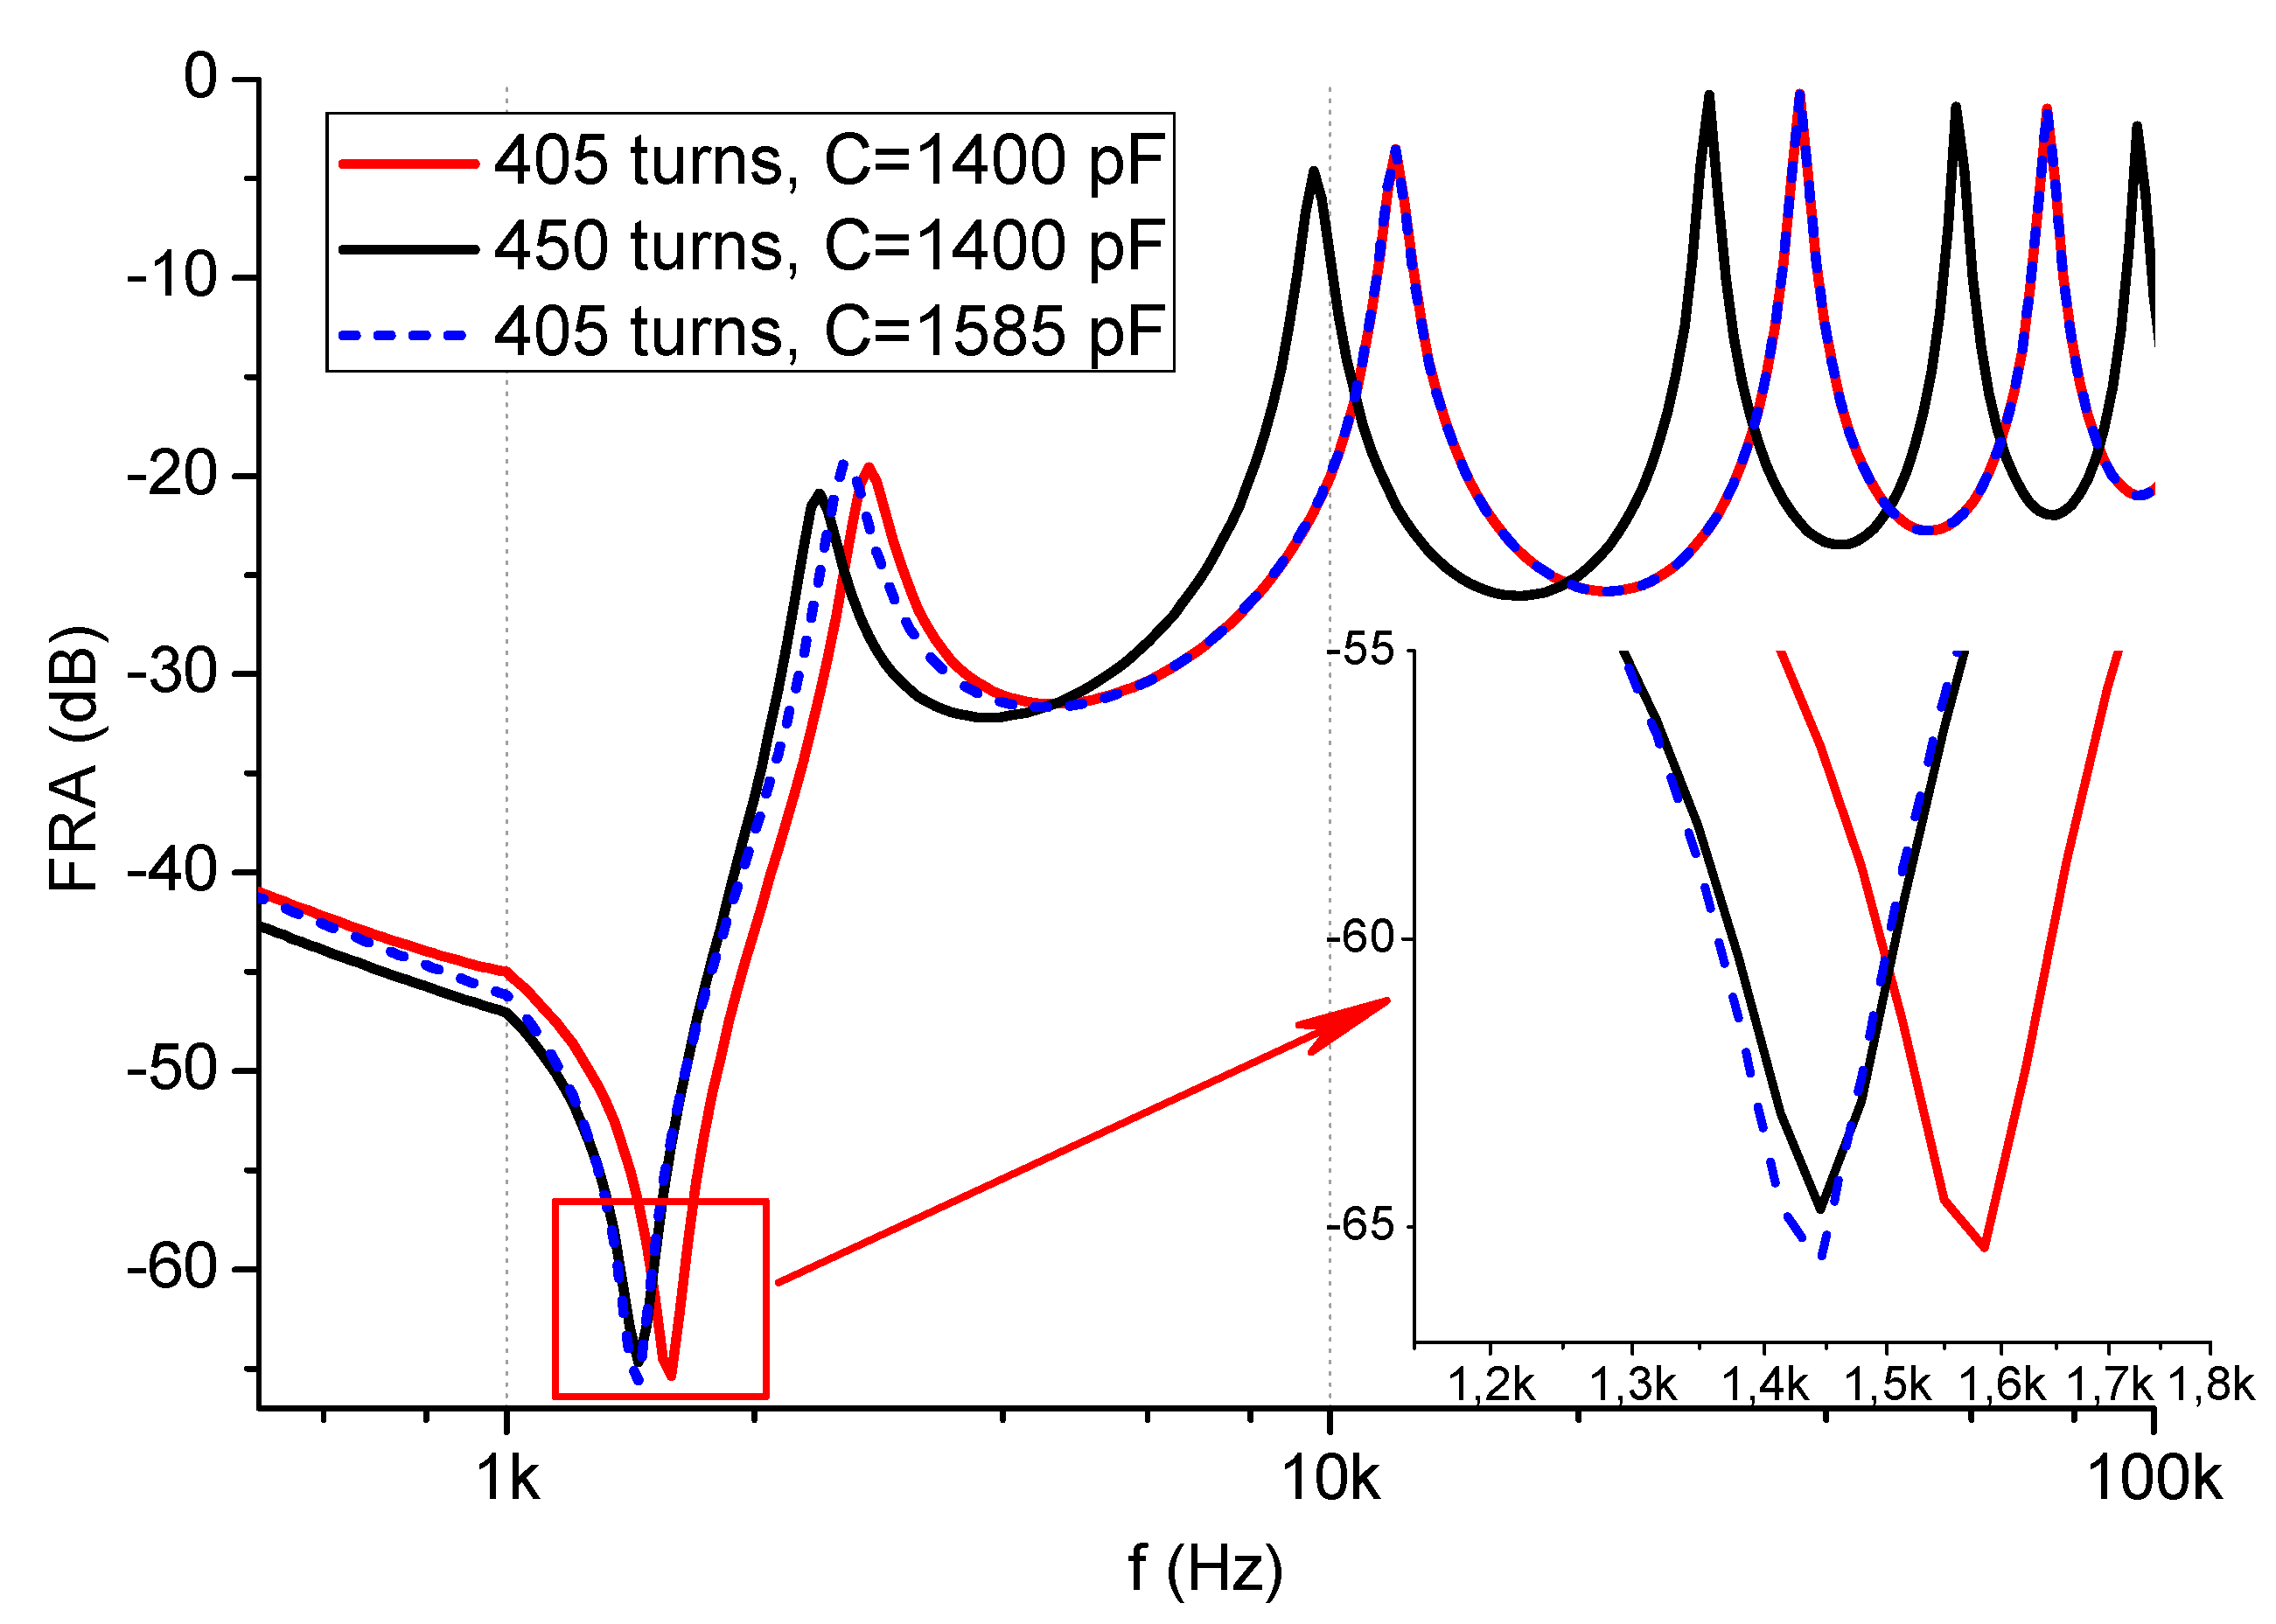
C differ in the described three models, the inductance changes are dominant for the frequency response at low and middle frequencies. It can be seen that inductance changes influence the whole simulated frequency range, including the first parallel resonance (approximately 2 kHz). FR curve is shifted towards higher frequencies with decrease in number of turns, and toward lower frequencies with increase in the whole frequency range. This effect was expected. In the next step, there the change of bushing capacitance on opposite winding was simulated, which allowed the position of the first resonance resulting from inductance change to be balanced. The results are given in
Figure 7.
It can be seen that the first parallel resonance returned to the original position (nominal tap) after adding capacitance (at 2 kHz). This case may appear in field conditions where there is the wrong tap changer position and capacitance change (e.g., on the bushing insulator of the HV winding) [
9]. The change of bushing capacitance can be the result of its earlier replacement or damage, but also by mistakes of testing personnel (leftover wires or tools on bushings of other phases and any other capacitive influence). The interesting behavior can be observed at higher frequencies: from approximately 5 kHz, the curve representing tap position 405, which is wired with additional capacitance, returns to the original position, before adding the capacitance. This means that in the case where the wrong tap position is covered by capacitance changes, this can be easily detected in higher frequencies. On the other hand, changes in FR visible in the MF range may be interpreted as a deformation (because LF range shows no differences), while they can be the result of mentioned
LC phenomena.
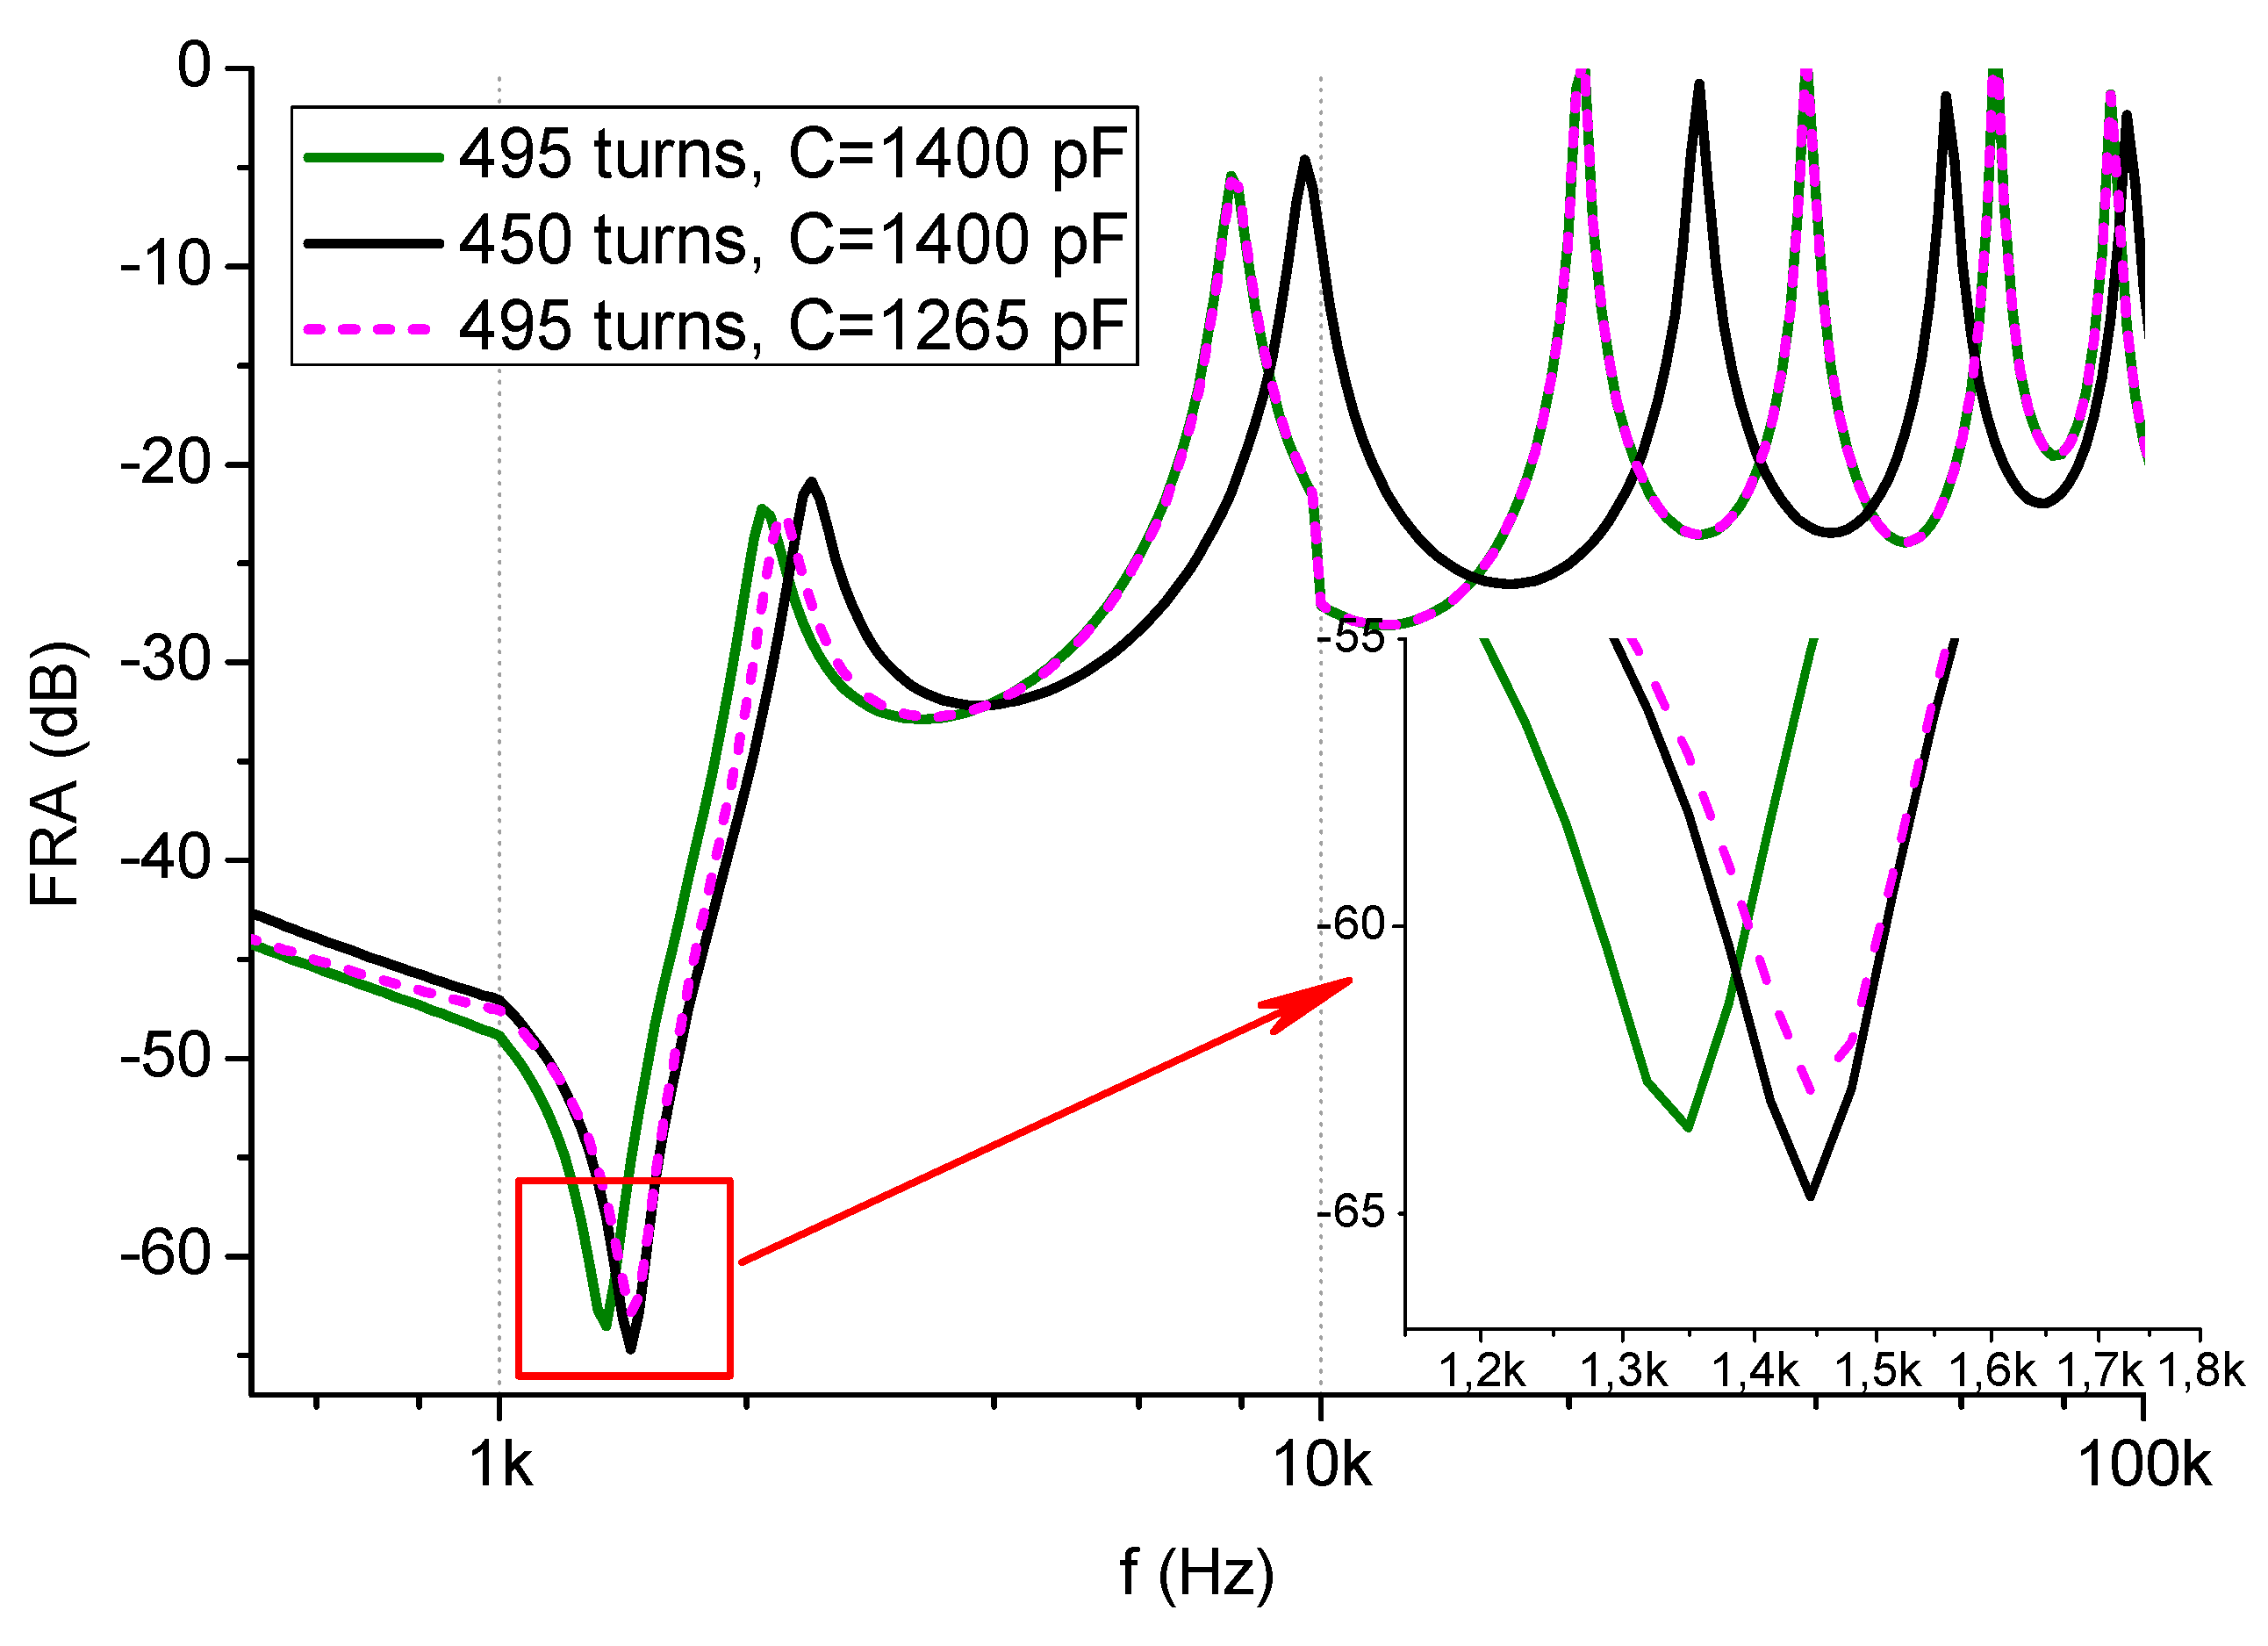
Similarly, this was simulated the contrary case, where turn number was increased, while bushing capacitance decreased (
Figure 8).
Also in this case, the frequency shift of the first parallel resonance may be balanced to the original position by capacitance change. In MF range, the capacitance influence disappears and the curve returns to the original position.
4. Examples of Industrial Measurements
The phenomena simulated in FEM software can be found in industrial measurements. Some examples of such results are given below. They were all measured by authors in the field conditions in the end-to-end open test setup, which was already discussed and presented in
Figure 1. The test equipment was a commercial device Omicron FRAnalyzer. All details of the measurement technique are requirements of the IEC standard [
6]. In all examples, only one phase is presented, to show differences coming directly from introduced changes to the transformer. The first one, presented in
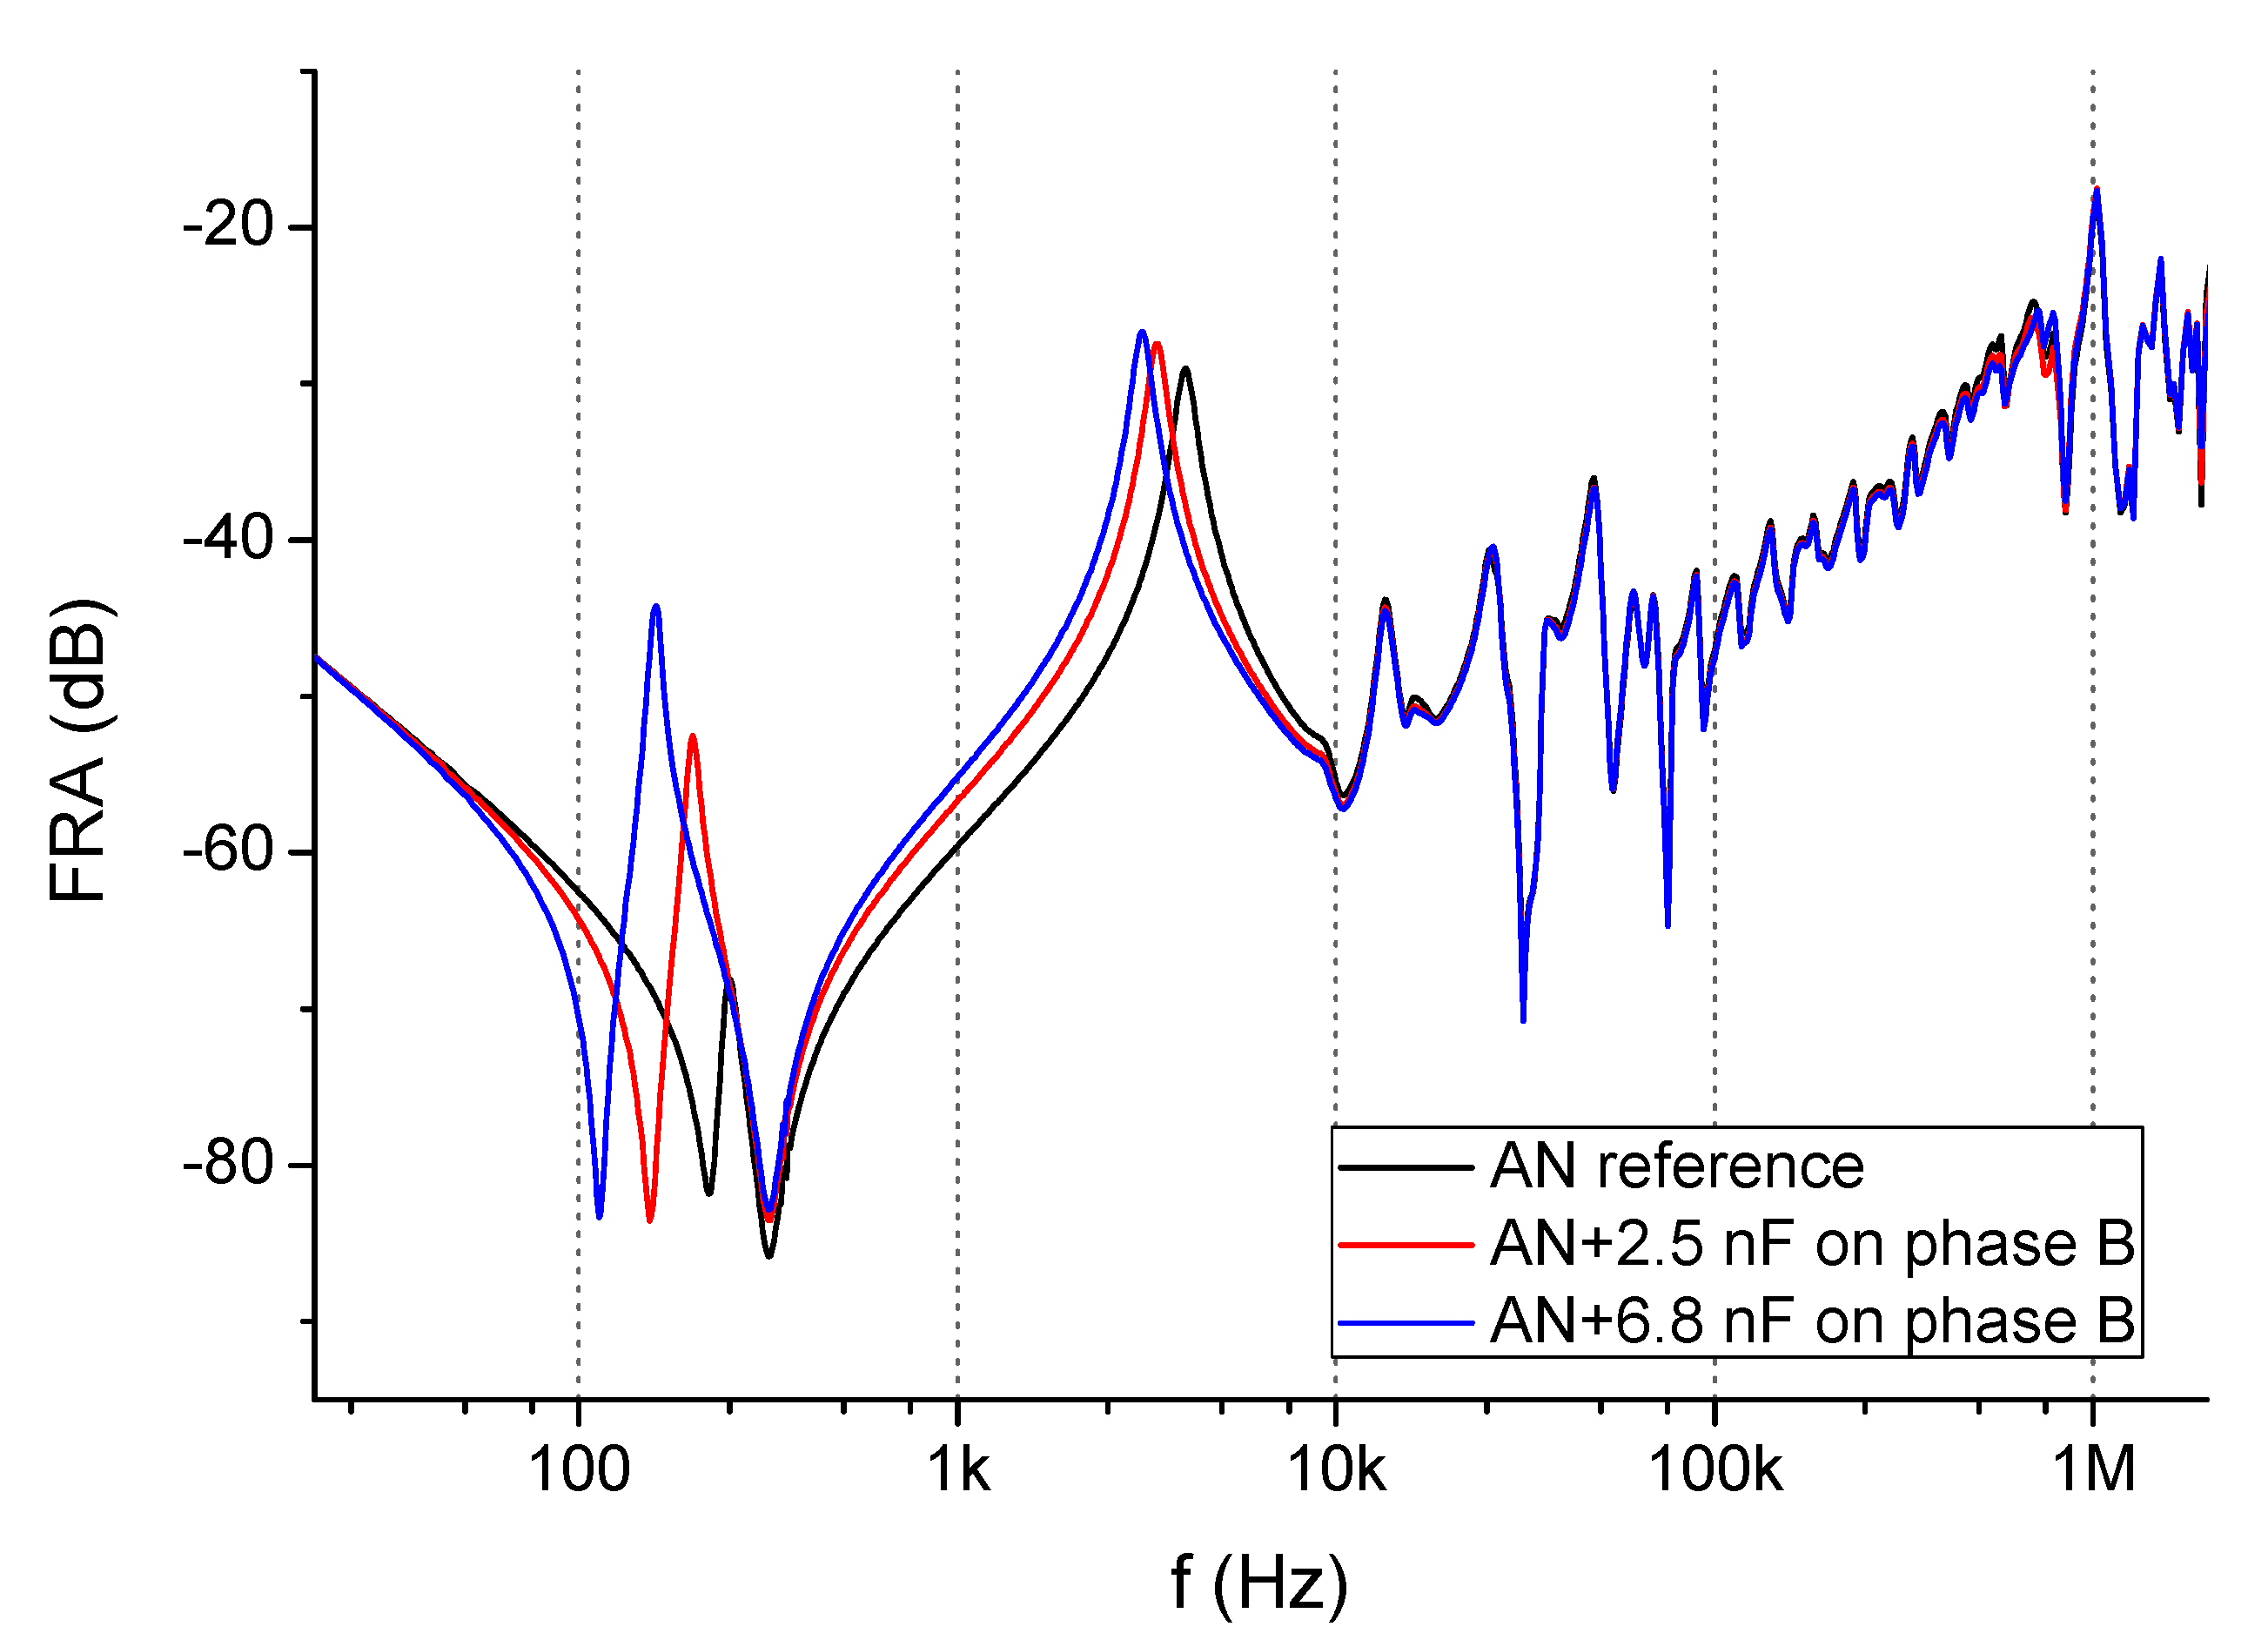
Figure 9, shows the influence of capacitance on FR of a 250 MVA, 400/110/30 kV autotransformer. The additional capacitors were installed on the bushing of phase B, not the measured phase (phase A). The results of the measurement of phase A show that additional capacitance shifts the first resonance in the LF range (100–300 Hz), but from approximately 10 kHz, its influence disappears. These results confirm observations obtained from the model that capacitance modifications influence only LF range.
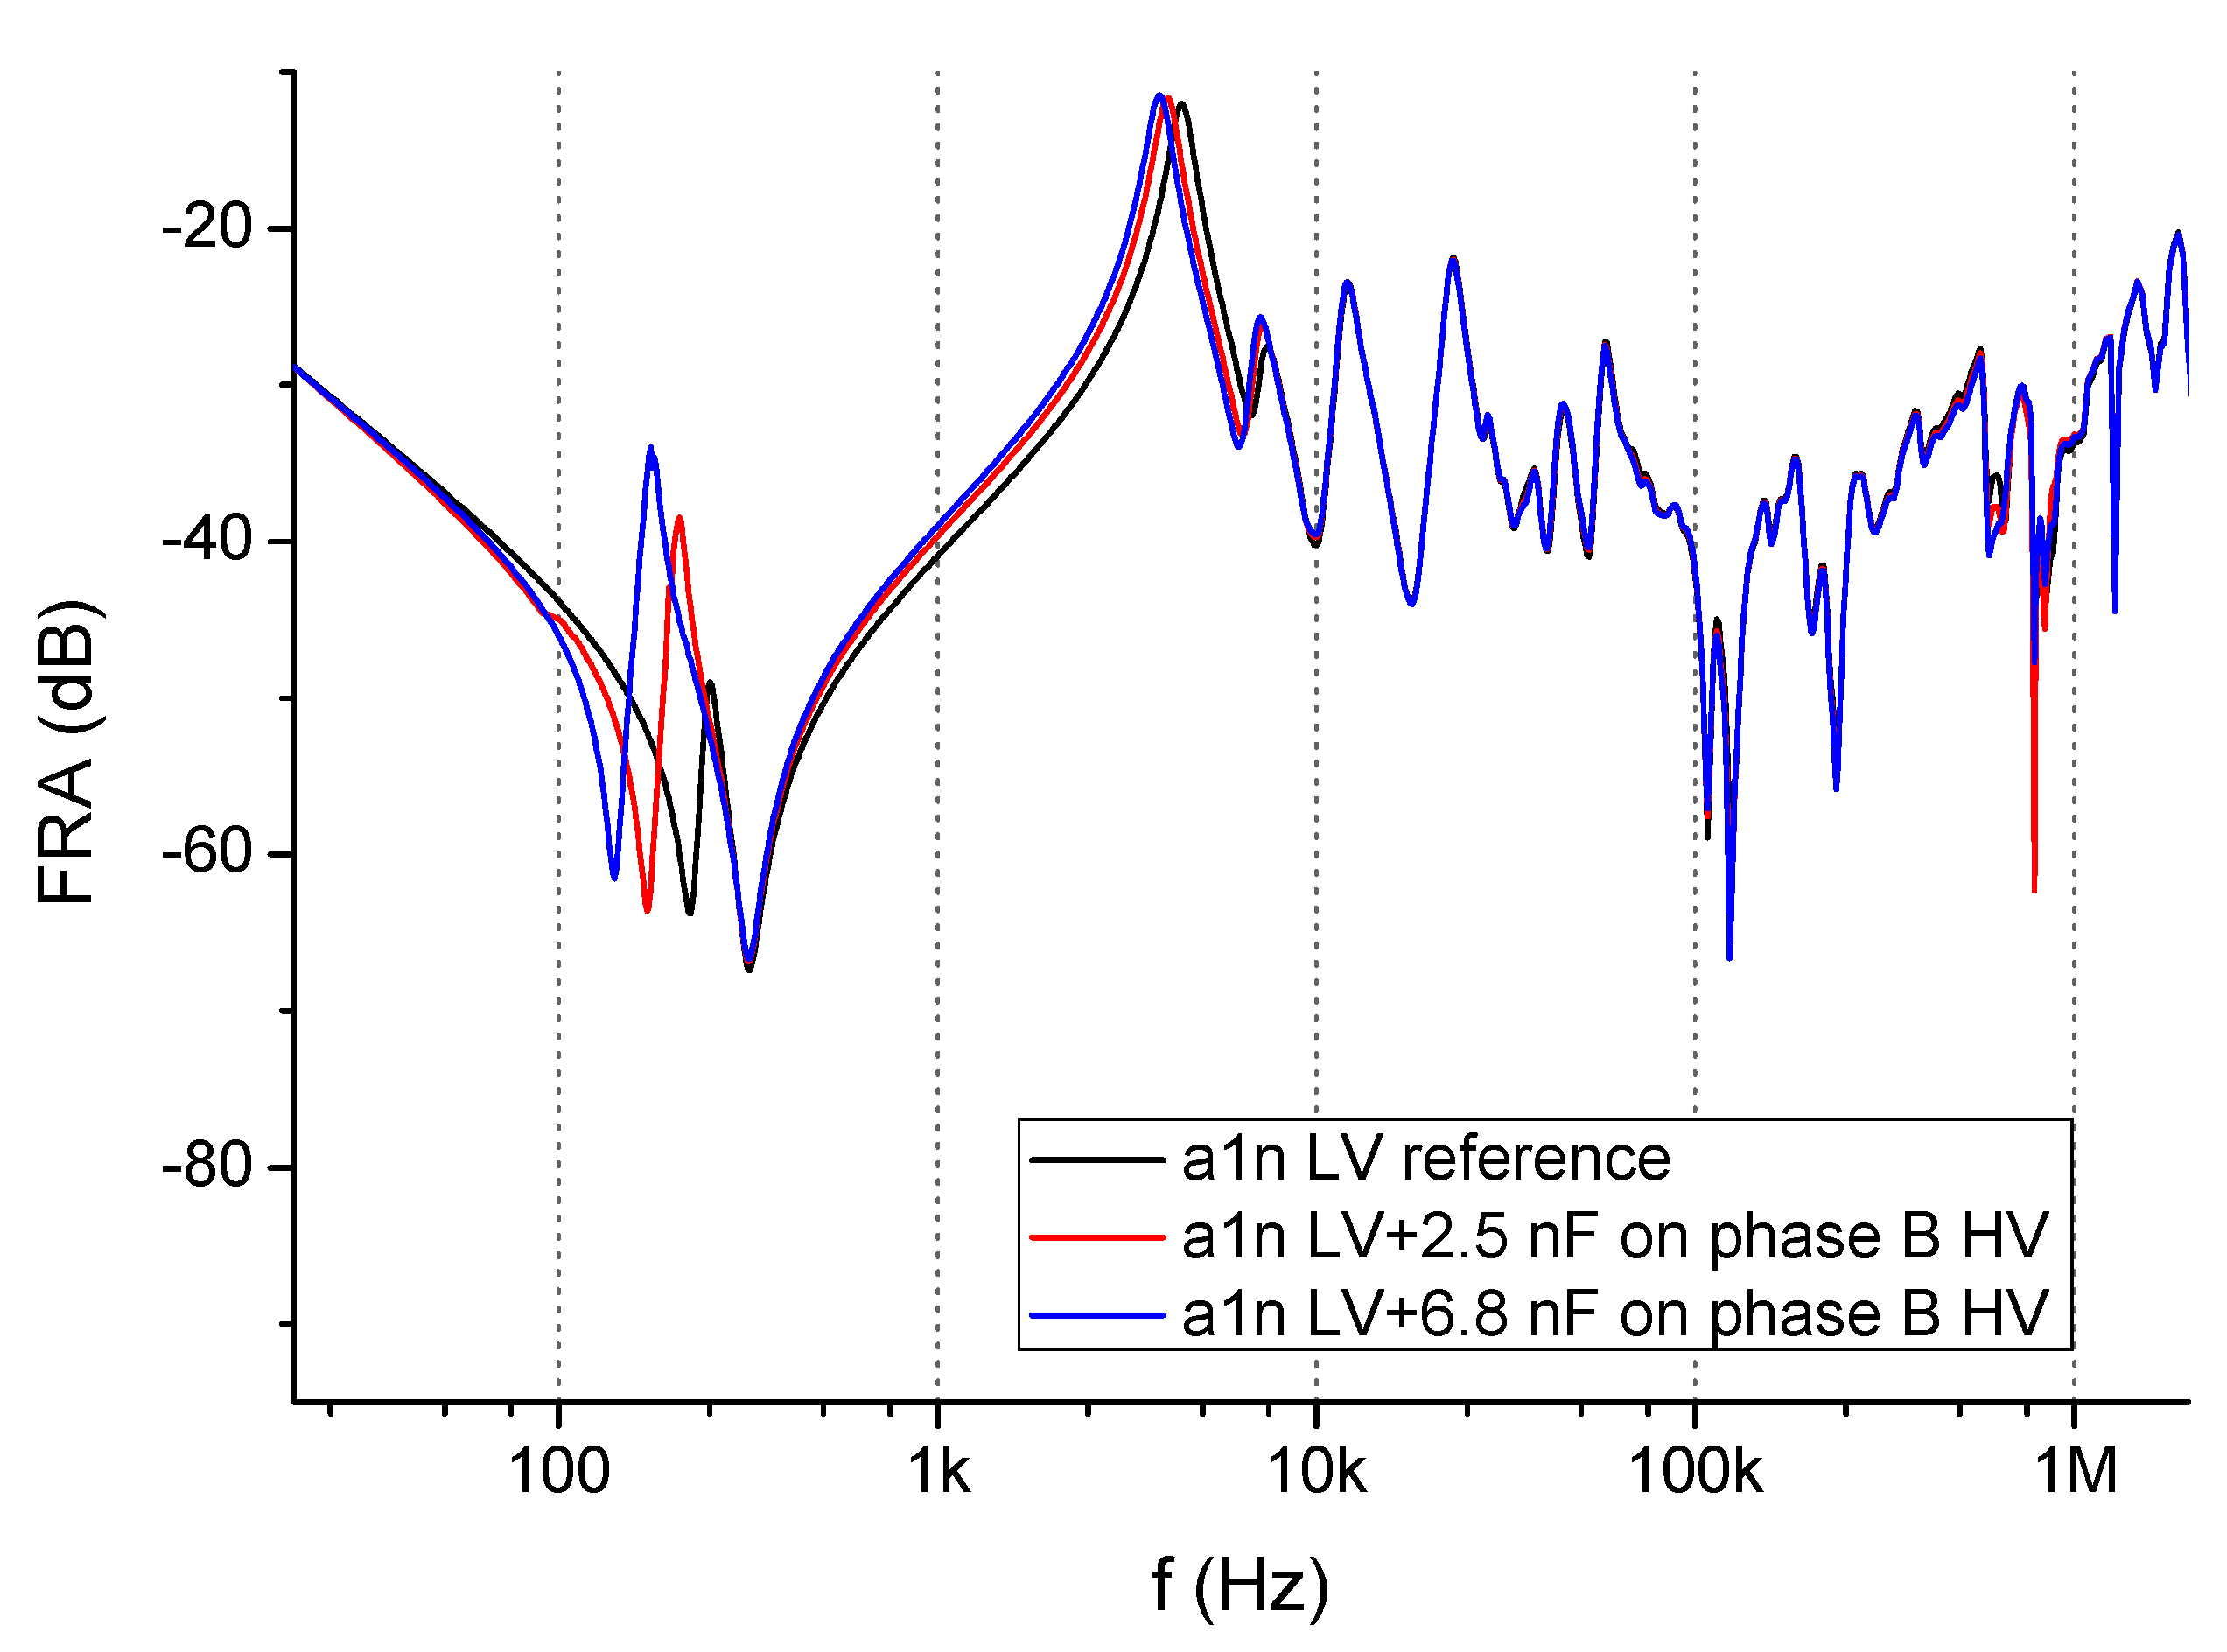
A similar effect is obtained if measurement is conducted on the LV winding of phase A, with capacitors attached to the HV phase B. The capacitive influence of the active part (even though it is in the other phase and in the other voltage side) is reduced in the MF range. The first resonance shifts in a range of 100–300 Hz, while differences between curves disappear from approximately 8 kHz. It can be seen in
Figure 10.
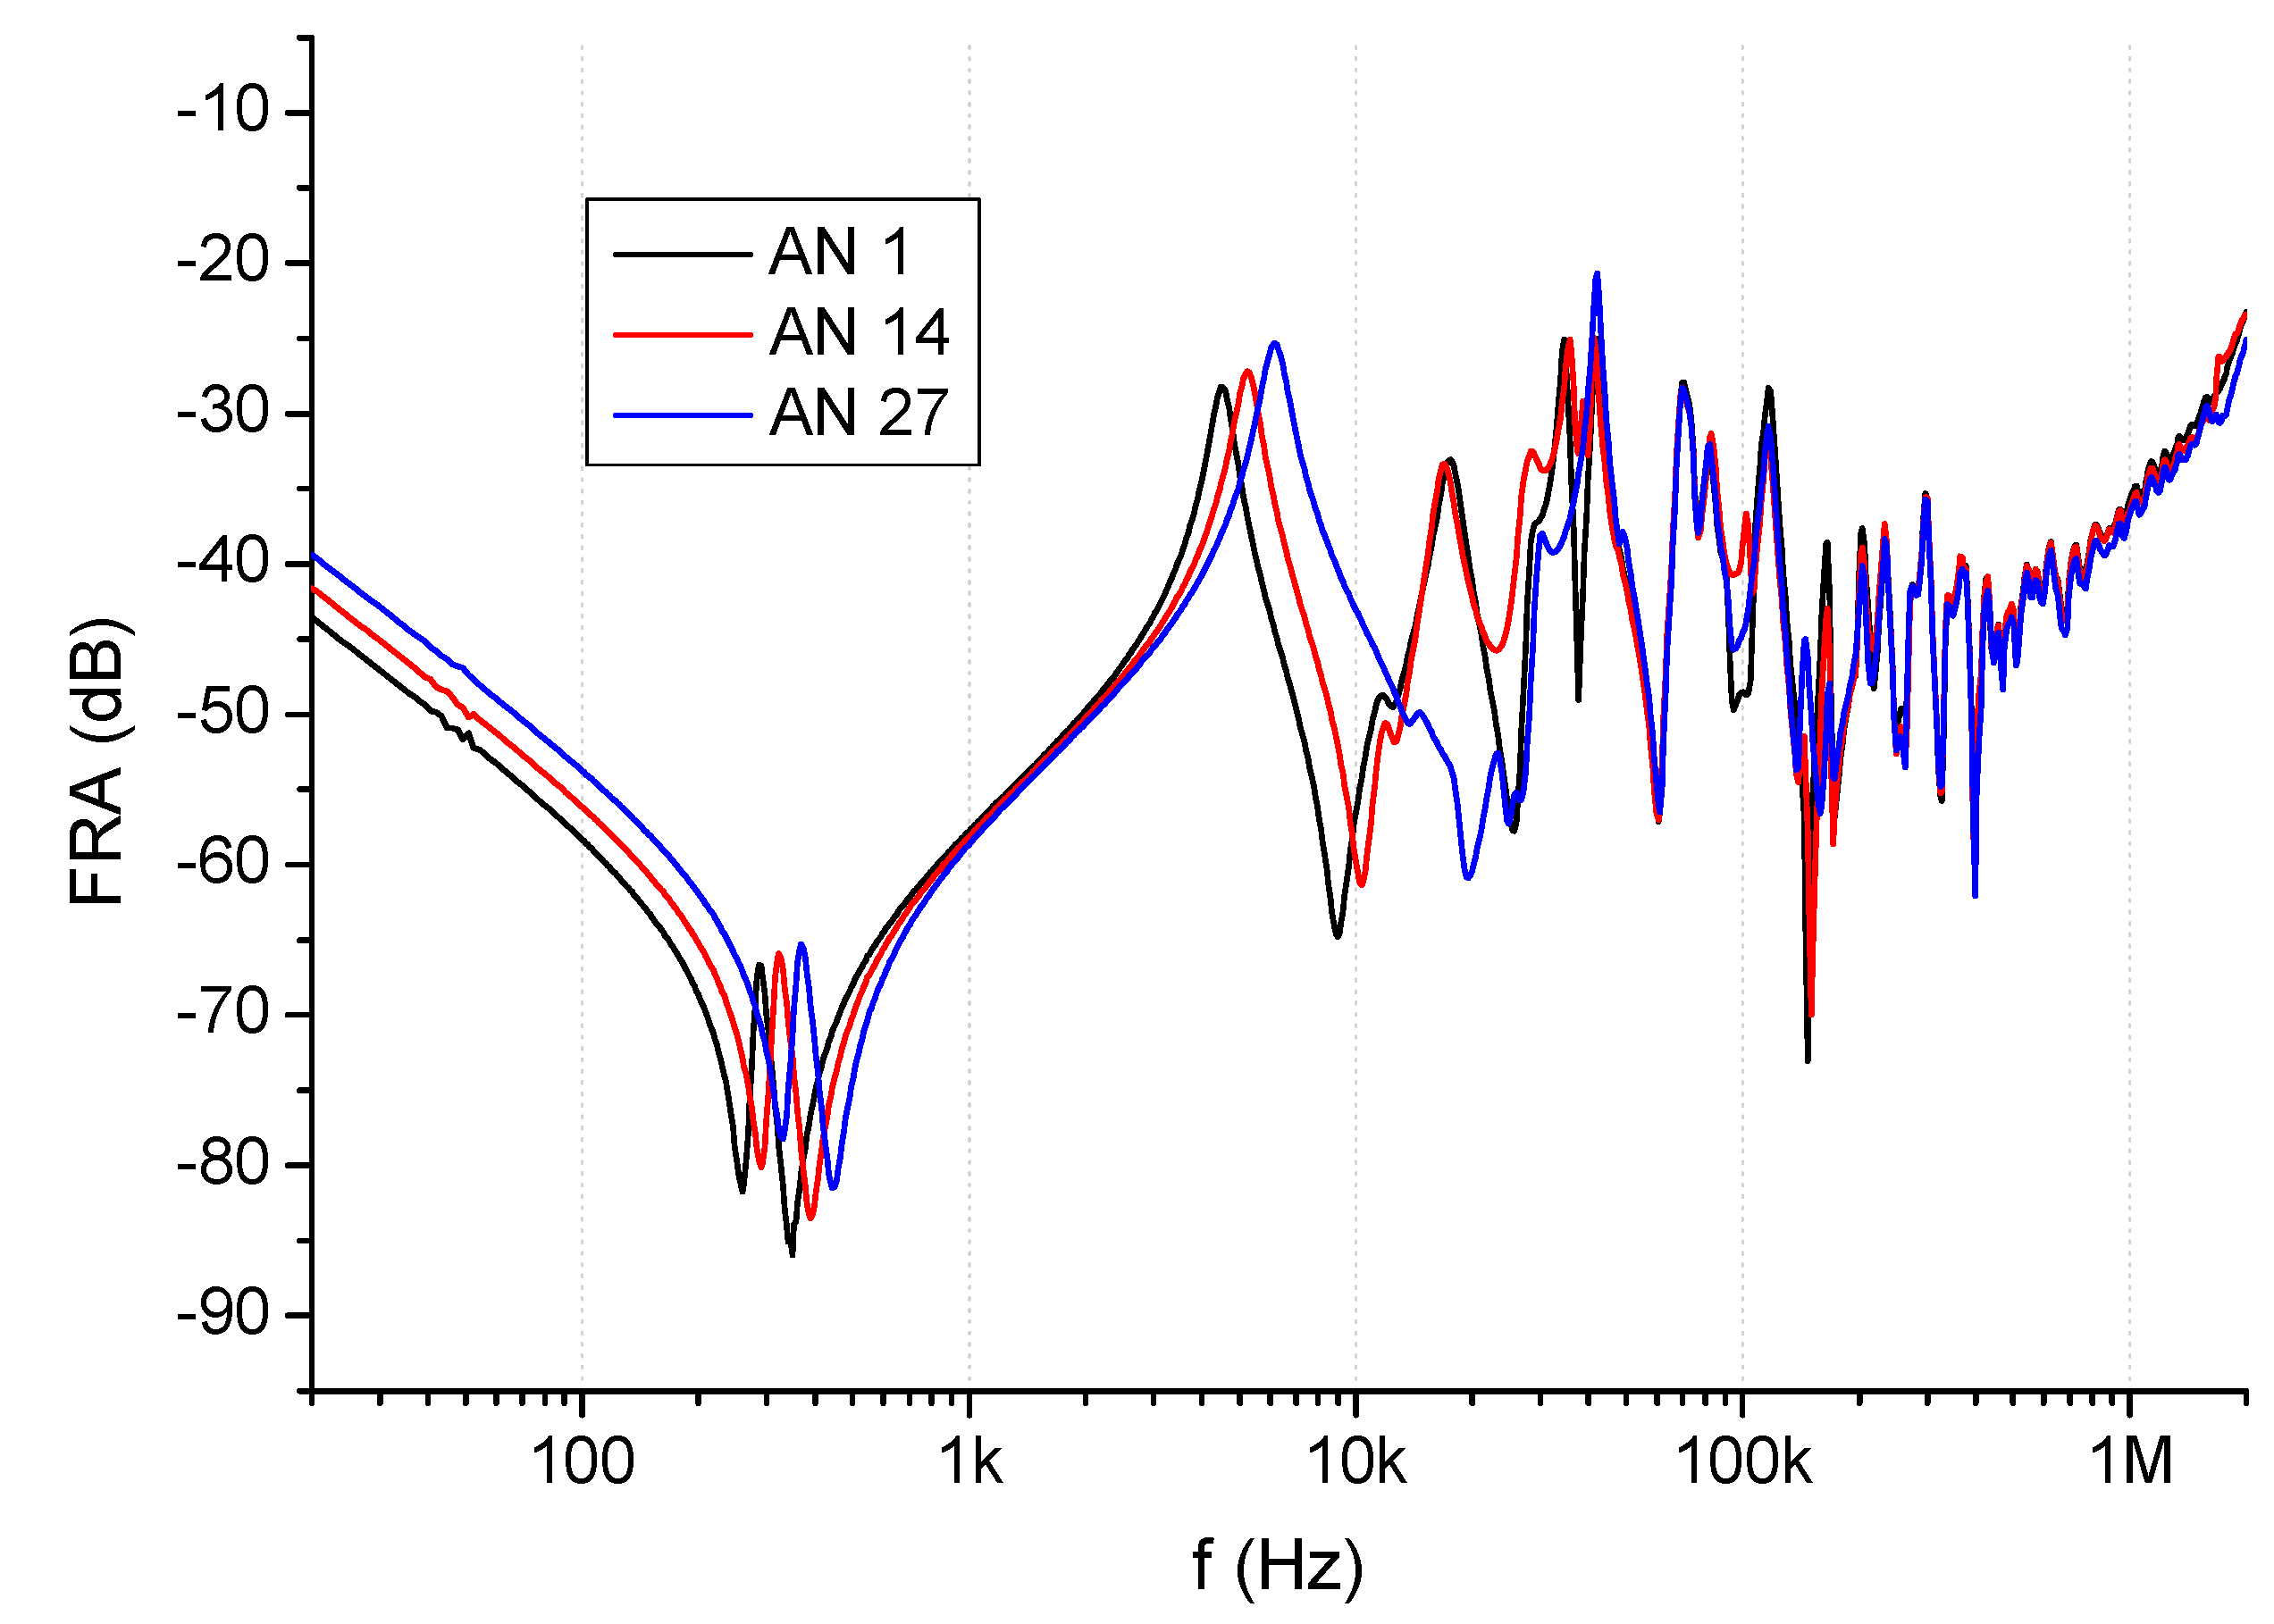
The next case necessary to verify the modeling results is the behavior of FR when the tap changer position is shifted. The first example is measured with a 160 MVA, 220/110/15 kV autotransformer, for three positions of OLTP. The results are given in
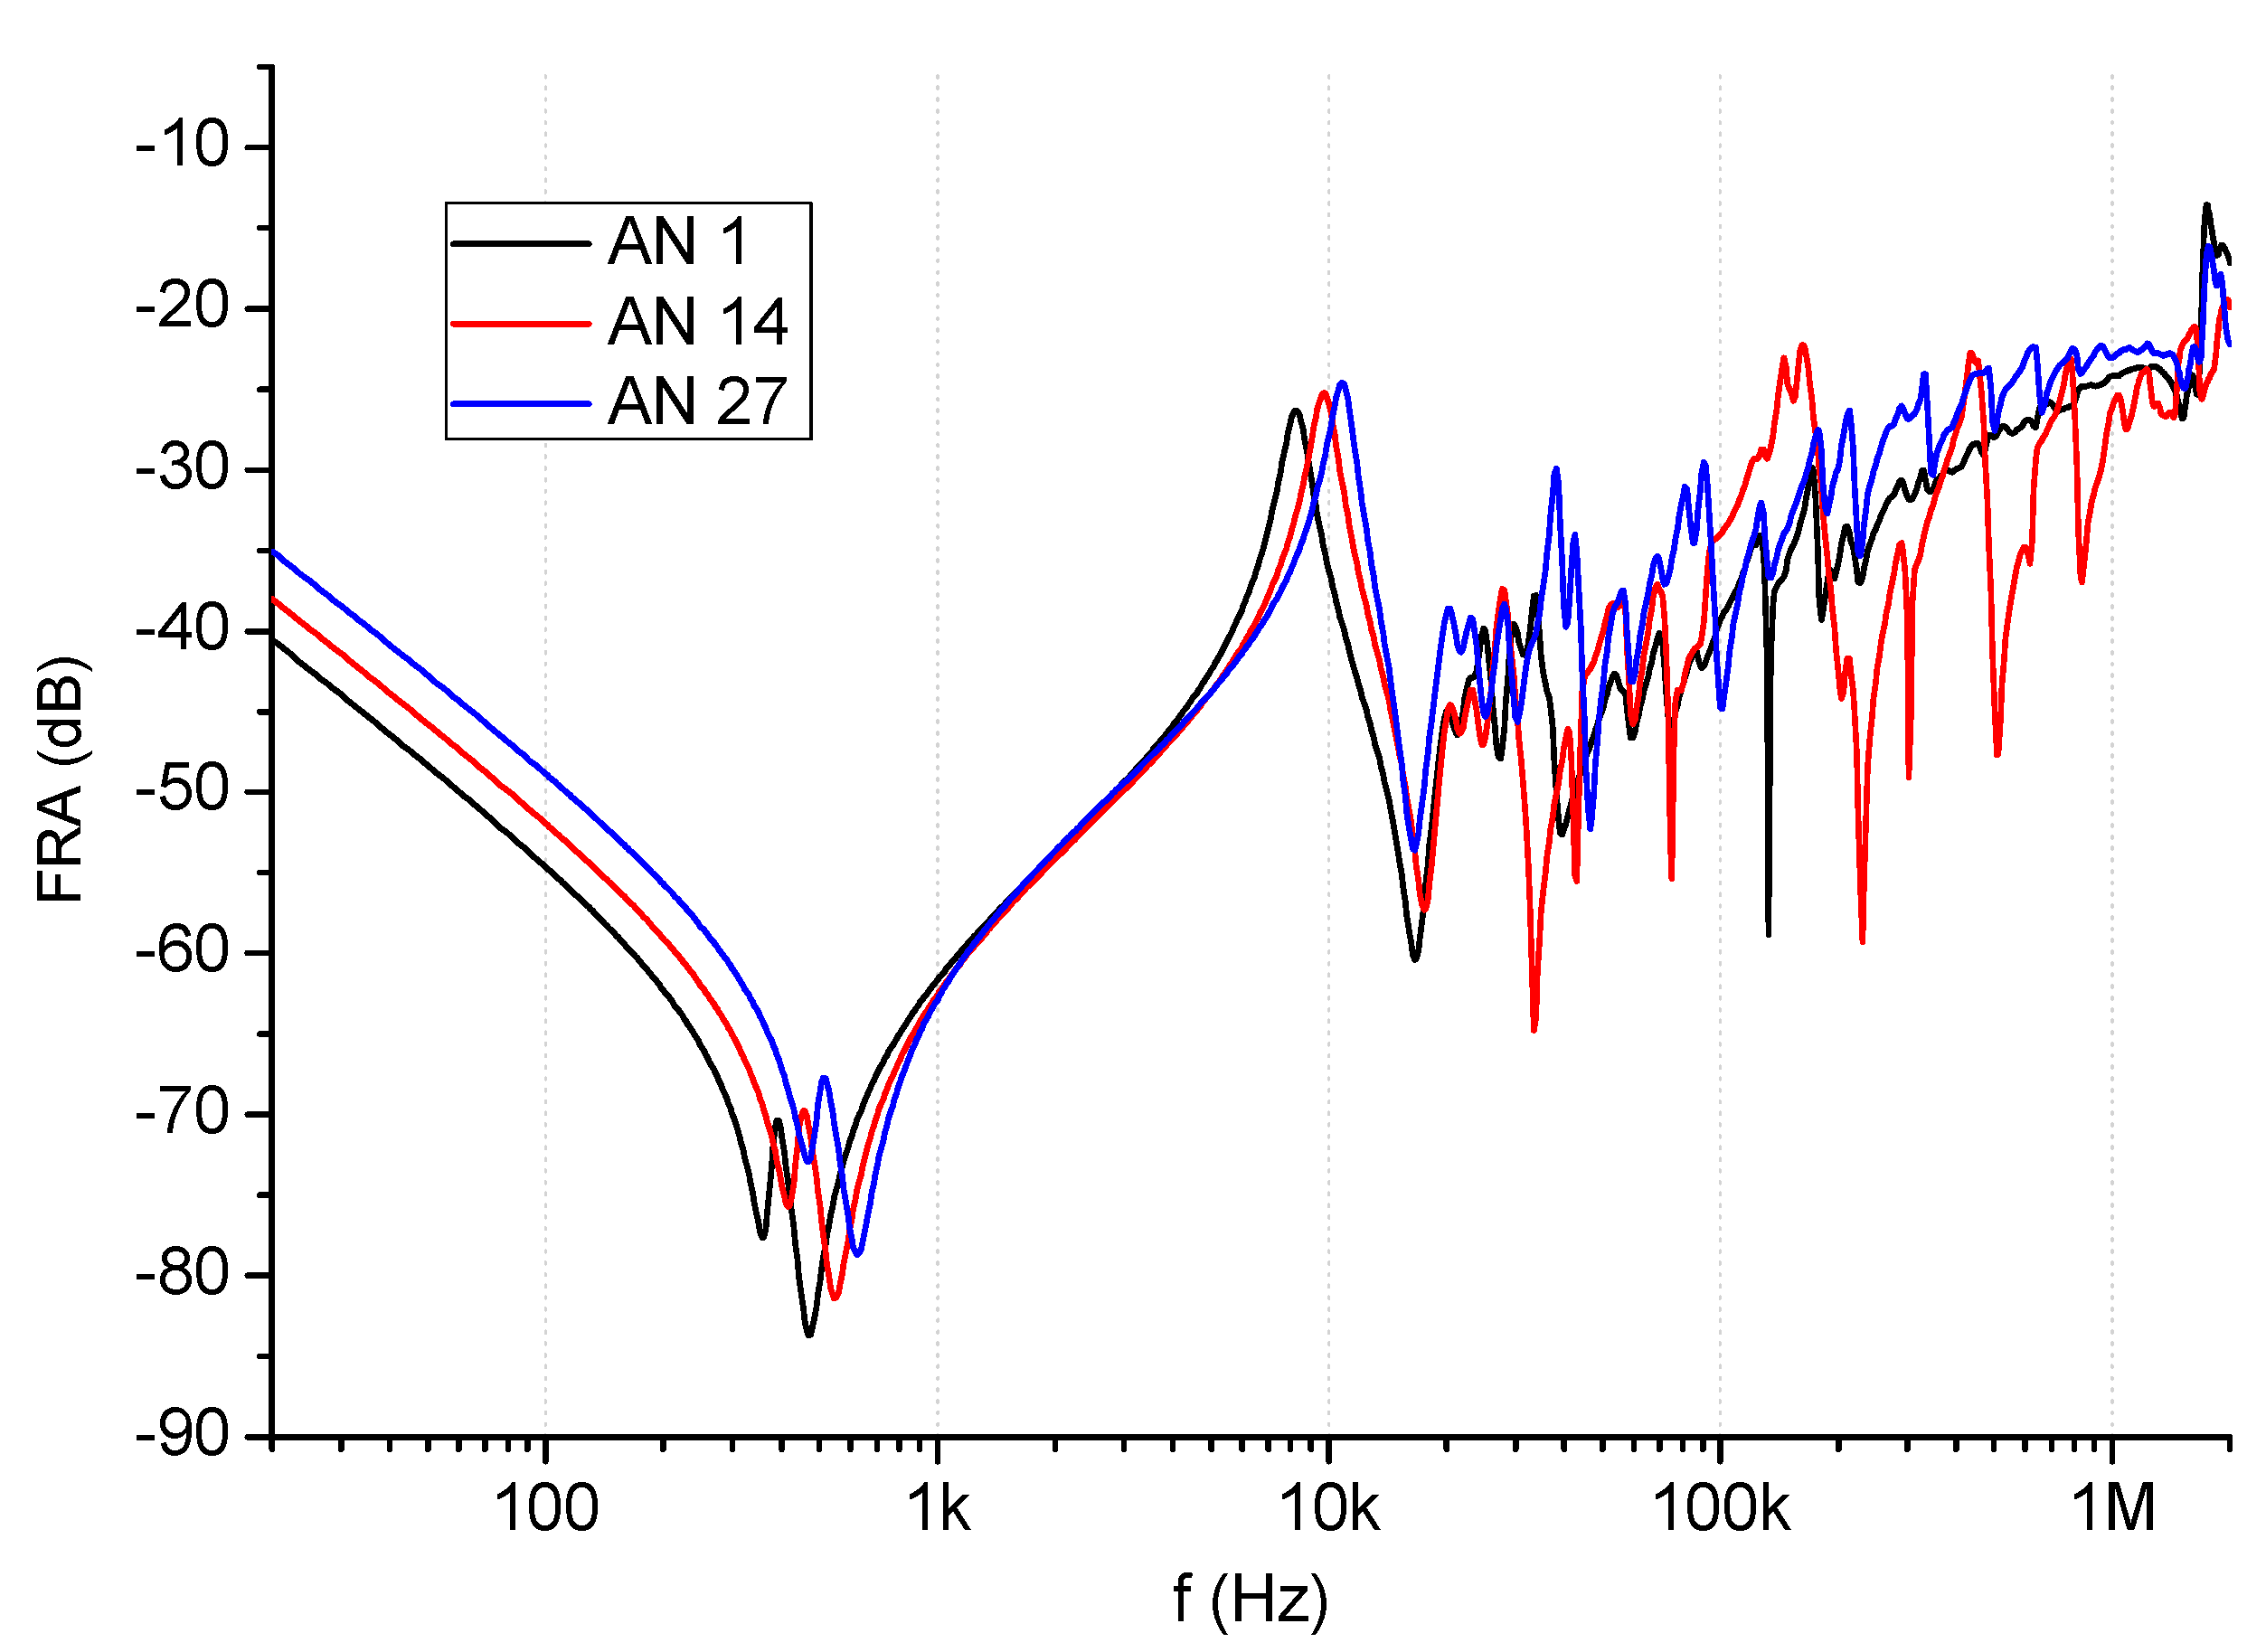
Figure 11. The FR for change values of inductance (tap position) influence not only LF range, but also MF range. Again, the industrial measurement confirmed the results obtained from the computer model. A similar effect can be observed for another unit, the 31.5 MVA, 110/30 kV transformer, presented in
Figure 12, also for three positions of OLTC.
The abovementioned results show that the influence of inductance changes can be observed in the wide frequency range, including LF. If this is the only cause of changed FR measurement, it should be easy to detect. However, if these results were to be combined with capacitance changes, such as for modeling results shown in
Figure 7 and
Figure 8, the outcome would be difficult to properly interpret. Such a transformer would possibly be described as faulty, while visible changes may be the result of the wrong tap position combined with some capacitive changes on the bushing of different phases than those measured. Yet another problem is core magnetization, which influences only LF range. An example of such a measurement is given in
Figure 13.
If these changes, visible up to 1 kHz, were to be combined with capacitive influence coming from different phases, the result may be very similar to the original curve.
5. Conclusions
This paper provides the analysis of the influence of capacitive and inductive parameters on the frequency response of transformer windings. The FRA method is one of the important test methods of power transformers, being a part of advanced diagnostics. The interpretation of measured data is not always easy, especially in cases where two compared curves (i.e., measured in the same test setup in time intervals) differ in some frequency ranges. The question is if such a difference is related to deformation or electric fault in the windings, or maybe it has its source in some additional effects.
The first aim of the paper was to prepare a computer model of a transformer that would allow for analysis of capacitance and inductance changes on the frequency response. The results of modeling showed that changes of inductance of the winding or changes in capacitive parameters have an influence on FR curve. It can be seen as the frequency shifts of FR. Such an influence was expected, however combination of changes in these parameters may lead to misleading effects on the shape of FR characteristics. It was shown in modeling results that capacitance has its influence in the LF range, while inductance changes influence FR curve in the wider range. The second aim of the paper was to provide results from industrial measurements that would verify conclusions obtained from the model. There are two groups of such results presented: measured for different positions of OLTC, and with an additional capacitor installed on bushings in phases other than those tested. It can be seen that some differences between two compared curves, measured for the same unit, which are visible in MF range and related to local deformations, may be the effect of inductance changes (e.g., different tap positions for both measurements). The verification of such a measurement mistake by observing the LF range may be misleading if additional capacitive effects cover the inductive effect, or if the core of a transformer was magnetized by earlier DC measurement.
Practical measurement values of changes of inductance or capacitance, which influence the shape of FR, are unknown. In addition, each transformer construction has a different FR curve shape, in which the position and number of resonances are different, therefore the influence of C and L parameters can appear in a different way. This makes it difficult to give one universal method for detection of these changes (e.g., a simple formula), which were described in this paper, but it is easy to analyze characteristic behavior in given frequency ranges, which are related to L and C changes. For example, the capacitance change influence of FR ends above 5–10 kHz. This value depends on the geometrical size of the unit (related to the power rating and nominal voltages). The problem of finding universal markers for detecting inductance or capacitance changes will be the aim of further research.
The paper presents analysis that can be used in the assessment of FRA measurement, especially in the case of uncertain data comparison results.


