Article

Numerical Study of the Effect of Inclusions on the Residual Stress Distribution in High-Strength Martensitic Steels During Cooling

1
State Key Laboratory of Advanced Metallurgy, University of Science and Technology Beijing, Beijing 100083, China
2
Department of Mechanical Engineering, Aalto University, Puumiehenkuja 3, 02150 Espoo, Finland
3
Steel Institute, RWTH Aachen University, Intzestrasse 1, 52074 Aachen, Germany
*
Authors to whom correspondence should be addressed.
Appl. Sci. 2019, 9(3), 455; https://doi.org/10.3390/app9030455
Submission received: 31 December 2018 / Revised: 24 January 2019 / Accepted: 26 January 2019 / Published: 29 January 2019
(This article belongs to the Special Issue Recent Trends in Advanced High-Strength Steels)

Abstract

:
In high-strength martensitic steels, the inclusions significantly affect the material performance especially in terms of fatigue properties. In this study, a numerical procedure to investigate the effect of the inclusions types and shapes on the residual stresses during the cooling process of the martensitic steels is applied systematically based on the scanning electronic microscopy (SEM) and energy dispersive spectrometer (EDS) results of different types of inclusions. The results show that the maximum residual stress around the interface between Mg-Al-O inclusion and the matrix is the largest, followed by TiN, Al-Ca-O-S, and MnS when the inclusions are assumed as perfect spheres for simplicity. However, these results are proved to be 28.0 to 48.0% inaccurate compared to the results considering actual shapes of inclusions. Furthermore, the convex shape of inclusion will lead to stress concentration in the matrix while the concave shape of inclusion will lead to stress concentration in the inclusion. The residual stress increases with the increase of inclusion edge angle. The increase rate is the largest for TiN inclusions on the concave angle, which leads to extreme stress concentration inside TiN inclusion.

1. Introduction

Driven by the increasing demand on the higher mechanical performance of engineering structures, high-strength steels are steadily developed and widely applied in recent decades in multiple areas, e.g., automotive, high-speed trains, and aerospace. The high strength is mainly obtained by the in-depth and complicated design of the microstructure of steels, which also leads to new damage mechanisms for multiphase steels [1,2,3,4,5]. In terms of fatigue properties, a fatigue limit is normally evident for the conventional steels developed some decades ago [6,7,8]. Murakami et al. [9] reported that the fatigue limit increases with the increase of steel hardness and decreases with the increase of the defect area. Therefore, increasing the strength of materials is leading to a higher hardness and eventually a higher fatigue strength limit assuming the same defect size. However, for the recently developed high-strength steels, it is found that even when stress amplitude is lower than fatigue limit, the fatigue crack still will occur when fatigue life reaches a certain level [9,10,11,12]. For higher stress and lower fatigue life, fatigue crack usually occurs from the component surface; for lower stress and longer fatigue life, fatigue crack usually occurs from inner microstructure [13].
The deformation heterogeneity in microstructure level, which is responsible for the damage and failure in general for steels, can be generally caused by two different mechanisms: the matrix inhomogeneity and the matrix-inclusion inhomogeneity [14,15]. Many researchers have focused on the effect of matrix inhomogeneity on mechanical properties, their damage mechanism with experiments and modelling. Lian et al. investigated the damage mechanism of a DP600 steel under different stress states experimentally [16] and via micromechanical simulation [17] and found that damage is initiated at the boundary of ferrite and martensite due to their strong deformation incompatibility. It was further revealed that the damage initiation is by nature stress state dependent due to the strain localization dependency of stress states. Krupp et al. [18] studied the fatigue crack initiation process of duplex stainless steel and quantified the interactions of cracks with the first microstructural barrier. Alharbi et al. [19] investigated the stress state of martensite and ferrite before cracking of dual phase DP1000 steel and estimated for crack initiation in the martensite. He et al. [20] reported that for a ferritic–pearlitic steel, the initiation of the cleavage fracture is located in the pearlitic phase where the ferrite and the cementite show a lamella structure with different properties.
In addition to steel matrix inhomogeneity, inclusions also play a significant role during the failure process. Fairchild et al. [21] reported the influence of inclusions on cleavage initiation and the relation between inclusion crack and steel matrix crack. Yang et al. [22] studied 42CrMo steel with different amounts of inclusions and found that the fatigue property was better with fewer inclusions. Sakai et al. [23] found that internal inclusions could lead to the formation of the penny-shape fine granular layer around inclusions during long-term cyclic loadings, which would cause small cracks inside the steel matrix. While investigating inclusions in steel, it is also found that there are multiple types of inclusions in steels [24,25] generated in different processes during the steel production [26,27]. For example, the Al2O3 inclusion is produced during melting of steel while the TiN inclusions are produced during the casting of steels. Besides, the shape, size, and composition of inclusions, affected by the production method, also differ, leading to different effects on the mechanical properties of steels [28,29].
The production processes additionally induce another level of inhomogeneity, residual stresses, based on the microstructure-level inhomogeneity. For the steel matrix, it is found that the mechanical deformation, such as rolling [30] and indentation or surface treatment [31] could introduce the grain-level residual stresses and they are grain orientation dependent. For the interaction between the steel matrix and inclusions, the thermal treatment, e.g., cooling, could induce large local residual stress, which would affect the mechanical properties of the steel significantly [32]. These residual stresses are generally generated due to the different thermal expansion properties of inclusions and steel matrix during temperature variation. Brooksbank and Andrews [33,34] developed a model to calculate the residual stress around spherical and cylindrical inclusions and reported the residual stresses around the boundaries between different inclusions and steel matrix were different. This model was widely applied by researchers to calculate residual stresses around inclusions in different steels [35,36]. Murakami and Uchida [37] claimed that the residual stresses induced by different thermal expansion properties around Al2O3 inclusions will lead to debonding of inclusions from steel matrix based on calculations, which seriously affects the mechanical properties of steel. In addition to common inclusions, carbides, which are close to the surface, will also cause irregular stress distribution [38]. In terms of finite element-based modelling, there are researchers simulating the residual stresses around inclusions and analyze their effects on mechanical properties. Pineau and Forest [39] performed an elastic–plastic finite element calculation to determine the residual stresses in the vicinity of the inclusions. The results show that the residual equivalent plastic flow occurs all around the inclusion during cyclic loading, which plays an essential role in crack initiation. Gu et al. [40,41] proposed a microstructure-based model considering residual stress induced by temperature variation. This model offers a more arcuate prediction on crack initiation site during fatigue process compared to the model neglecting residual stress.
Although all these above-mentioned studies offer good illustrations of the numerical residual stress distributions around inclusions and their strong effects on the mechanical behaviour, the gap is also evident: Actual inclusion shape is not considered. For simplicity, these models and calculations only considered the inclusion as a simple geometrical shape, such as spherical and cylindrical. For actual inclusions in steel, the shape varies dramatically and contains multiple details, which will greatly affect the residual stress distribution around inclusions. In terms of experiments, quantifying residual stress around inclusions still faces challenges due to the redistribution of residual stress while machining specimens. Therefore, it is aimed in this study to apply a numerical procedure to investigate the effect of the inclusions types and shapes on the residual stresses systematically during the cooling process of the martensitic steels. It is emphasized that by using a numerical approach, the shape effect and the effect of the inclusions type in terms of the mechanical properties can be distinguished and individually studied. The ideal spherical shape is first assumed for all the inclusions, and the numerical results are compared with the analytical model. Furthermore, models were established with the actual shapes of inclusions in steel, and the residual stress distributions were analyzed numerically to clarify the relation between shape variation and residual stress distribution of different inclusions. A further quantitative comparison study of the residual stress result between the inclusions with ideal shape and the actual shape was conducted. This study provides the basis for further researches on numerical prediction of crack behaviour and cracks mechanism modelling for high-strength steels.

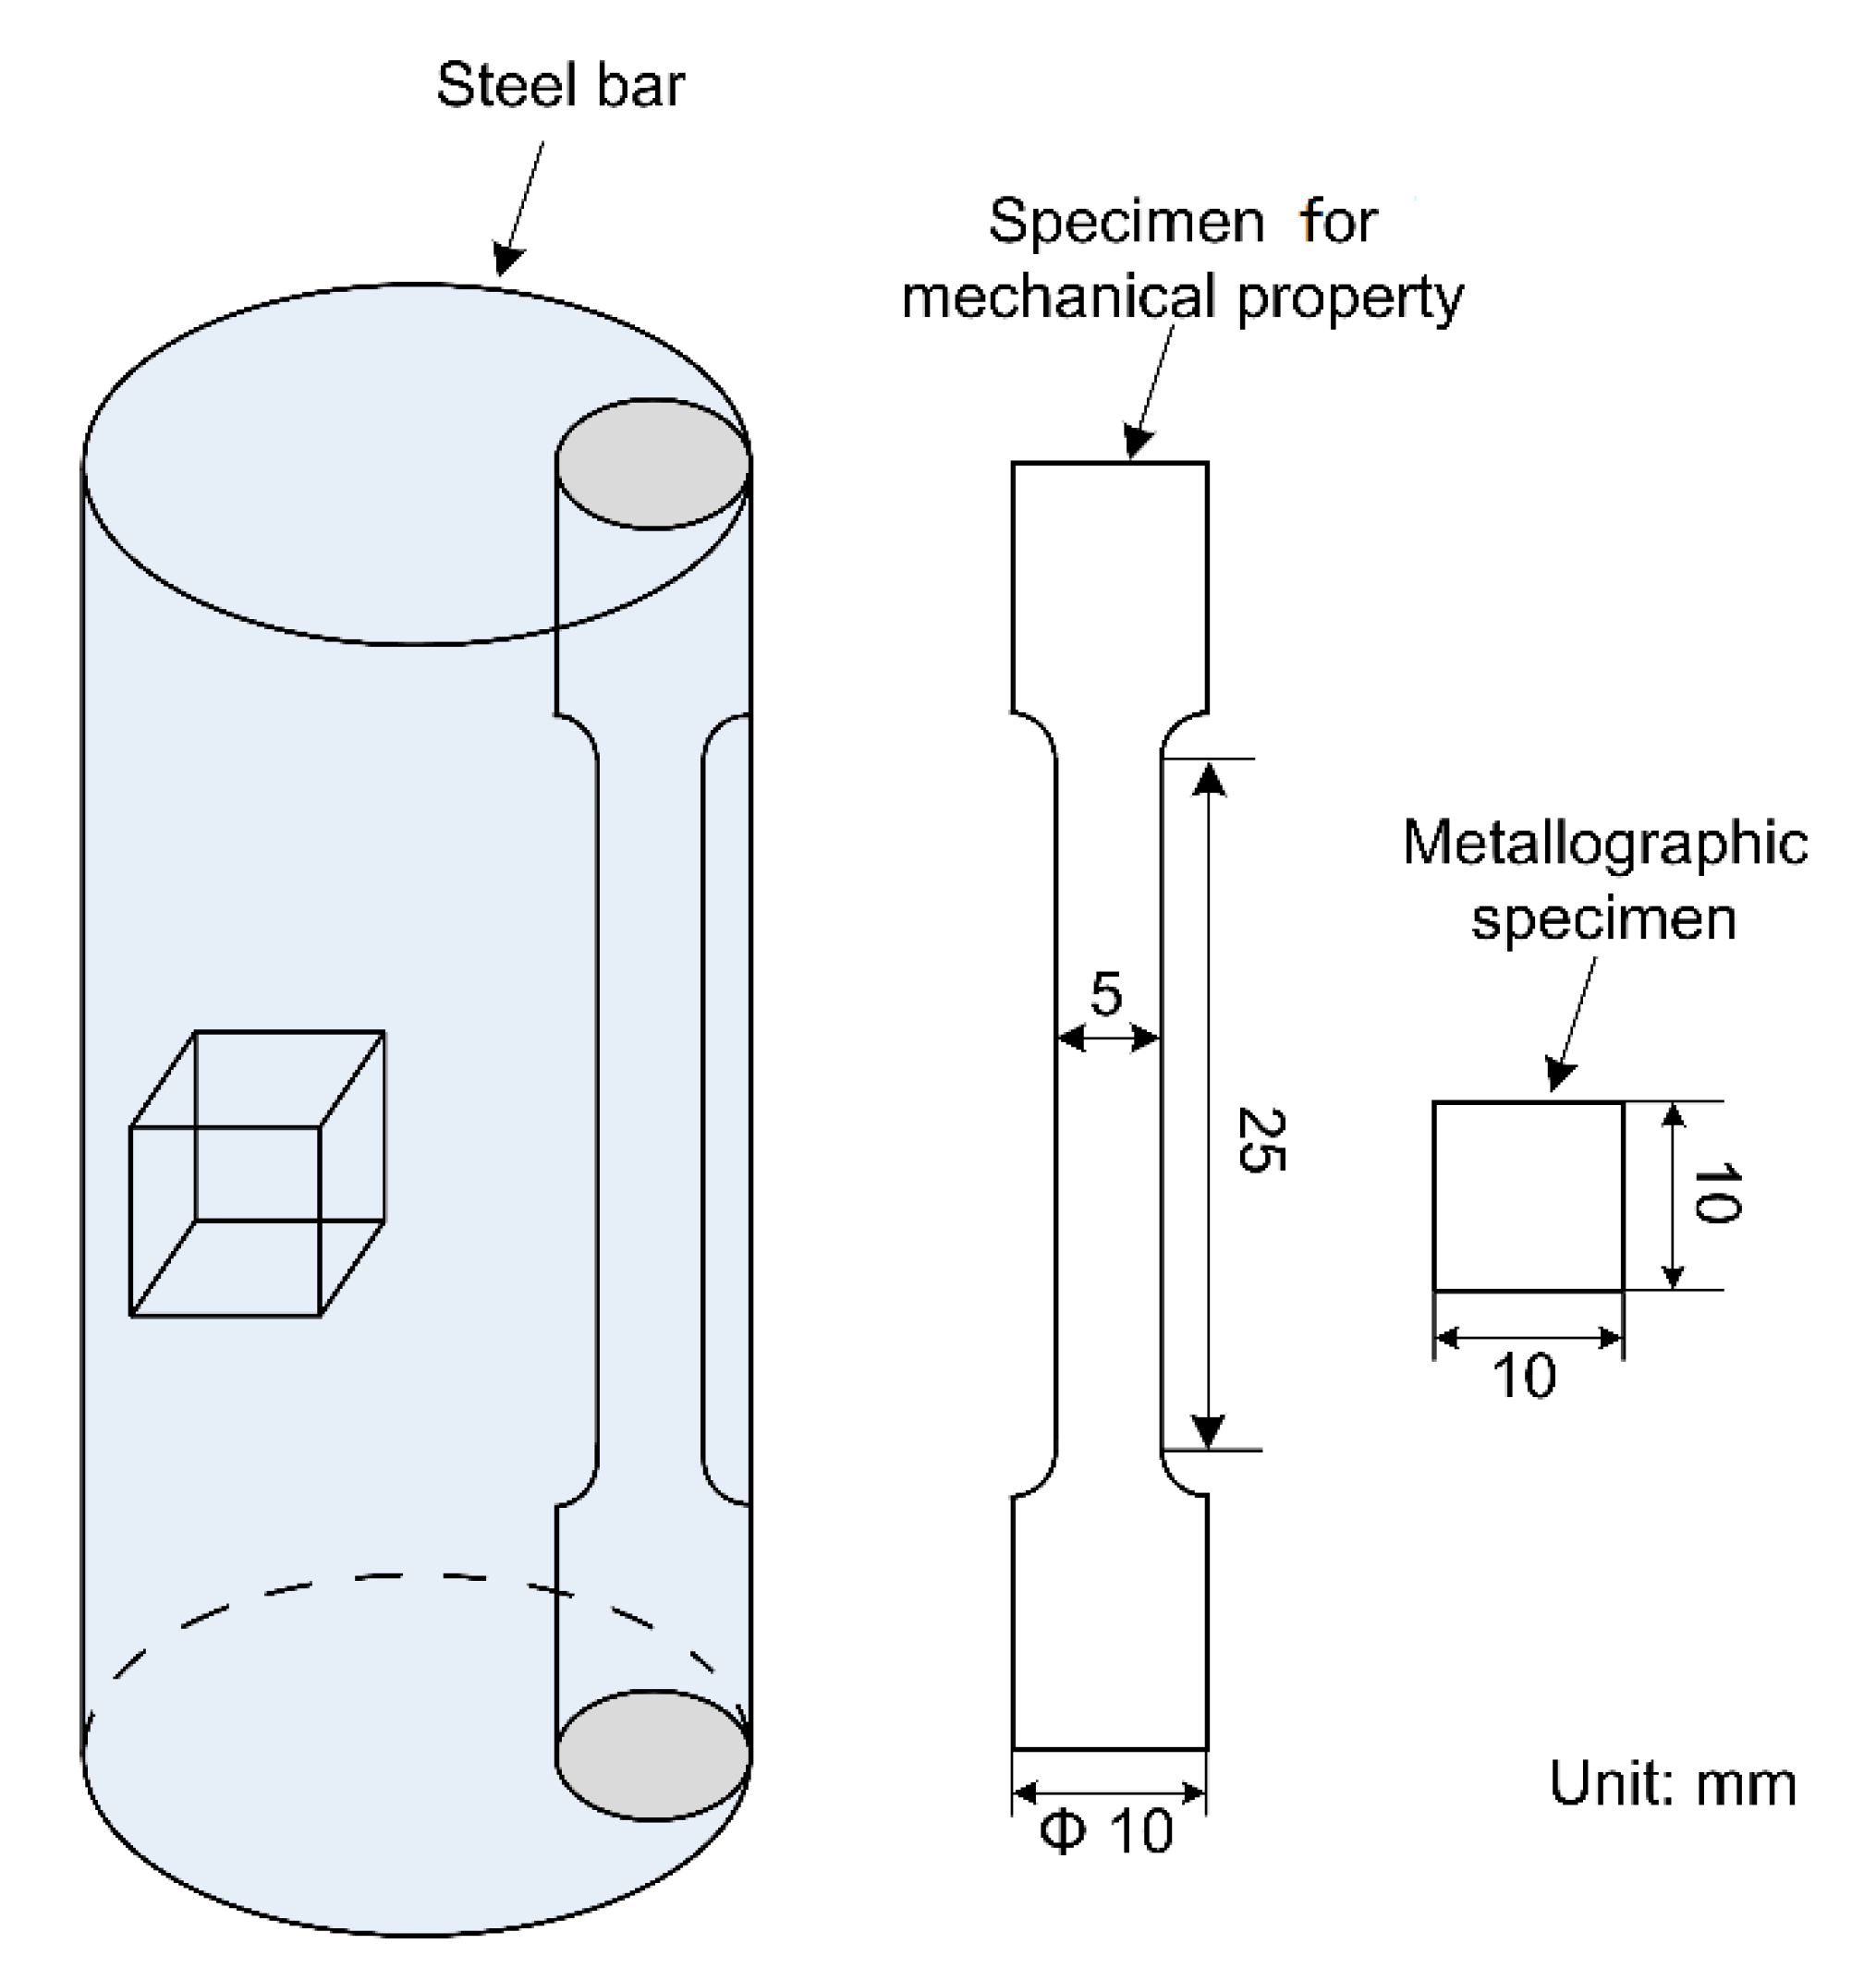
2. Materials and Methods

The material in the present study is high carbon martensitic bearing steel with 1.12% C and 1.41% Cr. The main chemical composition is shown in Table 1. This material was hot rolled into a steel bar with a diameter of 35 mm, vacuum oil quenched after holding for 20 min at 835 °C and tempered for 120 min at 180 °C.
The mechanical properties were tested with the specimen represented in Figure 1. The specimen was perpendicular to the cross section of the steel bar. According to recent studies [42,43,44,45], the manufacturing methods of the specimen can affect the results of the tensile test. In this study, the cutting method of a wire electro discharge machining was adopted. With this method, the geometric-dimensional requirements can be easily met without any significant change in the mechanical properties. The extension rate of the tensile test was 1.0 mm/min. A metallographic specimen was also taken from the steel bar and polished by SiC paper and diamond suspensions in the cross-section of steel bar. Nonmetallic inclusions were observed with scanning electronic microscopy (SEM) and the compositions of inclusions were analyzed with energy dispersive spectrometer (EDS).

3. Modelling and Simulation

The geometrical profiles of typical inclusions in the steel observed with SEM were captured as coordinates with MATLAB (version 2016a, MathWorks, Natick, MA, USA, 1984). Due to the differences in contrast between inclusion and steel matrix in the SEM picture, the MATLAB codes can assist to recognize the details of inclusion shape in a desirable way. Thereafter, the coordinates of inclusion shape were processed by a Python script using the Abaqus (Dassault Systèmes Simulia Crop., Providence, RI, USA, 1994) extension of the Python programming language to create the inclusion component of the Abaqus model. The version of Abaqus is Abaqus 2017. The steel matrix was set as a square area (30 × 30 μm2) and assumed to be a homogeneous material with a single phase and elastic only. The inclusions were positioned in the middle of the matrix area so that the residual stress around the inclusion was not affected by the matrix interface.
The simulated process was the cooling procedure during oil quenching. The temperature variation was from 835 °C to the room temperature, which was set at 20 °C. The temperature was defined with pre-defined field in Abaqus/Standard. The thermal expansion coefficients and the mechanical property parameters of different inclusions and steel matrix were obtained from references and experiments in the present study.
During the cooling process, the thermal stress of every node during the elastic deformation in the inclusion-matrix system was calculated with Equation (1).
ε = αi(TT0)
where i is the material definition number, which represents steel matrix and different inclusions; αi is the thermal expansion coefficient; T0 is the initial temperature, and T is the current temperature.
To avoid over constraining the thermal expansion of the system and guarantee the accuracy of the simulation, it is important to define proper interface conditions. In the present study, the left side of the square steel area was fixed in the x-direction and still can move in the y-direction. The element type is set as “continuum-plane stress-3 nodes (CPS3)”. The simulation type is static.

4. Results and Discussion

4.1. Properties of Inclusion and Steel Matrix

The stress vs. strain curve of the martensitic steel is shown in Figure 2 based on the tensile tests described in Section 2. According to the figure, the mechanical properties of the steel matrix are shown in Table 2.
There are four main types of inclusions in the martensitic steel: spinel (Mg-Al-O), calcium aluminum (Al-Ca-O-S), titanium nitride (TiN), and manganese sulfide (MnS). The typical morphologies are shown in Figure 3. The Mg-Al-O inclusions are usually polygon. The Al-Ca-O-S inclusions are usually spherical. The TiN inclusions are usually irregular in shape. The MnS inclusions usually precipitate in the grain interface as spherical, cylindrical or irregular. All these different shape features will contributed to the variation of residual stress distribution around inclusions, which will be discussed in Section 4.3. The thermal expansion coefficients and the mechanical properties of different inclusions, as well as the steel matrix, are presented in Table 3, which are the required material parameters of the simulation in the following sections.

4.2. Residual Stress Distribution Around Spherical Inclusions

The residual stress distribution around inclusions was already calculated by Brooksbank and Andrews [33]. In their model, inclusions were simplified as perfect spherical. The radial stress in the surface between inclusion and steel matrix can be calculated with Equations (2) and (3).
σ R = ( α M α ) Δ T 0.5 ( 1 + υ M ) + ( 1 2 υ M ) d 3 E M ( 1 d 3 ) + ( 1 2 υ ) E
d = R/RM
where αM and α are the coefficients of linear expansion of the steel matrix and the inclusion, respectively; vM and v are the Poisson’s ratios of the steel matrix and the inclusion, respectively; EM and E are the Young’s modulus of the steel matrix and inclusion, respectively; ΔT is the difference between the holding temperature before vacuum quenching and the room temperature; R is the radius of the inclusion, and RM is the radius of the steel matrix around a single inclusion, which is half of the distance between two inclusions with the same type.
To clarify the influence of inclusion type on residual stress distribution and make a comparison of the calculation results in the present study with the model of Brooksbank and Andrews, perfect spherical Mg-Al-O, Al-Ca-O-S, TiN, and MnS inclusions were inserted in the square steel matrix. The geometry model and the calculation results of residual stress distribution are shown in Figure 4. It is obvious that the residual stress in the steel matrix around the inclusion decreases when the distance to inclusion surface increases. The position of the maximum stress is on the surface between the inclusion and steel matrix. When the inclusion is spherical, the stress on the surface between inclusion and steel matrix keeps constant around the inclusion. This constant maximum stress varies with inclusion type. The value of Mg-Al-O inclusion is the largest, followed by TiN and Al-Ca-O-S inclusions while the value of MnS inclusion is the smallest. These simulation results are also compared with the calculation results with Equations (2) and (3) in Figure 5. Except for TiN inclusions, the order of the values of the maximum residual stress on the interface between inclusions and steel matrix calculated with the two methods keeps consistent, while the results of TiN inclusions differ more greatly. It is noted that all the residual stresses around perfect spherical Mg-Al-O, Al-Ca-O-S, TiN, and MnS inclusions are compressive due to smaller α of inclusions than steel matrix.

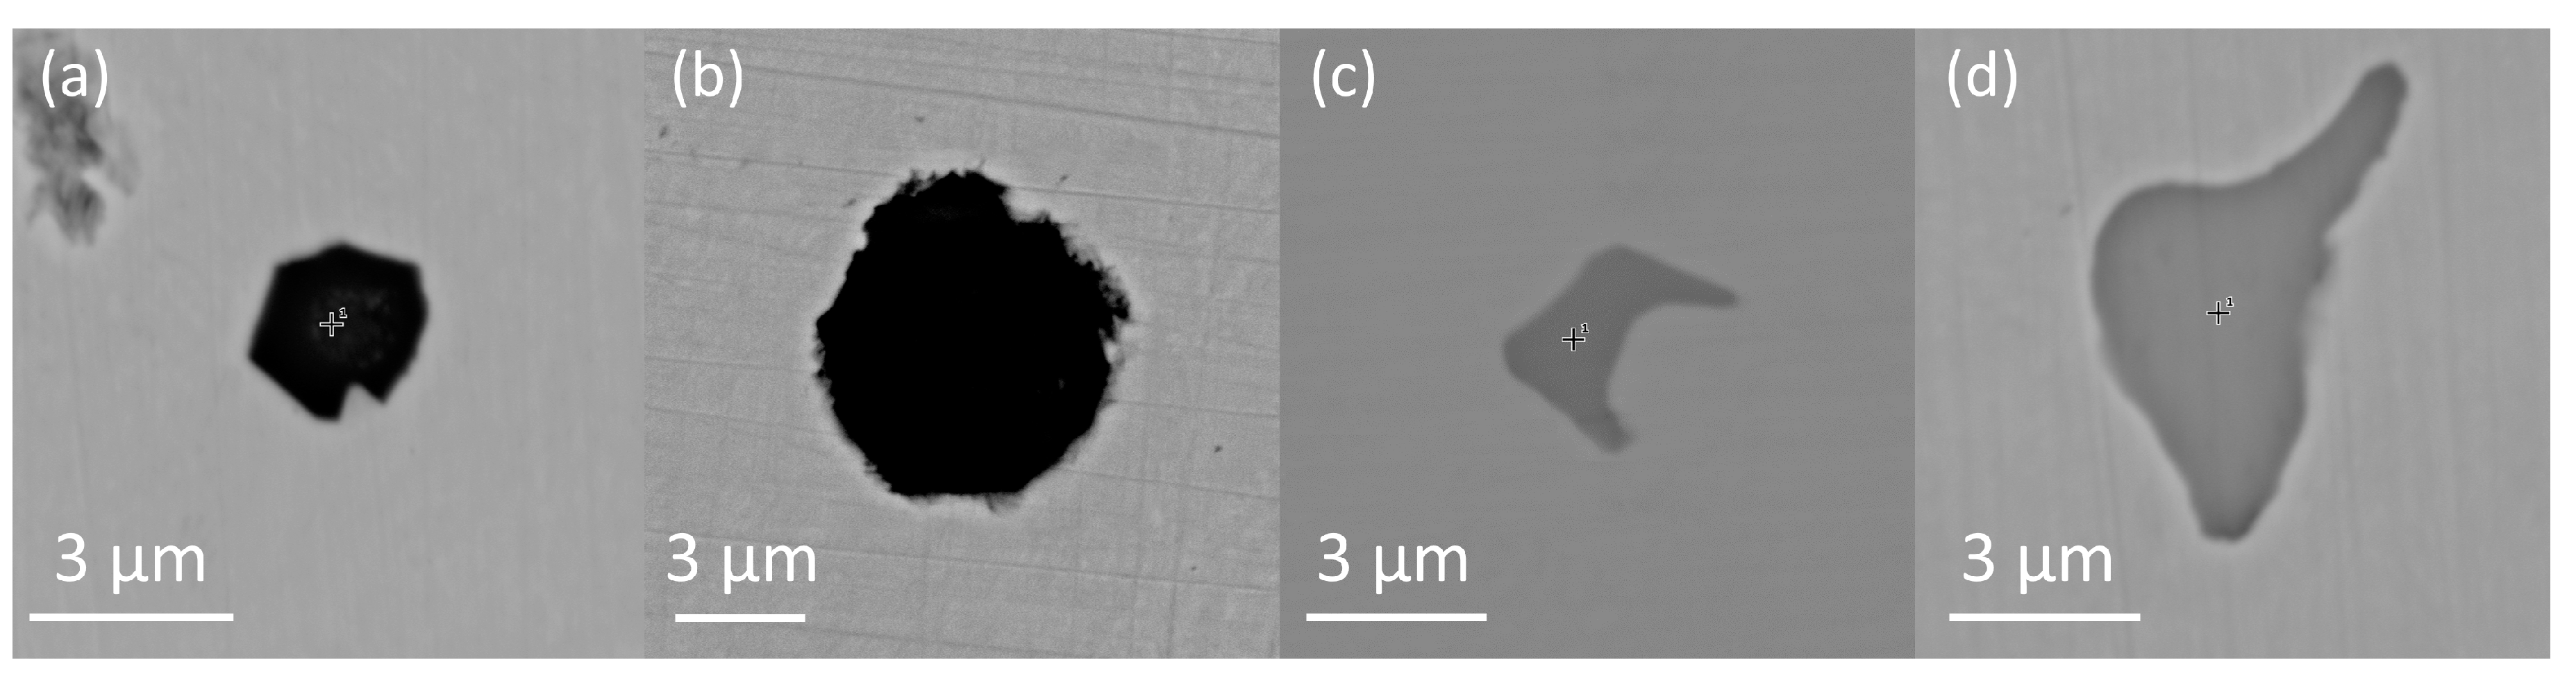
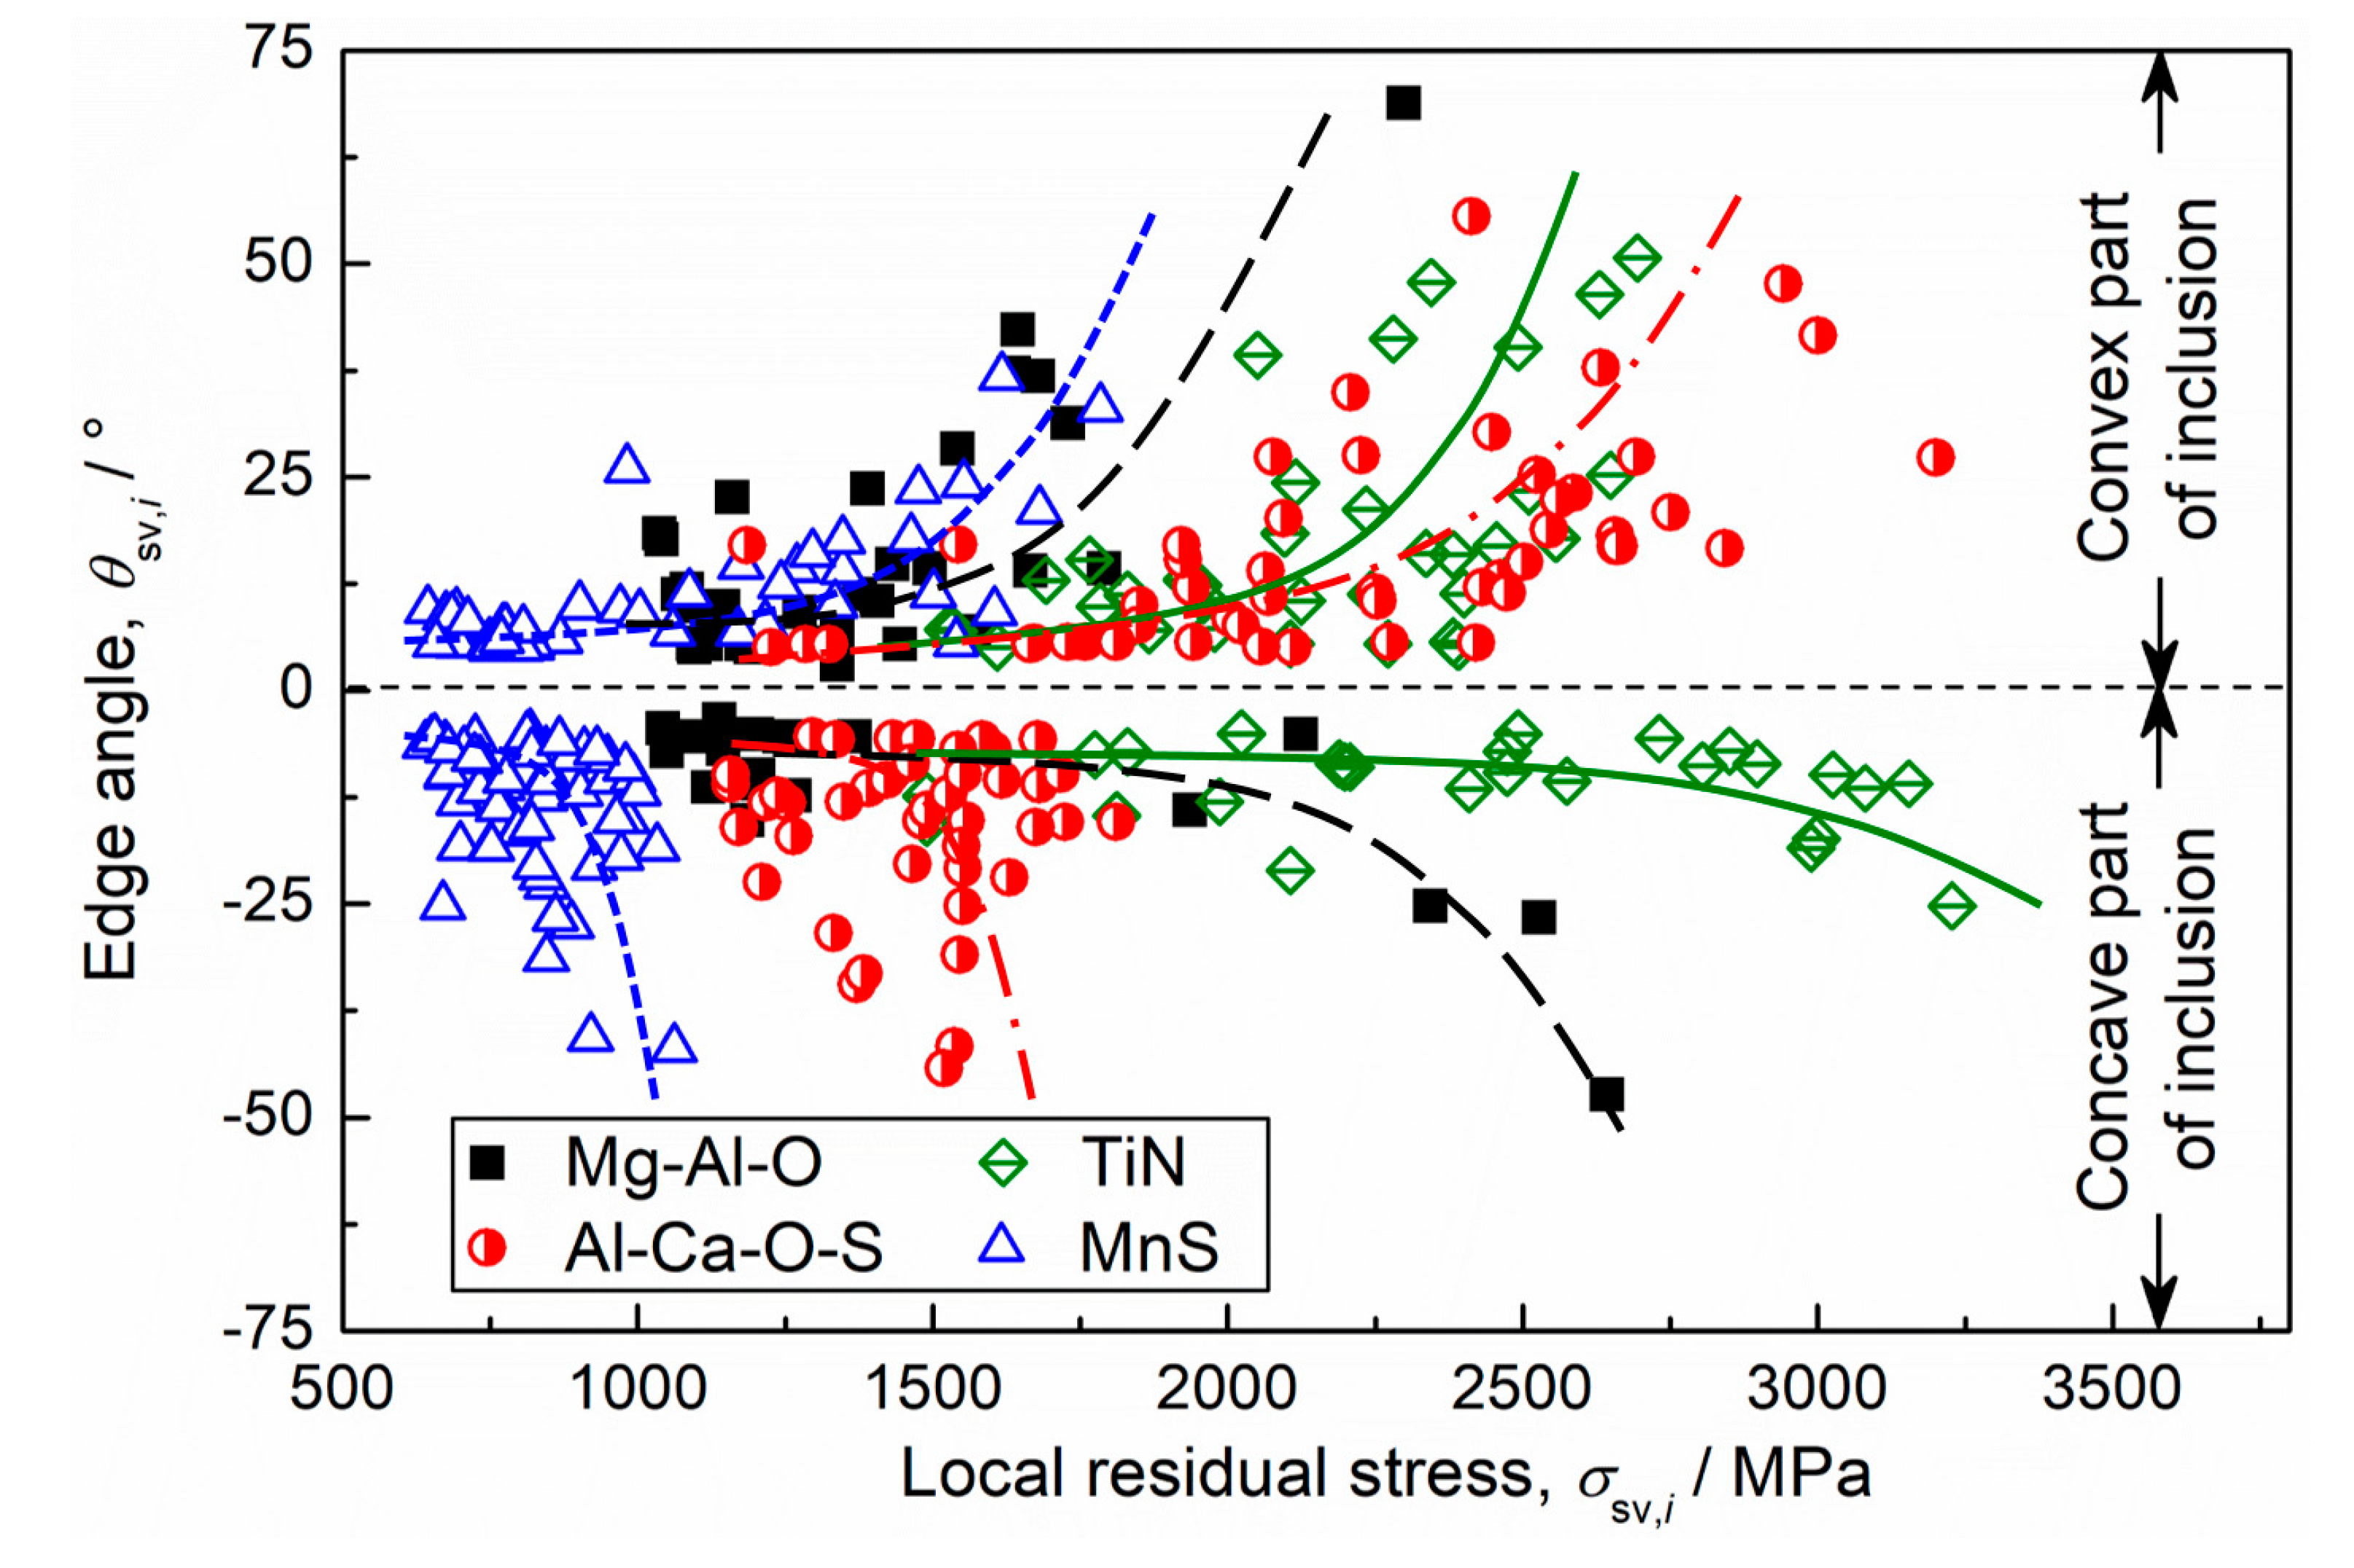
4.3. Residual Stress Distribution Around Actual Inclusions

When inclusions are assumed as spherical, the shape details are actually neglected. Nevertheless, as shown in Figure 3, the inclusions of different types usually possess different geometry shapes, which will lead to important stress concentration around interfaces between the inclusions and the steel matrix. In this Section, four types of inclusions in Figure 3 were inserted in the square steel area, and the residual stress distributions were simulated. The simulation results are shown in Figure 6. Generally, the residual stress also decreases when the distance to inclusion surface increases, which is consistent with the case of the perfect spherical inclusion, while the maximum residual stresses for these four types of inclusions all increased compared to the maximum stress of spherical inclusions. Besides, the residual stress on the surface between the inclusion and the steel matrix changes with the shape of inclusions.
To quantitatively analyze the effect of the inclusion shape on residual stress changes, two parameters were introduced: the edge angle θsv,i and the local residual stress σsv,i. These two parameters represent the smooth of the inclusion edge and the corresponding local residual stress for each θsv,i. The calculation method of θsv,i is shown in Equation (4) and the schematic is shown in Figure 7.
θsv,i = θi+1θi
where i is the identification number of digital point on the inclusion edge. All the digital point were sequenced continually in an anticlockwise direction. θi is the angle between the x-axis and the straight line through the (i-1)th and the ith digital point on the inclusion edge, which can be calculated with Equation (5).
θi = arctan [(yiyi-1)/(xi − xi-1)] (0 ≤ θi ≤ 180°)
where xi and yi are the coordinates of the digital ith point on the inclusion edge. When θi is a positive value, the local part of inclusion is convex; when θi is a negative value, the local part of inclusion is concave. The smaller the absolute value of θsv,i is, the smoother the inclusion edge is. When θsv,i is zero, the local shape of the inclusion is a straight line. For a right angle, θsv,i is 90°. It is to be noted that, the distance between each neighboring point will affect the result of θsv,i. Therefore, the distance between each neighboring point is kept consistent in this study which offers a value of 3.6° for θsv,i in a perfect circle.
These two parameters of each digital point on inclusion edges of Mg-Al-O, Al-Ca-O-S, TiN and MnS shown in Figure 6 were extracted and calculated. The relation between these two parameters is shown in Figure 8. To avoid the interaction of neighboring points, the data with θsv,i lower than 5° were neglected. As shown in the figure, the local residual stress σsv,i increases with the absolute value of edge angle θsv,i for all four types of inclusions, which indicates that no matter the local shape of the inclusion is convex or concave, the sharp edge will lead to stress concentration. When the local shape is convex, the stress concentration is in the steel matrix side; when the local shape is concave, the stress concentration is in the inclusion side (see Figure 6).
In addition, θsv,i, inclusion type also plays a significant role in the effect on local residual stress variation with θsv,i. For the convex part of inclusion, the local residual stress of MnS inclusion increases the fastest with θsv,i among these four types of inclusions. When there is a convex angle of 25° on the inclusion surface, the local residual stress will increase about 1.64 times for MnS, 1 time for Al-Ca-O-S, 0.75 times for Mg-Al-O, and 0.53 times for TiN. For concave part of inclusion, the local residual stresses of Mg-Al-O and TiN inclusions increase the fastest, followed by MnS and Al-Ca-O-S. When there is the concave angle of 25° on the inclusion surface, the local residual stress will increase about 0.48 times for Al-Ca-O-S, 0.51 times for MnS, 1.32 times for Mg-Al-O, and 1.25 times for TiN. Although the local residual stress increases the fastest for convex part of MnS inclusion, the concentrated residual stress on the steel matrix side still does not exceed the other three types of inclusion under the same value of θsv,i. However, for the concave part of inclusion, large θsv,i on the surface of TiN inclusion will lead to extremely large stress concentration on the inclusion side. This is also the reason that TiN inclusion itself often cracks in steel. These cracks inside inclusions can extend into steel matrix during the service of steel, causing failure of component [4]. Therefore, to obtain better performance it is important to avoid sharp edges of TiN inclusion.
To clarify the effect of the shape on the maximum residual stress around different types of inclusions, the maximum residual stresses of perfect spherical inclusions and inclusions with actual shape are shown in Figure 9. The maximum residual stresses of perfect spherical inclusions of all types are obviously smaller than the cases considering inclusion shapes. When we assume the inclusion shape as a perfect sphere for simplicity, there will be a non-negligible error of around 28.0 to 48.0%.

5. Conclusions

The cooling process during heat treatment will lead to residual stress around the interface between inclusion and steel matrix due to different thermal expansion coefficients and mechanical properties. In this study, the effect of the inclusion types and shapes on the residual stresses during the cooling process of the martensitic steels was investigated with a numerical procedure. The following results were obtained:
(1) This residual stress varies with inclusion type and shape. For perfect spherical inclusion, the residual stress around the interface between Al-Mg-O inclusion and steel matrix is the largest, followed by TiN and Al-Ca-O-S inclusion while the residual stress around MnS inclusion is the smallest.
(2) When the inclusion shape is assumed as a perfect sphere for simplicity, there will be a non-negligible error of the maximum residual stress of around 28.0 to 48.0% compared with the residual stresses considering the actual shapes.
(3) The convex local shape of inclusion will lead to stress concentration in the steel matrix side, and the concave local shape of inclusion will lead to stress concentration in the inclusion side.
(4) The local residual stress of MnS inclusion increases the fastest with the increase of inclusion edge angle θsv,i for the convex part of inclusion. For the concave part, the local residual stress of TiN inclusions increases the fastest, which leads to extreme stress concentration inside TiN inclusion and contributes greatly to material failure.

Author Contributions

Investigation, C.G. and J.L.; methodology, C.G.; data curation, C.G. and W.X.; writing-original draft preparation, C.G.; writing-review and editing, L.J. and S.M.; supervision, L.J., S.M. and Y.B.; funding acquisition, Y.B.

Funding

This research was funded by the State Key Laboratory for Advanced Metallurgy Foundation (No. 41602014).

Conflicts of Interest

The authors declare no conflict of interest.

References

  1. Uthaisangsuk, V.; Prahl, U.; Bleck, W. Modelling of damage and failure in multiphase high strength DP and TRIP steels. Eng. Fract. Mech. 2011, 78, 469–486. [Google Scholar] [CrossRef]
  2. Münstermann, S.; Lian, J.; Bleck, W. Design of damage tolerance in high-strength steels. Int. J. Mater. Res. 2012, 103, 755–764. [Google Scholar] [CrossRef]
  3. Li, S.; He, J.; Gu, B.; Zeng, D.; Xia, Z.C.; Zhao, Y.; Lin, Z. Anisotropic fracture of advanced high strength steel sheets: Experiment and theory. Int. J. Plast. 2018, 103, 95–118. [Google Scholar] [CrossRef]
  4. Pornputsiri, N.; Kanlayasiri, K. Experimental Study on Failure Mechanism of Advanced High Strength Steels in Air Bending Process. IOP Conf. Ser. Mater. Sci. Eng. 2018, 361, 012015. [Google Scholar] [CrossRef]
  5. Fras, T.; Roth, C.C.; Mohr, D. Fracture of high-strength armor steel under impact loading. Int. J. Impact Eng. 2018, 111, 147–164. [Google Scholar] [CrossRef]
  6. Murakami, Y.; Usuki, H. Quantitative evaluation of effects of non-metallic inclusions on fatigue strength of high strength steels. II: Fatigue limit evaluation based on statistics for extreme values of inclusion size. Int. J. Fatigue 1989, 11, 299–307. [Google Scholar] [CrossRef]
  7. Collins, J.A. Failure of Materials in Mechanical Design: Analysis, Prediction, Prevention; John Wiley & Sons: Hoboken, NJ, USA, 1993. [Google Scholar]
  8. Pascual, F.G.; Meeker, W.Q. Estimating Fatigue Curves with the Random Fatigue-Limit Model. Technometrics 1999, 41, 277–289. [Google Scholar] [CrossRef]
  9. Murakami, Y.; Nomoto, T.; Ueda, T. Factors influencing the mechanism of superlong fatigue failure in steels. Fatigue Fract. Eng. Mater. Struct. 1999, 22, 581–590. [Google Scholar] [CrossRef]
  10. Bathias, C. There is no infinite fatigue life in metallic materials. Fatigue Fract. Eng. M 1999, 22, 559–565. [Google Scholar] [CrossRef]
  11. Marines, I. An understanding of very high cycle fatigue of metals. Int. J. Fatigue 2003, 25, 1101–1107. [Google Scholar] [CrossRef]
  12. Pyttel, B.; Schwerdt, D.; Berger, C. Very high cycle fatigue—Is there a fatigue limit? Int. J. Fatigue 2011, 33, 49–58. [Google Scholar] [CrossRef]
  13. Li, S.X.; Weng, Y.Q.; Hui, W.J.; Yang, Z.G. Very High Cycle Fatigue Properties of High Strength Steels-Effects of Nonmetallic Inclusions, 1st ed.; Metallurgical Industry Press: Beijing, China, 2010. [Google Scholar]
  14. Gu, C.; Bao, Y.P.; Gan, P.; Lian, J.H.; Münstermann, S. An Experimental Study on the Impact of Deoxidation Methods on the Fatigue Properties of Bearing Steels. Steel Res. Int. 2018, 89, 1800129. [Google Scholar] [CrossRef]
  15. Zhao, P.; Gao, G.; Misra, R.D.K.; Bai, B. Effect of microstructure on the very high cycle fatigue behavior of a bainite/martensite multiphase steel. Mat. Sci. Eng. A Struct. 2015, 630, 1–7. [Google Scholar] [CrossRef]
  16. Lian, J.; Sharaf, M.; Archie, F.; Münstermann, S. A hybrid approach for modelling of plasticity and failure behaviour of advanced high-strength steel sheets. Int. J. Damage Mech. 2013, 22, 188–218. [Google Scholar] [CrossRef]
  17. Lian, J.; Yang, H.; Vajragupta, N.; Münstermann, S.; Bleck, W. A method to quantitatively upscale the damage initiation of dual-phase steels under various stress states from microscale to macroscale. Comp. Mater. Sci. 2014, 94, 245–257. [Google Scholar] [CrossRef]
  18. Krupp, U.; Giertler, A.; Söker, M.; Fu, H.; Dönges, B.; Christ, H.J.; Istomin, K.; Hüsecken, A.; Pietsch, U.; Fritzen, C.P.; et al. Significance and Mechanism of the Crack Initiation Process during Very High Cycle Fatigue of Duplex Stainless Steel. Procedia Eng. 2014, 74, 143–146. [Google Scholar] [CrossRef] [Green Version]
  19. Alharbi, K.; Ghadbeigi, H.; Efthymiadis, P.; Zanganeh, M.; Celotto, S.; Dashwood, R.; Pinna, C. Damage in dual phase steel DP1000 investigated using digital image correlation and microstructure simulation. Model. Simul. Mater Sci. 2015, 23, 085005. [Google Scholar] [CrossRef] [Green Version]
  20. He, J.; Lian, J.; Golisch, G.; He, A.; Di, Y.; Münstermann, S. Investigation on micromechanism and stress state effects on cleavage fracture of ferritic-pearlitic steel at −196 °C. Mater. Sci. Eng. A 2017, 686, 134–141. [Google Scholar] [CrossRef]
  21. Fairchild, D.P.; Howden, D.G.; Clark, W.A.T. The mechanism of brittle fracture in a microalloyed steel-Part I Inclusion-induced cleavage. Metall. Mater. Trans A 2000, 31, 641–652. [Google Scholar] [CrossRef]
  22. Yang, Z.G.; Li, S.X.; Zhang, J.M.; Zhang, J.F.; Li, G.Y.; Li, Z.B.; Hui, W.J.; Weng, Y.Q. The fatigue behaviors of zero-inclusion and commercial 42CrMo steels in the super-long fatigue life regime. Acta Mater. 2004, 52, 5235–5241. [Google Scholar] [CrossRef]
  23. Sakai, T.; Oguma, N.; Morikawa, A. Microscopic and nanoscopic observations of metallurgical structures around inclusions at interior crack initiation site for a bearing steel in very high-cycle fatigue. Fatigue Fract. Eng. M 2015, 38, 1305–1314. [Google Scholar] [CrossRef]
  24. Cai, X.F.; Bao, Y.P.; Lin, L.; Gu, C. Effect of Al content on the evolution of non-metallic inclusions in Si–Mn deoxidized steel. Steel Res. Int. 2016, 87, 1168–1178. [Google Scholar] [CrossRef]
  25. Deng, Z.; Zhu, M. Evolution mechanism of non-metallic inclusions in Al-killed alloyed steel during secondary refining process. ISIJ Int. 2013, 53, 450–458. [Google Scholar] [CrossRef]
  26. Gu, C.; Bao, Y.P.; Lin, L. Cleanliness distribution of high-carbon chromium bearing steel billets and growth behavior of inclusions during solidification. Rev. Metal. 2017, 53, 089. [Google Scholar] [CrossRef]
  27. Cai, X.F.; Bao, Y.P.; Wang, M.; Lin, L.; Dai, N.C.; Gu, C. Investigation of precipitation and growth behavior of Ti inclusions in tire cord steel. Metall. Res. Technol. 2015, 112, 407. [Google Scholar] [CrossRef]
  28. Spriestersbach, D.; Grad, P.; Kerscher, E. Influence of different non-metallic inclusion types on the crack initiation in high-strength steels in the VHCF regime. Int. J. Fatigue 2014, 64, 114–120. [Google Scholar] [CrossRef]
  29. Karr, U.; Schuller, R.; Fitzka, M.; Schönbauer, B.; Tran, D.; Pennings, B.; Mayer, H. Influence of inclusion type on the very high cycle fatigue properties of 18Ni maraging steel. J. Mater. Sci. 2017, 52, 5954–5967. [Google Scholar] [CrossRef] [Green Version]
  30. Xie, Q.; Gorti, S.; Sidor, J.J.; An, Y.G.; Wang, Y.D.; Lian, J.; Lan, H.; An, K. Grain Orientation Dependence of the Residual Lattice Strain in a Cold Rolled Interstitial-Free Steel. Steel Res. Int. 2018, 89, 1700408. [Google Scholar] [CrossRef]
  31. Xie, Q.; Li, R.; Wang, Y.D.; Su, R.; Lian, J.; Ren, Y.; Zheng, W.; Zhou, X.; Wang, Y. The in-depth residual strain heterogeneities due to an indentation and a laser shock peening for Ti-6Al-4V titanium alloy. Mater. Sci. Eng. A 2018, 714, 140–145. [Google Scholar] [CrossRef]
  32. Li, S.X. Effects of inclusions on very high cycle fatigue properties of high strength steels. Int. Mater. Rev. 2012, 57, 92–114. [Google Scholar] [CrossRef]
  33. Brooksbank, D.; Andrews, K.W. Tessellated stresses associated with some inclusions in steel. J. Iron Steel Inst. 1969, 207, 474–483. [Google Scholar]
  34. Brooksbank, D.; Andrews, K. Thermal expansion of some inclusions found in steels and relation to tessellated stresses. J. Iron Steel Inst. 1968, 206, 595–599. [Google Scholar]
  35. Ma, Y.; Cui, Y. Study of the effect of sulfur contents on fracture toughness of railway wheel steels for high speed train. Acta Metall. Sin. 2011, 47, 978–983. [Google Scholar] [CrossRef]
  36. Gu, C.; Bao, Y.-P.; Gan, P.; Wang, M.; He, J.-S. Effect of main inclusions on crack initiation in bearing steel in the very high cycle fatigue regime. Int. J. Min. Metall. Mater. 2018, 25, 623–629. [Google Scholar] [CrossRef]
  37. Murakami, Y.; Uchida, M. Effects of thermal residual stress and external stress on stress intensity factors for a penny-shaped crack emanating from an ellipsoidal nonmetallic inclusion. In Proceedings of the JSME Meeting, Tokyo, Japan, 1992; Volume B, pp. 239–241. [Google Scholar]
  38. Murakami, Y. Metal Fatigue: Effects of Small Defects and Nonmetallic Inclusions; Elsevier: London, UK, 2002. [Google Scholar]
  39. Pineau, A.; Forest, S. Effects of inclusions on the very high cycle fatigue behaviour of steels. Fatigue Fract. Eng. M. 2017, 40, 1694–1707. [Google Scholar] [CrossRef]
  40. Gu, C.; Lian, J.; Bao, Y.; Münstermann, S. Microstructure-based fatigue modelling with residual stresses: Prediction of the microcrack initiation around inclusions. Mater. Sci. Eng. A 2019. under review. [Google Scholar]
  41. Gu, C.; Lian, J.; Bao, Y.; Xie, Q.; Münstermann, S. Microstructure based fatigue modelling with residual stresses: Prediction of the fatigue life for various inclusion sizes. Int. J. Fatigue 2019. under review. [Google Scholar]
  42. Krahmer, D.M.; Polvorosa, R.; López de Lacalle, L.N.; Alonso-Pinillos, U.; Abate, G.; Riu, F. Alternatives for Specimen Manufacturing in Tensile Testing of Steel Plates. Exp. Tech. 2016, 40, 1555–1565. [Google Scholar] [CrossRef]
  43. Silva, C.M.A.; Rosa, P.A.R.; Martins, P.A.F. Innovative Testing Machines and Methodologies for the Mechanical Characterization of Materials. Exp. Tech. 2016, 40, 569–581. [Google Scholar] [CrossRef]
  44. Dixit, U.S.; Joshi, S.N.; Davim, J.P. Incorporation of material behavior in modeling of metal forming and machining processes: A review. Mater. Des. 2011, 32, 3655–3670. [Google Scholar] [CrossRef]
  45. De Lacalle, L.N.L.; Lamikiz, A.; Salgado, M.A.; Herranz, S.; Rivero, A. Process planning for reliable high-speed machining of moulds. Int. J. Prod. Res. 2002, 40, 2789–2809. [Google Scholar] [CrossRef]
  46. Brooksbank, D. Thermal expansion of calcium aluminate inclusions and relation to tessellated stresses. J. Iron Steel Inst. 1970, 208, 495–499. [Google Scholar]
Figure 1. Specimen geometries and their taken positions.
Applsci 09 00455 g001
Figure 2. Stress vs. strain curve of the martensitic steel.
Applsci 09 00455 g002
Figure 3. Scanning electronic microscopy (SEM) micrographs of typical inclusions: (a) Mg-Al-O; (b) Al-Ca-O-S; (c) TiN; (d) MnS.
Applsci 09 00455 g003
Figure 4. (a) Geometric illustration of the model for the residual stress simulation during cooling; residual stress distributions around the spherical inclusion of (b) Mg-Al-O; (c) Al-Ca-O-S; (d) TiN; (e) MnS.
Applsci 09 00455 g004
Figure 5. Comparison of simulated residual stresses and the maximum residual stress on the interface between steel matrix and inclusions calculated with Equation (2): (a) Mg-Al-O; (b) Al-Ca-O-S; (c) TiN; (d) MnS.
Applsci 09 00455 g005
Figure 6. Residual stress distributions around the inclusions with their actual shapes: (a) Mg-Al-O; (b) Al-Ca-O-S; (c)TiN; (d) MnS.
Applsci 09 00455 g006
Figure 7. Schematic of the edge angle θsv,i for inclusions.
Applsci 09 00455 g007
Figure 8. Relation between edge angle θsv,i and local residual stress σsv,i for different inclusions.
Applsci 09 00455 g008
Figure 9. Comparison between the maximum residual stress around different types of inclusions neglecting shapes and considering shapes.
Applsci 09 00455 g009
Table 1. Main chemical composition (unit: weight %).
CCrSiMnPSCuAl
1.121.410.370.420.0170.0040.0780.02
Table 2. Mechanical properties of the martensitic steel.
MaterialYield Stress (MPa)Tensile Stress (MPa)Young’s Modulus, E (GPa)
Martensitic steel23692633206
Table 3. Mechanical properties of the steel matrix and the inclusions in the martensitic steel [33,34,46].
MaterialCoefficient of Linear Expansion, α (10−6·°C)Young’s Modulus, E (GPa)Poisson’s Ratio, v
Mg-Al-O8.42710.26
Al-Ca-O-S5.01130.23
MnS14.81030.30
TiN9.43200.19
Steel matrix23.02060.30

