3.1. Structural and Thermal Characterization of Sol-Gel Materials
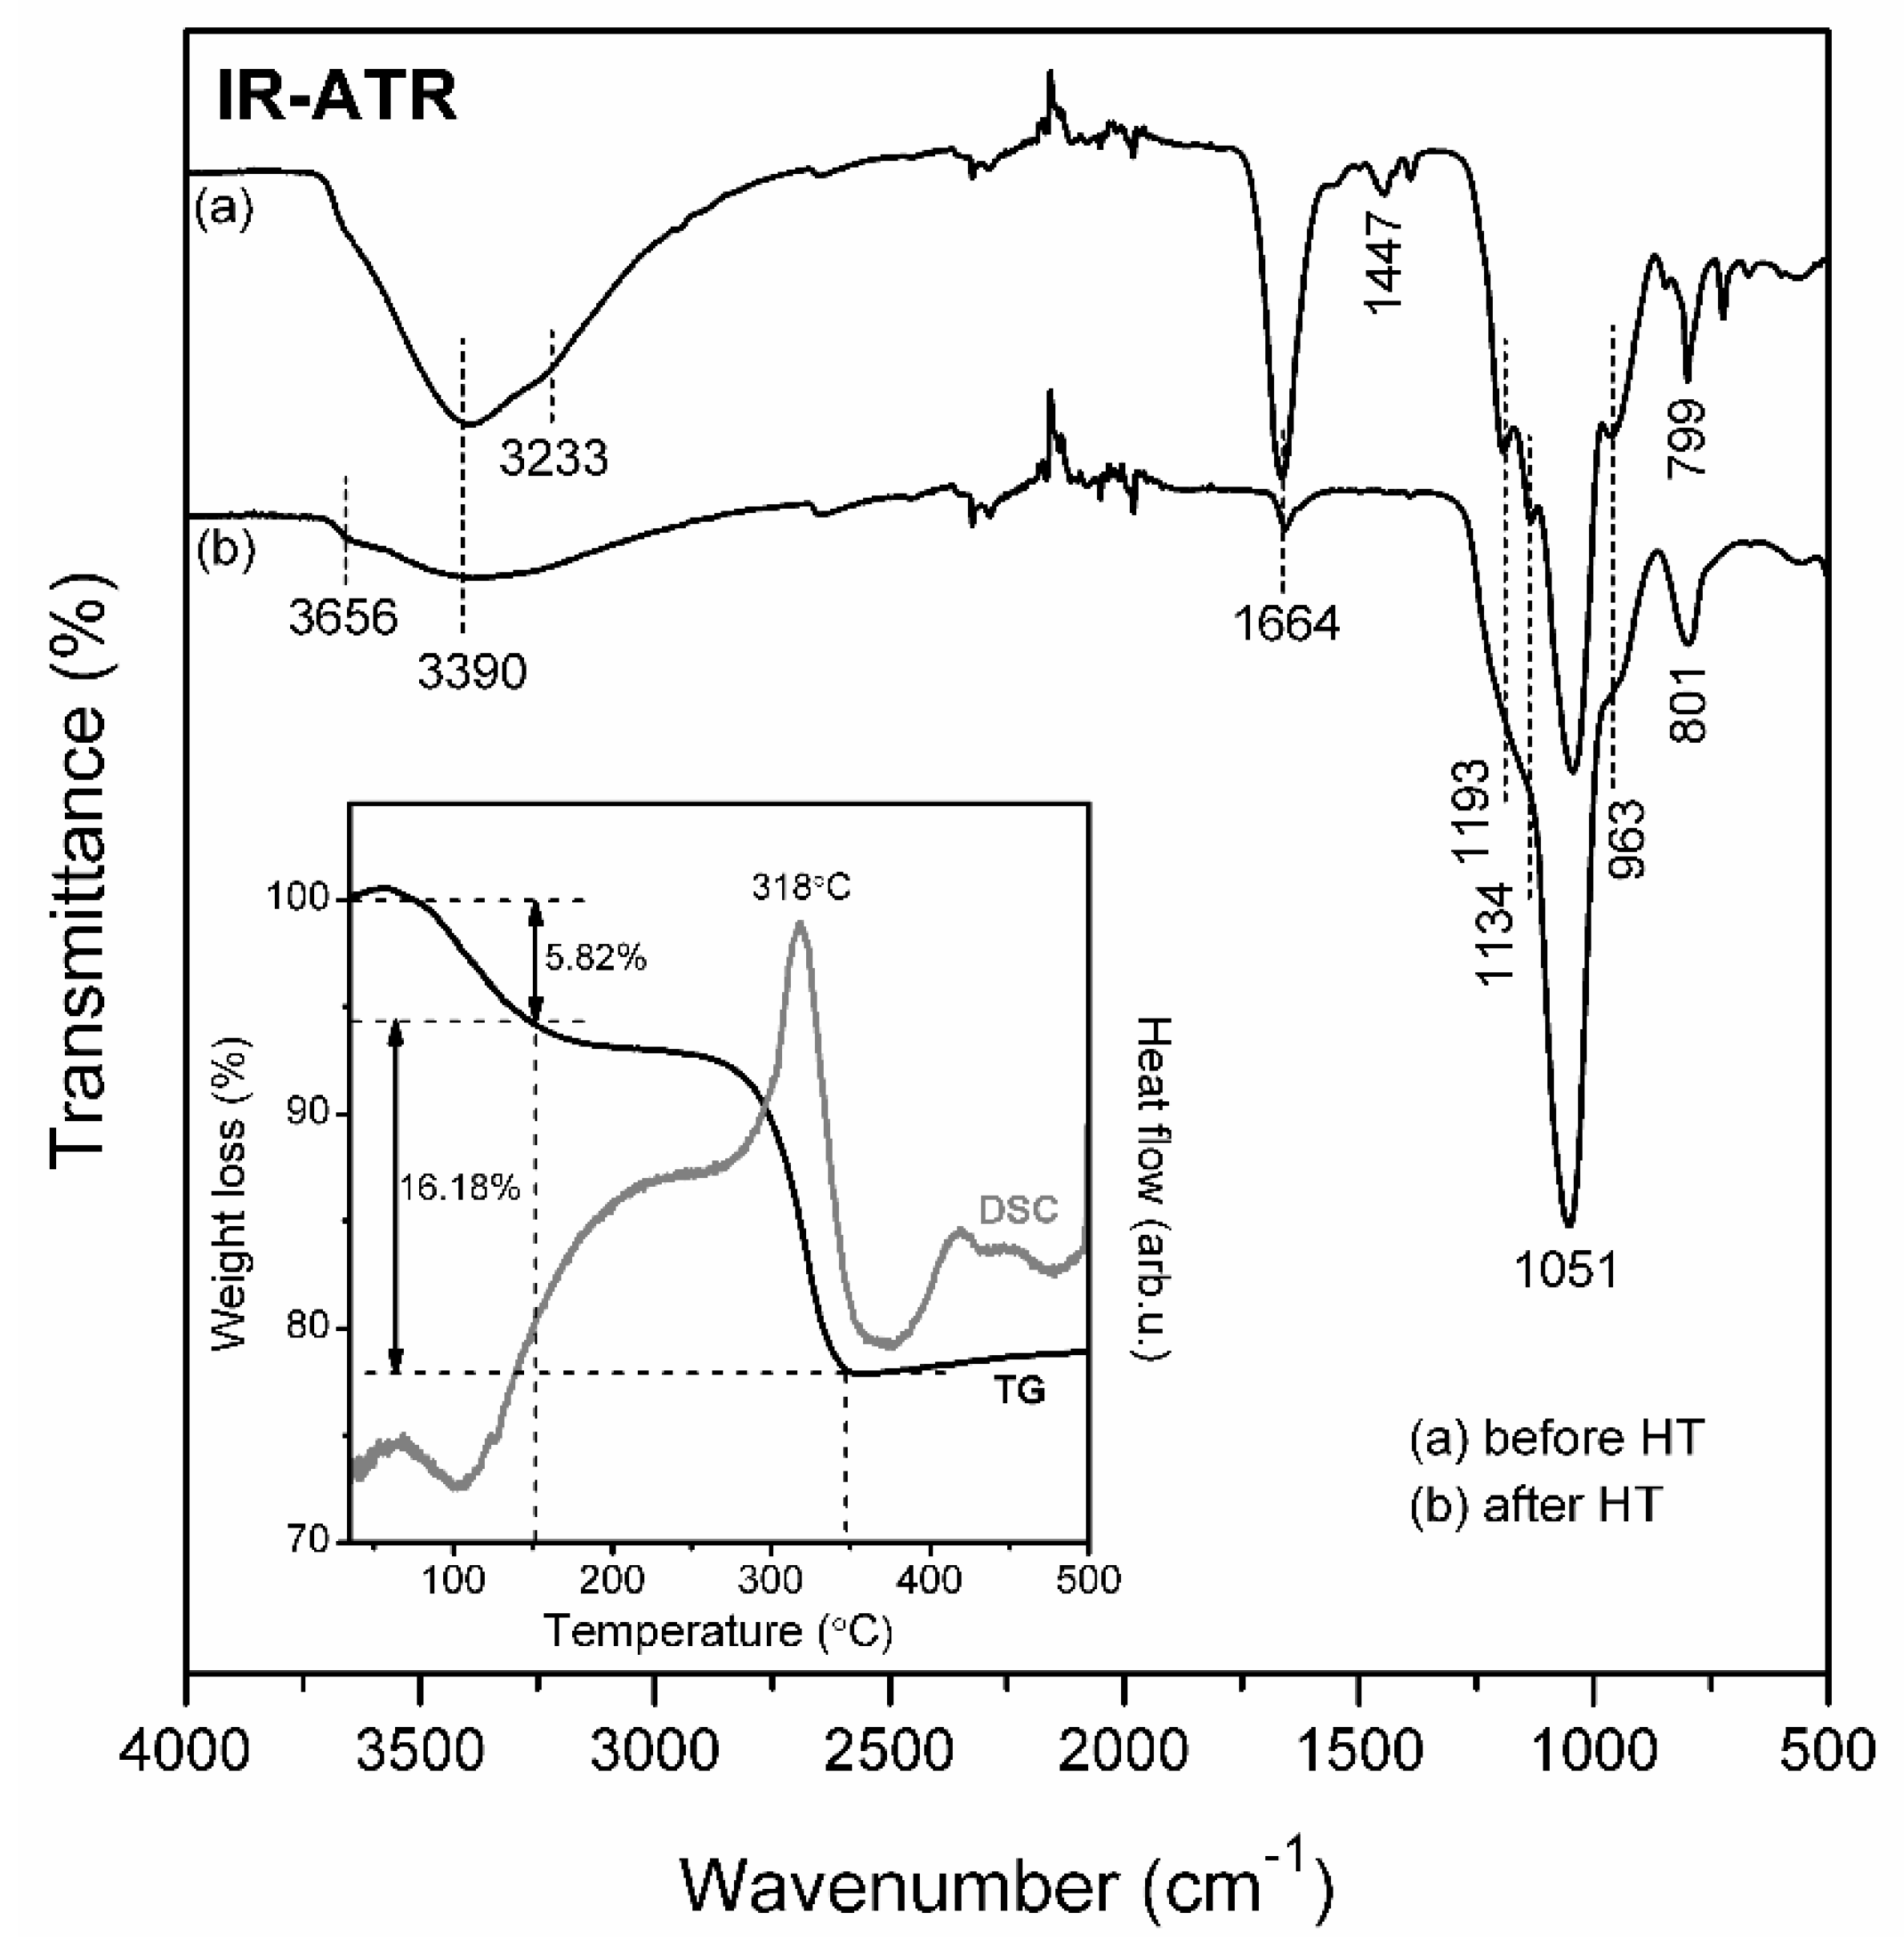
Firstly, the IR-ATR technique was used for identification the chemical bonding and functional groups inside prepared sol-gel materials and the results are presented in
Figure 1. To verify the structural changes during transformation of xerogels into CaF
2:Eu
3+ GCs, the infrared spectra were recorded in the 500 cm
−1–4000 cm
−1 frequency region. The assignment of recorded infrared signals was carried out based on current literature [
21,
22]. For xerogels obtained after seven weeks from synthesis, the creation of three-dimensional silicate network was confirmed. Indeed, the presence of infrared (IR) signals near 1193 cm
−1, 799 cm
−1 (Si-O-Si siloxane bridges), 1134 cm
−1, 1044 cm
−1 and 963 cm
−1 (Q
n units in SiO
4 tetrahedrons: Q
4, Q
3 and Q
2, respectively) indicates that polycondensation reaction occurred. In addition, we identified the presence of vicinal or geminal Si-OH groups (~3664 cm
−1), hydrogen-bonded Si-OH moieties (~3398 cm
−1) and hydrogen-bonded OH groups (~3233 cm
−1) originated from residual organic solvents and water. The IR signals located at 1664 cm
−1 (C = O groups vibrations) as well as 1447 cm
−1 (C-H vibrations) also confirmed that the porous sol-gel network was filled by liquids. It should be noted that the infrared peak at ~1664 cm
−1 frequency region was also assigned to adsorbed water and Si-OH groups. Moreover, the presence of un-decomposed calcium and europium (III) trifluoroacetates was also confirmed (1193 cm
−1, 1134 cm
−1).
To evaluate the thermal resistance of precursor xerogels and to identify the crystallization temperature, the TG/DSC analysis was performed in a temperature range from 35 °C up to 500 °C (inset of
Figure 1). The thermal degradation profile with two distinguishable stages was recorded in temperature intervals: 35 °C–151 °C (1) and 151 °C–348 °C (2). For prepared xerogels, the first stage was recorded as a gentle degradation. An indicated step could be associated with desorption of ethanol and water as well as acetic acid and the accompanying weight-loss was estimated to be 5.82%. Beyond the residual acetic acid (used as a catalyst), such acid was also produced during the chemical reaction between TFA and acetate salts:
As was shown, CF
3COO
− anions could effectively coordinate RE
3+ cations, therefore, the trifluoroacetate ions were chemically bonded. In fact, TFA was introduced as fluorination agent, which allowed for successful precipitation of CaF
2 crystal fraction during the heat-treatment of xerogels. Finally, the next TG step for prepared sol-gel samples could be associated with the thermal decomposition of Ca(CF
3COO)
2 and the formation of CaF
2 nanocrystals. The formation of the CaF
2 fluoride phase was realized by a homogeneous nucleation through a controlled fluorination, when the Ca-O bond cleaved and the Ca-F bond was formed [
23]. The CaF
2 crystal phase was obtained during thermal decomposition of Ca(CF
3COO)
2 as follows:
The decomposition of Ca(CF3COO)2 was observed in DSC curve as an exothermic peak with maximum at ~318 °C. Generally, such a second degradation step was observed in recorded TG curves as a relatively high weight-loss, which was estimated to 16.18%. Based on presented TG/DSC results, the T = 350 °C was chosen to perform the controlled ceramization process of precursor xerogels in order to precipitate the CaF2 nanocrystals dispersed in silicate sol-gel host. Furthermore, the resultant sol-gel materials were almost completely thermally stable at the indicated temperature level.
As was proven by infrared measurements performed after controlled heat-treatment process, the significant changes in shape of recorded spectra were well-visible. The recorded infrared signals were identified as vibrations that originated from the silicate framework. It was observed that the broad OH-band significantly decreased in intensity, and indicated the evaporation of volatile components (disappearance of maximum located at 3233 cm−1) as well as progressive polycondensation reaction of silicate network (reduction in intensity of maximum at 3390 cm−1). The weak peak at ~1664 cm−1 was also detected and it was associated to residual Si-OH groups. For heat-treated samples, the shoulders located at ~1193 cm−1 and ~1134 cm−1 were related to Si-O-Si siloxane bridges and SiO4 tetrahedrons in Q4 units, respectively. Otherwise, the vibration modes originated from SiO4 tetrahedrons inside Q3 (1051 cm−1) and Q2 units (951 cm−1) were also identified. Indeed, it growth in density from 1.936 g/cm3 before controlled ceramization up to 2.201 g/cm3 for the heat-treated sample.
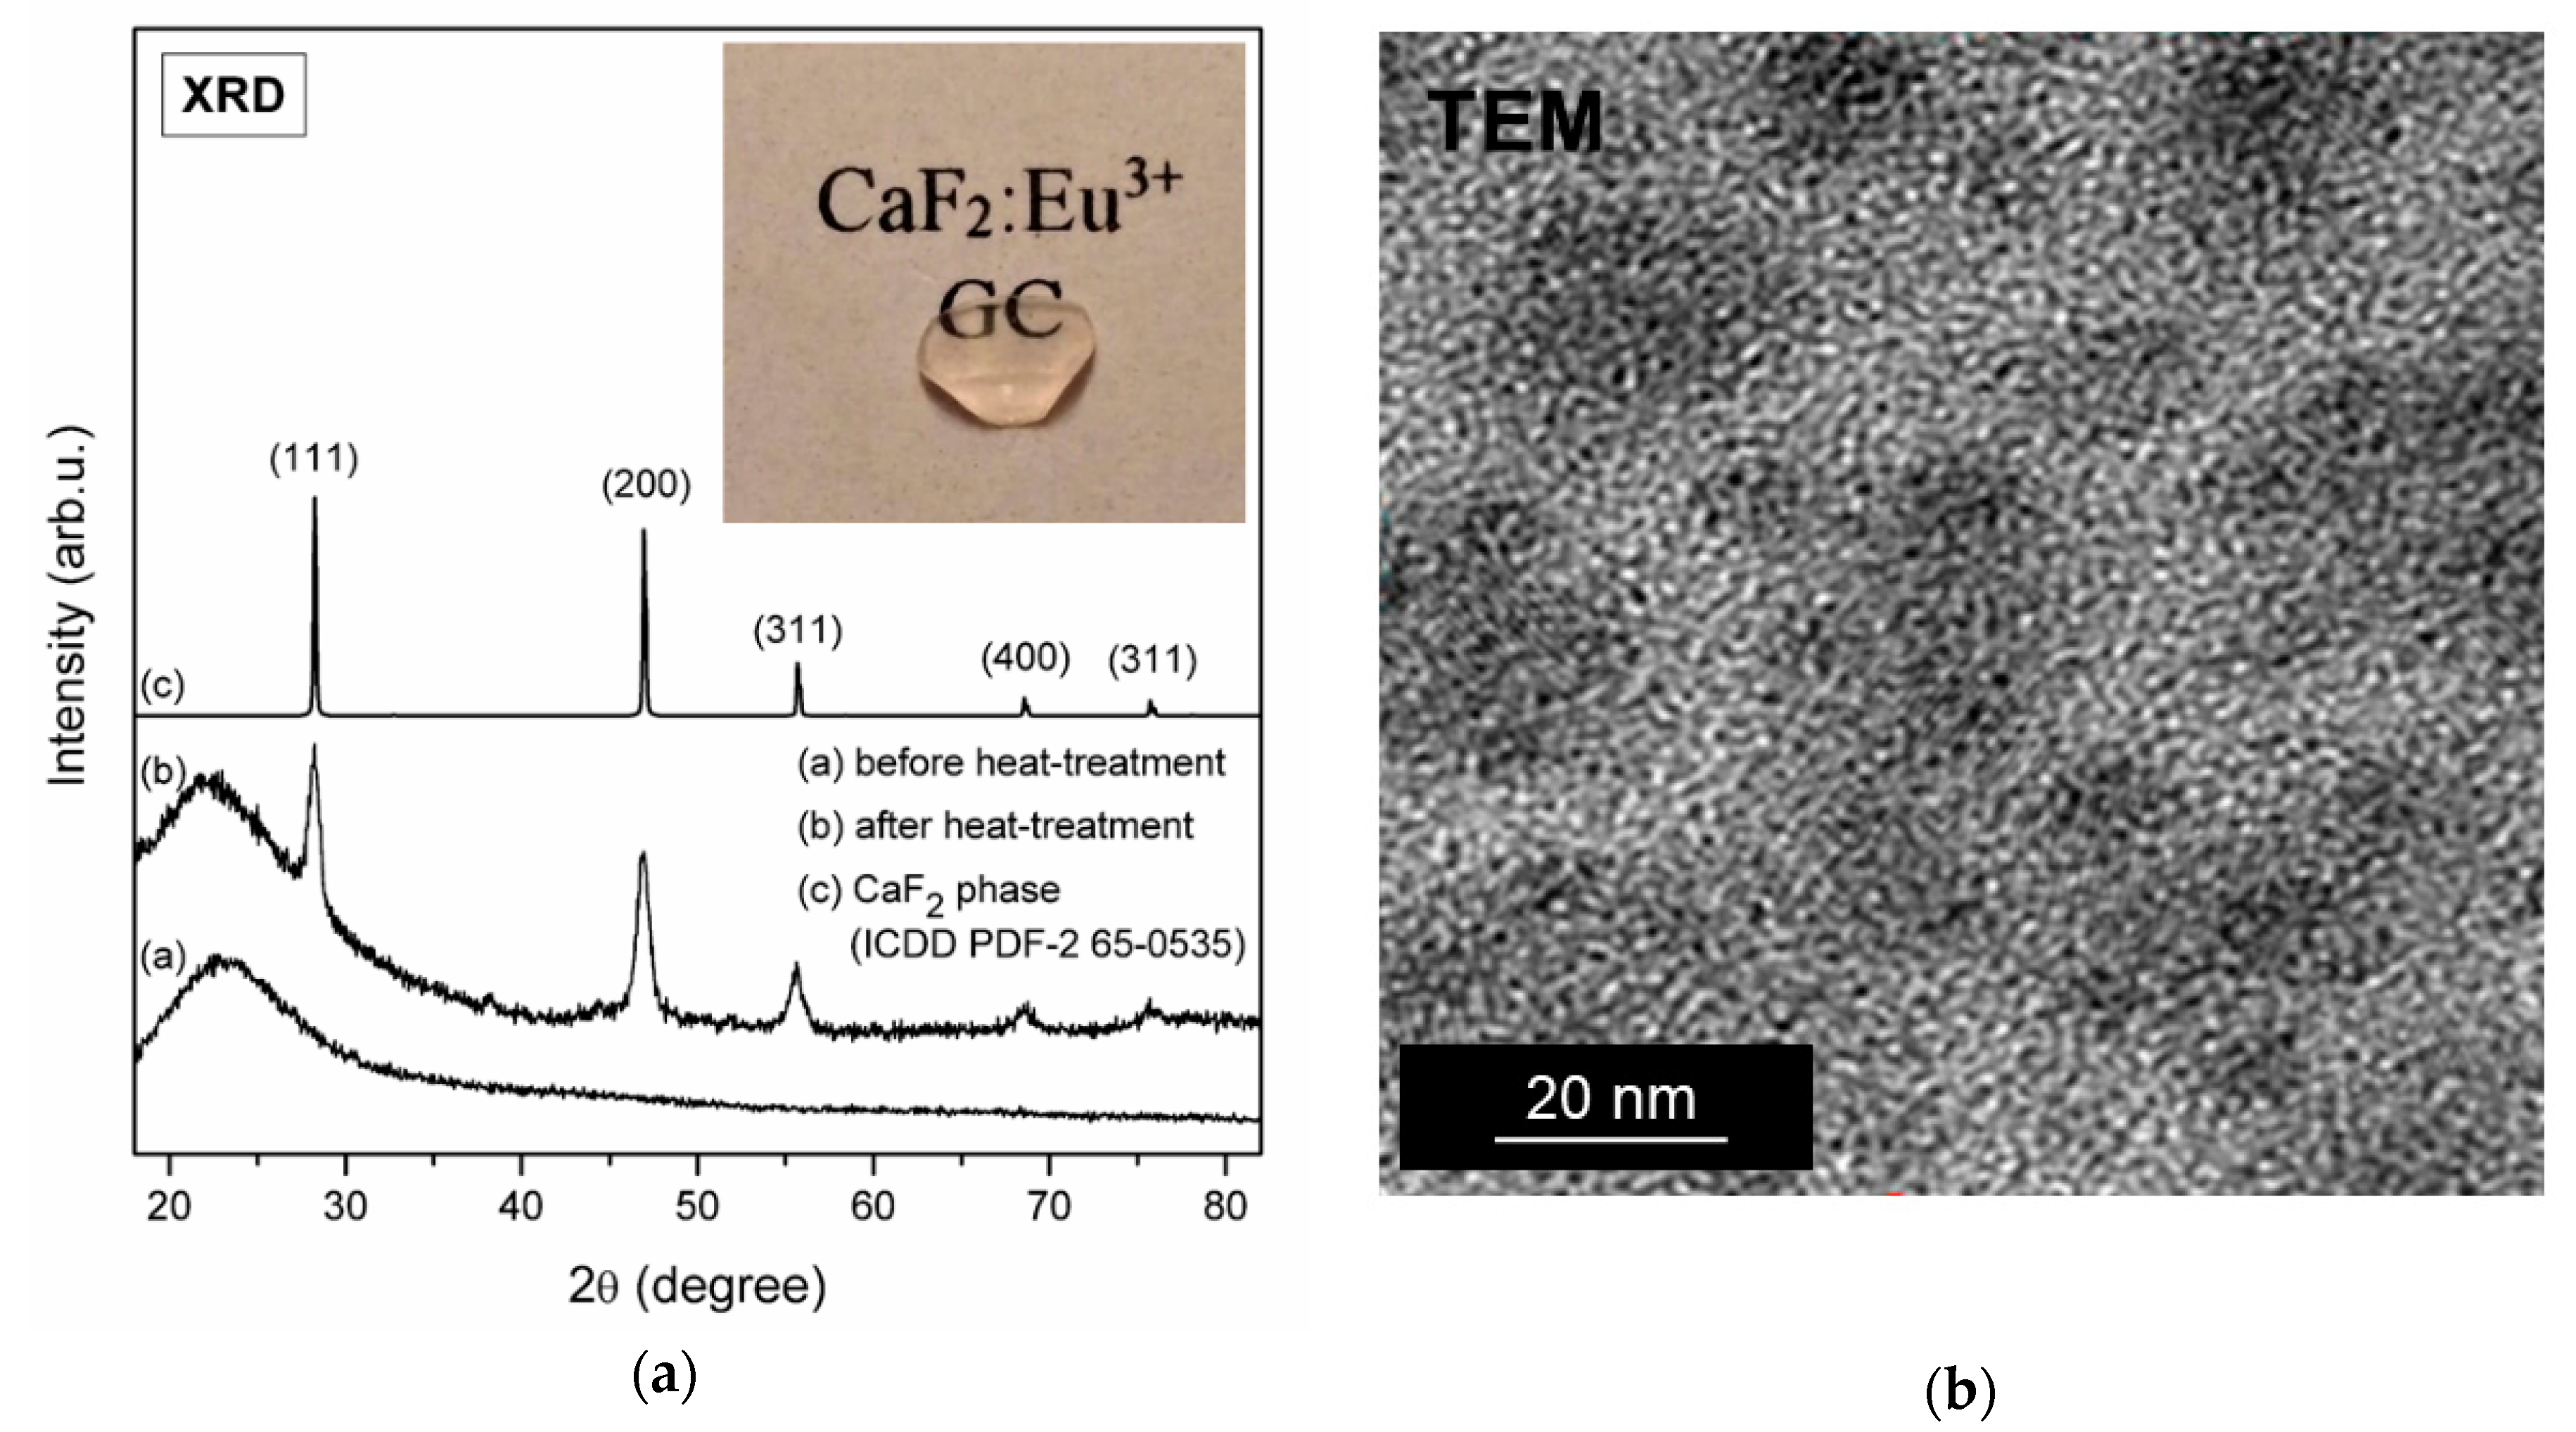
The influence of controlled heat-treatment process was also evaluated using XRD measurements and the results are depicted in
Figure 2a. For xerogels, a broad halo pattern was recorded and it indicated their amorphous nature without long-range order. The diffraction lines were observed after performed controlled ceramization process at 350 °C per 10 h. The XRD patterns are in good accordance with the diffraction lines of regular CaF
2 phase from ICDD (The International Centre for Diffraction Data, PDF-2 No. 65-0535) crystallized in the Fm3m space group. The subsequent diffraction lines at 28.2°, 46.9°, 55.6°, 68.6° and 75.8° were identified as (111), (200), (311), (400) and (311) reflexes of CaF
2 phase, respectively. Observed broadening of diffraction lines clearly indicates that CaF
2 phase crystallized in nanometric range and the average crystals size was estimated using the Scherrer formula:
in which D is related to the crystal size, K is a constant value (for our calculations it was taken K = 1), λ is the X-ray wavelength, β is a half width of analyzed diffraction peak and θ is the diffraction angle. The mean value of CaF
2 nanocrystals was equaled to 11.7 nm ±1.0 nm. Due to similar ionic radii of Ca
2+ (1.00 Å) [
24] and Eu
3+ (1.07 Å) [
25], Ca
2+ cations in CaF
2 crystal lattice could be effectively substituted by trivalent Eu
3+ ions and therefore, a very slight shift of diffraction lines was identified.
Figure 2b presents TEM image of fabricated glass-ceramics. The size of CaF
2 nanocrystals was consistent with average crystal size estimated from Scherrer equation. The CaF
2 nanocrystals with comparable size (about 10 nm) were obtained by Zhou et al. [
26] in GCs fabricated during ceramization of precursor glasses with composition (45SiO
2-25CaF
2-20Al
2O
3-10CaO):4%EuF
3 (treatment conditions: 700 °C/4 h). In addition, to verify the quantitative distribution of chemical elements in fabricated glass-ceramics, we carried out the analysis from the selected sample area containing CaF
2 nanocrystal using energy dispersive X-ray spectroscopy, EDS. Generally, the content of Ca and F in CaF
2 nanocrystal were estimated to 5 wt.% and 6 wt.%, respectively; and the content of Si and O from silicate sol-gel matrix were estimated to 41 wt.% and 48 wt.%, respectively. Since Eu
3+ ions were introduced during sol-gel synthesis as a dopant, their concentration was below the quantification limit and determination their quantitative distribution between CaF
2 nanocrystals and a silicate host was not possible. Moreover, according to another data presented in literature, we proposed the lowest treatment temperature (350 °C) to the fabrication of CaF
2:Eu
3+ glass-ceramic materials (550 °C–570 °C [
27], 620 °C–680 °C [
28], 660 °C [
29], 800 °C [
30]). Nowadays, the low-temperature processes are preferable and therefore, the formation of CaF
2 nanocrystals at 350 °C seems to be highly desirable.
Based on weight-loss during sol-gel transformation from initial liquid sol to xerogel and taking the results from TG/DSC analysis into account, we estimated the amount of CaF
2 crystal fraction in the prepared GC sample. In general, it was found that during successive evaporation of volatile components (water and organic compounds used during synthesis) and progressive polycondensation reaction of silicate network, the remaining mass of fabricated xerogel was evaluated on 16.7 wt.% of the initial sol weight. Based on the TG curve shown in
Figure 1, the total weight loss during heat-treatment could be estimated to about 22.0 wt.%. The second degradation step was strictly associated with thermal decomposition of Ca(CF
3COO)
2 and the indicated weight-loss (16.18 wt.%) should be related with evaporation of CF
3CFO, CO
2 as well as CO. Therefore, based on above results and taking the stoichiometry of thermal degradation reaction of Ca(CF
3COO)
2 into account, the amount of CaF
2 crystal fraction was estimated to about 8 wt.% (simultaneously, the estimated mass of silicate sol-gel host is about 92 wt.%). Moreover, based on performed calculations, it was assumed that thermal degradation should be complete (it should be also noted that the amount of introduced Ca(CH
3COO)
2 salt into reaction system during sol-gel synthesis was only 2.3 wt.%).
3.2. Luminescence Behavior of Fabricated Sol-Gel Materials
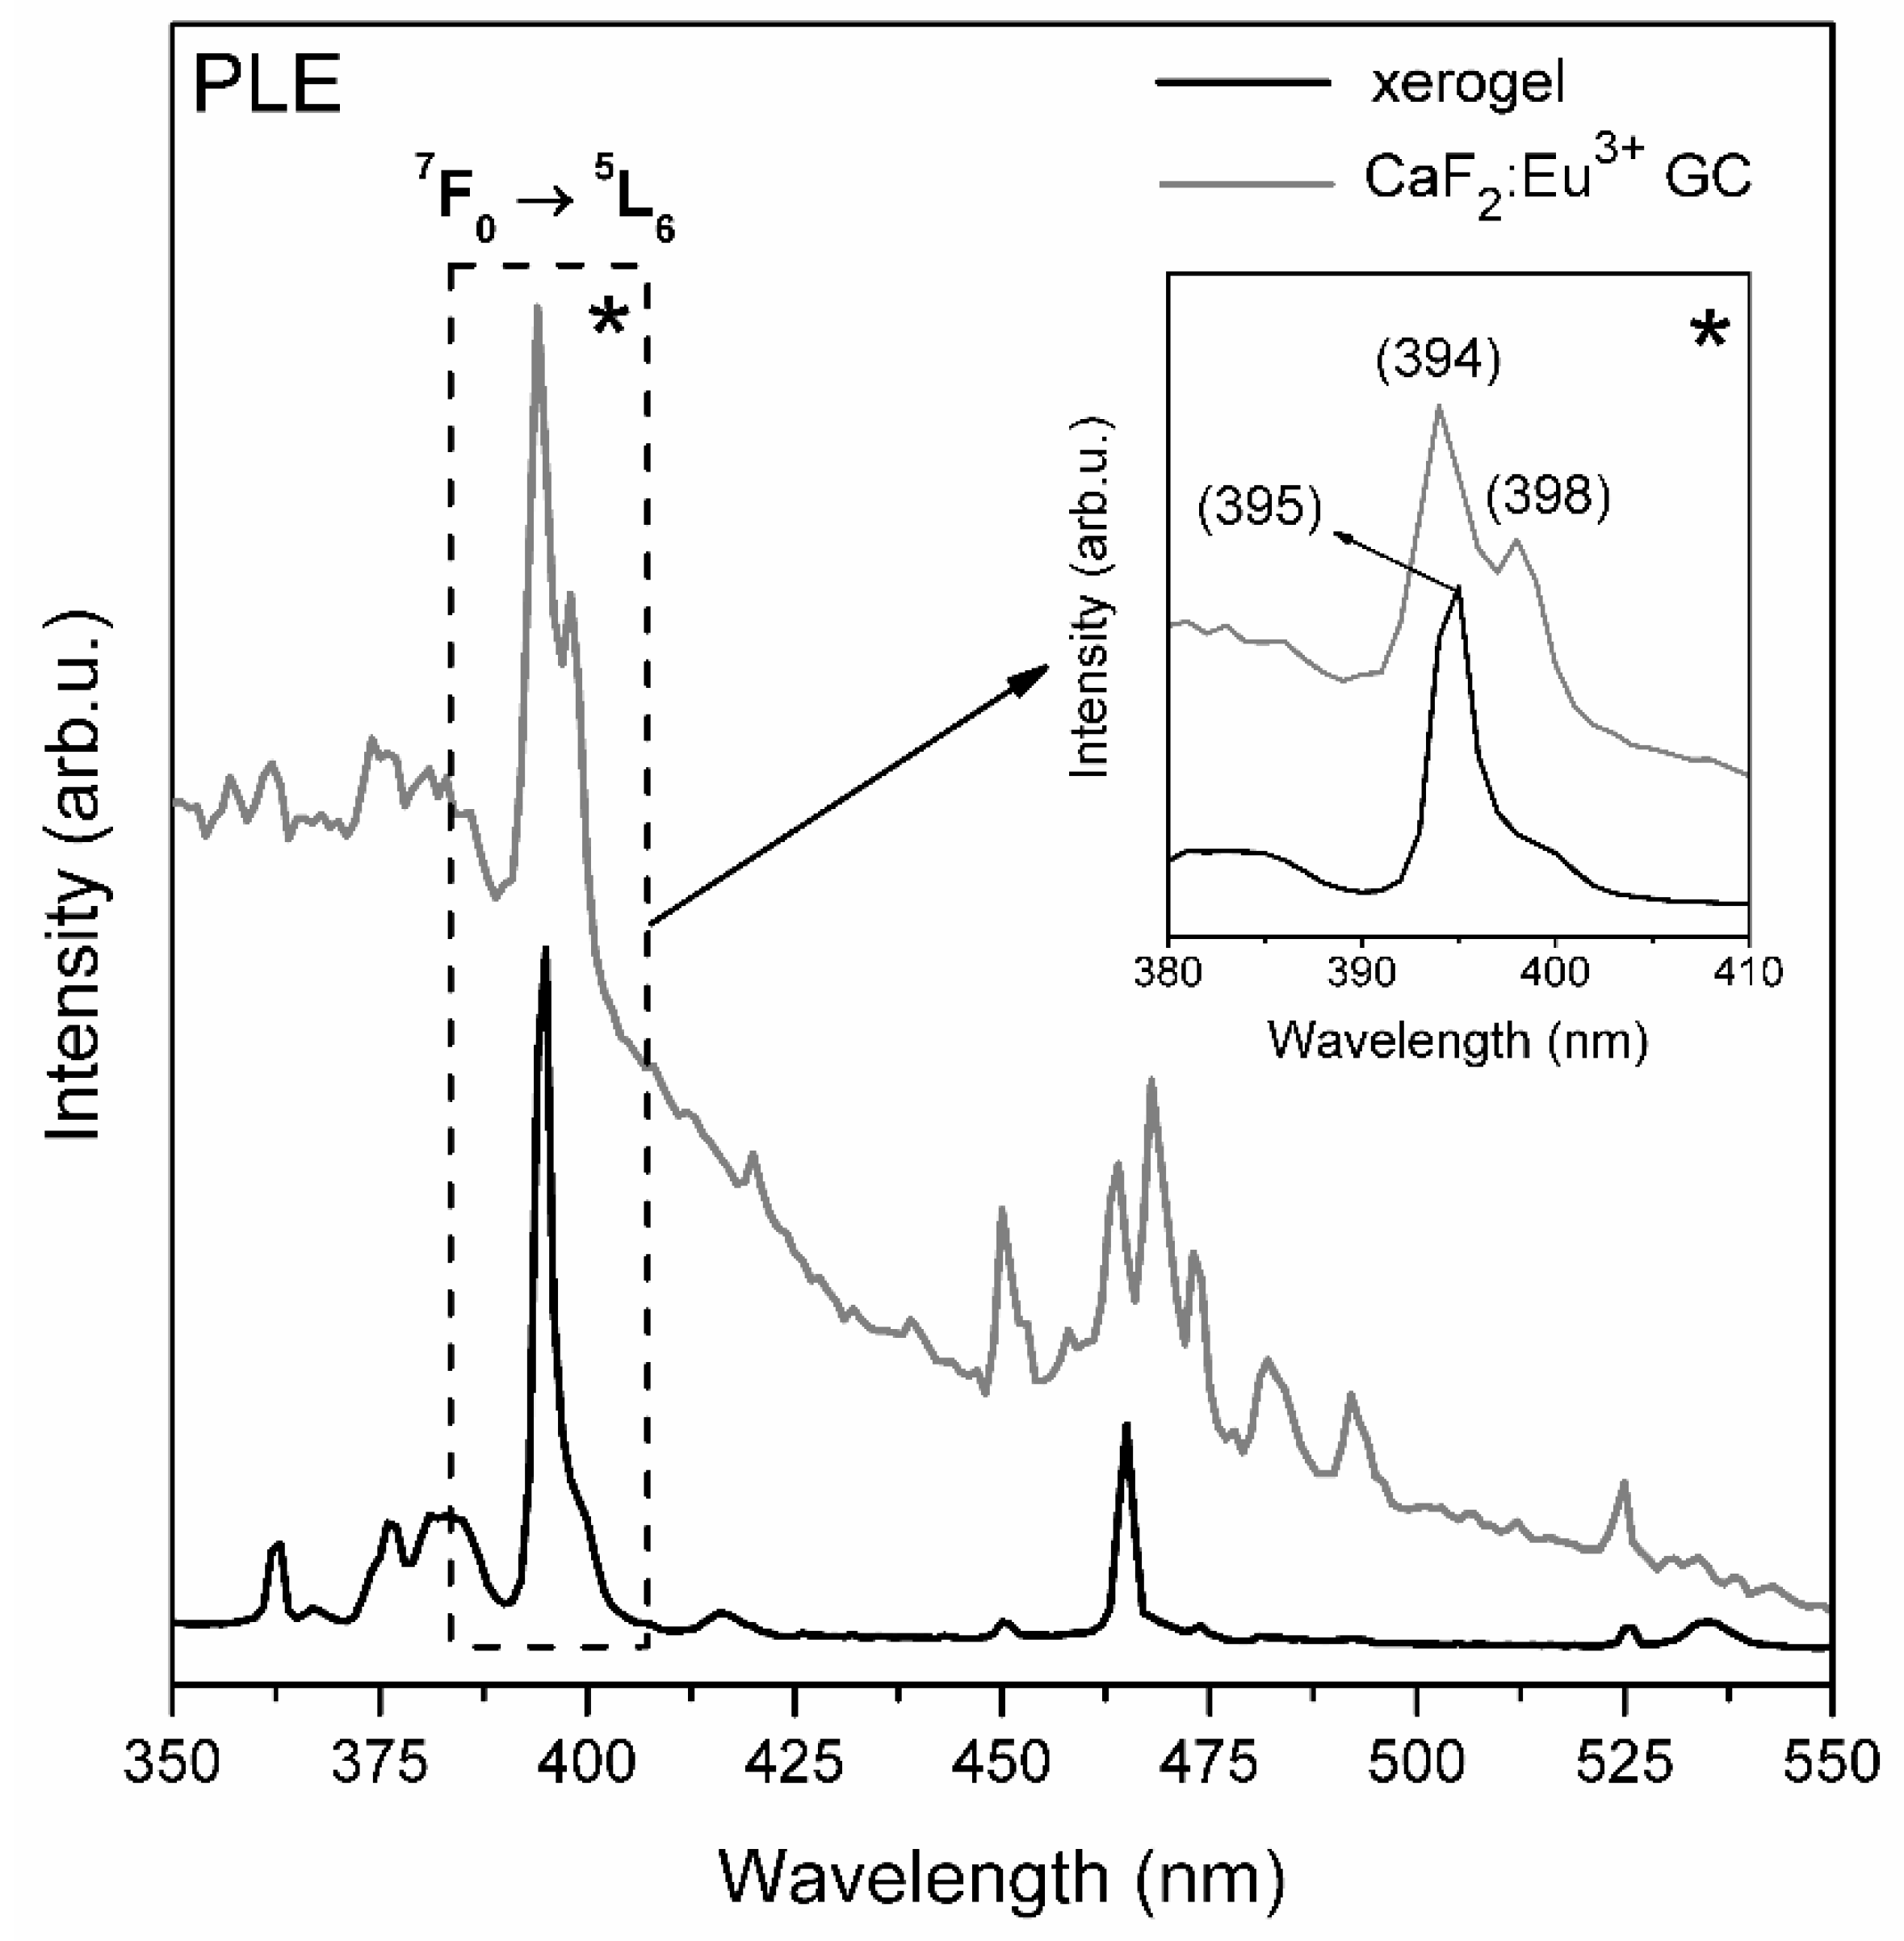
Figure 3 shows the photoluminescence excitation spectra (PLE) of prepared xerogels and CaF
2:Eu
3+ glass-ceramics. The spectra were monitored at λ
em = 611 nm wavelength corresponding to the
5D
0 →
7F
2 optical transition of Eu
3+ ions. The recorded excitation lines were identified as the intra-configurational electronic transitions inside 4f
6 manifold of Eu
3+ optically active ions. The bands were assigned to transitions from the
7F
0 ground level to the excited states:
5D
4 (363 nm),
5G
J,
5L
7 (372 nm–389 nm),
5L
6 (395 nm–xerogel, 394 nm/398 nm–CaF
2:Eu
3+ GCs) and
5D
2 (465 nm–xerogel, 464 nm–CaF
2:Eu
3+ GCs). In addition, the weak bands according to the
7F
0 →
5D
3 (416 nm) and
7F
0 →
5D
1 (525 nm) transitions were recorded. Since, the
7F
1 level is thermally populated at room temperature, a satellite line corresponding to the
7F
1 →
5D
1 (535 nm) was also observed.
It was observed that for xerogels the
7F
0 →
5L
6 excitation band has only one maximum, meanwhile for prepared CaF
2:Eu
3+ GC samples such a line is a double peak with two splitted components located at 394 nm and 398 nm. Since Eu
3+ ions could be distributed between silicate sol-gel host and CaF
2 nanocrystals in fabricated GCs, such splitting into two components could indicate that Eu
3+ ions are residing in two different frameworks, as was suggested by A.C. Yanes for sol-gel LaF
3:Eu
3+ GCs [
31]. Thus, 394 nm component could be associated with their location within silicate network, meanwhile 398 nm component could be related with location of Eu
3+ in fluoride nanocrystals. Based on paper by J. Pan et al. [
32], the excitation spectra of pure CaF
2:Eu
3+ crystal phase revealed only one component of the
7F
0 →
5L
6 band. Therefore, it may confirm the hypothesis that visible splitting of indicated excitation band could be related with distribution of Eu
3+ ions between CaF
2 nanocrystals and silicate sol-gel host. Since the most intense excitation line corresponded to the
7F
0 →
5L
6 transition for fabricated sol-gel samples, the appropriate wavelengths were used to perform the emission measurements.
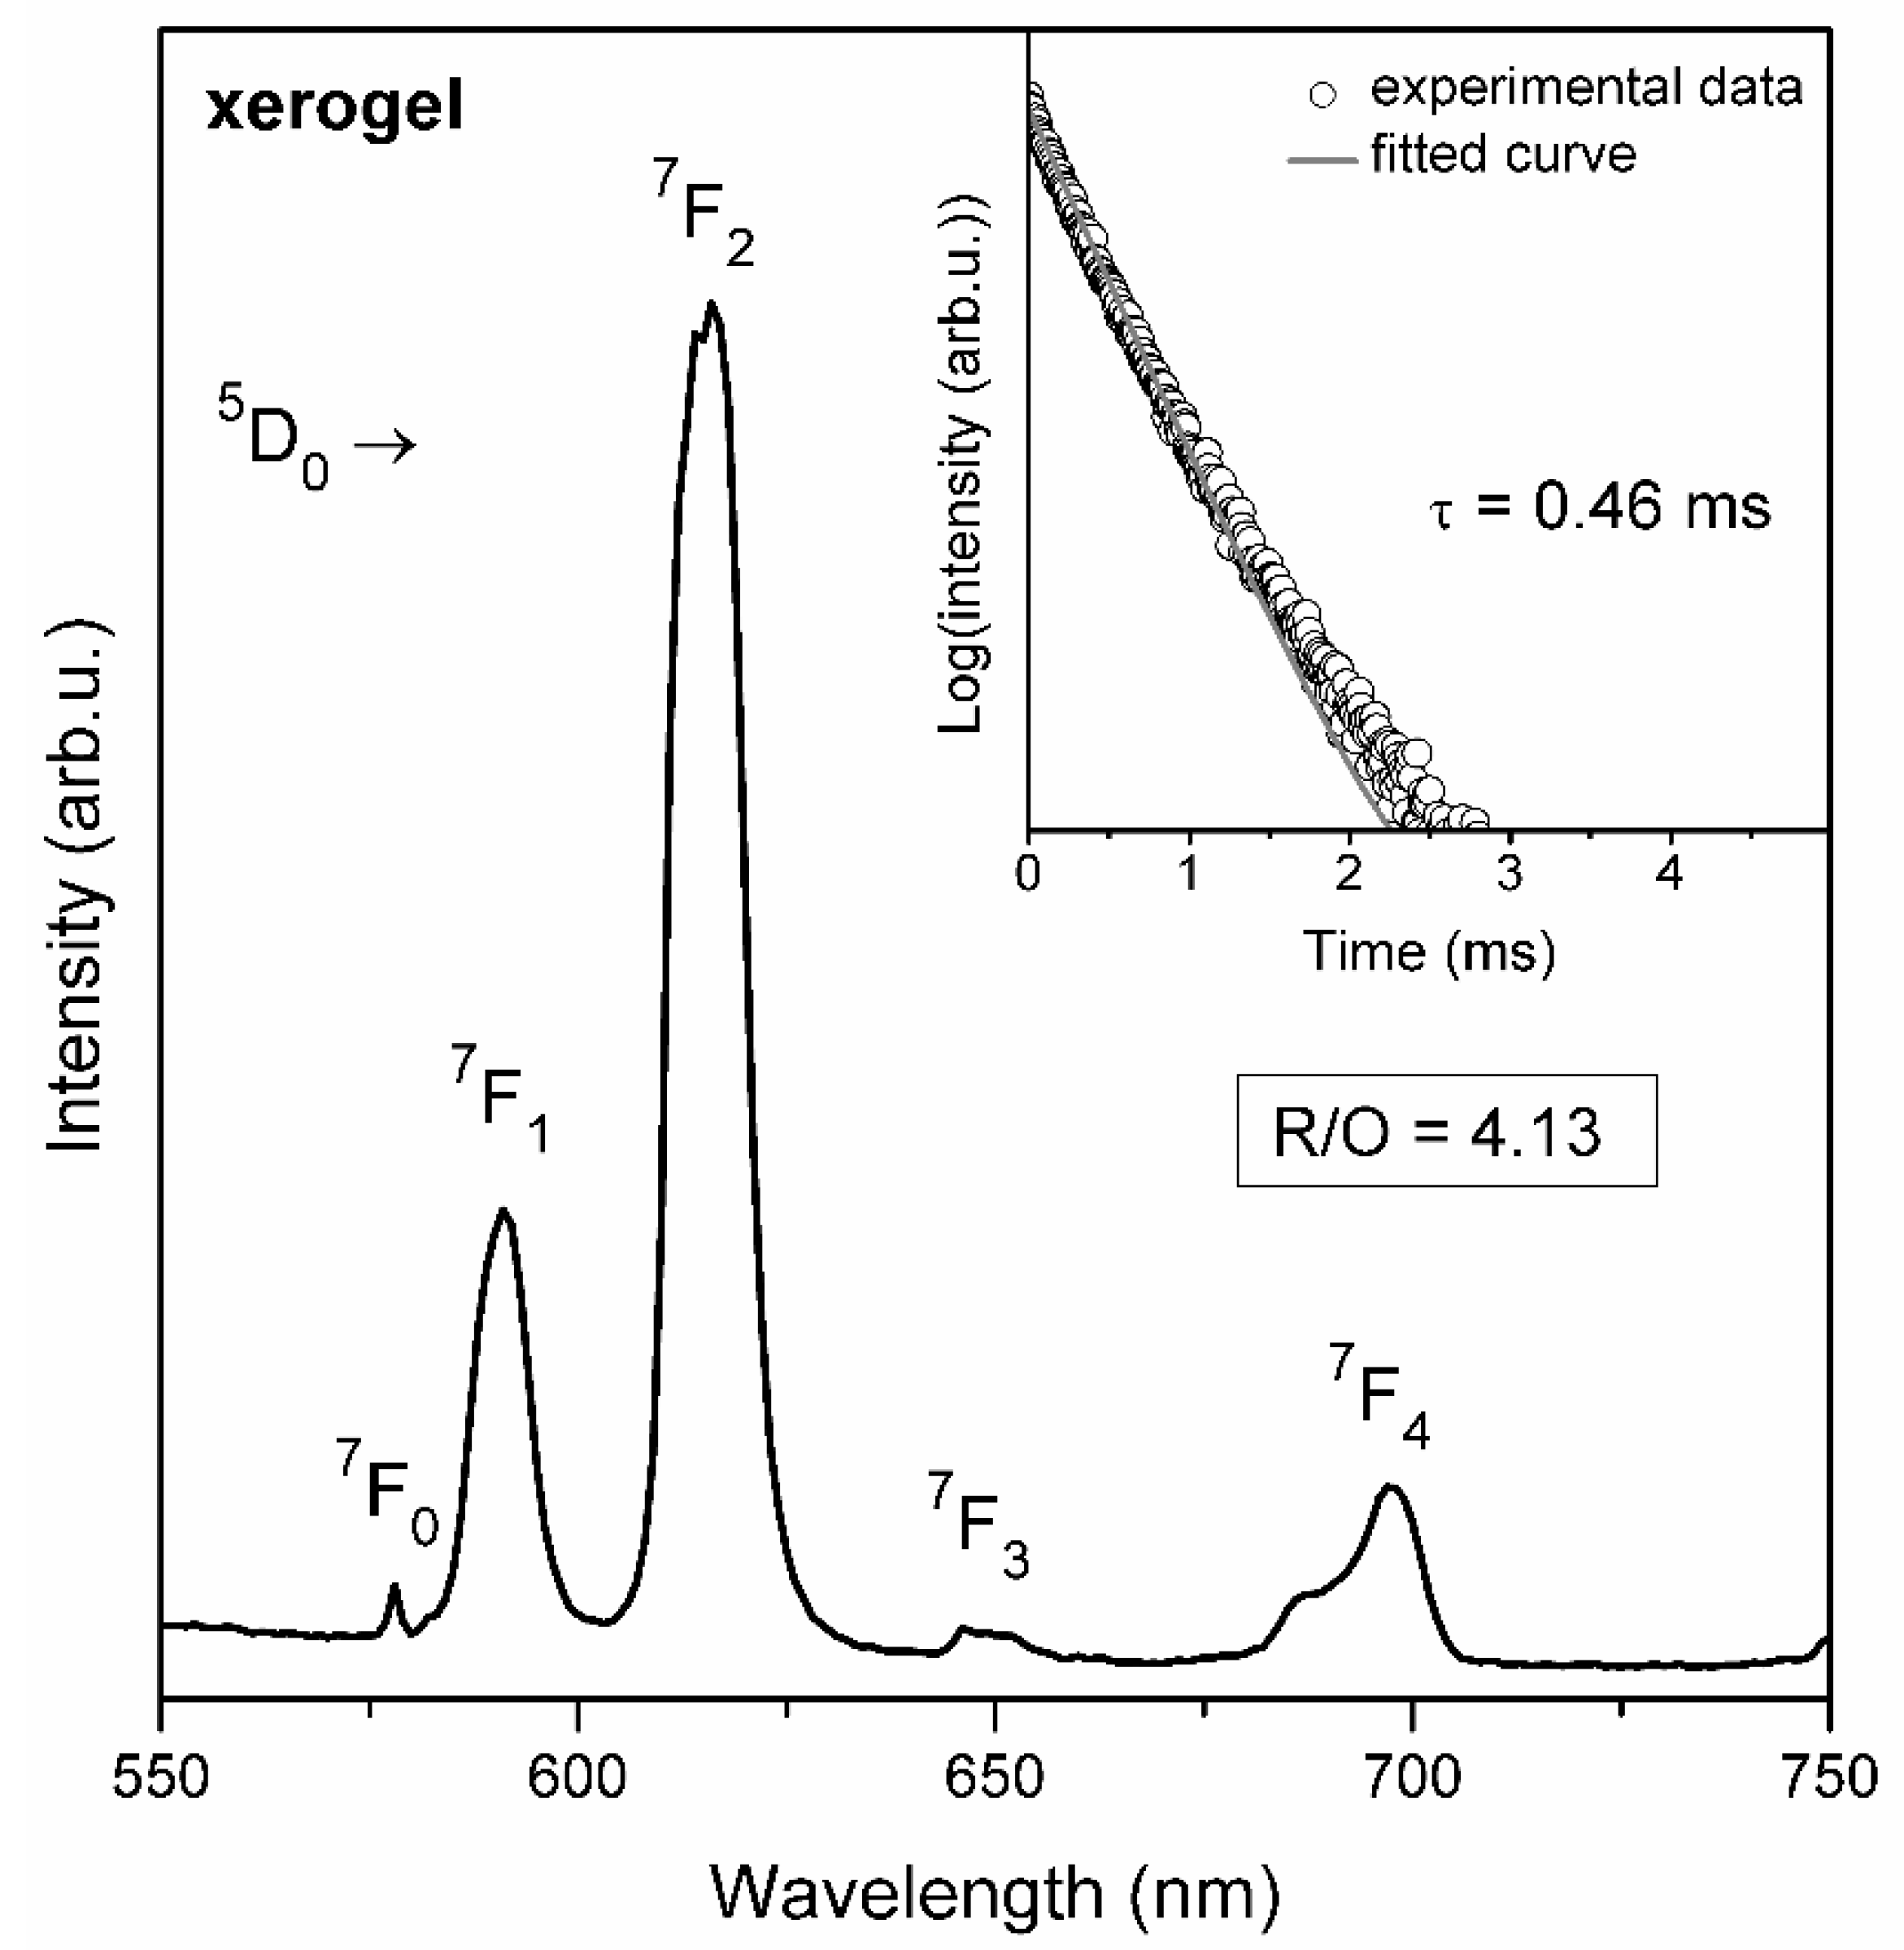
The photoluminescence spectrum (PL) registered for precursor xerogels is shown in
Figure 4. Generally, the recorded spectrum consisted from five emission bands assigned to the transitions from the
5D
0 excited state into the
7F
J levels:
7F
0 (578 nm),
7F
1 (591 nm),
7F
2 (616 nm),
7F
3 (649 nm) as well as
7F
4 (697 nm). Since the relative intensities of Eu
3+ emission bands were strictly dependent on symmetry in their local framework, the emission spectra gave valuable information about the nearest framework around them in host matrix [
32]. It was observed that for silicate xerogels an emission band assigned to the
5D
0 →
7F
2 electric-dipole transition was more intense compared to a line assigned to the
5D
0 →
7F
1 magnetic-dipole transition. The
5D
0 →
7F
2 transition was very sensitive to the symmetry in the local vicinity around Eu
3+ ions and it was hypersensitive in nature. Conversely, an intensity of the
5D
0 →
7F
1 band was rather independent on the symmetry in nearest surrounding of Eu
3+ ions. Hence, the ratio between the
5D
0 →
7F
2 and the
5D
0 →
7F
1 emission intensities—well-known as R/O—can play the role as a useful tool for estimating the symmetry in which Eu
3+ ions are located [
33,
34]. The R/O-ratio value calculated for prepared xerogels was estimated to be 4.13.
Furthermore, as was shown in the inset of
Figure 4, the luminescence decay curve registered for precursor xerogels was well-fitted to the mono-exponential function and the estimated luminescence lifetime of the
5D
0 state was estimated to be τ = 0.46 ms. The short luminescence lifetime was strictly related with the structure of fabricated xerogels. The luminescence from the
5D
0 state was quenched by numerous OH groups in local framework of Eu
3+ ions and such groups originated from silanol Si-OH moieties (3664 cm
−1, 3398 cm
−1) as well as residual water and organic solvents (3233 cm
−1) inside the porous silicate network. Since the
5D
0 →
7F
6 energy gap of Eu
3+ ions was equal to ΔE = 12,500 cm
−1 [
35], only about four OH phonons were required to promote a non-radiative deactivation of the
5D
0 excited level. Since CF
3COO
− anions were in the coordination sphere around Eu
3+ cations, it should be noted that such non-radiative relaxation from the
5D
0 state could be also caused by C = O groups (1664 cm
−1, eight phonons) and the C-F bond (1193 cm
−1, ten phonons). However, among identified functional groups, we expected that OH moieties could play a major role in non-radiative deactivation. In general, the non-radiative rates of intra-configurational 4f
n-4f
n transitions of rare earths were exponentially dependent on the energy gap (ΔE) and the phonon energy in their nearest surrounding (ħω). Such correlation is well-known as the energy gap law and it states that an increase in the non-radiative decay rate is assisted by a decreasing number of phonons needed to cover the energy gap, ΔE. Hence, if there is a functional group with high vibrational energy in a local framework of Eu
3+ ions, the probability of non-radiative multiphonon relaxation increases. The phonons with maximum energy in a host are also usually called as effective phonons (ħω
max) [
36,
37]. The influence of different types of functional groups in Eu
3+-doped silicate glasses on multiphonon relaxation was discussed in work by A. Herrmann et al. [
38]. The rates of multiphonon relaxation, k
NR, via OH modes (3750 cm
−1, k
NR = 1.4·× 10
−2 s
−1) and Si-O vibrations (1250 cm
−1, k
NR = 9.0·× 10
−13 s
−1) clearly indicates that OH groups with maximum phonon energy in studied glasses play a major role in quenching the luminescence from the
5D
0 state. Moreover, the luminescence lifetime is not dependent only on phonon energy in the nearest framework around the optically active ion, but also on another factors, like symmetry. In general, the lower the symmetry is in the nearest vicinity of Eu
3+ ion, the more allowed are the forbidden f-f transitions. Therefore, taking the symmetry aspect into account, the probability of radiative relaxation is relatively high, which results in a short luminescence lifetime.
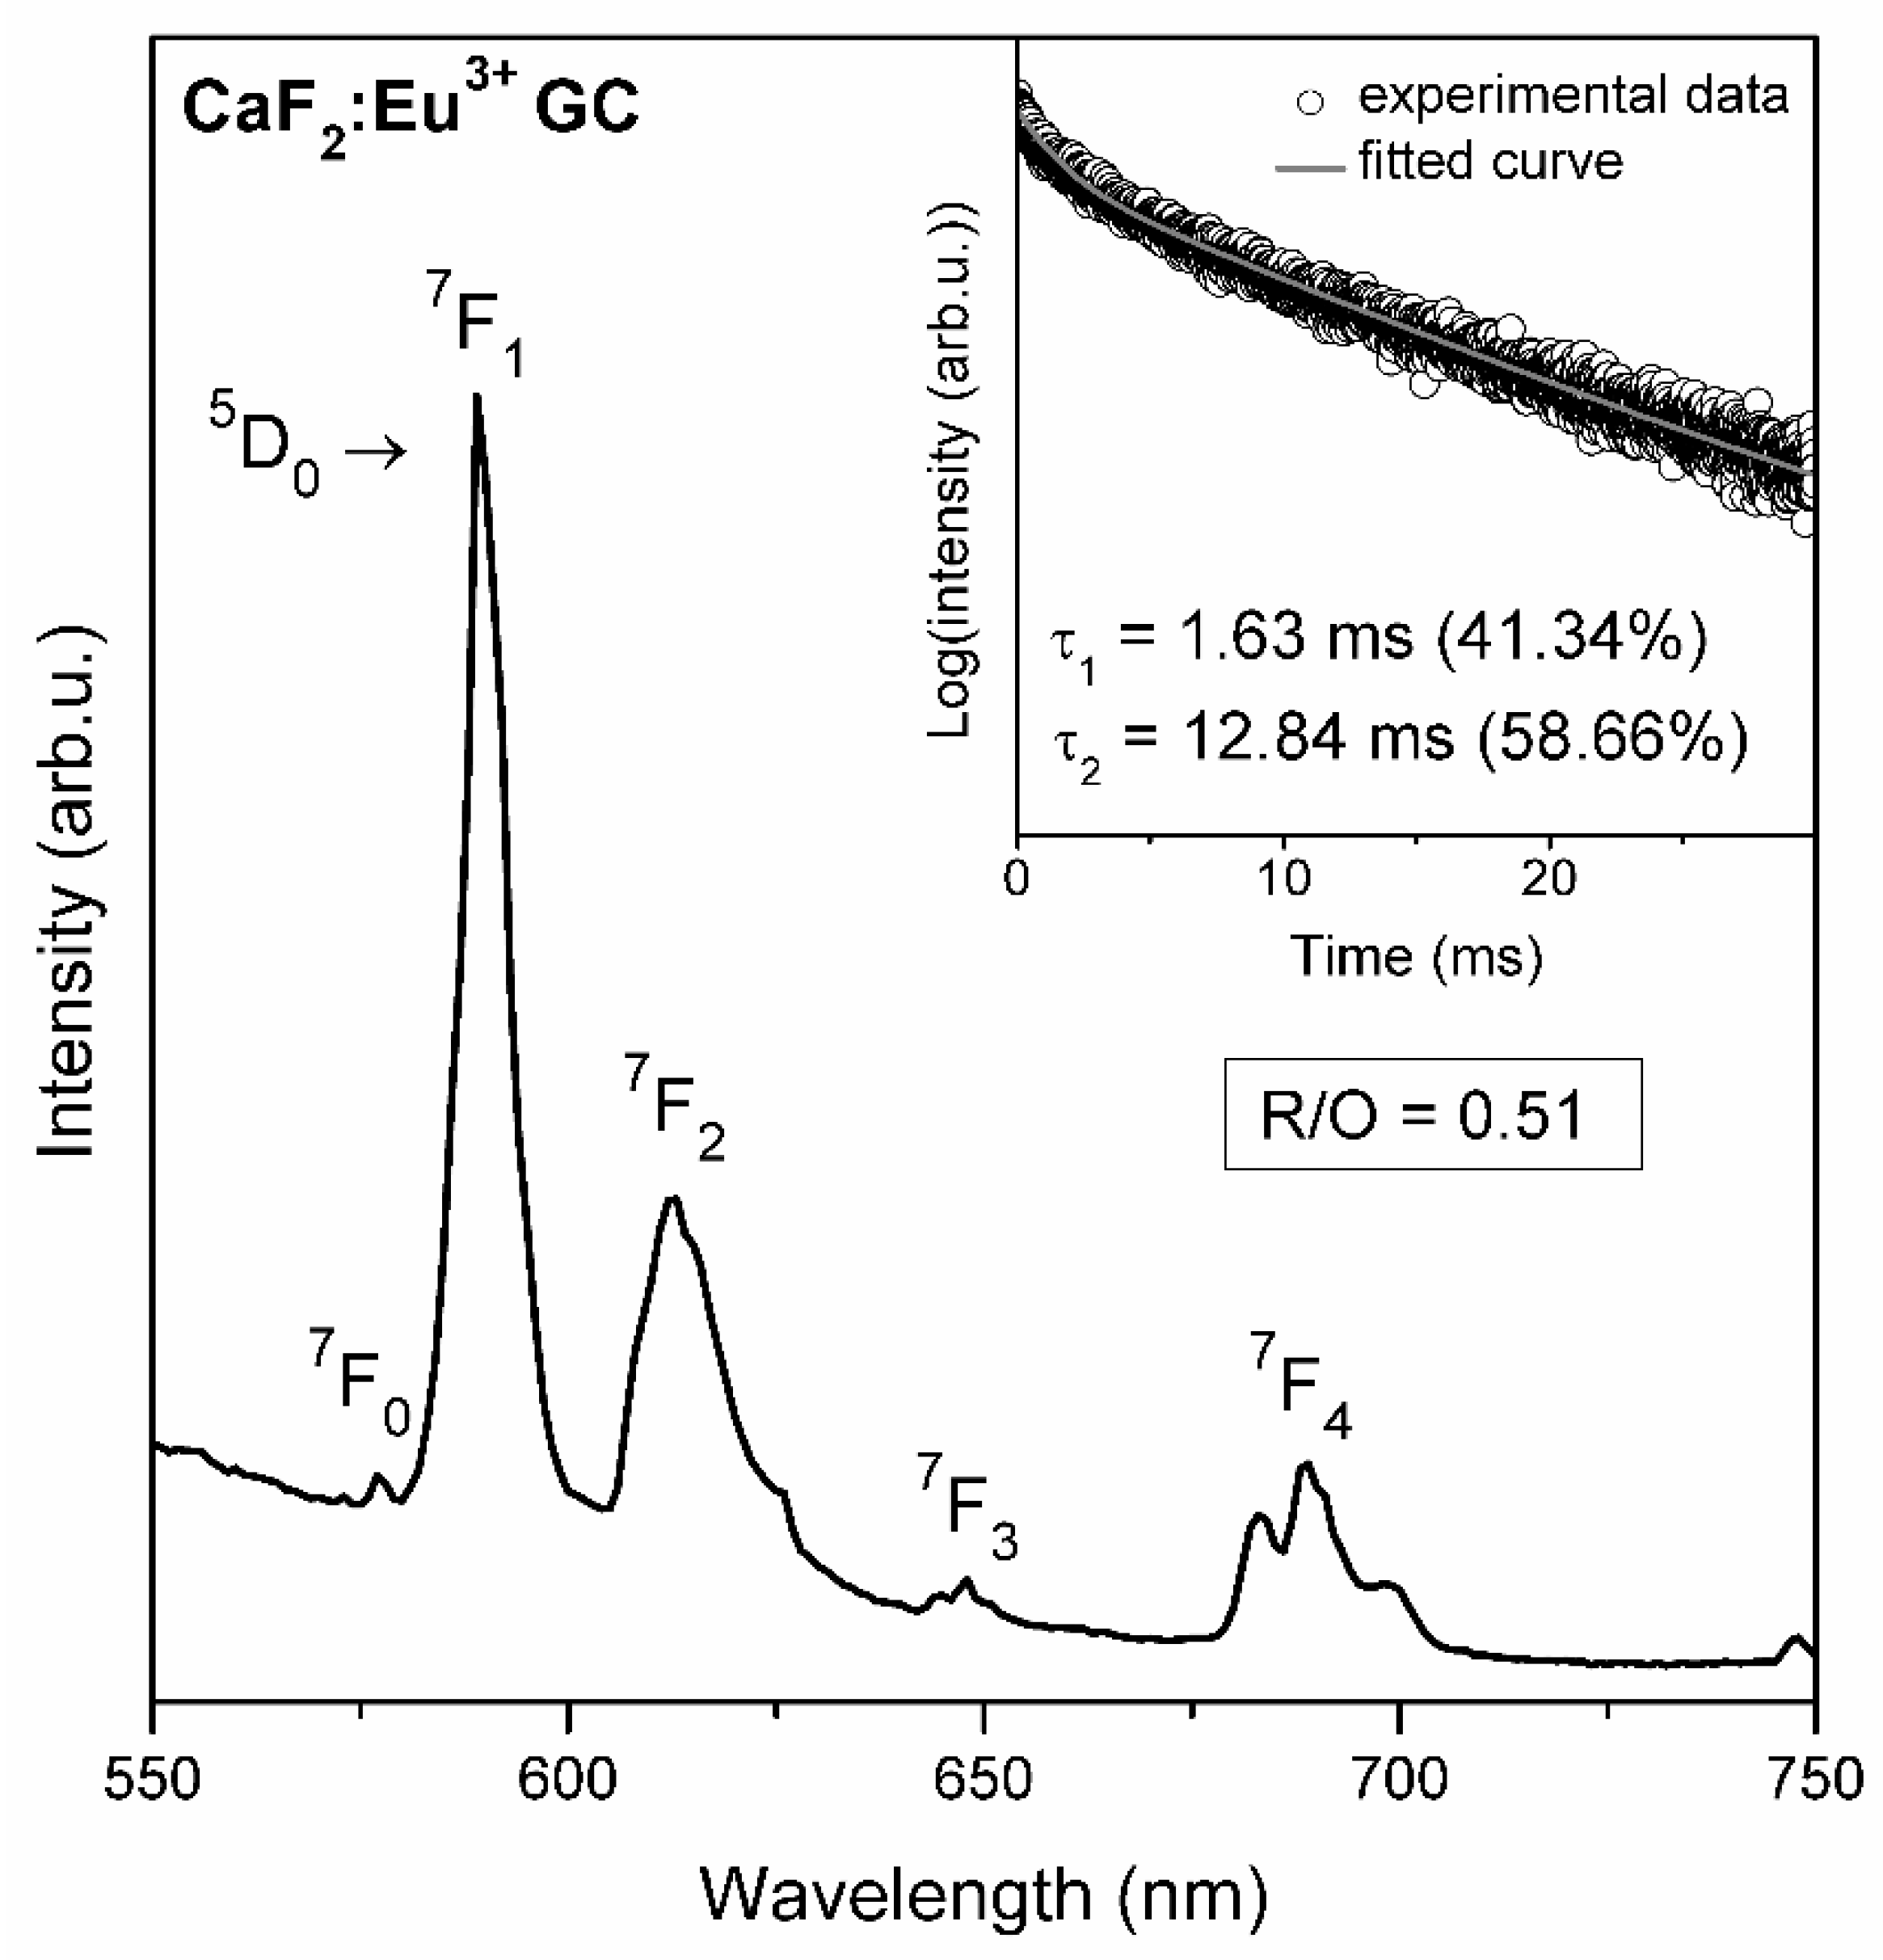
As was presented in
Figure 5, the emission spectrum of CaF
2:Eu
3+ GCs also consisted of the characteristic bands of Eu
3+ ions corresponding to the intra-configurational
5D
0 →
7F
J transitions within the 4f
6 manifold. Such bands were recorded at the following wavelengths: 577 nm (J = 0), 589 nm (J = 1), 613 nm (J = 2), 648 nm (J = 3), 683 nm/689 nm/699 nm (J = 4). Compared to xerogels, a significant growth in intensity of the orange
5D
0 →
7F
1 band was observed and it was accompanied by eight-fold decrease in the R/O-ratio value (from 4.13 to 0.51). The indicated decline in the R/O-ratio value clearly points to the change in the symmetry in the nearest vicinity around dopant ions and the nature of the bonding character between Eu
3+ ions and their nearest surrounding covalent to become more ionic. Obviously, this is related with the partial incorporation of optically active ions into the crystallized CaF
2 fluoride phase.
The
7F
J energy levels of Eu
3+ ions in crystal lattice could split and the number of individual sublevels depends on the J number and the site symmetry [
33]. According to paper by Brown et al. [
39], Eu
3+ ions are located in
C4v symmetry sites in the CaF
2 crystal lattice, despite the fact that Ca
2+ cations are located in
Oh symmetry sites. This effect could be explained by charge compensation, when divalent Ca
2+ cations in CaF
2 crystal lattice are substituted by trivalent Eu
3+ ions. Then, due to prevent the non-equilibrium charge in the crystal lattice, cation vacancies could be also formed and some fluorine anions could occupy the interstitial positions. If the Eu
3+ ion is located in the
C4v site in the CaF
2 crystal lattice, the individual
5D
0 →
7F
J (J = 0–4) band should split into one (J = 0), two (J = 1), four (J = 2), five (J = 3) and seven (J = 4) components. However, the distinguishing of individual components was quite difficult for fabricated glass-ceramic samples, because Eu
3+ ions are distributed both in amorphous silicate sol-gel network as well as CaF
2 nanocrystals. Hence, we assumed that the influence of the crystal field is largely masked.
The photoluminescence decay curve of the
5D
0 state of Eu
3+ ions recorded for fabricated glass-ceramics was presented in the inset of
Figure 5. The decay curve was well-fitted to double-exponential function and therefore, it was distinguished two different decay components: fast (τ
1 = 1.63 ms) and slow (τ
2 = 12.84 ms). The double-exponential decay clearly indicates that two different decay channels are involved in the total decay process from the
5D
0 excited state of Eu
3+. The contribution of fast and slow components could be determined using fitting constants in the following equation:
Since the A
1 and A
2 fitting constants were close to 1.9408·× 10
6 and 2.7539·× 10
6, respectively, a percentage contribution of τ
1 was equal to 41.34% and the contribution of τ
2 was 58.66%. The first of the luminescence lifetime, τ
1, was associated with Eu
3+ ions located in the silicate sol-gel host consisting of Q
3 units of SiO
4 tetrahedrons (~1051 cm
−1) and residual Si-OH groups (3390 cm
−1, 3656 cm
−1). In this way, to cover the energy gap in silicate host, four Si-OH groups or twelve Q
3 units were needed. The second luminescence lifetime component, τ
2, was related with the remaining part of Eu
3+ ions which were successfully incorporated into CaF
2 nanocrystals during the controlled heat-treatment process. Indeed, due to low-phonon energy of the CaF
2 crystal lattice (~466 cm
−1 [
40]), about 27 Ca-F phonons were needed to cover the
5D
0 →
7F
6 energy gap. The probability of non-radiative relaxation from the
5D
0 state was greater within the silicate framework than in the CaF
2 crystal lattice due to higher-phonon energies. Moreover, the probability of radiative relaxation was lower in more symmetric CaF
2 than in asymmetric sol-gel host. Therefore, the τ
2 components were significantly prolonged compared to τ
1. Moreover, we suggested that the tendency of the Eu
3+ ions to migrate into CaF
2 could be promoted by a similar ionic radii of Ca
2+ (1.00 Å) and Eu
3+ (1.07 Å). It should be also noted that the τ
1 luminescence lifetime component of fabricated CaF
2:Eu
3+ GCs was prolonged compared with the τ lifetime estimated for xerogel. Both of the presented lifetimes were related with Eu
3+ ions, which were dispersed inside the silicate sol-gel host. To explain the differences in luminescence lifetime values, we used the results from the IR-ATR spectroscopy. As was evidenced by IR measurements, the huge amounts of OH groups with high vibrational energies (above 3000 cm
−1) were identified in the structure of fabricated xerogels. Therefore, such numerous OH groups in the nearest vicinity of Eu
3+ ions were mainly responsible for non-radiative quenching of luminescence from the
5D
0 excited state, which resulted in a relatively short lifetime. Simultaneously, the infrared measurements carried out for CaF
2:Eu
3+ glass-ceramic indicated a strong reduction of OH groups, hence, the amount of effective ‘quenchers’ in the nearest surrounding of Eu
3+ ions in the silicate sol-gel network was smaller than in xerogels. In consequence, the τ
1 luminescence lifetime was prolonged due to smaller amounts of OH quenchers.


