Article

Iron Recovery from Bauxite Tailings Red Mud by Thermal Reduction with Blast Furnace Sludge

Dipartimento di Meccanica, Politecnico di Milano, via La Masa 1, Milano 20156, Italy
*
Author to whom correspondence should be addressed.
Appl. Sci. 2019, 9(22), 4902; https://doi.org/10.3390/app9224902
Submission received: 26 September 2019 / Revised: 7 November 2019 / Accepted: 9 November 2019 / Published: 15 November 2019
(This article belongs to the Special Issue Extractive Metallurgy from Metallurgical Waste or by-Products)

Abstract

:
More than 100 million tons of red mud were produced annually in the world over the short time range from 2011 to 2018. Red mud represents one of the metallurgical by-products more difficult to dispose of due to the high alkalinity (pH 10–13) and storage techniques issues. Up to now, economically viable commercial processes for the recovery and the reuse of these waste were not available. Due to the high content of iron oxide (30–60% wt.) red mud ranks as a potential raw material for the production of iron through a direct route. In this work, a novel process at the laboratory scale to produce iron sponge (≤ 1300 °C) or cast iron (> 1300 °C) using blast furnace sludge as a reducing agent is presented. Red mud-reducing agent mixes were reduced in a muffle furnace at 1200, 1300, and 1500 °C for 15 min. Pure graphite and blast furnace sludges were used as reducing agents with different equivalent carbon concentrations. The results confirmed the blast furnace sludge as a suitable reducing agent to recover the iron fraction contained in the red mud. For all the conditions tested, the metallization degree was higher than 70%, and the best condition to reduce red mud through blast furnace sludge was identified at 1:1 red mud/blast furnace (B.F.) sludges equal to 0.85 C/Fe2O3.

1. Introduction

Red muds, or red sludges, are the most concerning and produced industrial waste from primary aluminum production, i.e., the Bayer process. Depending on the quality of the raw material processed, 1–2.5 tons of red mud is generated per ton of alumina produced [1,2,3]. From 2000 to 2018 alumina production increased from approximately 55 Mt to 130 Mt, mainly due to a fast growth in Chinese production capacity [4]. This means about 130–325 Mt of red mud produced in only 2018. This amount of hazardous waste still continues to be one of the most important disposal problems in the mining industry [5]. Red mud is composed of a mixture of metal oxides. The red color arises from iron oxides, which comprise up to 60% of the mass of the red mud. In addition, the other components include silica, unleached residual aluminum, titanium oxide [5,6], and rare earth traces [7,8].
Red muds are classified by the EEA (European Environment Agency) as special non-hazardous waste (EWC 01 03 09), however, a mirror entry exists in the European waste list (EWC 01 03 10 *) [9]. This means that the red muds can be classified as absolutely hazardous or not as a function of their chemical composition, further complicating their management.
Due to their high alkalinity, with a pH ranging from 10 to 13 [2,10,11], red mud cannot be disposed easily and in most countries where red muds are produced, the cheapest method is to pump them into holding ponds or lagoons [10,11].
Unfortunately, only 2–3% of plants dispose of the muds in the sea [12], posing risks to the marine ecosystem.
An alternative and more expensive method consists of repeatedly rinsing the red mud. This red mud suspension, with a density between 1.2 and 1.3 g/cm3 and a dry matter concentration from 250 to 350 g/L, is then dried and stacked (dry stacking or dry cake). However, this technique still leads to serious problems, as the cakes take up a large land area that can neither be built on nor farmed, even when the mud is completely dry. The liquid phase of the suspension contains about 7 g/L of Na2O, a serious pollutant due to its high alkalinity, which is dumped in selected and prepared areas, usually open fields, and convoyed to water treatment plants [3,12,13].
The recent ecological disaster occurred in October 2010 at Ajka (Hungary) has drawn attention to the worrying situation of the red mud basin owned by Eurallumina in Portovesme (Italy). There, 20 Mm3 of bauxite residues are lagooned on an area of 120 ha. Even if the Italian red mud is naturally inertized by the sea water (thanks to the MgO content that neutralizes the caustic soda through the precipitation of “Bayer” hydrotalcite Mg7Al2OH18(CO32, SO42−)·xH2O [14,15]) its polluting footprint must be considered, especially related to toxic metal leaching. In fact, in Hungary, non-negligible concentrations of CrVI into water supplies and surface waters were detected in a large contaminated area [16] from the Marcal and Danube rivers [17], as well as high concentrations of biologically available Al [18].
Many studies focusing on the red mud are mainly oriented to the recovery of alumina and soda [19,20,21] or iron, titanium dioxide, and other minor elements, such as vanadium and rare earths [7,22,23,24,25,26,27,28,29]. However, these processes could not be economically justified, leading to economic loss. In general, chemical processes aimed at recovering a constituent of red mud have suffered from inadequate revenues and the creation of further disposal problems. In particular, attempts for a utilization of red mud for iron production have a long history [30]. For instance, before and during the Second World War, the red mud was dried by the German iron and steel industry on deck ovens and sold as a catalyst for the liquid phase of the coal hydrogenation. The active component thereby formed finely divided iron hydroxide. Until the 1950s, the residues in dried form in quantities of about 3000 t/y were returned to the ironworks as iron containing residues. From the 1950s different approaches tried to make the iron content of the red mud usable for the steel industry. Rotary kiln process for the processing of red mud to obtain sintered iron ore was developed by Krupp. However, the high content of alkali and the low concentration of iron oxide made the process not sustainable. The endeavor to make the iron content of the red mud usable was further pursued by other companies. In example, through a variant of the Halomet process (developed for continuous liquid titanium production [31]), direct reduction was achieved with a threefold carbon excess in the form of lignite dust, whereby a drop-shaped deposition of the metallic iron was achieved. The slag still containing 20% carbon could be separated by sieving from the iron. However, the decisive question was whether or not this procedure can compete economically with conventional ones. Further attempts were conducted by the Lurgi company in 1963, through enrichment experiments using the method of magnetic roasting. The residues were treated at 750 °C with a CO/CO2 mixture, then ground and separated by wet magnetism. This resulted in a highly enriched fraction with about 52% iron, but their proportion was so low that the iron output in the concentrate was only 20% to 25%. A variant of this process was implemented by Giulini GmbH [32]: the drying and sintering of the red mud takes place with the addition of waste coal in rotary kilns, with partial reduction of the Fe2O3 to the metallic iron. A subsequent smelting and the residual reduction of the sinter is achieved in the hearth melting furnace; the final products are pig iron and granulated slag. The prerequisite for the application of this method is a 45% Fe2O3 content of the starting material. The process was developed to industrial maturity but stopped for economic reasons.
Red mud as such could be actually used in the manufacture of ceramic materials such as tiles, bricks and insulating materials due to its clay-like structure, however the residue must be thoroughly washed and dried prior to use, increasing the cost of the recycling process [2,8,33]. Other attempts have been made for the production of Al2O3-Fe2O3 ceramic fibers [34]. Very recently, a group of designers started the production of ceramics made by red muds that can be used to make design objects like plates, bowls, and vases (the pieces are now undergoing certification for food safety and non-toxicity) [35]. Also, the chemical industry has made attempts to use bauxite residue as a pH modifier in the heap leaching of gold ores, in the removal of sulfur compounds from kerosene oil, and the hydrogenation of anthracene, coals, and aromatic compounds [3,36,37,38,39,40,41]. Finally, in agriculture red mud have been used for wastewater treatment [42,43,44,45,46,47]. Unfortunately, despite this ongoing research, economic uses for bauxite residue are virtually non-existent.
In this work a novel attempt is presented, employing the red muds from Portovesme (Italy) as a raw material for the production of iron-based secondary raw material (Direct Reduced Iron (DRI) or cast iron). Unlike what has been proposed in the literature [26,30,48,49,50,51,52], red mud reduction will be carried out by exploiting another sub-product of the steel industry, the blast furnace sludge as a reducing agent. Blast furnace sludge has proven to be able to replace carbon coke in the reduction of steelworks dust, zinc, blended iron ore, and jarosite [53,54,55,56,57], thanks to the residual content of unburnt coke [53]. To determine the correct ratio of red mud/blast furnace sludge; the reducibility of the red mud is evaluated using graphite in different proportions. Both the starting raw materials and the reduction products are characterized from the chemical and metallurgical point of view by XRF, TG-DSC, XRD and scanning electron microscope (SEM). Furthermore, the possibility of obtaining in addition to the metallic fraction a slag that is easily manageable is also investigated.

2. Materials and Methods

To assess the reducibility of red mud (RM), different blends with variable carbon (C) content were prepared, keeping the basicity indexes of the slag (BBI = Binary Basicity Index, CBI = Complex Basicity Index, OB = Optical Basicity) constant, controlled by the addition of lime (CaO). The best conditions identified in the first set of experiments (control batch) were replicated by mixing red mud (RM), blast furnace sludge (B.F. sludge) and lime, keeping the C/Fe2O3 ratio and the basicity indexes constant. By controlling the basicity, the concentration of the different slag-forming oxides can be assumed to be constant. Thus, the thermal behavior of both the batches (graphite and B.F. sludges) only depends by the C/Fe2O3 ratio. In this way it is possible to compare the reducibility of the two batches excluding interferences from other compounds.

2.1. Red Muds Description

The dried red muds (EurAllumina S.p.A., Portovesme (SU), Italy) were employed for the reduction trials in form of powder, with a particle size ranging from 2 μm to 5 μm, characterized by 21% wt. of iron oxide and Ti oxides (5% wt.). They also contained alkaline oxide, especially Na2O (10% wt.) and CaO (5.5%wt.). Other major constituents were Al2O3 and SiO2 (16%wt. and 10% wt., respectively). From a crystallographic point of view, the raw red mud was mainly formed by gibbsite (γ-Al(OH)3), sodalite (Na4Al3Si3O12Cl), and hematite (Fe2O3) with traces of boehmite (AlOOH), and calcium and sodium carbonates. Loss of ignition (LOI) was very high in this kind of waste, reaching approximately the 30% wt., meaning that almost one third of the initial mass is composed by volatile species (i.e., H2O, CO2).
Before proceeding with the red mud/reducing agent blend preparation, the red muds were calcined in a laboratory muffle furnace at 1000 °C for 60 min. This preliminary treatment had the purpose of eliminating all hydroxide and carbonate species and some dangerous impurities, to make the material easier to reduce. After calcining, most of the gibbsite and boehmite decomposed into Al2O3, while the hematite remained unaltered. Al2O3 reacted with the decomposition products of sodalite and SiO2 to form gehlenite. Calcining enabled the concentration of iron oxide, now approximately 30% wt. of the remaining mass. The complete and detailed red mud and its calcine characterization has already been published elsewhere [58]. Chemical composition before and after pre-treatment is reported in Table 1.

2.2. Samples Preparation

Two different reducing agents were used: pure graphite (as a control batch) and blast furnace sludges (ILVA S.p.A. in AS, Taranto, Italy). The chemical composition of the blast furnace sludges was measured through energy dispersive X-ray fluorescence (ED-XRF) and the elemental analysis for C are presented in Table 2.
Lime (Unicalce S.p.A., Lecco, Italy) was added as fluxing material to lower the melting temperature and favour the formation of slag. The purpose was to keep the same basicity values both for the sample with graphite and for those with blast furnace sludges so as to have two compounds with similar properties. To check this hypothesis, the Binary Basicity Index (1), the Complex Basicity Index (2), and the Optical Basicity (3) were computed [59]. The chemical composition of the lime used in this work is reported in Table 3.
B B I = C a O S i O 2
C B I =   N a 2 O + C a O A l 2 O 3 + S i O 2 + T i O 2
O B = i X i λ i   where   X i = n i N ° o s s i i n i N ° o s s i .
  • n i = number of moles of the pure species-i,
  • N ˚ o s s i = number of oxygen atoms composing the pure species-i,
  • λ i = optical basicity of the pure species-i.
The optical basicity concept relies on the Lewis approach to acids and bases and was developed for dealing with chemical problems in non-aqueous, non-protonic media such as silicates, phosphates, and borates which are important in glass making and (as slags) for refining steel. Basic oxides such as Na2O or CaO are ionic while SO3, P4O10, or SiO2 are covalent, and it is the magnitude of negative charge borne by the oxygen atoms or ions which governs the degree of acidity or basicity. The oxygen atoms of sulphates, phosphates, or network systems such as silicates bear charges which are between those of their parent oxides. Optical basicity accounts for the physical and chemical behaviour of phases and gives indications, for example, on the structural modifications in glasses, on the effective electronic charge carried by ions in an oxide, on the M-O bond lengths or on redox equilibria in melted glasses. This parameter is a measure of the donating electron power of O2 to the Mn+ cation in MOy oxide [59,60].
Six different mixes were prepared, four with graphite and two with blast furnace as reducing agent, respectively. Once determined the most promising mixes in term of reduction yield, the C/Fe2O3 ratio was used as a point of comparison to prepare the red mud/blast furnace sludges mixes. The summary of the properties of the mixes are reported in Table 4.

2.3. Thermal Reduction Tests

Reduction trials were carried out by means of a TG-DSC (thermogravimetry-differential scanning calorimetry) instrument, both in argon and air atmosphere (flow rate: 2 Nl/h), in order to understand the chemical/phase transformations and mass loss that take place during the reduction process. The samples were heated up to 1200 °C (with a ramp of 10 °C/min) and then cooled to room temperature with a ramp of 30 °C/min. A muffle furnace was used to carry out the tests on massive samples (2 to 5 g). The samples were brought to 1200, 1300, and 1500 °C respectively, and maintained at those temperature for 15 min and then cooled to 40 °C in a furnace. Graphite crucibles were used to contain the blends.
At the end of the tests, the mass loss was measured. For each condition, three repetitions were performed for its subsequent characterization.
To verify the assumptions derived from thermal reduction tests, theoretical mass loss was calculated, based on stoichiometric reduction reactions. The reliability of each reaction was evaluated through the Ellingham diagram in standard conditions, as a function of the reference temperature (1200 or 1500 °C) [61]. The main reactions considered are:
  • 2 C + O 2 2 C O
  • 2 F e 2 O 3 + C O 2 F e 3 O 4 + C O 2
  • F e 2 O 3 + 3 C O 2 F e + 3 C O 2
  • Z n O + C O   Z n +   C O 2
  • P b O + C O   P b + C O 2
  • P 2 O 5 + 5 C O 2 P + 5 C O 2  
  • S O 3 + 3 C O   S + 3 C O 2
  • C r 2 O 3 + 3 C O   2 C r +   3 C O 2
  • M n O + C O M n + C O 2
  • V 2 O 5 + 5 C O 2 V +   5 C O 2 .
Potassium, chlorine, zinc and lead were considered lost for evaporation, whereas Na2O, being blind in complex phases, was assumed staying in the slag [62]. All the remaining oxides having an oxygen potential below V-V2O5 equilibrium (SiO2, TiO2, Al2O3, MgO, CaO) were considered not reducible and passing integrally to the slag.
Specific boundary conditions are reported in the Results and Discussion session.

2.4. Chemical, Crystallographic, and Microstructural Characterization

The morphology of the sludges (red mud and B.F. sludge) and the six mixes before and after the roasting cycles, as well as the evaluation of the local chemical composition, were analyzed using an electronic scanning microscope (SEM, Zeiss EVO50, Carl Zeiss AG, Oberkochen, Germany) equipped with an energy dispersive spectroscopy (EDS) probe (Oxford INCA, Oxford Instruments, High Wycombe, UK).
The crystallographic analysis was carried out by means of a Bruker D8 Advance in θ-θ configuration (Cu-Kα radiation: λ = 1.54 Å) on 2 g of ground sample (size <100 μm). The samples were analysed between 0 and 80 °2θ with a Lynks-eye-1 detector and fixed 0.6° divergence slit. The qualitative analysis was performed by Crystal Impact Match! software (version is 3.8.3.151) based on the Crystallographic Open Database (COD, revision 218120, September 10, 2019).
Sample grinding (<100 μm) was performed using a Retsch PM 400 planetary ball mill (Retsch Technology GmbH, Haan, Germany), using a 100 mL grinding jar and 10 mm zirconia sphering balls. Grinding was carried out at 350 rpm for different times depending on the hardness of the sample.
Iron metallization degree (MD) in the reduced samples was determined by dissolution analysis. Total iron (metallic iron (FeMet) plus unreduced residual iron oxide (FeTot)) was determined in accordance with ISO 2597 while metallic iron was determined in accordance with ISO 5416. The dissolution of 0.4 g of powdered sample (<100 μm) occurs in an alkaline solution of 30 mL of hydrochloric acid (HCl), subject to subsequent thermal cycles and to the addition of other substances such as water and ammonia. The degree of metallization is determined as the ratio between metallic iron and total iron (4).
M D =   % F e M e t % F e T o t .
Due to a hard capacity of separation between metal and slag, both the samples (slag and magnetic fraction) were investigated by scanning electron microscope (SEM) equipped with an EDS probe.

3. Results and Discussion

In this paragraph the results of the current investigation are presented, discussing what was obtained by TG-DSC analysis and muffle furnace reduction tests. Characterization of the slag and metal fraction are reported at the end of the paragraph.
The best mixing conditions with graphite as reducing agent were defined as 0.85 and 1.19 C/Fe2O3 ratios. Thus, only these two conditions were replicated with blast furnace sludge. In this section this choice is discussed.

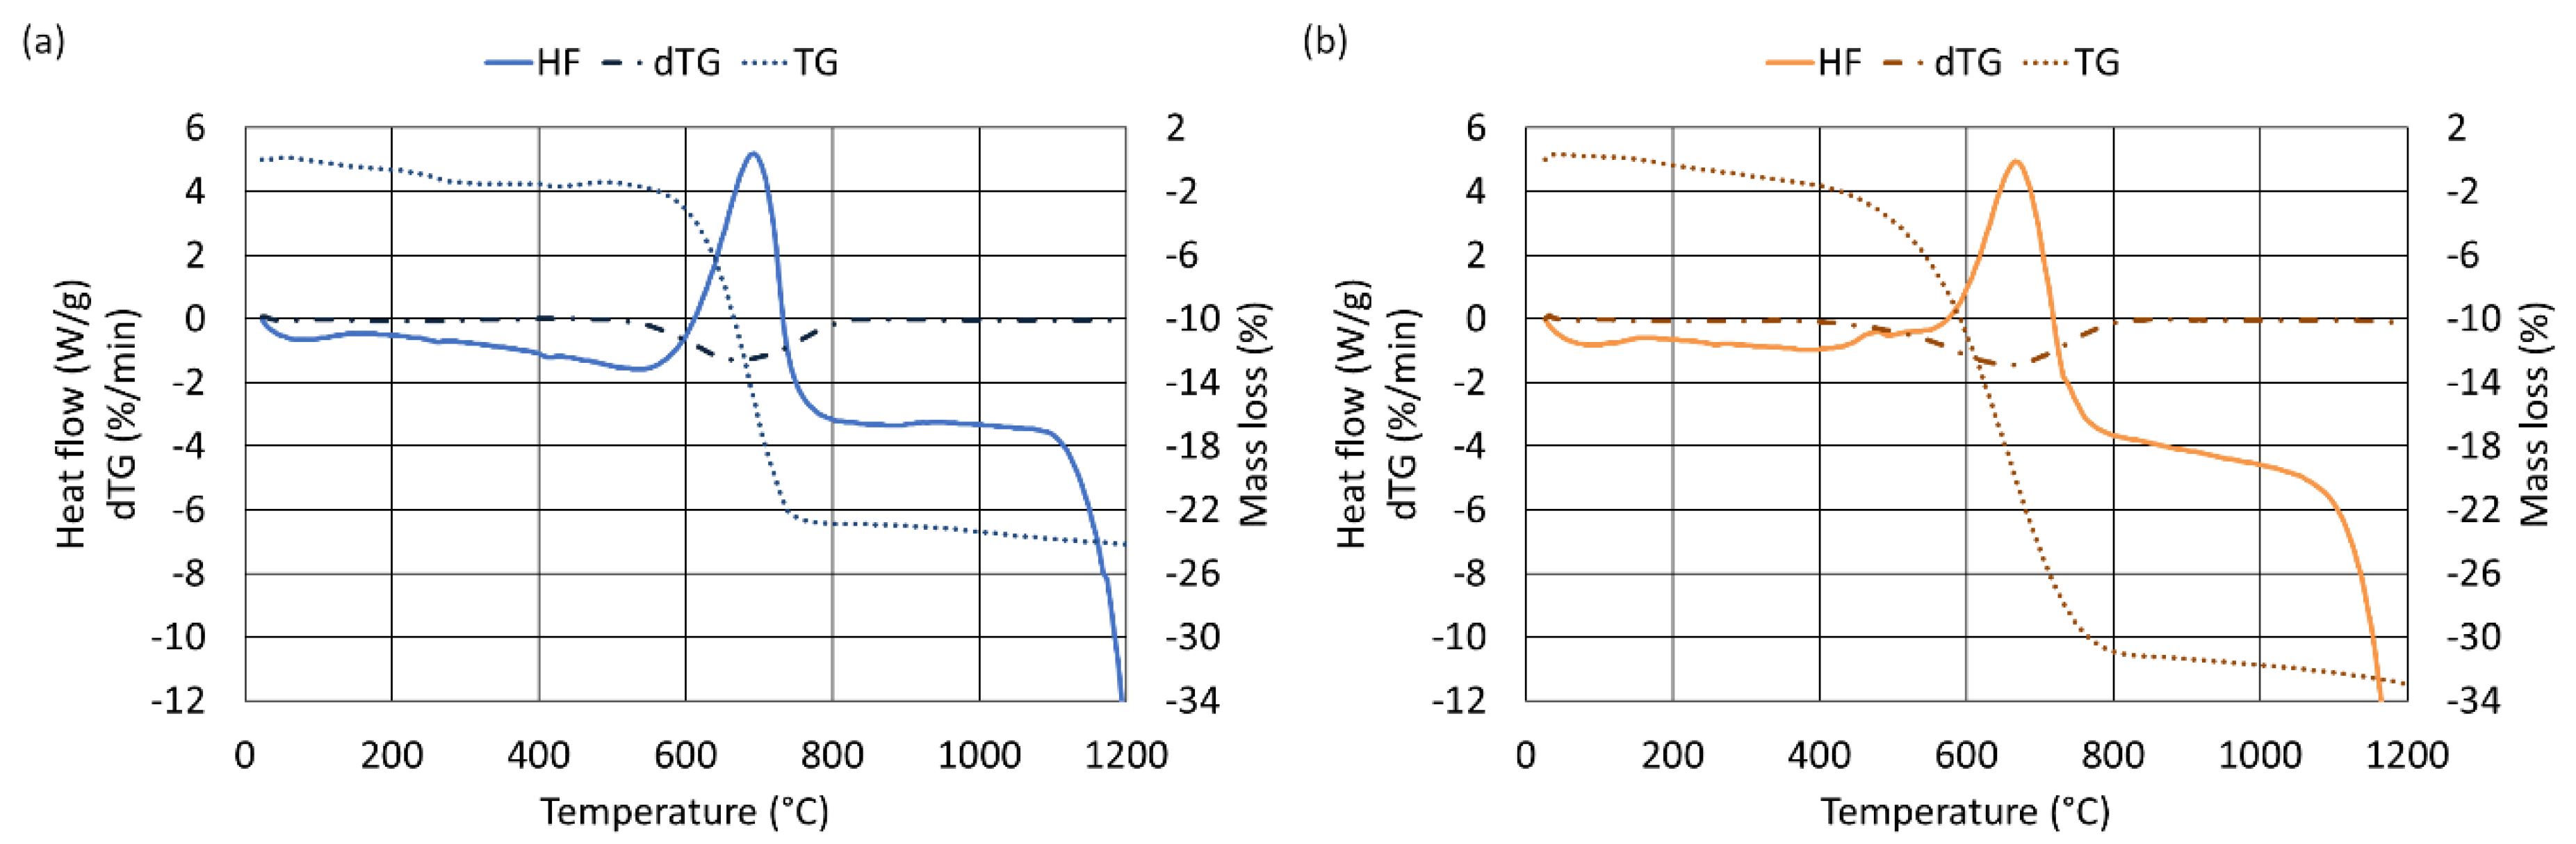
3.1. Thermogravimetric Analysis in Argon

Several endothermic valleys Figure 1, associated to mass variation, can be observed. The reactions, associated to each valley, are:
  • 200–400 °C
    2 A l ( O H ) 3 A l 2 O 3 + 3 H 2 O
    2 A l O O H   A l 2 O 3 + H 2 O
    C a ( O H ) 2 C a O +   H 2 O
  • 650 °C: M g C O 3 M g O +   C O 2 (higher for the sample with blast furnace sludges)
  • 900 °C–1100 °C:
    3 F e 2 O 3 + C   2 F e 3 O 4 + C O
    F e 3 O 4 + C 3 F e O + C O
    F e O + C F e + C O
  • in total: F e 2 O 3 + 3 C   2 F e + 3 C O
The two valleys, in the range 200–400 °C, are due to the complete dihydroxylation of the residual gibbsite and boehmite from the previous red mud roasting step. The second peak also belongs to portlandite dihydroxylation, and is due to the lime that was hydrated after the preparation of the mixes. The valley at 650 °C, more intense in the sample with blast furnace sludges, is related to the liming of the magnesite. Magnesite can come from the contact of the red mud with the sea water, and is capable of significantly reducing the alkalinity of the muds. In blast furnace sludge blends, this peak appears more intense because MgO was intentionally added to the mix. The weak valley at about 900 °C and intense one at 1000 °C belong to the first reduction step of Fe2O3 to Fe3O4, and to the completing reduction and melting of the newly reduced iron [63,64]. The aforementioned peaks are also detected in the dTG graphs whereas the TG clearly shows as a mass variation when the reduction process begins.
From the TG-DSC data, some calculations were made. Specific energy of iron melting, overall mass loss, iron melting temperature, and kinetics parameters were analysed as a function of C/Fe2O3 ratio Figure 2. The analysis of these trends allowed us to highlight the best mixing condition (C/Fe2O3) that lead to the optimum reduction conditions. Specific energy and mass loss maximization were considered as the main aspects for optimum definition.
With regard to the iron melting, the area of the ideal triangle formed by the valley at 1000 °C represents the total specific energy associated to the melting of the iron. The integral was computed with the trapezium method, and the results are reported in Figure 2a.
TG-DSC results show different behaviour in samples with graphite and B.F. sludges. Increasing the C/Fe2O3 ratio, the specific energy associated to the melting of iron increases up to 1.19 C/Fe2O3 Figure 2a. The sample at 1.53 C/Fe2O3 (C4) shows a value, similar to that observed for 0.51 C/Fe2O3 ratio (sample C1). This behaviour is probably because in sample C1 the carbon is not enough to reduce all the hematite, while in samples with 1.53 C/Fe2O3 there is an excess of carbon. The excess of C in sample C4, being the test in Ar and the mass constant for all the tests, reduces the amount of Fe2O3 available for reduction. Fe2O3 is totally reduced to Fe but the absolute amount is so small that it results in a weak endothermic valley. In other words, the formed iron is so in low amount that it gives a low energy associated with its formation. Therefore, the best result in terms of amount of attained iron seems obtained in the sample with 1.19 C/Fe2O3. However, the behaviour relating to the loss of mass as a function of C/Fe2O3 Figure 2b does not comply with the expected trend as reported in Figure 2a, and as observed during the reduction of jarosite [57]. The highest mass loss (~20% wt.) was registered for 0.85 C/Fe2O3, for the sample with 1.19 (~18.5% wt.). The lowest mass loss observed for 1.53 C/Fe2O3 (~16.5% wt.) confirms the hypothesis that in this sample the excess of carbon negatively affects the yield of the reduced product. Therefore, in relation to mass loss, the 0.85 C/Fe2O3 sample seems to have the best conditions to maximize the reduction yield. For this reason, these two C/Fe2O3 (0.85 and 1.19) were replicated by using B.F. sludges as a reducing agent.
It is worth mentioning that the value of the specific energy for the sample with blast furnace sludges follows a similar trend to the graphite reduced sample in Figure 2a. This is the first suggestion that it is possible to recover the iron in the red mud using blast furnace sludges in the same way as with C, which has already been demonstrated in other papers by the same authors [53,57]. Another aspect that plays in favour to the use of B.F. sludges as a reducing agent is that the amount of specific energy involved in the reduction and melting of iron is lower for samples A2 and A3 than for C2 and C3. This means, from an industrial scale up point-of-view, that the treatment of red muds by B.F. sludges will be less energy demanding than the same process with a conventional reducing agent.
The mass loss for B.F. sludges reduced samples (A2, A3) in Figure 2b, increases concordantly with the specific energy and for 1.19 C/Fe2O3 sample, the final mass loss was higher than 31% wt., a 70% more than the mutual sample reduced by graphite. This means that by the use of B.F. sludges as reducing agent, the yield of reduction can be higher.
The TG-DSC results allow to state that the temperate at the melting of the iron takes place Figure 2c decreases as increasing the carbon concentration. Moreover, in samples mixed with B.F. sludges, the melting temperature of iron is 50 °C lower than the samples mixed with graphite. This is probably due to the coke contained in this sludge, which has a better reactivity than pure graphite. This is another element that highlights how B.F. sludges are a performant reducing agent. These results are consistent with the research from Rao et al. [65].
From a kinetic point of view, the maximum transformation rate during iron melting and its temperature were plotted as a function of C/Fe2O3 ratio in Figure 2d. A similar trend for the maximum transformation rate was observed for graphite reduced samples with respect to the specific energy. The fastest reduction rate (1.08%/min) was, indeed, observed for the 0.85 C/Fe2O3 ratio. Also, the temperature at which the maximum transformation rate takes place decreases as the C/Fe2O3 ratio increases, as well as already observed for the temperature associated to the iron melting. Likely, more available C favours both the thermodynamics and the kinetics of iron reduction and melting.
Again, samples reduced using B.F. sludges show slightly different behaviour, in agreement with previous observations. For instance, the maximum transformation rate was observed at 1.19 C/Fe2O3. However, it seems that the reduction promoted by B.F. sludges is a bit slower than the pure graphite (1.08 and 0.9 at 1.19 C/Fe2O3 for graphite and B.F. sludges, respectively). Likely, this is because the reduction and melting of iron in samples A2 and A3 occur at lower temperature, thus requiring more time to be completed. This hypothesis seems supported by the fact that the temperature corresponding to the maximum transformation rate is 15 °C higher for the B.F. sludge reduced samples with respect to the mutual ones reduced by graphite.

3.2. Thermogravimetric Analysis in Air

The same analysis was led on TG-DSC test results in air atmosphere. The samples reduced through blast furnace sludges show the same behaviour as the one reduced though graphite.
Figure 3 reports the DSC, TG and dTG lines. From Figure 3a,b, four peaks can be determined. The reactions related to each peak are:
  • 200–400 °C
    A l ( O H ) 2 A l 2 O 3 + 3 H 2 O
    A l O O H   A l 2 O 3 + H 2 O
    C a ( O H ) 2 C a O +   H 2 O .
  • 600 °C–800 °C:
    C +   O 2 C O 2
    2 C +   O 2 2 C O
    but also 3 F e 2 O 3 + C O   2 F e 3 O 4 +   C O 2 .
The two valleys at 200–400 °C in the heat flow lines (not well defined in TG and dTG signals) are the same already discussed for TG-DSC experiments in Ar. A great exothermic peak, starting at around 600 °C and ending at 800 °C is visible in Figure 3, for both graphite and B.F. sludges reduced samples. The first reaction that takes place is the formation of CO2, however at 700 °C, CO2 is unstable and reacts with C to form CO, in addition C directly reacts with oxygen, giving CO.
At this temperature also trace of hematite to magnetite reduction can happen as detected in similar experiments [53,57]. Complete reduction of magnetite to iron is not possible in this experimental condition due to the fact that the CO formed was carried away by the continuously renewed air atmosphere. Thus, only a partial reduction of hematite into magnetite would be expected since this reaction can develop completely at 750 °C with few ppm of CO.
To validate the previous deductions, the theoretical loss of mass was computed, taking into account the following assumptions, as the sum of:
  • the loss of all the carbon contained in each sample (reaction a, Section 2.3);
  • the loss of the all oxygen contained in the Fe2O3 content when it is reduced to Fe3O4 (reaction b, Section 2.3);
  • no further reductions to FeO or Fe were counted, as the CO atmosphere was not enough to carry out such reactions;
  • the loss of all the oxygen contained in the oxides owing a standard oxygen potential higher than CO at 1200 °C (ZnO, PbO, P2O5, SO3, and Cr2O3) (reactions d to h, Section 2.3).
The comparison between the actual loss of mass and the computed one is shown in Figure 4a: all the points are almost overlapped on the control line at 45°. This means that the calculation confirms that the loss of mass in air atmosphere is due to carbon combustion and the reduction stage from Fe2O3 to Fe3O4.
As for the argon tests, the analysis of the carbon oxidation peak area increases as well as the initial carbon concentration of the sample Figure 4b. As the initial carbon concentration increases (and as the C/Fe2O3 increases), the specific energy associated with the peak increases with a nearly linear behaviour. This is because (in air atmosphere) the more carbon there is in the samples, the more there is a release of energy through the formation reaction of carbon monoxide. With regard to the reducing agent, it is clear that, when the initial carbon concentration is the same (for example in samples C2 and A2), and when blast furnace sludges are used, other elements are present to influence the process. As a result, this lowers the energy of the peak. The mass loss trend shown in Figure 4c coincides, as expected, with the carbon monoxide formation energy.
The peak related to the C combustion does not always take place at the same temperature Figure 2d. In particular, it occurs at a lower temperature for the samples with a higher carbon concentration. Moreover, it can be noticed that with B.F. sludges, lower temperatures are needed (20–30 °C less). This is probably because this kind of sludge contains coke, that has a better ignitability than pure graphite. This means that by the use of B.F. sludge the production of CO in standard atmosphere (i.e., air) can start at a lower temperature, with benefits to the reducibility of the mix.

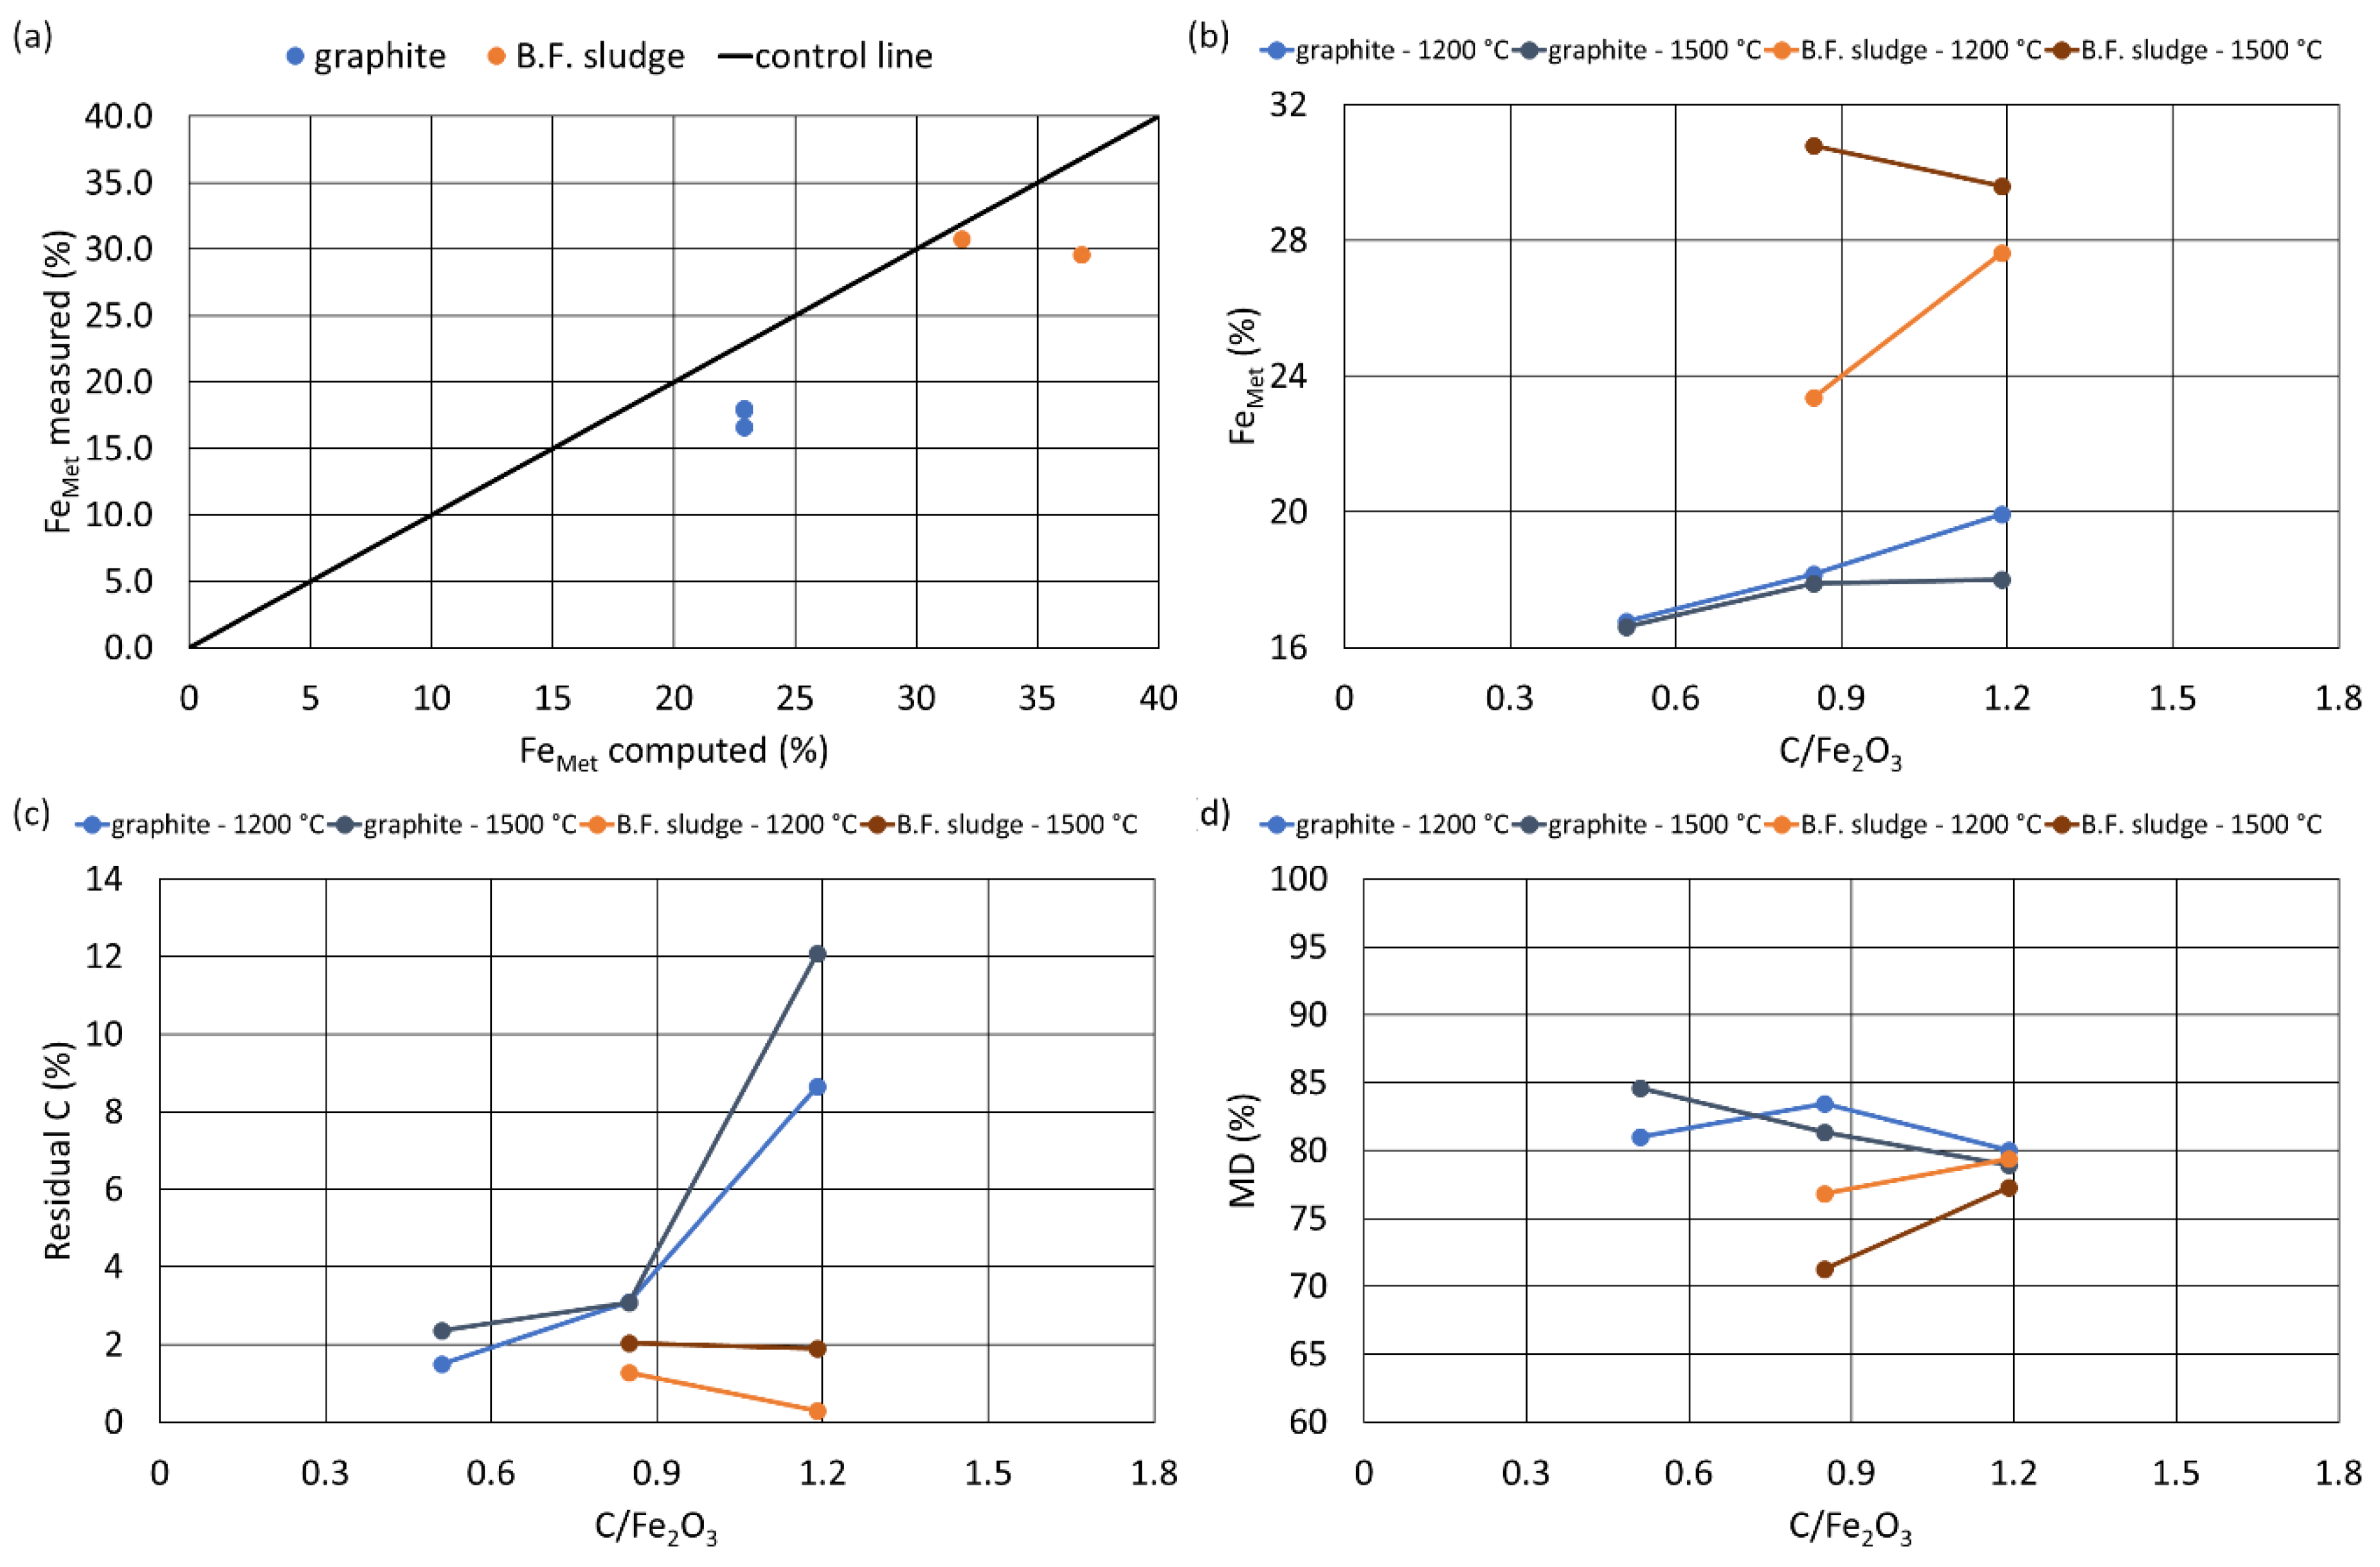
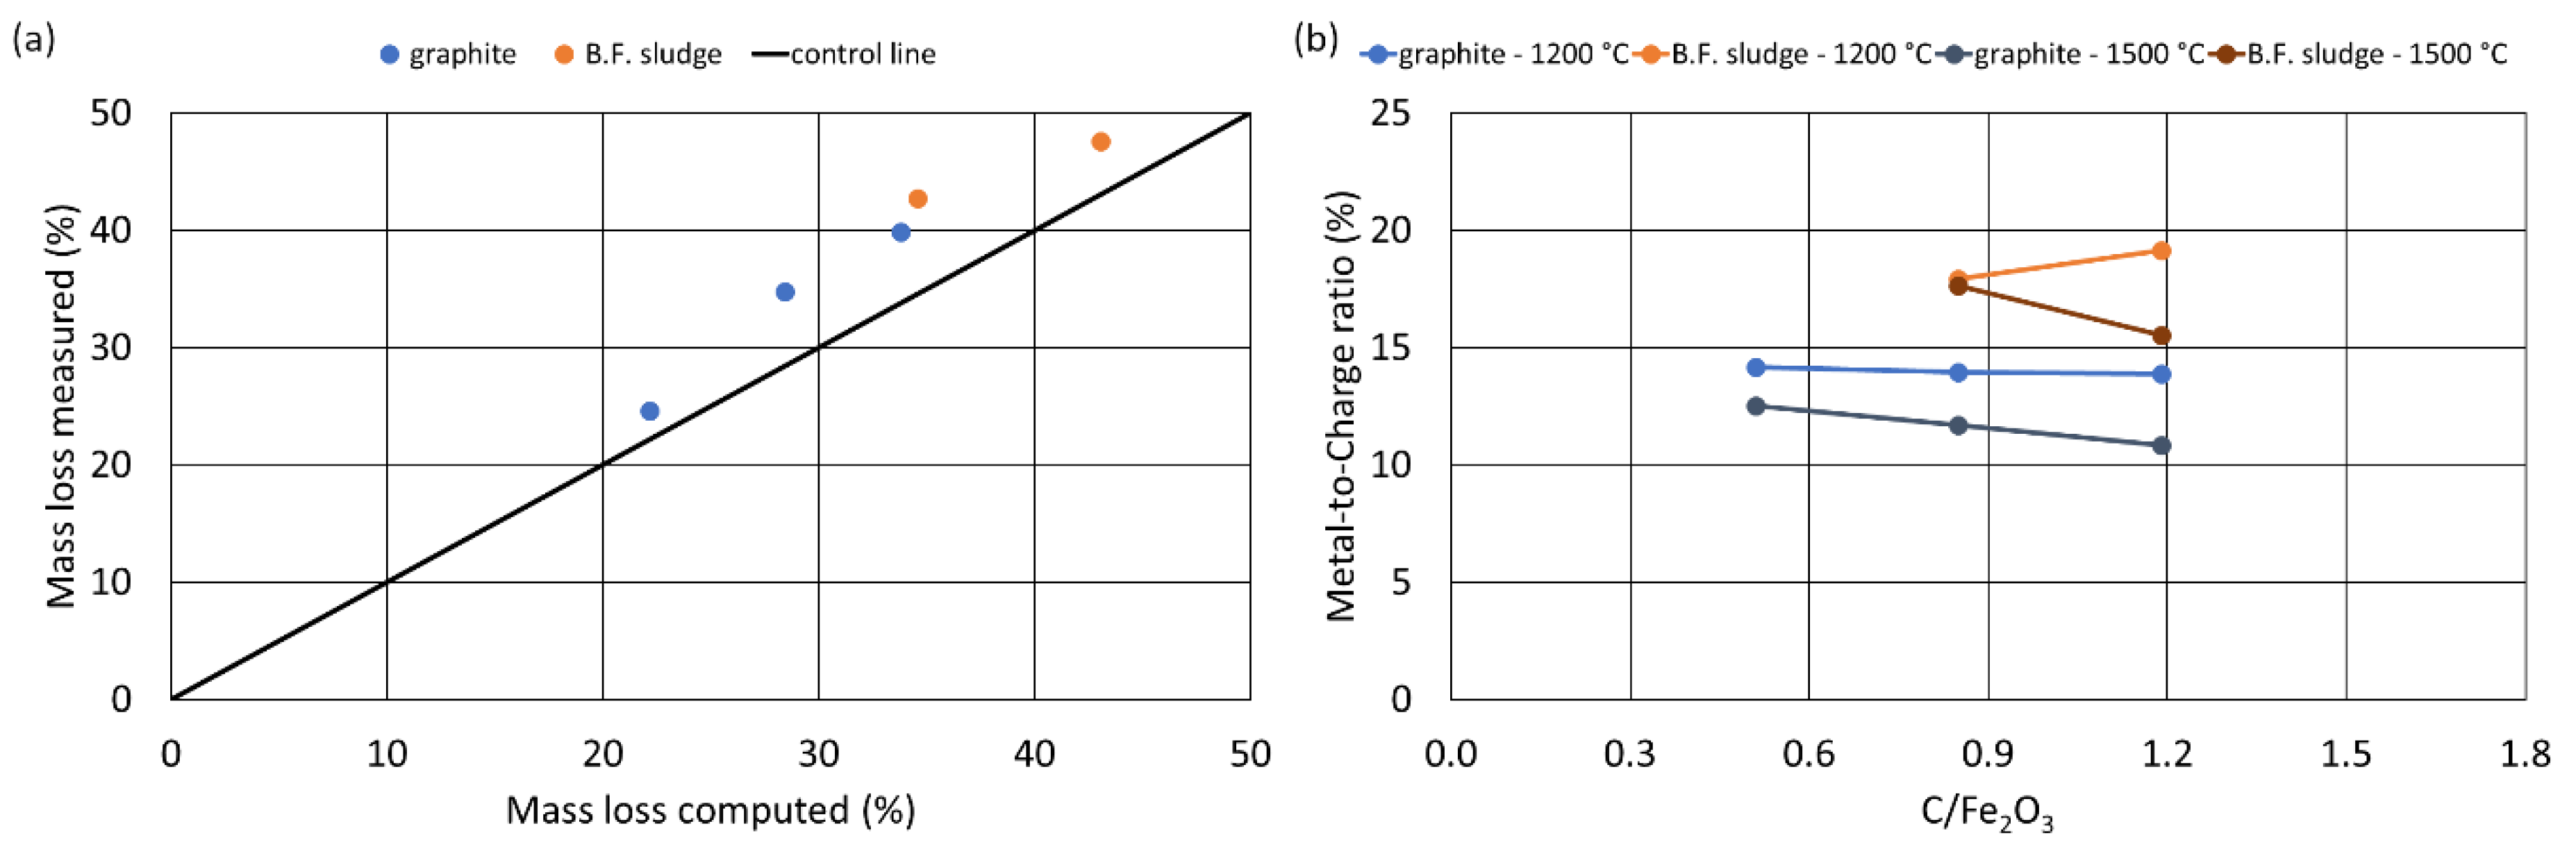
3.3. Reduction Tests

Reduction tests in the muffle furnace allow us to assert that blast furnace sludges are an effective reducing agent that also provides better results than simple graphite. In fact, from Figure 5 and Figure 6 it is clear that, although both products have a compact and solid aspect, sample A2 shows the clear presence of a well separated slag from the metallic fraction; in sample C2, instead, such an aspect is not so evident. In addition, the appearance of the slag obtained through blast furnace sludge addition is more vitrified than the reciprocal obtained by pure graphite. This aspect will be better described with the XRD analysis of the obtained slag.
Iron was obtained for all of the samples at all the temperatures, however, the chemistry and the morphology of the reduced products change. At 1200 and 1300 °C, the typical spongy morphology of direct reduced iron was obtained Figure 5; Figure 6a,c. Also, the non-metallic fraction has a different morphology as a function of the roasting temperature. For instance, at 1200 °C, the non-metallic fraction appears only sintered, with porous morphology. At 1500 °C the metal melts. This is confirmed by the drop morphology of the metallic fraction embedded in the slag Figure 6b,d. Increasing the temperature, the non-reduced oxides can form eutectic compounds and melt, leading to the formation of a compact slag. Unfortunately, the viscosity of the slag, due to a high amount of glass-network oxides, was too high to allow a complete separation between slag and cast iron at 1500 °C Figure 6b,d [66].
The properties of the final product strongly depend on the initial carbon concentration. The samples with 45% of carbon added (Figure 5—C4), have a powdered aspect, after roasting at 1500 °C. This characteristic confirms the hypothesis made through the thermal analysis where it was found that the aforementioned mix has the lowest values of specific energy and therefore would show few metallic fractions with high unburned graphite and not compacted slag. Also, the samples with the highest specific energy associate to the melting of iron (C3 and A3) showed a less compact morphology, whereas the samples at 25% of equivalent C (A2, C2) showed a good compromise between reduction and compactness.
At this point, it is possible to confirm that from the visual analysis of the products, the best initial carbon concentrations of the mixes are 25% and 35% However, since 35% C is resulted in less compacted slag, this means that 25% seems to be the ideal initial carbon concentration.
The amount of metallic material that can be obtained from each sample is of great importance. A comparison between the theoretical maximum amount of cast iron that should be obtained at 1500 °C and the actual fraction measured according to ISO 2597 was performed Figure 7a. For the computation of the expected amount of metal, all the Fe2O3 (reaction c) and reducible oxides (reactions d to j) were considered completely reduced to metal (by considering the carbon available). The comparison was made for the samples roasted at 1500 °C. At this temperature Mn and V oxides were considered completely reduced. Through computation, the metallic fraction was overestimated by a systematic difference between measured and calculated of about 5%. This is likely due to the inability to forecast the amount of post-oxidized metal that actually forms during the cooling step of the roasting cycle. Moreover, the amount of non-reacted carbon cannot be estimated, because the partial pressure of CO and CO2 cannot be measured in the furnace.
By observing the trend of FeMet as a function of C/Fe2O3, it can be noted that it agrees with the variation of the specific energy Figure 7b. For instance, at 1200 °C, it proportionally increases with the C/Fe2O3 ratio whereas at 1500 °C, the final amount of metallic fraction is weakly lower, confirming that at higher temperature a part of the new formed iron reoxidizes during the cooling step.
The residual C amount was determined through elemental analysis and plotted in Figure 7c. The figure confirms the results derived from TG-DSC analysis and visual inspection. Increasing the amount of C available, the amount of residual C in the reduced product increases. In addition, increasing the temperatures lead to an increase of the residual carbon mass in the reduced material. Probably, this happen because the exceeding carbon cannot completely burn out due to a sort of protection of the already formed CO. In addition, during the cooling step of the roasting treatment, part of the unreacted CO decomposes again, below 700 °C, depositing C. This behaviour was evident in the control batch samples (C series) whereas for the B.F. sludge reduced samples, the residual C was almost constant and at a very low concentration. Probably, since in the B.F. sludge the C-bearing material is coke, it starts to form CO at a lower temperature than graphite (as stated in Figure 4d) giving time to completely reacts with reducible oxides thus, by consuming itself more homogenously during the heating step.
Finally, the metallization degree (MD) was plotted as a function of the C/Fe2O3 ratio Figure 7d. The maximum metallization degree (nearly 85%) was measured at C/Fe2O3 of 0.85, in correspondence of the maximum mass loss registered in TG-DSC. As well, the behaviour of B.F. sludge reduced samples follows the trend of mass loss: The maximum (80%) corresponds to the 1.19 C/Fe2O3 ratio. As a confirmation of the partial reoxidation during the cooling step from 1500 °C, the metallization degree is tendentially lower than the values obtained at 1200 °C. In addition, the maximum was obtained for the sample at 15% C (C1) likely as here the amount of metal was the lowest, hence its reoxidation was limited.
Starting from the weight of each sample charged in the muffle furnace at 1500 °C, the mass loss was determined and compared with the theoretical one, by accounting:
  • the loss of the oxygen contained in the Fe2O3 when it is reduced to Fe (reaction c, Section 2.3);
  • the loss of all the oxygen contained in the oxides owing a standard oxygen potential higher than CO at 1500 °C (ZnO, PbO, P2O5, SO3, Cr2O3, MnO and V2O5) (reactions d to j, Section 2.3);
  • the loss of all the C contained in the mix to form CO (reaction a, Section 2.3).
In this case, the computed mass loss was underestimated, a systematic error of about 5%, with respect to the experimental results. Mass loss does not depend only on reduction reactions, but at 1500 °C also the non-reducible oxides undergo some transformation forming the slag. Probably, some of the reactions lead to a change in the oxidation state of certain oxide species, resulting in a further loss of oxygens. In addition, part of the Na2O could sublimate, over 1275 °C, if it is not bound in a complex oxide, as was observed by Sosinsky and Sommerville [67]. For example, a study analyzed the kinetics of Na2O evaporation in a COREX® process slag [68]. The evaporation of Na2O depends also by slag basicity: At higher basicity the activity coefficient of Na2O becomes larger, which leads to higher Na2O evaporation. The authors concluded that for a slag with binary basicity equal to 3.5, the loss of sodium reached nearly the 90% wt. after 60 min at 1500 °C. Looking at the basicity of the slag obtained during the reduction of red muds, since it has a very low binary basicity (<0.7), extremely low Na evaporation rates are expected. The small amount of lost Na2O could explain the difference between the measured and calculated loss of mass. In addition, the reducing conditions developed by the formation of CO can contribute to remove part of the Na2O from the mixes. For instance, Kaussen and Friedrich [66] established that the sodium content in the slag decreases with increasing exchanged volume of atmosphere in slightly reducing atmosphere. This is another confirmation that part of the mass loss is due to Na2O volatilization.
The metal-to-charged material ratio was plotted in Figure 8b, where it can be noticed that the values range from a minimum of 10% to a maximum of 20%. The values related to blast furnace sludges are 1.5 times higher than the graphite reduced samples, confirming the use of B.F. sludges as a good practice to recover iron from metallurgical wastes. The difference in the reduction yield from 1200 to 1500 °C confirms what we discussed above: Without inert gas protection, part of the newly reduced iron reoxidizes during the cooling step and this is more intense as the amount of formed iron increases.

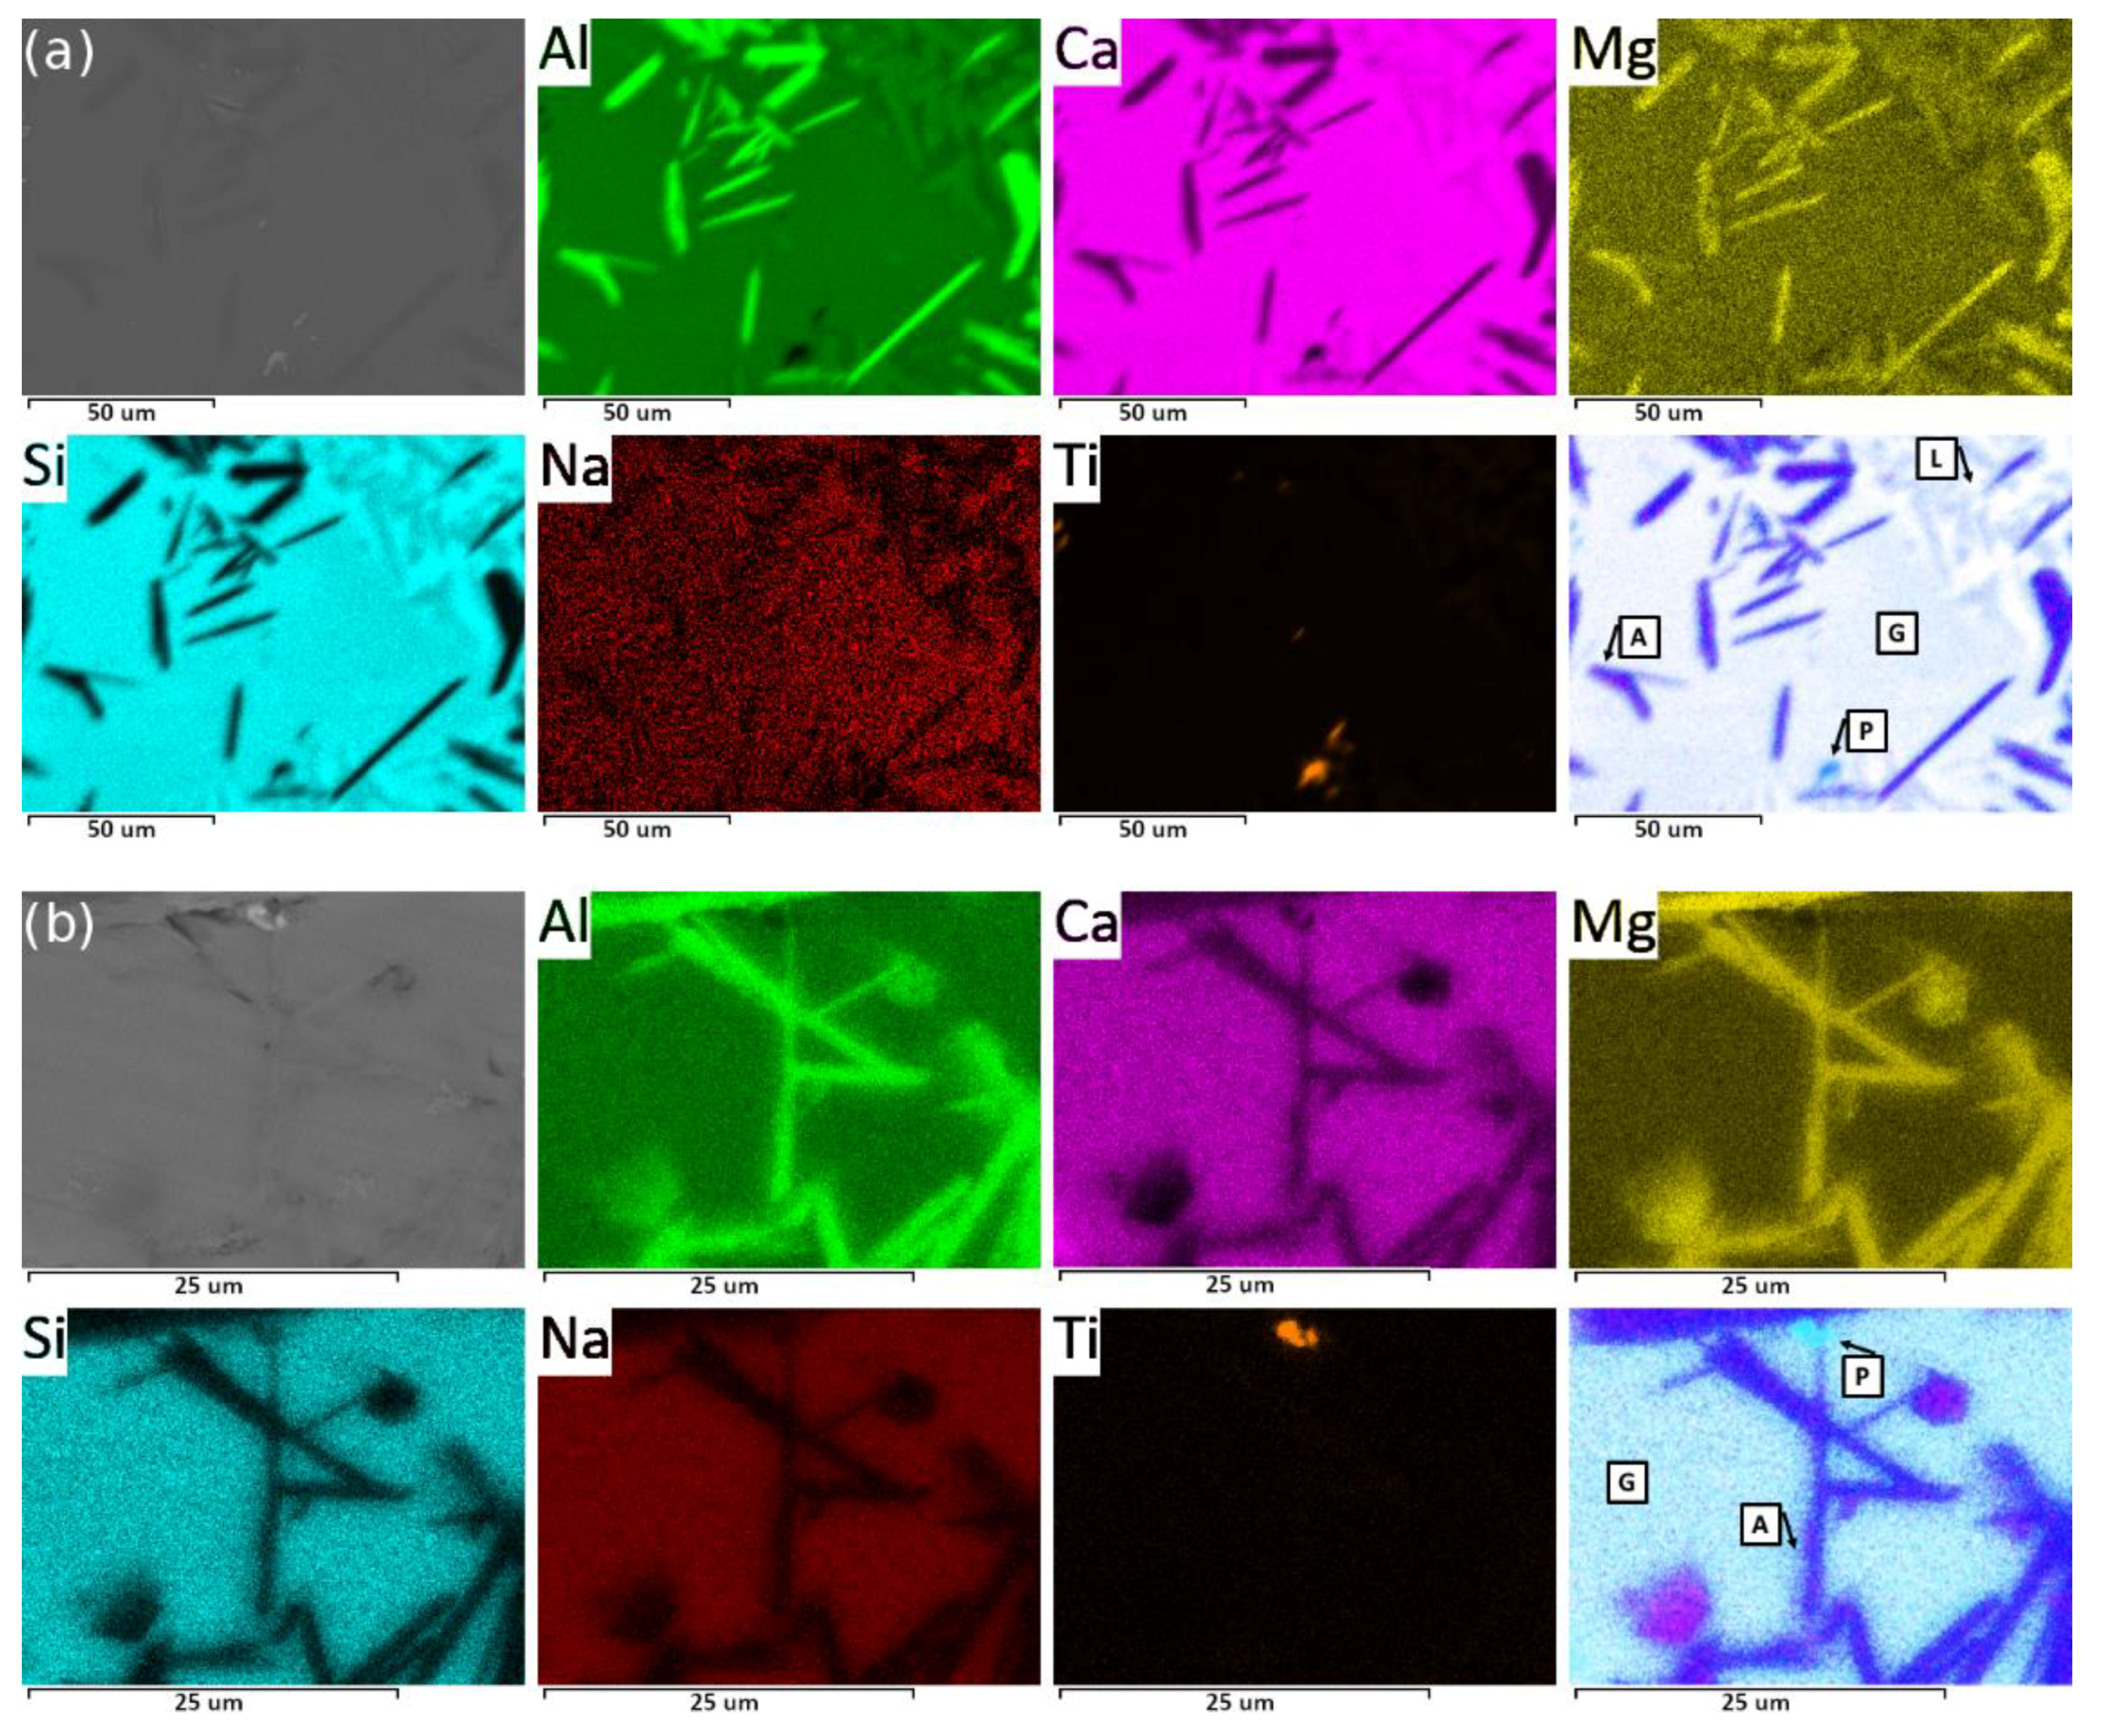
3.4. Cast Iron and Slag Characterization

An optical microscope (OM) and a scanning electron microscope (SEM) were used to analyse the reduced iron obtained with the aim to understand its properties and characteristics and foresee its possible utilization. The cast iron obtained is mainly formed by a perlite matrix with cementite at the grain boundaries. Non-significant fraction of a second non-metallic phase, i.e., sulphides, were observed. Lamellar graphite was observed only in specific regions of the samples, probably where C is concentrated more.
The chemical composition was determined by SEM-EDS. Table 5 reports the chemical composition of some metallic spheres collected from the different samples. The main elements detected were Si, Cr, and V. Mn was practically absent since no Mn source is present, in the red muds or in the blast furnace sludge. Traces of this elements were observed only in the sulphides precipitated in the iron matrix.
Sulphur was only detected in the sample with higher amount of blast furnace sludges (A3) and this is consistent with the fact that more coke in the mixture can drive more S to the iron.
V was mainly detected in graphite reduced samples because in the B.F. sludges reduced samples, this element undergoes a strong dilution and the residual amount solved in the iron is not detectable by the EDS probe. The same for Cr.
With respect to the cast iron obtained by the reduction of jarosite sludges from zinc hydrometallurgy, the cast iron formed by the treatment of red muds appear less polluted by harmful elements (Cu, S, P, As) and thus, of a greater quality, leading to a wider possibility of its utilization as raw material for foundries and steel shops.
Regarding the slag, some differences can be highlighted as a function of the roasting temperature. The main constituents of the slag, detected in all the samples by means of XRD, were gehlenite (Ca2Al(AlSi)O7), diaoyudaoite (Al11NaO17), and perovskite (CaTiO3) [58]. Gehlenite was already formed during the red mud roasting by solid state reaction between CaO, Al2O3, SiO2, and traces of Na2O; diaoyudaoite was probably the reaction product of Al2O3 and the Na2O set free from thermonatrite melting (at 850–860 °C [69]); whereas perovskite forms by the reaction between CaO and anatase at 1100 °C. The latter transformation is slightly visible also in the dTG curves (Figure 1). At lower temperature (1200 °C) peaks belonging to Na-Al-silicate were detected. By increasing the temperature, such a phase starts to convert to nepheline and at 1500 °C all the silicate is converted into nepheline. Likely this transformation is strictly related to the decomposition of sodalite. After melting at 1064 °C, sodalite starts to decompose into NaCl and nepheline, in the range 1090–1320 °C [70]. In the samples at 1500 °C sodalite is completely decomposed into nepheline, and for this reason in the reduced red muds mixtures, only their peaks are visible. Such compounds reflect a fully crystalline development of the slag structure.
Other components of the slag were the iron oxides, with some differences in the samples from 1200 to 1500 °C. At 1200 °C, magnetite was observed as the only oxide form of iron. At 1300 °C very weak peaks associated to a mixture of Fe3O4 and FeO might be detected but not indexed, since their intensity was not enough to be matched with the reference patterns. At 1500 °C, the oxide form of iron was FeO, with no more traces of Fe3O4. This behaviour agrees with the iron oxide reduction happening in a blast furnace or DRI plants [71]. At 1200 °C the temperature is not high enough to reduce to iron the whole amount of hematite within the red muds. This led to a residual amount of partially reduced magnetite in the slag. At 1300 °C, the temperature is proximal to the formation temperature of sponge iron (or DRI). This means that at such a temperature, all the hematite converted in iron and no more oxides are within the mixture. The morphology of the samples roasted at 1300 °C seem to confirm this behaviour: Their surfaces appear, indeed, most metallic and spongy, with a lighter grey colour than the samples roasted at 1500 °C. In addition, the roasted samples at 1300 °C show the highest metallization degree, mainly due to a lower amount of residual iron oxide.
The presence of FeO in the samples reduced at 1500 °C is, again, a confirmation that during the cooling, a part of newly reduced iron reoxidizes to FeO. This implies a reduction of metallization degree, as already stated a paragraph above.
The main differences between graphite and B.F. sludge reduced samples are in the slag characteristics of the roasted mixes at 1500 °C. A typical amorphous halo was observed from 20 to 30 °2θ, indicating a partial vitrification of the slag. This aspect is important for further evaluation of the environmental impact of the slag, since it was demonstrated that vitrified slag can be safety disposed or, better, reutilized for civil engineering purposes [72]. A2 slag shows a more evident amorphous halo, symptomatic of a better developed glassy structure with respect A3 slag.
Compositional maps for slag samples obtained after 1500 °C reduction test have been reported to better visualize the homogeneity of the gehlenite matrix (G mark in Figure 9) within the dispersed crystal of akermanite (A mark in Figure 9). Samples A2 and C2 where selected because they represent the best conditions in terms of partially vitrification of the slag.
As can be seen, the slag has the same phase arrangement and composition for both the samples reduced by graphite and B.F. sludge, even if some differences can be highlighted. For instance, in the slag obtained after graphite reduction, small larnite-like crystals (L mark) are visible. Small perovskite crystals can be detected, in both samples (P marks).
Being the slag mainly composed of gehlenite and having a composition favourable to vitrify is a great advantage, since gehlenite matrix compounds have been shown a poor reactivity in water and a strong hindering behaviour against metals leaching [73,74].

3.5. Summary and Cost Estimation

A favourable aspect on the use of B.F. sludge as a reducing agent for red mud recovery is the lower temperature need to melt the iron after the hematite reduction. This aspect could be exploited at the industrial level, as a low iron formation temperature would permit lower operational costs.
Moreover, mixtures treated by blast furnace sludges have a higher reduction yield (17% versus 13%) than the corresponding samples treated with graphite, even with a lower metallization ratio. This aspect depends on the fact that in addition to the iron contained in the red mud, the iron oxide (around 30% wt.) within B.F. sludges can be also recovered. In addition, the unburnt coke featuring the B.F. sludges is more effective for the reduction. Another aspect playing in favour of B.F. sludge use is a lower unburned carbon fraction at the end of the reduction process.
From economic and environmental points of view, the use of blast furnace sludges as a reducing agent for the treatment of the red muds lagooned in Portovesme would have a threefold advantage:
  • high quality of DRI or cast iron can be obtained and used as a raw material in oxygen converters or electric furnaces;
  • the stockpiled waste amount would be reduced, for both the iron and the aluminum metallurgies, with a clear benefit for the environment;
  • the reduction residue (slag) has mineralogical characteristics that can assure safe disposal or virtuous recycling for civil engineering applications.
By taking in consideration all the aspects associated with the reduction process, such as residual C, reduction yield, metallization ratio, and slag characteristics, the best mix to have a good compromise between reduction yield and metallization degree is a 1:1 red mud/B.F. sludges, equivalent to 0.85 C/Fe2O3.
In order to give a cost estimation of the process, the energy balance of the main involved reduction reaction was conducted in Equation (5). Thus, the enthalpy of reaction was calculated in Equation (6), based on the NIST Chemistry WebBook data for hematite, iron, and carbon monoxide [75,76,77].
F e 2 O 3 + 3 C 2 F e + 3 C O
Δ H r = ν Δ H r p r o d u c t s ν Δ H r r e a g e n t s = ν ( H r p r o d u c t s 0 T 0 T c p p r o d u c t s d T ) ν ( H r r e a g e n t s 0 T 0 T c p r e a g e n t s d T )
where ∆Hr is the reaction enthalpy, Hr0 is the reaction enthalpy in standard conditions (25 °C, 1 atm), cp is the specific heat capacity, T0 is the standard temperature (298.15 K), T is the current temperature and ν is the stoichiometric coefficient.
The iron melting temperatures defined through TG-DSC analysis in an Ar atmosphere, were used in the computation (1020 °C for sample C2, 960 °C for sample A2). Approximately 522.5 kJ/mol was obtained for Fe2O3 reduction by graphite, instead of 520 kJ/mol for reduction by B.F. sludges. The overall reduction reaction of hematite to iron, being endothermic, requires thermal energy to be fulfilled. The required energy can be supplied by methane combustion (802–889 kJ/mol [78]) in a rotary kiln or by the use of air plasma in an arc transferred plasma furnace. In Table 6, a raw estimation of the process profitability is reported referring to three different scenarios: an integrated steel shop (1), a third company (2), or an alumina refinery (3) as possible industrial sites where the process could be conducted. For each site, two options were analysed in relation to the transportation costs; they are supported by the treating plant or by the waste producer. Hazardous waste disposal costs were estimated on the basis of the average costs of Italian waste disposers and they account for 190 €/t (100 €/t for transportation and 90 €/t for dumping) [79]. Raw materials (coke, lime, and cast iron) prices are 170 €/t, 90 €/t, and 160 €/t, respectively [80,81]. Cast iron price is referred to cast iron turnings (cat. E5G) and represents the lowest price at which cast iron can be sold.
The sole reduction of red mud, using coke as a reducing agent, is not profitable, except when the treatment is done in a third company that is paid for collecting the muds from the alumina refinery (111 €/tdriedRM). The combination of red mud and B.F. sludge results as profitable in five of the selected scenarios. The best condition is if the process is performed in integrated steel shops and, in particular, if the steel shop is paid for collecting the mud (128 €/tdriedRM or 378 €/tdriedRM). If the process is set-up at the alumina refinery, the break-even point can be reached only if the sold price of cast iron is 255 €/t, which is equivalent to ready-to-use cast-iron scrap. To reach the break-even point by red mud reduction through coke in an integrated plant, the cast iron price should be approximately 2000 €/t. Thus, the reduction of red mud by B.F. sludges guarantees the highest operating margin. Processing the whole amounts of red mud available in Portovesme (1.5 Mt) in an integrated plant, the total operative margin is enough to cover the capital costs of a rotary kiln.

4. Conclusions

This work presented a new method for the reduction of the bauxite process tailings (red muds), through blast furnace sludges. Both blast furnace sludges and pure graphite were used as reducing agents. Many different starting mixes were reduced at 1200, 1300, and 1500 °C, with a different carbon concentration and lime content, for a total of sixteen mixes. On the basis of the products obtained, the following conclusions can be drawn:
  • the chemical behavior of the two different batches, with graphite or blast furnace sludges, is equivalent. This confirms that B.F. sludges can be used instead of coke or other carbonaceous materials as reducing agent;
  • the Fe2O3 in the red muds can be reduced through a pyrometallurgical process, using blast furnace sludges;
  • value of metal/charge ratio of at least 17% was obtained through blast furnace sludges;
  • the reduction yield though blast furnace sludges is 1.5 times higher than through graphite;
  • high quality of DRI or cast iron can be obtained with blast furnace sludges;
  • blast furnace sludges induce a vitrified structure of the slag hindering the toxic element leaching.
By considering all the aspects listed before, the best mix suggested is a 1:1 red mud/B.F. sludge, equivalent to 0.85 C/Fe2O3.
To conclude, all the trials and experiments carried out in this work led to the optimisation of the reducing process which can be implemented in a large-scale plant, i.e., arc transferred plasma furnace or direct reduction shaft furnaces, by replacing coke with blast furnace sludges.

Author Contributions

Conceptualization, C.M.; methodology, C.M. and D.M.; investigation, D.M.; resources, D.M. and A.G.; writing—original draft preparation and editing, D.M.; writing—review, S.B.; supervision, C.M.

Funding

This research received no external funding.

Acknowledgments

Authors would like to thank Marco Alloni (Prosimet, Filago (BG)) for TG-DSC tests, Eng. Umberto Di Landro (Dilab, Crema (CR)) for iron wet analysis, Gwenn Le Saout and the Centre des Materiaux des Mines d’Alès (C2MA) (Ecole des Mines d’Alès) for XRD analysis.

Conflicts of Interest

The authors declare no conflict of interest.

References

  1. Paramguru, R.K.; Rath, P.C.; Misra, V.N. Trends in red mud utilization—A review. Miner. Process. Extr. Metall. Rev. 2005, 26, 1–29. [Google Scholar] [CrossRef]
  2. Kurdowski, W.; Sorrentino, F. Red mud and phosphogypsum and their fields of application. In Waste Materials Used in Concrete Manufacturing; Chandra, S., Ed.; William Andrew Publishing: Norwich, NY, USA, 1996; pp. 290–351. [Google Scholar]
  3. Cabllk, V. Characterization and applications of red mud from bauxite processing. Br. Libr. World’s Knowl. 2007, 23, 27–38. [Google Scholar]
  4. Alumina Production. Available online: http://www.world-aluminium.org/statistics/alumina-production/ (accessed on 24 June 2019).
  5. Ayres, R.U.; Anderson, B.; Holmberg, J. Materials and the global environment for the 21st century. MRS Bull. 2001, 26, 477–480. [Google Scholar] [CrossRef]
  6. Akinci, A.; Artir, R. Characterization of trace elements and radionuclides and their risk assessment in red mud. Mater. Charact. 2008, 59, 417–421. [Google Scholar] [CrossRef]
  7. Bautista, R.G. Recovery of rare earths from red mud. In Rare Earths: Extraction, Preparation and Applications: Proceedings of a Symposium Held by TMS and AusIMM during the TMS Annual Meeting in San Diego, California March 1–5; The Metallurgical Society Inc.: San Diego, CA, USA, 1992; pp. 119–125. [Google Scholar]
  8. Qu, Y.; Lian, B. Bioleaching of rare earth and radioactive elements from red mud using Penicillium tricolor RM-10. Bioresour. Technol. 2013, 136, 16–23. [Google Scholar] [CrossRef]
  9. EuropeanCommission. Commission notice on technical guidance on the classification of waste. Off. J. Eur. Union 2018, C 124, 134. [Google Scholar]
  10. Industrial Minerals & Rocks: Commodities, Markets, and Uses, 7th ed.; Kogel, J.E.; Trivedi, N.C.; Barker, J.M.; Krukowski, S.T. (Eds.) Society for Mining, Metallurgy, and Exploration, Inc.(SME): Littleton, MA, USA, 2006; ISBN 978-0-87335-283-3. [Google Scholar]
  11. Schmitz, C. Red Mud Disposal. In Handbook of Aluminium Recycling; Vurlan-Verlag Gmbh: Munich, Germany, 2006; p. 18. [Google Scholar]
  12. Power, G.; Gräfe, M.; Klauber, C. Bauxite residue issues: I. Current management, disposal and storage practices. Hydrometallurgy 2011, 108, 33–45. [Google Scholar] [CrossRef]
  13. Szépvölgyi, J. A Chemical Engineer’s View of the Red Mud Disaster. Nachrichten aus der Chemie 2011, 59, V. [Google Scholar] [CrossRef]
  14. Rai, S.; Wasewar, K.L.; Lataye, D.H.; Mukhopadhyay, J.; Yoo, C.K. Feasibility of red mud neutralization with seawater using Taguchi’s methodology. Int. J. Environ. Sci. Technol. 2013, 10, 305–314. [Google Scholar] [CrossRef]
  15. Palmer, S.J. Stability of Hydrotalcites Formed From Bayer Refinery Environmental Control Processes. Ph.D. Thesis, Queensland University of Technology, Brisbane, Australia, 2010. [Google Scholar]
  16. David Gura Toxic Red Sludge Spill from Hungarian Aluminum Plant ‘An Ecological Disaster’: The Two-Way: NPR. Available online: https://www.npr.org/sections/thetwo-way/2010/10/05/130351938/red-sludge-from-hungarian-aluminum-plant-spill-an-ecological-disaster?t=1555008683054 (accessed on 22 June 2019).
  17. BBC News Hungarian Chemical Sludge Spill Reaches Danube. Available online: http://www.bbc.com/news/world-europe-11491412 (accessed on 22 June 2019).
  18. Milačič, R.; Zuliani, T.; Ščančar, J. Environmental impact of toxic elements in red mud studied by fractionation and speciation procedures. Sci. Total Environ. 2012, 426, 359–365. [Google Scholar] [CrossRef]
  19. Li, X.; Xiao, W.; Liu, W.; Liu, G.H.; Peng, Z.H.; Zhou, Q.S.; Qi, T.G. Recovery of alumina and ferric oxide from Bayer red mud rich in iron by reduction sintering. Trans. Nonferrous Met. Soc. China (English Ed.) 2009, 19, 1342–1347. [Google Scholar] [CrossRef]
  20. Hudson, L.K. Alumina Production; The Aluminium Company of America: Pittsburgh, PA, USA, 1982. [Google Scholar]
  21. Mishra, B.; Staley, A.; Kirkpatrick, D. Recovery of value-added products from red mud. Min. Metall. Explor. 2002, 19, 87–94. [Google Scholar] [CrossRef]
  22. Das, B.; Singh, B.P.; Bhima Rao, R. Recovery of iron values form red mud. Trans. Indian Inst. Met. 1992, 45, 173. [Google Scholar]
  23. Patel, M.; Padhi, B.K.; Vidyasagar, P.; Pattnaik, A.K. Extraction of titanium, dioxide and production of building bricks from red mud. Res. Ind. 1992, 37, 154–157. [Google Scholar]
  24. Fofana, M.; Kmet, S.; Jakabsky, S.; Hredzak, S.; Kunhalmi, G. Treatment of red mud from alumina production by high-intensity magnetic separation. Magn. Electr. Sep. 1995, 6, 243–251. [Google Scholar] [CrossRef]
  25. Mukherjee, T.K.; Gupta, C.K. Extraction of Vanadium from an Industrial Waste. High Temp. Mater. Process. 1993, 11, 189–206. [Google Scholar] [CrossRef]
  26. Piga, L.; Pochetti, F.; Stoppa, L. Recovering metals from red mud generated during alumina production. Jom 1993, 45, 54–59. [Google Scholar] [CrossRef]
  27. Liu, W.; Yang, J.; Xiao, B. Application of Bayer red mud for iron recovery and building material production from alumosilicate residues. J. Hazard. Mater. 2009, 161, 474–478. [Google Scholar] [CrossRef]
  28. Li, L.Y. A study of iron mineral transformation to reduce red mud tailings. Waste Manag. 2001, 21, 525–534. [Google Scholar] [CrossRef]
  29. Mishra, B.; Slavik, M.; Kirkpatrick, D. Recycling of red mud by recovery of value-added products. In Proceedings of the Global Symposium on Recycling, Waste Treatment and Clean Technology (REWAS 1999), San Sebastian, Spain, 5–9 September 1999; Volume 1, pp. 251–260. [Google Scholar]
  30. Muster, F. Rotschlamm: Reststoff aus der Aluminiumoxidproduktion—Ökologischer Rucksack oder Input für Produktionsprozesse? Kassel university press GmbH: Kassel, Germany, 2007; ISBN 9783899583595. [Google Scholar]
  31. Nowak, R.; Schuster, W. Process for the Production of Metallic Chlorides from Substances Containing Metallic Oxides. U.S. Patent 3,466,169, 1969. [Google Scholar]
  32. Bayer, G.; Cherdron, E. Process for Continuous Production of Flocculating Agent from Red Mud. U.S. Patent 3,986,975, 1976. [Google Scholar]
  33. Singh, M.; Upadhayay, S.N.; Prasad, P.M. Preparation of special cements from red mud. Waste Manag. 1996, 16, 665–670. [Google Scholar] [CrossRef]
  34. Patel, M.; Padhi, B.K. Al2O3-Fe2O3 fibres from bauxite and red mud. Silic. Ind. 1992, 57, 39–43. [Google Scholar]
  35. Rikkert, J.O.; Whittembury, G.; Rouff, K.; Bockelmann, L.P. Residue Enabled Design (R.E.D.). Available online: https://redmud.squarespace.com/ (accessed on 4 November 2019).
  36. Browner, R.E. The use of bauxite waste mud in the treatment of gold ores. Hydrometallurgy 1995, 37, 339–348. [Google Scholar] [CrossRef]
  37. Singh, A.P.; Singh, P.C.; Singh, V.N. Cyclohexanethiol separation from kerosene oil by red mud. J. Chem. Technol. Biotechnol. 1993, 56, 167–174. [Google Scholar] [CrossRef]
  38. Singh, A.P.; Singh, P.C.; Singh, V.N. Removal of 1-Butanethiol from Diesel Oil by Red Mud. Ind. Eng. Chem. Res. 1988, 27, 2101–2104. [Google Scholar] [CrossRef]
  39. Liano, J.J.; Rosal, R.; Sastre, H.; Diez, F.V. Catalytic hydrogenation with red mud. Fuel 1994, 73, 688–694. [Google Scholar] [CrossRef]
  40. Alvarez, J.; Rosal, R.; Sastre, H.; Díez, F.V. Characterization and deactivation studies of an activated sulfided red mud used as hydrogenation catalyst. Appl. Catal. A Gen. 1998, 167, 215–223. [Google Scholar] [CrossRef]
  41. Eamsiri, A.; Jackson, W.R.; Pratt, K.C.; Christov, V.; Marshall, M. Activated red mud as a catalyst for the hydrogenation of coals and of aromatic compounds. Fuel 1992, 71, 449–453. [Google Scholar] [CrossRef]
  42. Summers, R.N.; Guise, N.R.; Smirk, D.D. Bauxite residue (red mud) increases phosphorus retention in sandy soil catchments in Western Australia. Fertil. Res. 1993, 34, 85–94. [Google Scholar] [CrossRef]
  43. Ho, G.E.; Mathew, K.; Gibbs, R.A. Nitrogen and phosphorus removal from sewage effluent in amended sand columns. Water Res. 1992, 26, 295–300. [Google Scholar] [CrossRef]
  44. Namasivayam, C.; Ranganathan, K. Treatment of dairy wastewater using waste red mud. Res. Ind. 1992, 37, 165–167. [Google Scholar]
  45. Zouboulis, A.I.; Kydros, K.A.; Matis, K.A. Removal of toxic metal ions from solutions using industrial solid byproducts. Water Sci. Technol. 1993, 27, 83–93. [Google Scholar] [CrossRef]
  46. Zouboulis, A.I.; Kydros, K.A. Use of red mud for toxic metals removal: The case of nickel. J. Chem. Technol. Biotechnol. 1993, 58, 95–101. [Google Scholar] [CrossRef]
  47. Martin, M.H. Heavy metals in the environment (trace metals in the environment, volume 1). Environ. Pollut. 1993, 80, 308–309. [Google Scholar] [CrossRef]
  48. Wanchao, L.; Jiakuan, Y.; Bo, X. Review on treatment and utilization of bauxite residues in China. Int. J. Miner. Process. 2009, 93, 220–231. [Google Scholar]
  49. Dobos, G.; Horvath, G.; Felfoldi, Z. Complex utilization of red mud including the production of pig iron. Trav. Com. Etude Bauxites Alum. Alum 1974, 12, 151–159. [Google Scholar]
  50. Grzymek, J.; Derdacka-Grzymek, A.; Konik, Z.; Grzymek, W. Method. In Light Metals 1982: Proceedings of technical sessions sponsored by the TMS Light Metals Committee at the 111th AIME annual meeting; Andersen, J.E., Ed.; Metallurgical Society of AIME: Warrendale, PA, USA, 1982; pp. 143–155. [Google Scholar]
  51. Leontev, L.I.; Kudinov, B.Z.; Derevyankin, V.A.; Kuznetov, S.I. Physical-chemical and technological foundations of complex processing of low grade bauxites and red muds utilizing rotary furnace. Trav. Com. Etude Bauxites Alum. Alum 1974, 12, 159–162. [Google Scholar]
  52. Guccione, E. Red mud’, a solid waste, can now be converted to high-quality steel. Eng. Min. J. 1971, 172, 136–138. [Google Scholar]
  53. Mombelli, D.; Di Cecca, C.; Mapelli, C.; Barella, S.; Bondi, E. Experimental analysis on the use of BF-sludge for the reduction of BOF-powders to direct reduced iron (DRI) production. Process Saf. Environ. Prot. 2016, 102, 410–420. [Google Scholar] [CrossRef]
  54. Sista, K.S.; Dwarapudi, S. Iron Powders from Steel Industry by-products: A Review. ISIJ Int. 2018, 58, 1–8. [Google Scholar] [CrossRef]
  55. Rath, S.S.; Rao, D.S.; Tripathy, S.K.; Biswal, S.K. Characterization vis-á-vis utilization of blast furnace flue dust in the roast reduction of banded iron ore. Process Saf. Environ. Prot. 2018, 117, 232–244. [Google Scholar] [CrossRef]
  56. Omran, M.; Fabritius, T. Utilization of blast furnace sludge for the removal of zinc from steelmaking dusts using microwave heating. Sep. Purif. Technol. 2019, 210, 867–884. [Google Scholar] [CrossRef]
  57. Mombelli, D.; Mapelli, C.; Barella, S.; Gruttadauria, A.; Spada, E. Jarosite wastes reduction through blast furnace sludges for cast iron production. J. Environ. Chem. Eng. 2019. [Google Scholar] [CrossRef]
  58. Mombelli, D.; Mapelii, C.; Di Cecca, C.; Barella, S.; Gruttadauria, A. Red mud reduction through blast furnace sludge for cast iron production. Metall. Ital. 2016, 108, 23–41. [Google Scholar]
  59. Duffy, J.A. Optical Basicity: A Practical Acid-Base Theory for Oxides and Oxyanions. J. Chem. Educ. 1996, 73, 1138. [Google Scholar] [CrossRef]
  60. Bordes-Richard, E.; Courtine, P. Optical basicity: A scale of acidity/basicity of solids and its application to oxidation catalysis. Met. Oxides Chem. Appl. 2006, 108, 319–352. [Google Scholar]
  61. Chirikure, S. Geochemistry of Ancient Metallurgy: Examples from Africa and Elsewhere. In Treatise on Geochemistry; Holland, H.D., Turekian, K.K., Eds.; Elsevier: Amsterdam, The Netherlands, 2014; pp. 169–189. [Google Scholar]
  62. Busè, R.; Mombelli, D.; Mapelli, C. Metals recovery from furnaces dust: Waelz process. La Metall. Ital. 2014, 106, 19–27. [Google Scholar]
  63. Ahmed, H.; Persson, A.; Sundqvist, L.; Biorkman, B. Energy Efficient Recycling of in-Plant Fines. Int. J. Environ. Ecol. Eng. 2014, 8, 522–528. [Google Scholar]
  64. Su, F.; Lampinen, H.-O.; Robinson, R. Recycling of Sludge and Dust to the BOF Converter by Cold Bonded Pelletizing. ISIJ Int. 2008, 44, 770–776. [Google Scholar] [CrossRef] [Green Version]
  65. Rao, Y.K. The kinetics of reduction of hematite by carbon. Metall. Trans. 1971, 2, 1439–1447. [Google Scholar] [CrossRef]
  66. Kaußen, F.; Friedrich, B. Reductive Smelting of Red Mud for Iron Recovery. ChemieIngenieurTechnik 2015, 87, 1535–1542. [Google Scholar] [CrossRef]
  67. Sosinsky, n.D.J.; Sommerville, I.D. The composition and temperature dependence of the sulfide capacity of metallurgical slags. Metall. Trans. B 1986, 17, 331–337. [Google Scholar] [CrossRef]
  68. Tong, Z.F.; Qiao, J.L.; Jiang, X.Y. Kinetics of Na2O evaporation from CaO–Al2O3–SiO2–MgO–TiO2–Na2O slags. Ironmak. Steelmak. 2017, 44, 237–245. [Google Scholar] [CrossRef]
  69. Hatakeyama, T.; Zhenhai, L. . Handbook of Thermal Analysis; John Wiley & Sons Ltd.: Chichester, UK, 1998; ISBN 978-0-471-98363-7. [Google Scholar]
  70. Sharp, Z.D.; Helffrich, G.R.; Bohlen, S.R.; Essene, E.J. The stability of sodalite in the system NaAlSiO4-NaCl. Geochim. Cosmochim. Acta 1989, 53, 1943–1954. [Google Scholar] [CrossRef] [Green Version]
  71. Turkdogan, E.T. Fundamentals of Steelmaking; Institute of Materials: London, UK, 1996; ISBN 9781861250049. [Google Scholar]
  72. Mombelli, D.; Mapelli, C.; Di Cecca, C.; Barella, S.; Gruttadauria, A.; Ragona, M.; Pisu, M.; Viola, A. Characterization of cast iron and slag produced by jarosite sludges reduction via Arc Transferred Plasma (ATP) reactor. J. Environ. Chem. Eng. 2018, 6, 773–783. [Google Scholar] [CrossRef]
  73. Mombelli, D.; Mapelli, C.; Barella, S.; Gruttadauria, A.; Le Saout, G.; Garcia-diaz, E. The efficiency of quartz addition on electric arc furnace ( EAF ) carbon steel slag stability. J. Hazard. Mater. 2014, 279, 586–596. [Google Scholar] [CrossRef] [PubMed]
  74. Mombelli, D.; Mapelli, C.; Barella, S.; Di Cecca, C.; Le Saout, G.; Garcia-Diaz, E. The effect of microstructure on the leaching behaviour of electric arc furnace (EAF) carbon steel slag. Process Saf. Environ. Prot. 2016, 102, 810–821. [Google Scholar] [CrossRef] [Green Version]
  75. NIST—National Institute of Standards and Technology Hematite (Fe2O3). Available online: https://webbook.nist.gov/cgi/cbook.cgi?ID=C1317608&Mask=2&Type=JANAFS&Plot=on#JANAFS (accessed on 4 November 2019).
  76. NIST—National Institute of Standards and Technology Carbon Monoxide. Available online: https://webbook.nist.gov/cgi/cbook.cgi?ID=C630080&Units=SI&Mask=1#Thermo-Gas (accessed on 4 November 2019).
  77. NIST—National Institute of Standards and Technology Iron. Available online: https://webbook.nist.gov/cgi/cbook.cgi?ID=C7439896&Units=SI&Mask=2#Thermo-Condensed (accessed on 4 November 2019).
  78. NIST—National Institute of Standards and Technology Methane. Available online: https://webbook.nist.gov/cgi/cbook.cgi?Name=methane&Units=SI (accessed on 4 November 2019).
  79. Bazzucchi, L. La Valutazione del Prezzo dello Smaltimento in Discarica dei Rifiuti Speciali; ISPRA -Istituto Superiore per la Protezione e la Ricerca Ambientale Cerca nel sito Ricerca: Roma, Italy, 2007. [Google Scholar]
  80. Ranocchia, C. I Prezzi Internazionali del Carbone Termico e Siderurgico. Available online: http://www.pricepedia.it/magazine/article/2019/04/17/i-prezzi-del-carbone/ (accessed on 5 November 2019).
  81. Camera di Commercio di Milano Metalli Ferrosi. Available online: https://st.ilsole24ore.com/finanza-e-mercati/indici-e-numeri.shtml?tabellacat=mercati-italia&idtabella=1509 (accessed on 5 November 2019).
Figure 1. Example of heat flow, thermogravimetry (TG) and first order derivate of thermogravimetry (dTG) curves for the sample with pure graphite (sample C2—0.85 C/Fe2O3) (a) and with blast furnace sludges (sample A3—1.18 C/Fe2O3) as reducing agent (b), argon atmosphere. Full line: heat flow; dash-dot line: TG; dotted line: dTG.
Applsci 09 04902 g001
Figure 2. Specific energy of the cast iron melting peak (a), total mass loss (b), temperature of the iron melting, (c) and transformation rate parameters (d) as a function of C/Fe2O3 ratio. Argon atmosphere.
Applsci 09 04902 g002
Figure 3. Example of heat flow, TG and dTG curves for the sample with pure graphite (sample C2—0.85 C/Fe2O3) (a) and example of heat flow, TG and dTG curves for the sample with blast furnace sludges (sample A3—1.18 C/Fe2O3) as reducing agent (b). Air atmosphere. Full line: heat flow; dash-dot line: TG; dotted line: dTG.
Applsci 09 04902 g003
Figure 4. Comparison of the calculated and measured mass loss (a), specific energy of CO/CO2 formation peak (b), total mass loss (c), and peak temperature of the C combustion (d) as a function of C/Fe2O3 ratio. Air atmosphere.
Applsci 09 04902 g004
Figure 5. Overview of some of the samples obtained after reduction in a muffle furnace.
Applsci 09 04902 g005
Figure 6. Stereo microscope images of the sample reduced through graphite (C2) at (a) 1200 °C; (b) 1500 °C and blast furnace sludges (A2) (c) 1200 °C; (d) 1500 °C.
Applsci 09 04902 g006
Figure 7. Computed versus measured metallic fraction at 1500 ° C (a), metallic fraction (b), residual C (c), metallization degree (d) as a function of C/Fe2O3 ratio.
Applsci 09 04902 g007
Figure 8. Computed versus measured mass loss at 1500 °C (a), metal-to-charge ratio as a function of C/Fe2O3 ratio (b).
Applsci 09 04902 g008
Figure 9. Compositional map for the slag obtained after reduction at 1500 °C: (a) sample C2 and (b) sample A2.
Applsci 09 04902 g009
Table 1. ED-XRF chemical composition of the red muds before and after calcining (% by weight). Red mud (RM).
Fe2O3Al2O3Na2OSiO2CaOTiO2CSO3ZnOClZrO2MgOP2O5PbOCr2O3V2O5K2OMnOLOI
Fresh RM20.8916.3010.399.805.545.204.010.300.300.270.240.150.150.140.120.100.080.0529.78
Calcined RM28.2621.0513.4415.697.697.260.020.370.460.390.310.220.200.310.170.130.100.073.78
Table 2. ED-XRF chemical composition of the blast furnace sludges used as reducing agent (% by weight).
MgOAl2O3SiO2P2O5SClK2OCaOTiO2V2O5Cr2O3MnOFe2O3ZnOPbONa2OC
0.742.628.090.140.640.090.913.600.130.010.010.1230.292.082.321.1348.9
Table 3. Chemical composition of the lime used as a flux agent (% by weight).
CaOMgOC as CO2S as SO3SiO2 + Fe2O3 + Al2O3LOI
96.780.460.210.152.011.15
Table 4. Chemical composition (% weight), C/Fe2O3 ratio, and basicity indexes of red mud/reducing agent mixes. BBI = Binary Basicity Index, CBI = Complex Basicity Index, OB = Optical Basicity.
MixesSample IDRM (% wt.)C Added (% wt.)CaO Lime (% wt.)C/Fe2O3BBICBIOB
15% C + 0.3% CaOC184.7512.712.540.510.670.550.68
25% C + 0.3% CaOC278.1319.532.340.850.670.550.68
35% C + 0.3% CaOC372.4625.362.171.190.670.550.67
45% C + 0.3% CaOC467.5730.412.031.530.670.550.67
25% C + 0.3% CaOA251.2846.152.560.840.690.570.67
35% C + 0.3% CaOA334.8462.722.441.180.700.590.66
Table 5. SEM-EDS general chemical composition of some samples of obtained cast iron (% by weight) and microhardness value of the perlitic matrix.
SampleSiSVCrFe
C10.48 0.450.4898.59
C20.59 0.460.4698.48
C30.75 0.530.4398.29
A20.67 99.33
A30.820.66 98.52
Table 6. Economical evaluation of the proposed process based on the treatment of 1 t of dried red mud. Blast furnace (B.F.).
ScenarioSampleMoist RM
[t]
B.F. Sludges
[t]
Coke
[t]
Lime
[t]
Cast Iron
[t]
Transportation Costs
[€]
Raw Material Costs
[€]
B.F. Dumping Costs
[€]
Costs Saving
[€]
Revenues
[€]
Margin
[€]
1aC21.250.000.250.0030.1812542.77190029−329
A21.251.000.000.0030.391250.27019063128
1bC21.250.000.250.0030.18−12542.77190029−79
A21.251.000.000.0030.39−1250.27019063378
2aC21.250.000.250.0030.1812542.770029−139
A21.251.000.000.0030.392250.270063−162
2bC21.250.000.250.0030.18−12542.770029111
A21.251.000.000.0030.39−2250.270063288
3aC21.250.000.250.0030.18042.770029−14
A21.251.000.000.0030.391000.270063−37
3bC21.250.000.250.0030.18042.770029−14
A21.251.000.000.0030.39−1000.270063163
1a: RM recovery at integrated steel shop, paying for transportation
b: RM recovery at integrated steel shop, being paid for transportation
2a: RM recovery at third company paying for transportation
b: RM recovery at third company, being paid for transportation
3a: RM recovery at alumina refinery, paying for transportation
b: RM recovery at alumina refinery, being pad for transportation

