Article

Colorimetric Technique for Antimony Detection Based on the Use of Gold Nanoparticles Conjugated with Poly-A Oligonucleotide

by
Anna N. Berlina
1,
Nadezhda S. Komova
1,
Anatoly V. Zherdev
1,
Mulayam S. Gaur
2 and
Boris B. Dzantiev
1,*
1
A.N. Bach Institute of Biochemistry, Research Center of Biotechnology of the Russian Academy of Sciences, Leninsky prospect 33, 119071 Moscow, Russia
2
Department of Physics, Hindustan College of Science and Technology, Distt.: Mathura U.P., Farah 281122, India
*
Author to whom correspondence should be addressed.
Appl. Sci. 2019, 9(22), 4782; https://doi.org/10.3390/app9224782
Submission received: 1 October 2019 / Revised: 31 October 2019 / Accepted: 6 November 2019 / Published: 8 November 2019

Abstract

:
A simple and rapid positive–negative colorimetric approach to determine the presence of antimony ions based on the use of gold nanoparticles conjugated with oligonucleotide (poly-A sequence) is developed. Colorimetric measurements reveal that the aggregates of modified gold nanoparticles were afforded after adding antimony ions, thus changing the solution color from pink to blue. The results of aptamer’s interaction on the gold nanoparticle surface with the target analyte can be detected either by photometry or by the naked eye. The realized assay provides rapid (2 min), sensitive (detection limit 10 ng/mL), specific, and precise (variation coefficient less than 3.8%) detection of antimony (III) in drinking water.

Graphical Abstract

1. Introduction

Heavy metals are a class of highly toxic pollutants that can affect human health and the environment. Antimony pollution is of increasing interest because of its wide use in various industries including semiconducting [1]. Normally, antimony occurs in different forms in environmental water as a result of the oxidation of sulfide minerals and dissolution by water [2]. Its biological function, permissible levels, and mechanisms of interaction with biological materials remain poorly understood. To answer these questions, Filella et al. showed its binding by iron oxide phases [3]. In this case, compounds of antimony have a valency of 5. Due to rock disruptions and increased consumption by industry, antimony can be easily emitted into the environment [4]. Antimony basically occurs as Sb2S3 and Sb2O3 compounds [3]. Sb3+ is more toxic than Sb5+, and Sb can form bonds with methylated and other organic compounds [5].
The importance of antimony detection is confirmed by the fact that the U.S. Environmental Protection Agency (EPA) regards it a priority pollutant, and the Council of the European Communities [6] established the maximum permissible concentration of antimony in waters at 0.01 mg/L. However, the task of widespread monitoring of antimony is not yet solved. High-performance liquid chromatography [7], electrothermal atomic absorption spectrometry [8,9,10], atomic fluorescence spectroscopy [8], anodic stripping voltammetry [11,12], and multi-syringe flow injection analysis with hydride generation-atomic fluorescence detection [13] are currently the main methods for Sb3+ detection. However, the listed approaches require expensive equipment, highly qualified workers, and can be implemented only in a limited amount of laboratories.
Currently, a range of easy and cheap colorimetric techniques has been proposed to determine the presence of antimony [7,14,15,16,17]. The first technique was based on antimony hydride generation and its detection by UV-spectrophotometry [7]. Various indicator dyes, such as pyrogallol red [15], pyridine-2,6-dicarboxylic acid [18], brilliant green, malachite green and crystal violet [16,19], and bromopyrogallol red [16], are traditionally used for these assays. These dyes are used due to their property of form-colored complexes with target antimony ions [15] with followed assessment of absorbance. The developed colorimetric techniques are based on complexation of antimony with organic molecules, allowing the colored product to be detected spectrophotometrically.
Alternatively, the colorimetric approaches based on modified gold nanoparticles (GNPs) are widely applied due to their unique optical properties [20]. Aggregation of GNPs modified with receptor molecules after the addition of metal ions can change the original color of GNPs from red to blue [21,22,23]. However, selective induction of the aggregation should be based on specific recognition of the target metal ion. Increasing the selectivity of this method can be achieved by modifying the GNPs’ surface using an aptamer poly-A oligonucleotide (PAO). Aptamers are oligonucleotide receptors that can react with the target molecule with high affinity and selectivity. A number of aptamers have been used to detect heavy metal ions [24], such as Hg2+ [25], Pb2+ [26], Cd2+ [27], Ag+ [28], and As3+ [29]. The majority of these solutions are based on a heterogeneous interaction on solid surfaces and therefore require additional equipment to detect induced changes [30]. Carrying out the reaction in a homogeneous medium with visually observed changes is an undoubted advantage. The aggregation of aptamer-modified GNPs after adding a target analyte allowed rapid color change. To the best of our knowledge, there has been no research on aptamer application for Sb3+ detection. The study presents the first homogeneous colorimetric Sb3+ н assay based on aptamer-modified GNPs.

2. Materials and Methods

2.1. Chemicals

The aqueous solutions of Sb3+, Zn2+, Fe3+, Cu2+, Ag+, and Sn4+ were obtained from LLC “Center of standardization of samples and high-purity substances” (2K-1, St. Petersburg, Russia) and used as stock solutions. Gold chloride was supplied by Fluka (St. Louis, MO, USA). Sodium citrate, tris(hydroxymethyl)aminomethane (Tris) and bovine serum albumin were purchased from Sigma-Aldrich (St. Louis, MO, USA). The (SH-C6)AA-AAA-AAA-AA oligonucleotide was synthesized by Syntol (Moscow, Russia). Milli-Q water was filtered with the use of a Millipore machine (Millipore, Bedford, MA; 18.5 MΩ·cm at 22 °C) and applied to prepare all the solutions in this study.

2.2. Instruments and Measurements

The shaker Intelli-Mixer (ELMI, Riga, Latvia) was used for conjugate synthesis. Absorption spectra of GNPs and their conjugates with PAO were measured by Biochrom Libra S80 spectrophotometer (Biochrom, Cambridge, UK). The morphology of GNPs was characterized by transmission electron microscopy (TEM) using microscope model JEM CX-100 (Jeol, Japan). Dynamic light scattering (DLS) measurements were implemented using a Malvern Zetasizer Nano (Malvern, UK).

2.3. Preparation of Gold Nanoparticles

The 30 mn spherical GNPs were synthesized by citrate reduction of HAuCl4 solution based on [31] with modifications. A quantity of 1.5 mL of 1% sodium citrate was rapidly added to 97.5 mL of boiling deionized water containing 0.2 mL of 5% HAuCl4 solution and kept boiling for 25 min. Then, the mixture was cooled to room temperature and stored at 4–6 °C in liquid form. The concentration of synthesized GNPs was 1,66169E+11 particles in 1 mL of sol.

2.4. Preparation of poly-A Oligonucleotide Immobilized GNPs

Although freshly prepared gold nanoparticles can be stored for at least 3 months without loss of stability, it is preferable to conjugate them with proteins or oligonucleotide sequences within 2 weeks of the synthesis. The conjugation technique was based on [32] with modifications. The pH of the obtained GNPs was adjusted to 8.5 using 1 M NaOH. Then, 30 μL of PAO solution (with the initial concentration of 100 μM) was added to 1 mL of GNPs. After 10 h incubation at room temperature (RT) under stirring with the Intelli-Mixer, 30 μL of 100 mM phosphate buffer (pH 7.5) containing 700 mM NaCl was added drop-by-drop and left stirring for 24 h under the same conditions. Then, 10 µL of 10% BSA (water solution) was added to stabilize the conjugate and left for 1 h at RT. The obtained GNPs–PAO conjugate was purified from unreacted oligonucleotides by threefold centrifugation at 9500 g and +4 °C for 15 min. The supernatant contained an excess amount of oligonucleotide, stabilizing protein was removed, and the resulting pellet was re-dispersed in 25 mM Tris-HCl buffer (pH 7.8) with 300 mM NaCl and stored at +4 °C in liquid form. Conjugates are stable one year after the synthesis.

2.5. Characterization of Native Gold Nanoparticles and Poly-A Oligonucleotide Immobilized GNPs

The characterization of native and modified gold nanoparticles was provided by TEM and DLS. Native and conjugated nanoparticle suspensions were applied to 300-mesh grids (Pelco International, Redding, CA, USA) coated with a support film of polyvinyl formal deposited from chloroform. A JEM CX-100 electron microscope (JEOL, Tokyo, Japan) operating at 80 kV was used to obtain the microphotographs. The digital images were analyzed using Image Tool software (University of Texas Health Science Center, San Antonio, TX, USA). To analyze nanoparticles, 7 µL of suspension with optical density 1.0 was dropped on the grid surface.
Dynamic light scattering of gold nanoparticles–aptamer conjugate and freshly synthesized gold nanoparticles was provided using a Malvern Zetasizer Nano (Malvern, UK). Statistical data processing was performed using the software Malvern software version 7.11 (Malvern, UK). Size determination of native particles and conjugates was performed in the range from 0.3 nm to 10 μm using NIBS technology. For this purpose, 200 µL Milli-Q water was mixed with 10 µL of native/conjugated gold nanoparticles and transferred to the tube for DLS technique. GNP–PAOs and GNPs were analyzed in a mixture of water containing antimony in the same way.

2.6. Colorimetric Assay of Antimony

The detection of Sb3+ was performed at RT. Various concentrations (0.5–1000 ng/mL) of Sb3+ were prepared using serial dilution of the stock solution. A quantity of 2.5 μL of GNP–PAO solution was added to 50 μL of the Sb3+ solutions. The color change and the absorbance at 620 nm were measured immediately and the result was obtained after 2 min (due to the speed of scanning).
To determine the assay’s selectivity, it was applied to solutions of other ions, including alkali (Na+, K+, Li+, and Cs+), earth alkali (Mg2+, Ca2+, Sr2+, and Ba2+), transition (Mo2+, Mn2+, Fe3+, Co2+, Ag+, Cd2+, Cu2+, Zn2+, Hg2+, Ni2+, and Cr3+), and post-transition (Al3+, Sn4+, and Pb2+) metals; metalloids (As3+ and Sb3+); and lanthanides (La3+). Some anions were also tested as they are often present in environmental and mineral waters (Cl, NO3, and SO42−).
The tested drinking water samples were purchased from the local market and analyzed in the same way. These samples were spiked with antimony (III) stock solution to make positive samples for analysis with known ion concentrations.

3. Results and Discussion

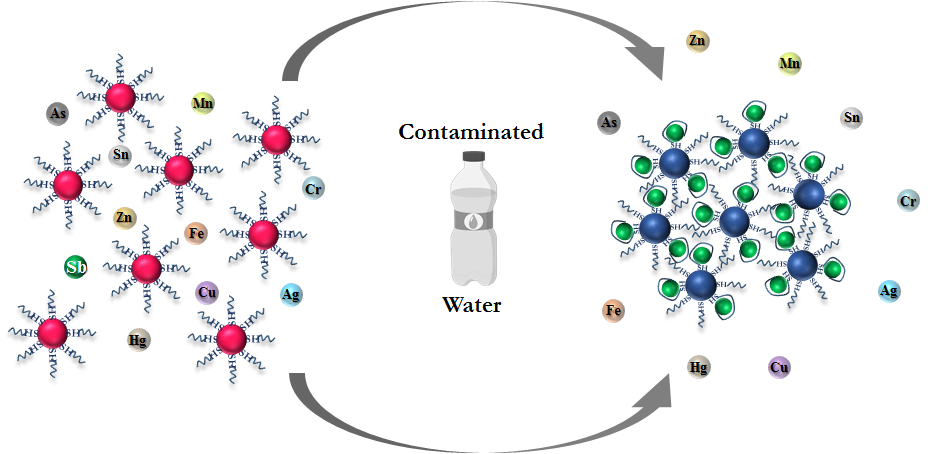
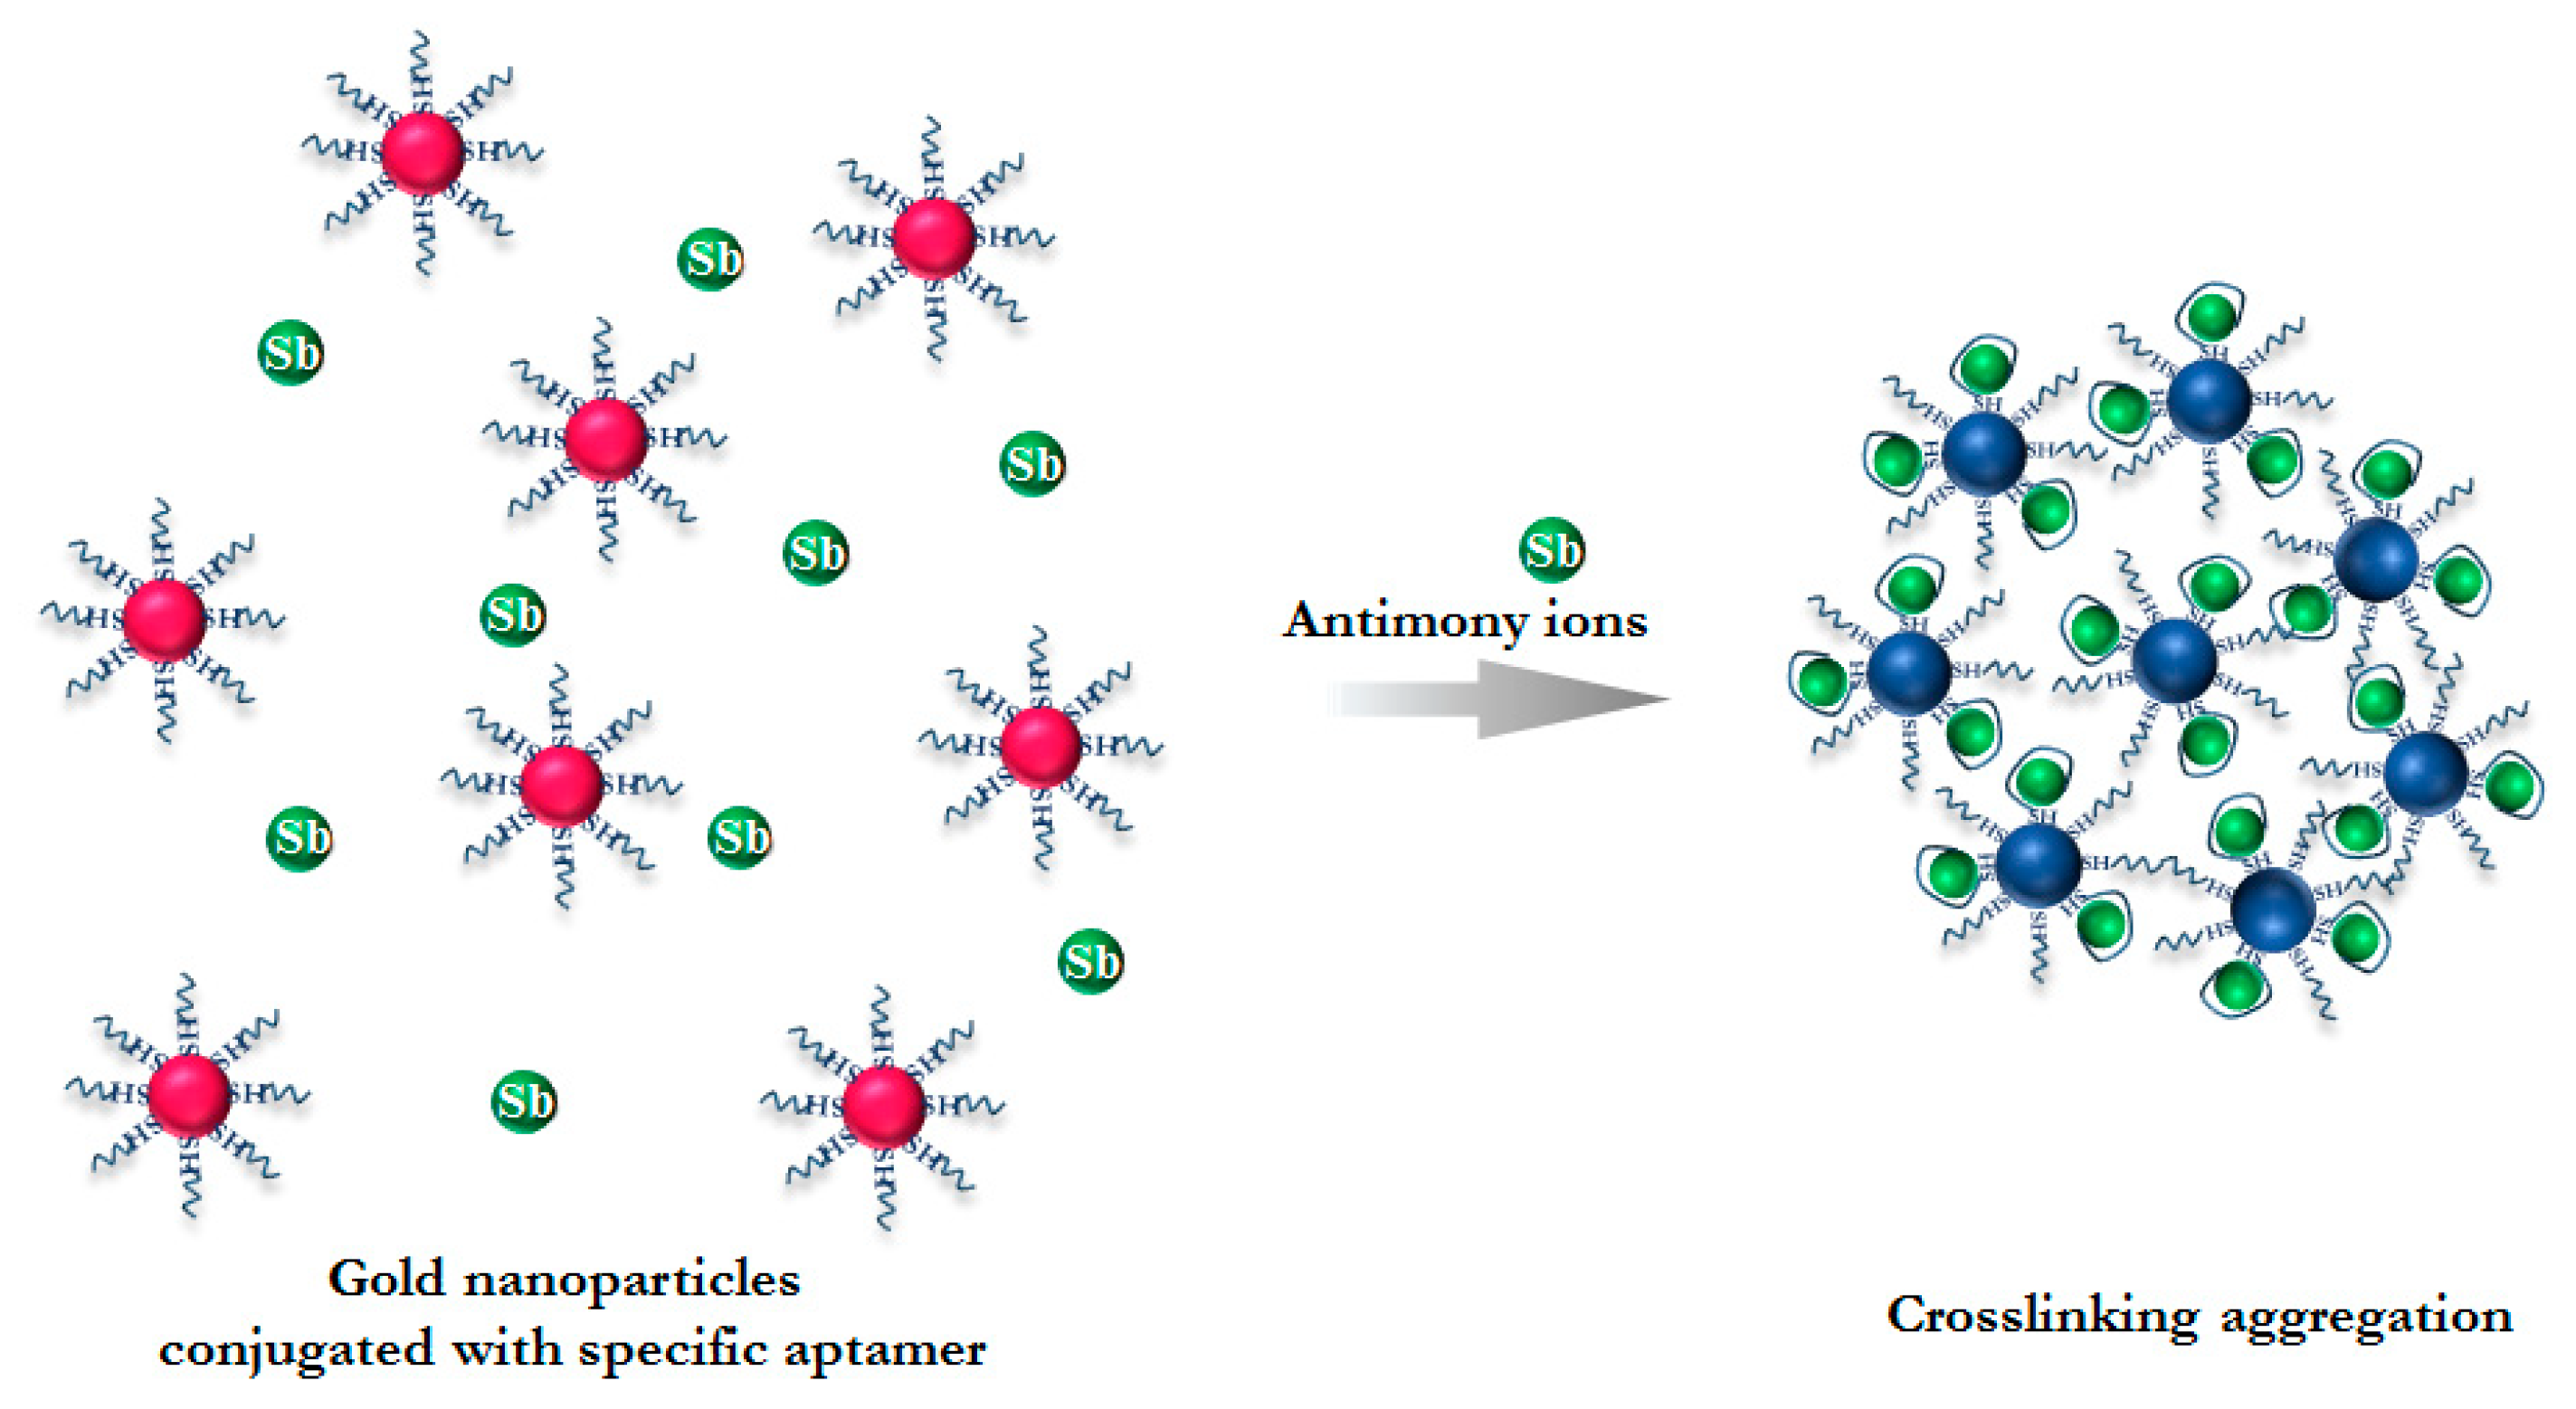
3.1. Principle of Antimony Detection

To determine the presence of Sb3+ ions, the thiolated PAO was conjugated with GNPs via the strong Au–S bond. In the absence of Sb3+ ions, the PAO-modified GNPs dispersed well in the solution due to their stability. Some authors suppose that the aptamer-stabilizing GNPs are in the coil state before meeting a target [33]. When added Sb3+ binds specifically with the aptamer, the PAO–GNP switches from a dispersed state to an aggregated state with a substantial change in the absorption spectra (Figure 1).
The poly-A sequence was used because of its particular reaction with ions as revealed in preliminary results. The interactions of poly-A oligonucleotide with a variety of ions (Hg2+, Pb2+, As3+, Sr+, Cd2+, Ba2+, Co2+, and Mo2+) as standard solutions and salts MgSO4, NH4VO3, CsCl, Li2SO4, Na3VO4, CrCl3, Bi(OH)2NO3, Na2WO4, (CH3COO)2Ni, CaCl2, and La(NO3)3 of chemical purity dissolved in 0.1 M HNO3 were tested. The technique used for choosing a target for selective analysis is described in Materials and Methods. GNPs modified with poly-A DNA were mixed with solutions of the ions of interest and changes in optical density were measured. Observed color changes indicated the sensitivity of the chosen oligonucleotide to the detected ions. The experiments revealed a high specificity with respect to Sb3+ at a low concentration (10 ng/mL). The simple and quick interaction achieved with the use of GNPs modified with PAO also provided optimal sensitivity in ion determination. A complete list of ion interactions with the oligonucleotide sequence is presented below in Section 3.4.

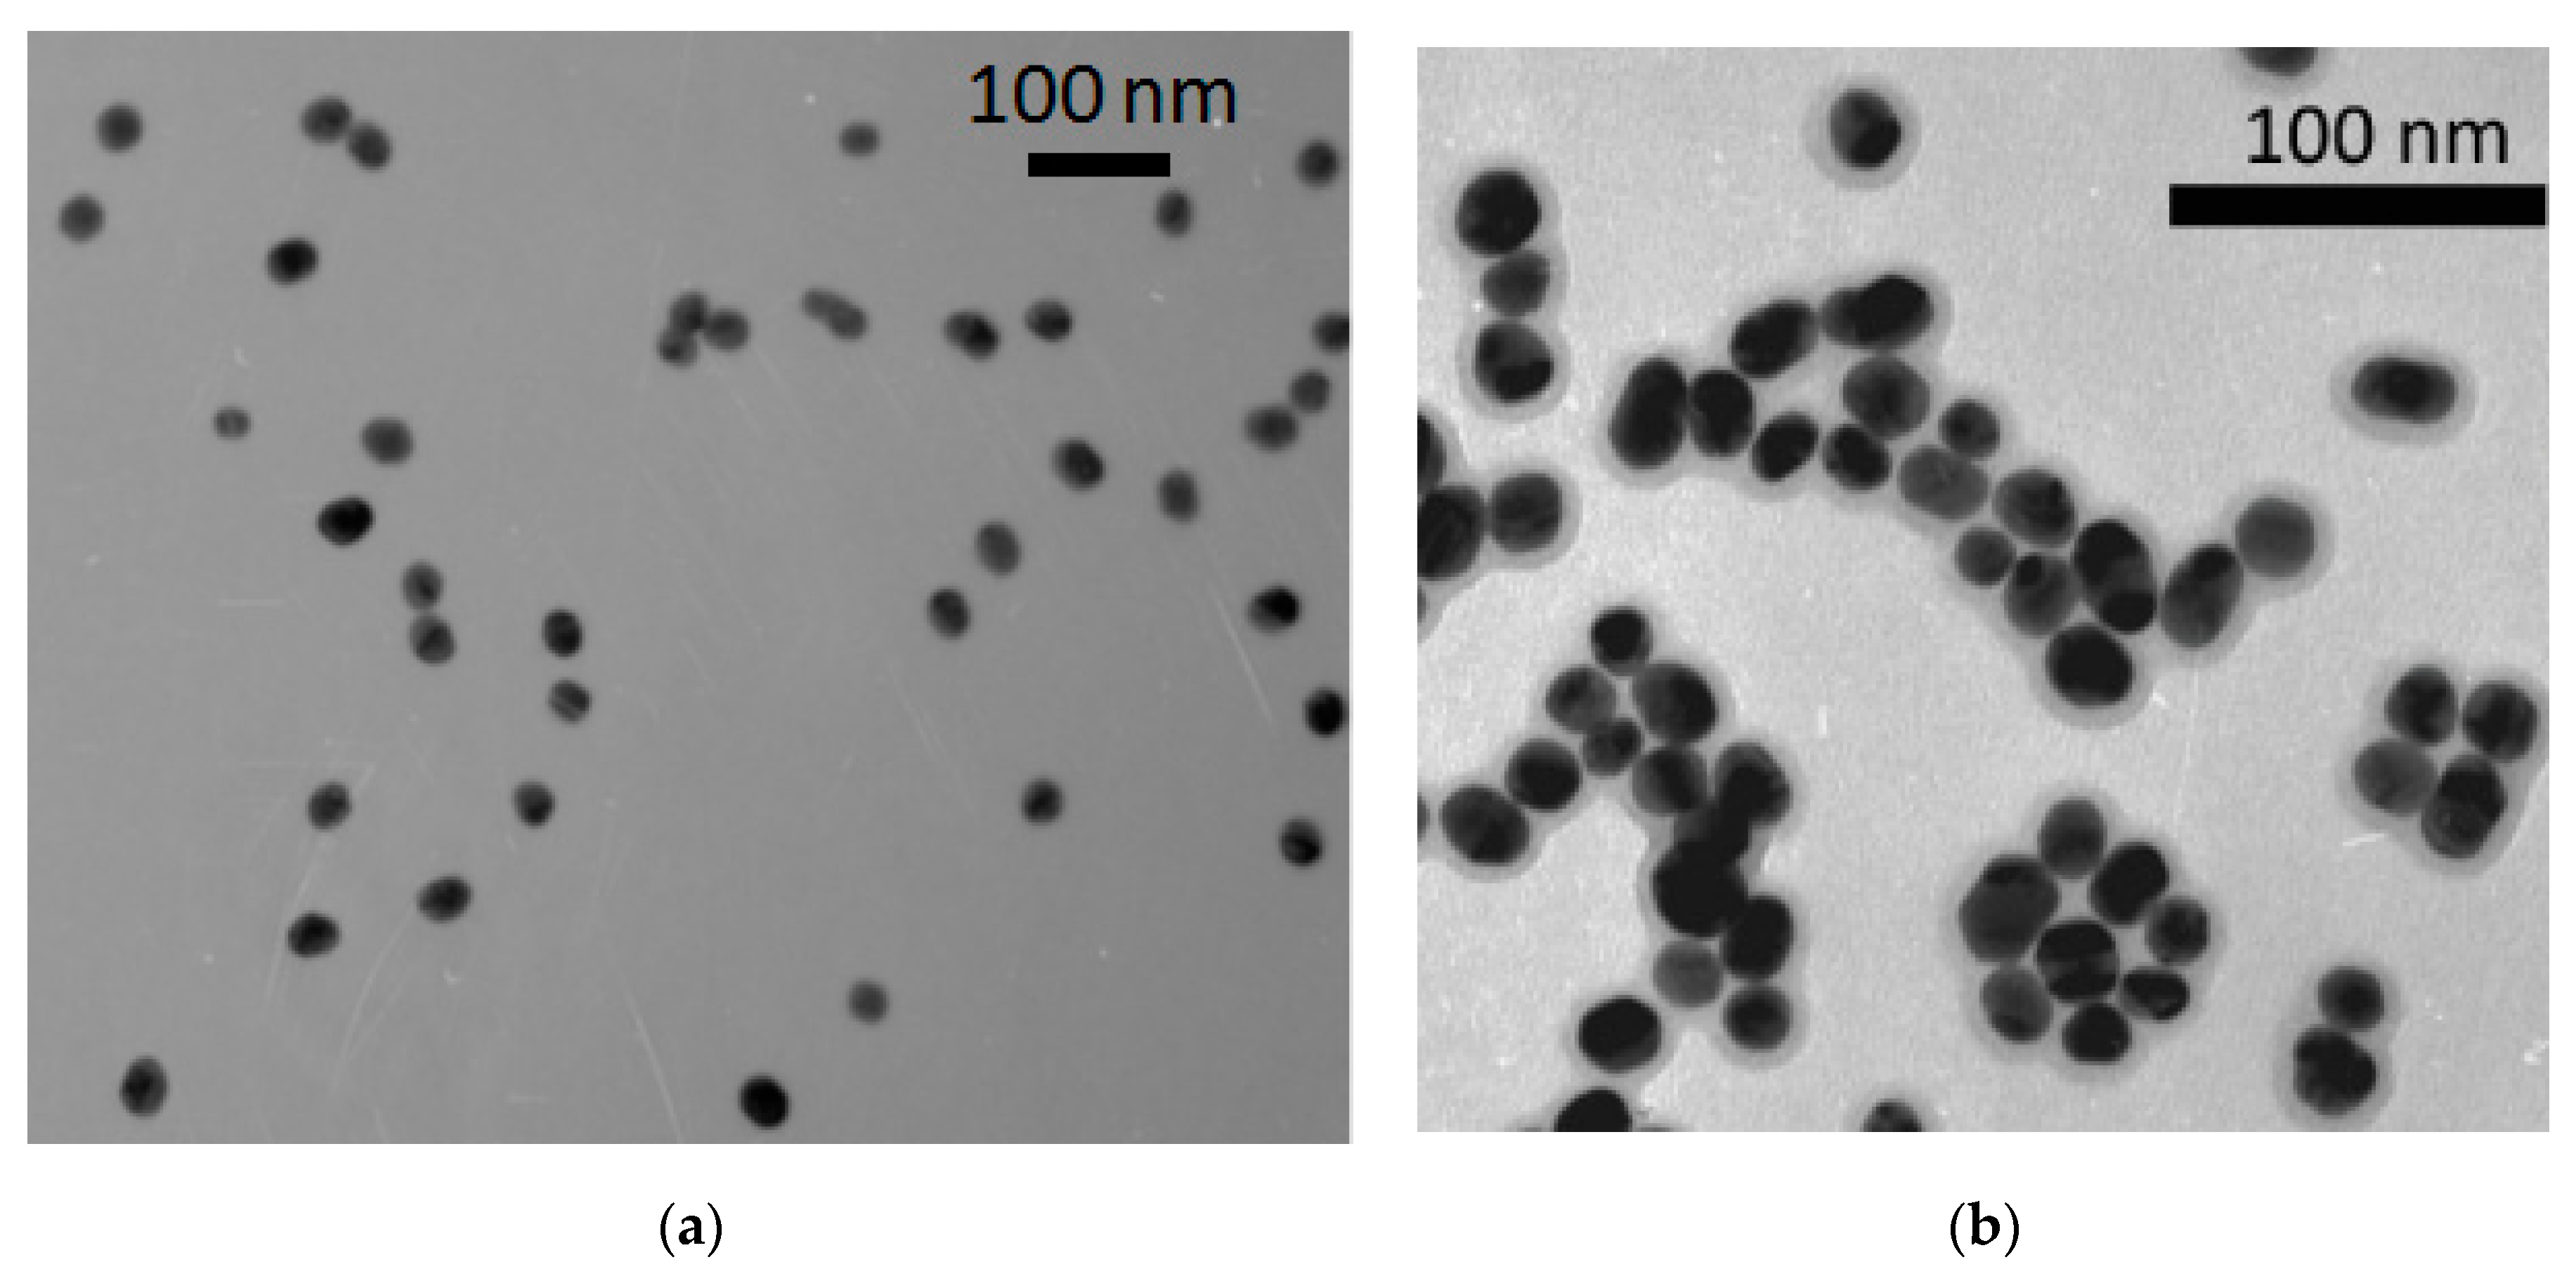
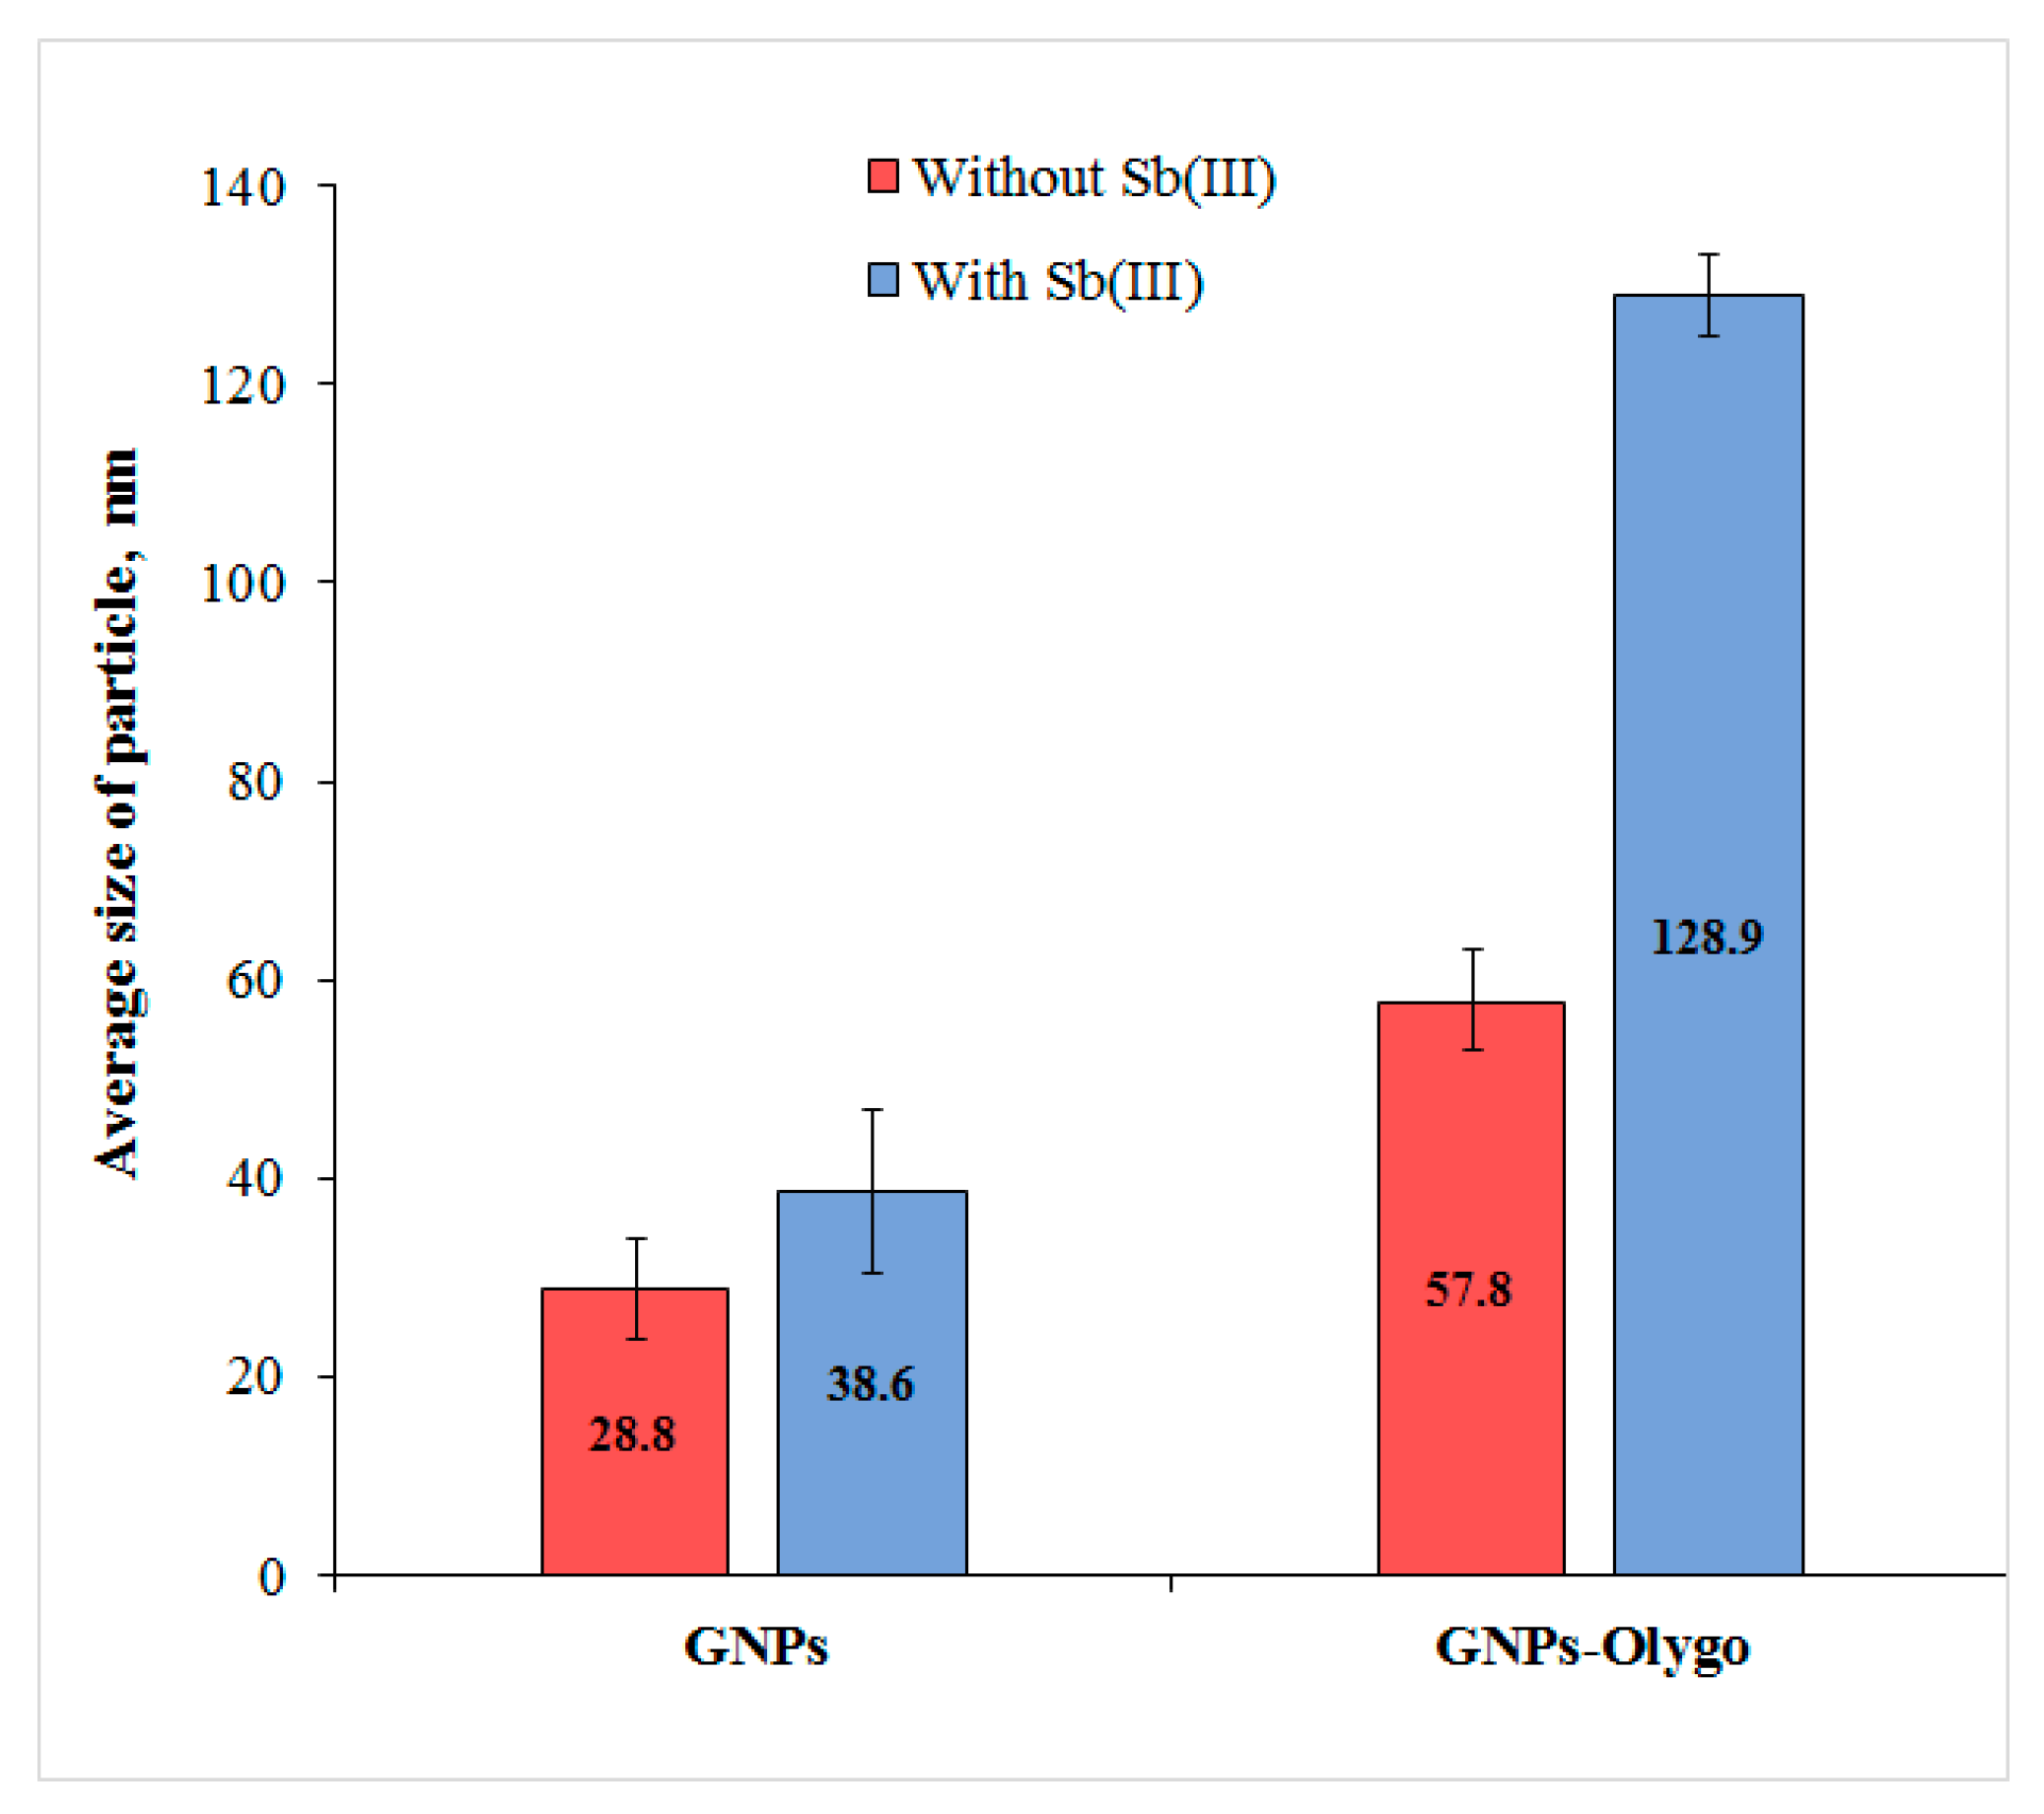
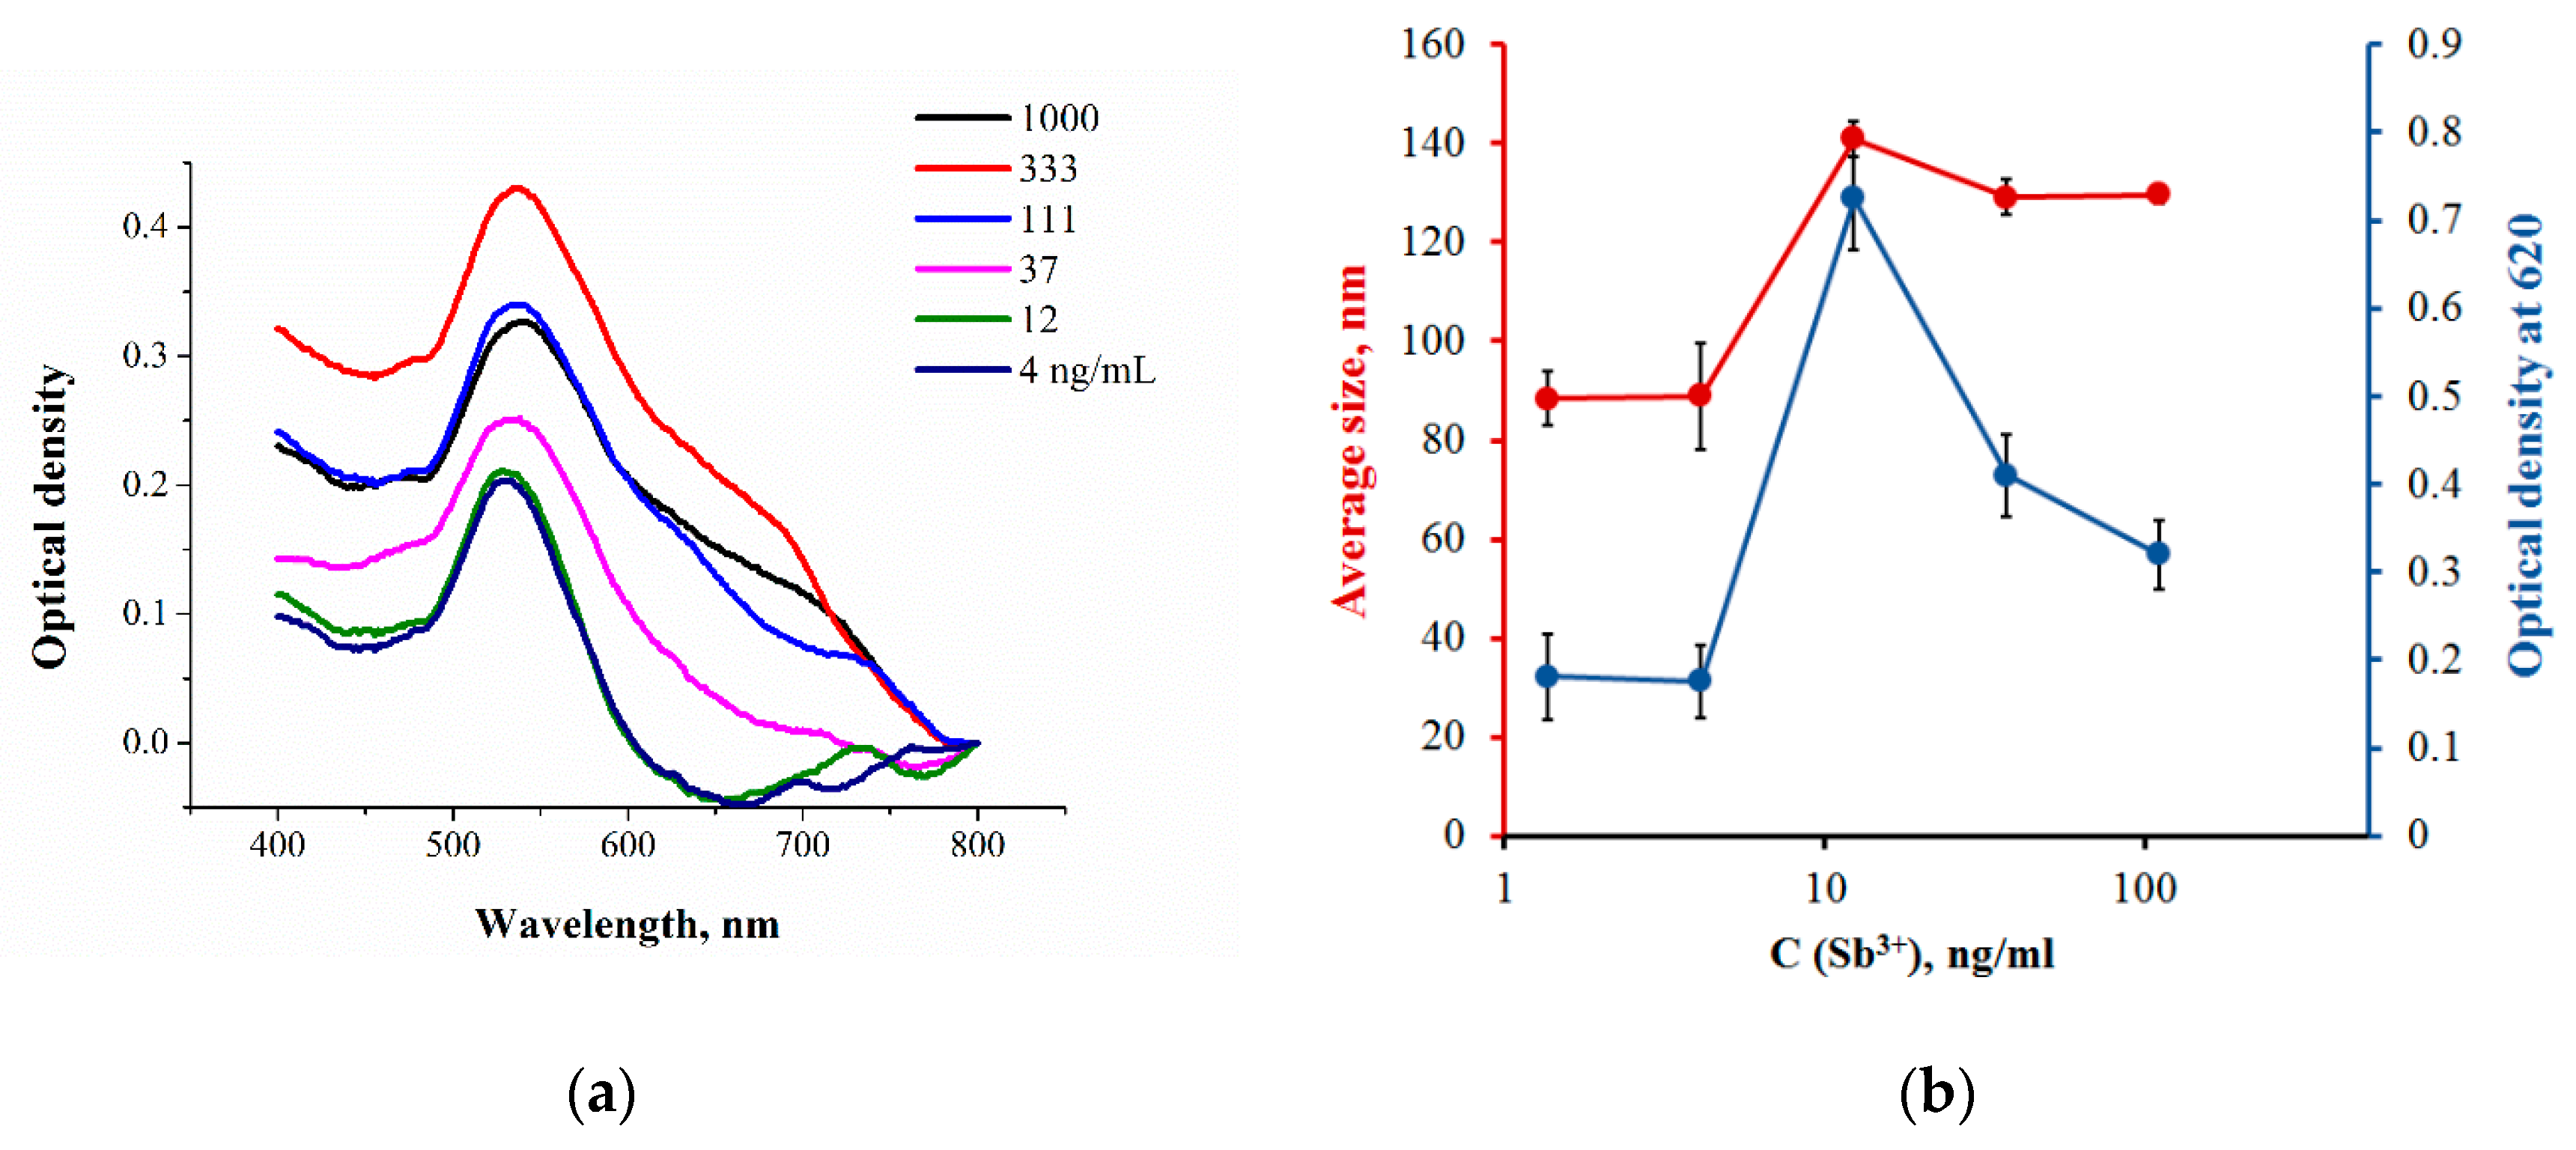
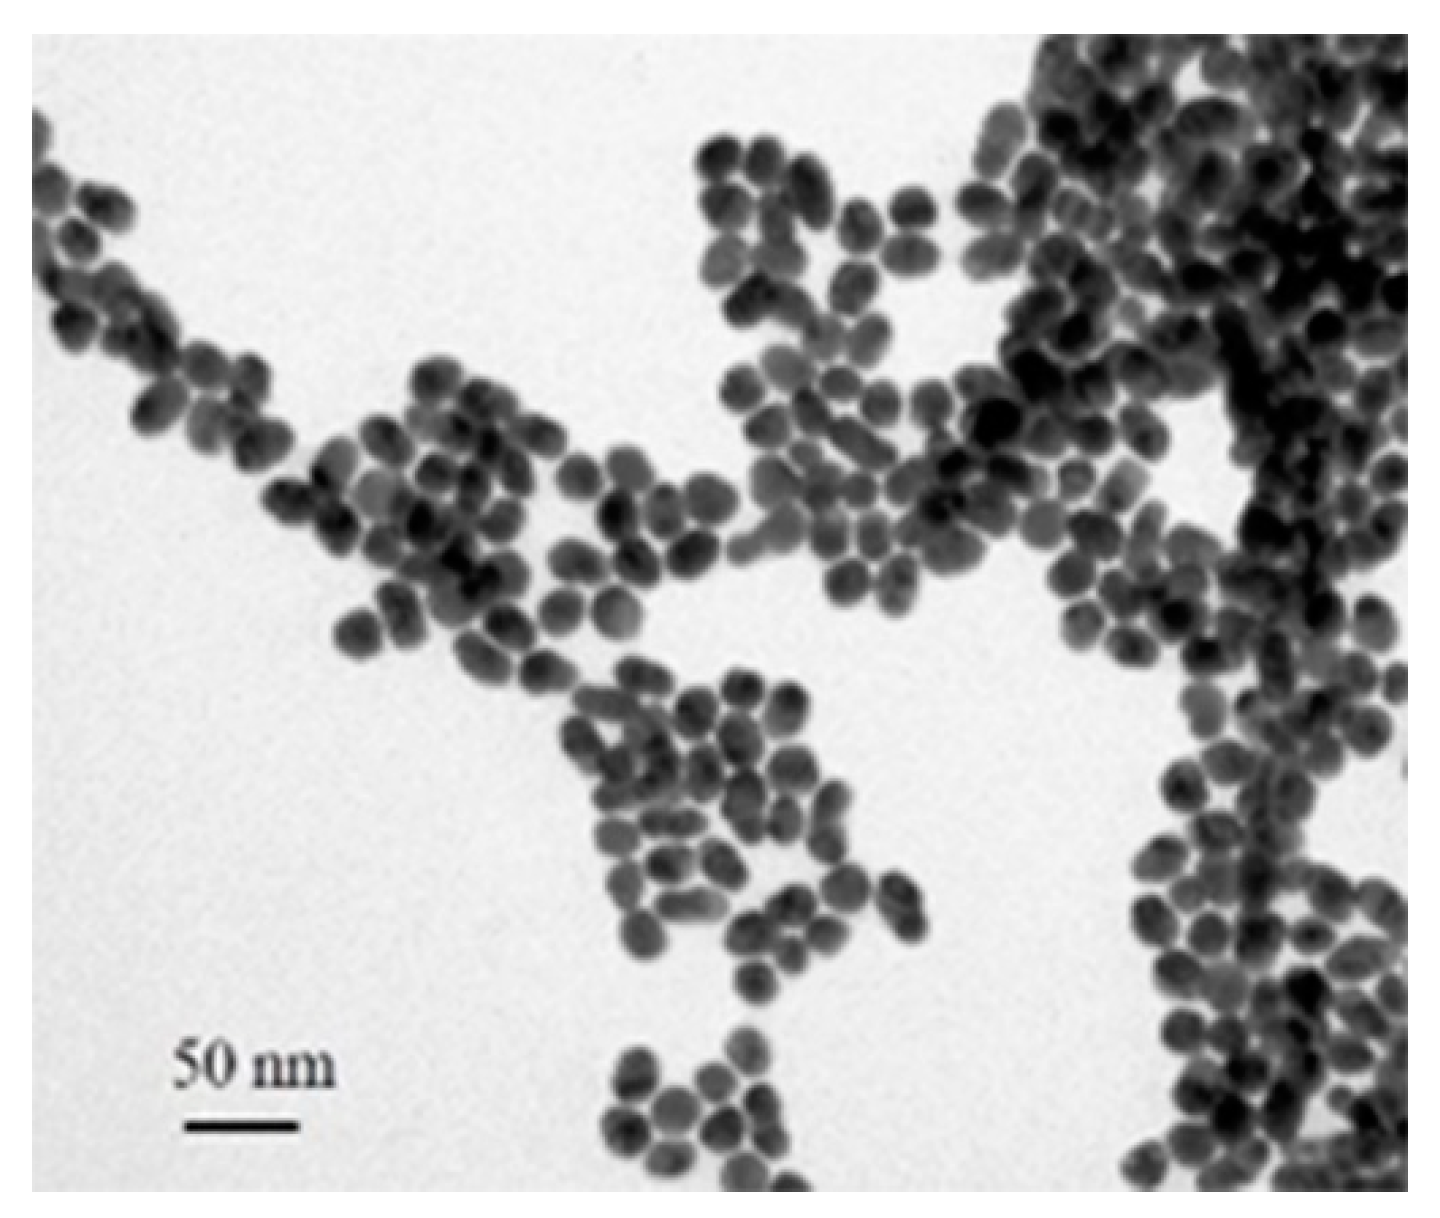
3.2. Characterization of PAO–GNPs Conjugate

Conjugation of GNPs was provided with the use of 3 µM of PAO. This concentration was chosen in accordance with our previous study [21] to stabilize GNPs. The prepared native and PAO-modified GNPs were characterized by absorbance spectroscopy and TEM (Figure 2). Maximal absorption for native GNPs was at 525 nm, which corresponds to the GNPs at around 30 nm in diameter [34]. With the abovementioned techniques, we estimated that the average diameter was 27.3 ± 5.7 nm, confirmed by TEM. For this analysis, 127 particles were counted. The same value for GNP–PAOs was 29.7 ± 1.6 nm (TEM). The difference between the average sizes determined by these techniques could be explained by the drying of the oligonucleotide hydrophilic layer on GNP–PAOs allocated to the mesh grid before TEM. Michen et al. [35] studied similar effects when preparing GNPs stabilized with bovine serum albumin. In our research, oligonucleotides of small size (around 5 kDa) were used to modify GNPs, whereby a hydrophilic layer formed due to the presence of hydrophilic groups of adenine. Moreover, GNPs and PAO were conjugated in a buffer with a high ionic strength, which caused linear conformation of the oligonucleotide and necessary stabilization of the GNPs [36]. According to the modeling and experimental work of Michen et al. [35], the difference in the size of the modified nanoparticles is due to differences in the environment when analyzing dissolved (DLS) and dried (TEM) preparations.
Characterization of gold nanoparticles modified with PAO as well as native GNPs was provided by DLS technique. To show the impact of the oligonucleotide sequence, nanoparticles were added to the water solution with a known concentration of antimony (III), and all the samples were then measured in three replicates. Unmodified GNPs showed no sufficient increase in size before (28.8 ± 5.0 nm) and after (38.6 ± 8.2 nm) the addition of antimony ions (Figure 3). This indicates that in the absence of surface modification, interaction did not take place. Contrary to this result, the presence of the oligonucleotide sequence on the gold surface leads to the formation of complexes detected by this technique. Thus, modification of GNPs by PAO led to an increase in the diameter of a carrier to 57.8 ± 5.3 nm compared to freshly synthesized nanoparticles (28.8 ± 5.0 nm). The addition of antimony (III) to the reaction media led to an increase in the average diameter due to the formation of aggregates (128.9 ± 4.2 nm). This difference indirectly confirms the contribution of the oligonucleotide sequence to the interaction with antimony (III) ions and demonstrates the possibility of applying this type of modification for the detection of target ions.

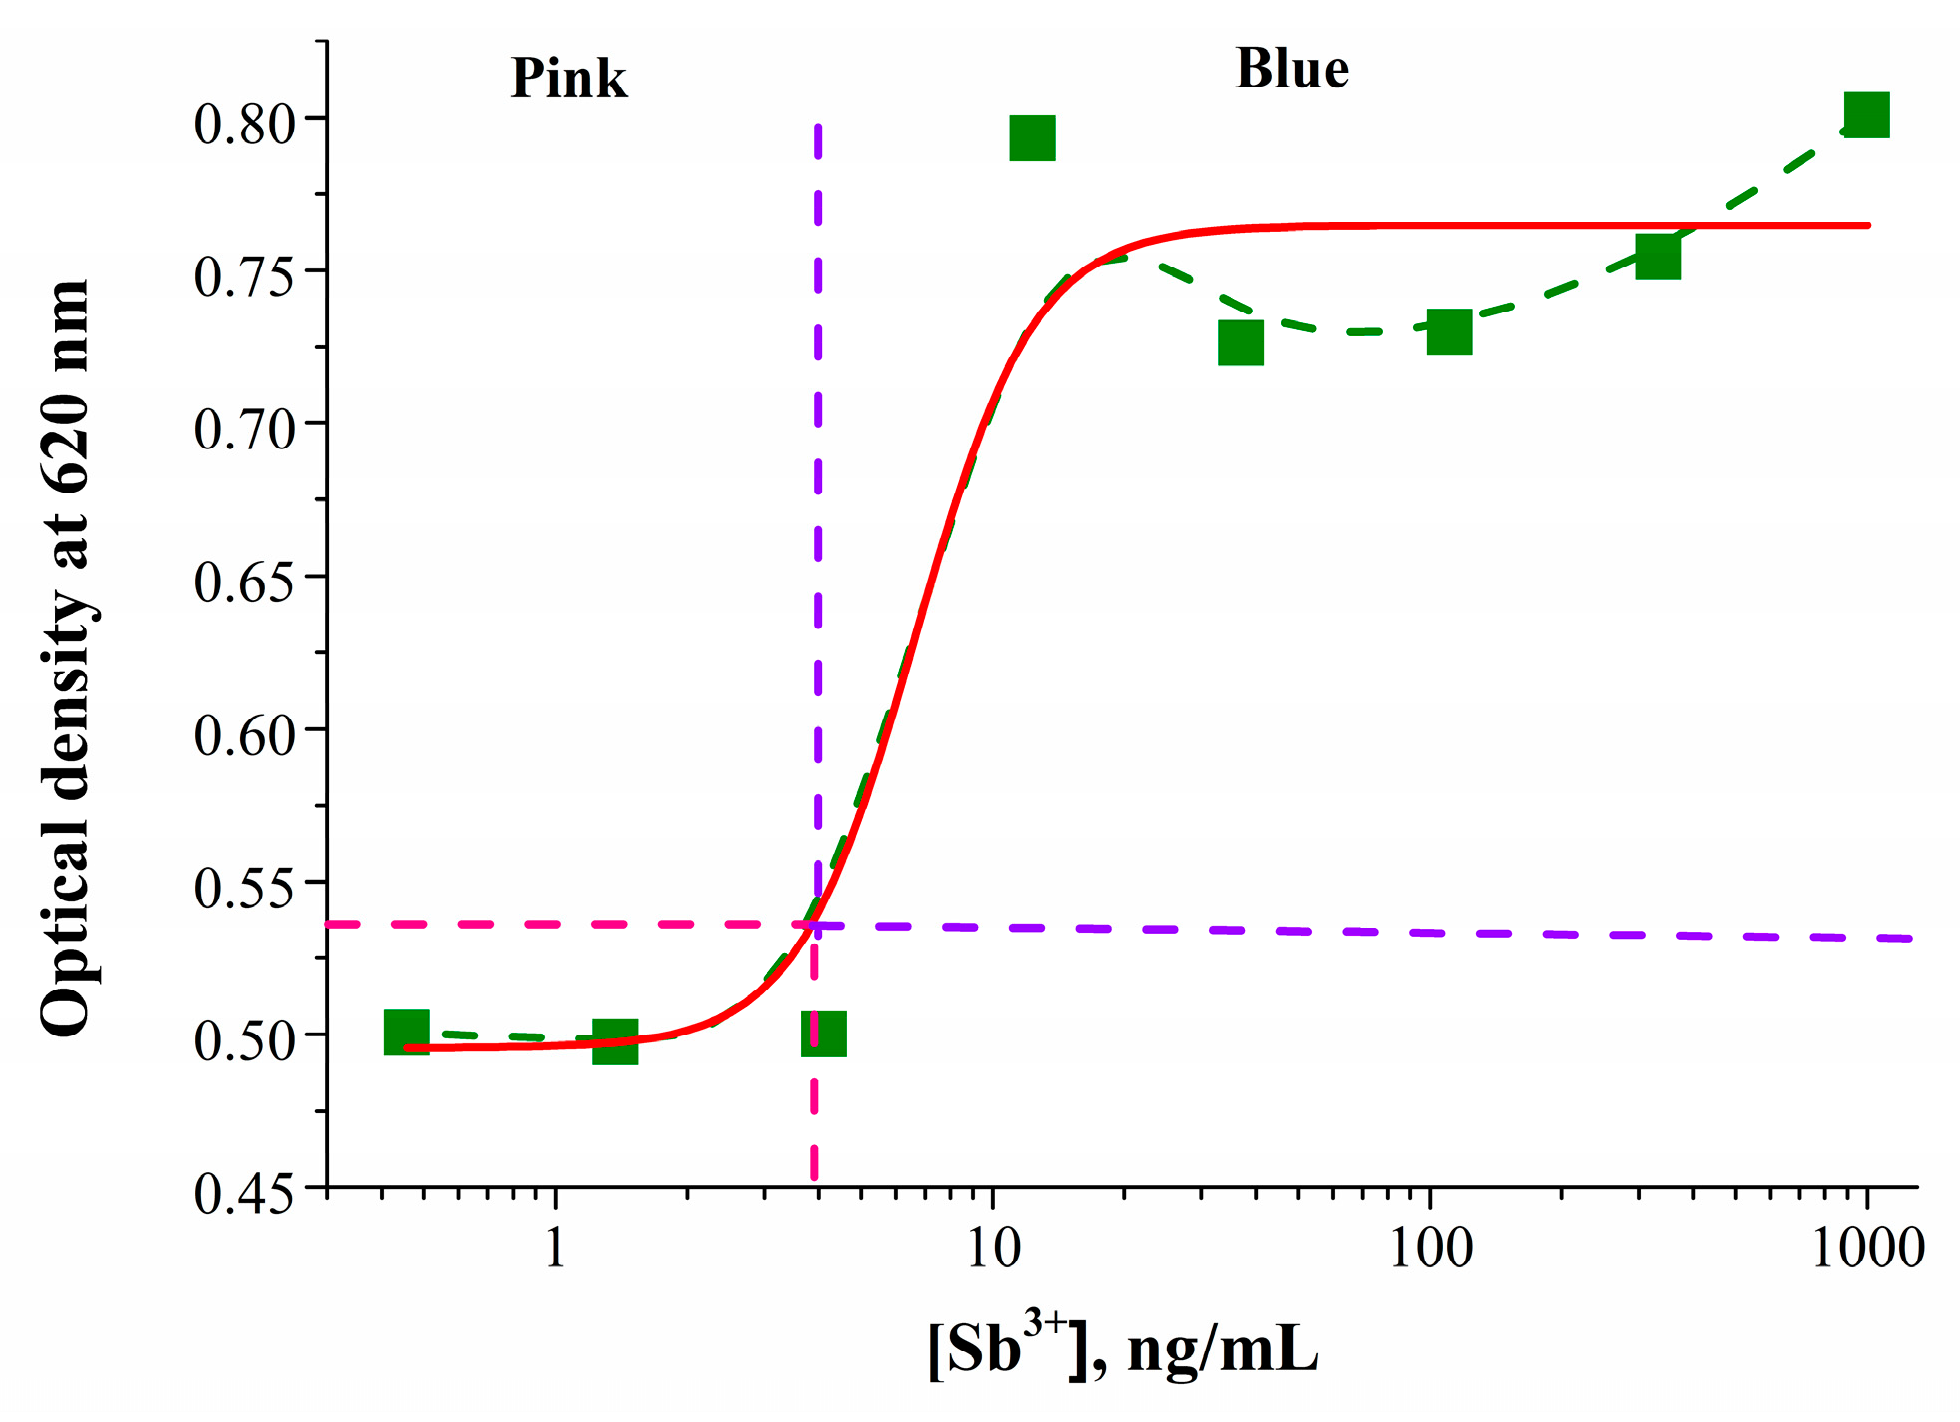
3.3. Colorimetric Detection of Antimony (III)

A simple assay protocol was developed using the obtained GNP–PAO conjugate for colorimetric determination of Sb3+ in water. To appreciate the detectable minimal concentration of Sb3+, different amounts of Sb3+ aqueous solution were added to the solution of PAO–GNPs. At low concentrations of Sb3+, the color of the solution is pale red (due to the dilution of PAO–GNPs). As the concentration of Sb3+ increases, the additional amount of target ions results in an immediate color change to blue. We can observe the interaction results by the naked eye. In addition, the optical density at 620 nm was measured. This wavelength has been chosen in previous studies on colorimetry [21]. According to experimental data, when comparing the optical densities at 595 and 620 nm for the entire studied range of metal ions, it was revealed that the maximum signal (A = 0.8) for antimony ions was reached at 620 nm. The signal in the presence of other ions at 595 nm is minimized when the wavelength is changed to 620 nm. The chosen wavelength of 620 nm corresponds to the absorbance band of the formed gold aggregates. The obtained dependence of optical density intensity over the Sb3+ concentrations is given in Figure 4.
The concentration of 10 ng/mL caused sharp structural changes with a loss of gold conjugate stability in the solution. The interaction of aptamers with the target can be characterized by a gentle interaction curve if saturation occurs slowly. However, in some cases, the transition from a change in properties occurs abruptly, when saturation with the analyte leads to a loss of system stability. The same characterization of dependence was observed by Gordon et al. [37]. Figure 4 clearly demonstrates that sharp changes of optical density can be formally described by four-parametric equation. This fitting was done for the estimation of analytical characteristics of the developed technique. However, taking into account the absence of the working range, this technique cannot be characterized by the “added-founded” method. Figure 5a shows the absorbance spectra of the reaction mixture containing PAO–GNPs in the presence of different concentrations of antimony (III). As can be observed, the spectrum varies depending on the concentration of the determined ions. When the Sb3+ concentration increased from 5.0 to 20 ng/mL, an additional band and shoulder between 600 and 730 nm at the absorbance spectrum occurred and optical density at 620 nm was increased, respectively. At the same time, the position of the main absorbance peak for gold nano-dispersed particles remains the same with a slow shift to the right from 529 nm for the GNP–PAOs without antimony to 542 nm for the GNP–PAOs at high antimony concentration.
If the position of the absorption peak is unchanged, an additional shoulder appears on the right side of the spectrum (600–730 nm).
In a range of 0–3 ng/mL, the color solution was red. However, after 10 ng/mL Sb3+ was added, the solution turned purple due to Sb3+-stimulated aggregation corresponding with absorbance and DLS data (Figure 5b). This figure indicates the similarity of the behavior of parameters. Thus, the growth of optical density (Figure 5b, blue curve) correlated well with the nanoparticle size determined by DLS (Figure 5b, red curve). Therefore, the presence of Sb3+ at concentrations of 10 ng/mL or higher leads to aggregation of modified GNPs.
Characterization of PAO–GNPs by TEM additionally confirmed aggregate formation (Figure 6). The concentration of Sb3+ estimated as 10 ng/mL corresponds to the ion’s permissible levels in drinking water [6].

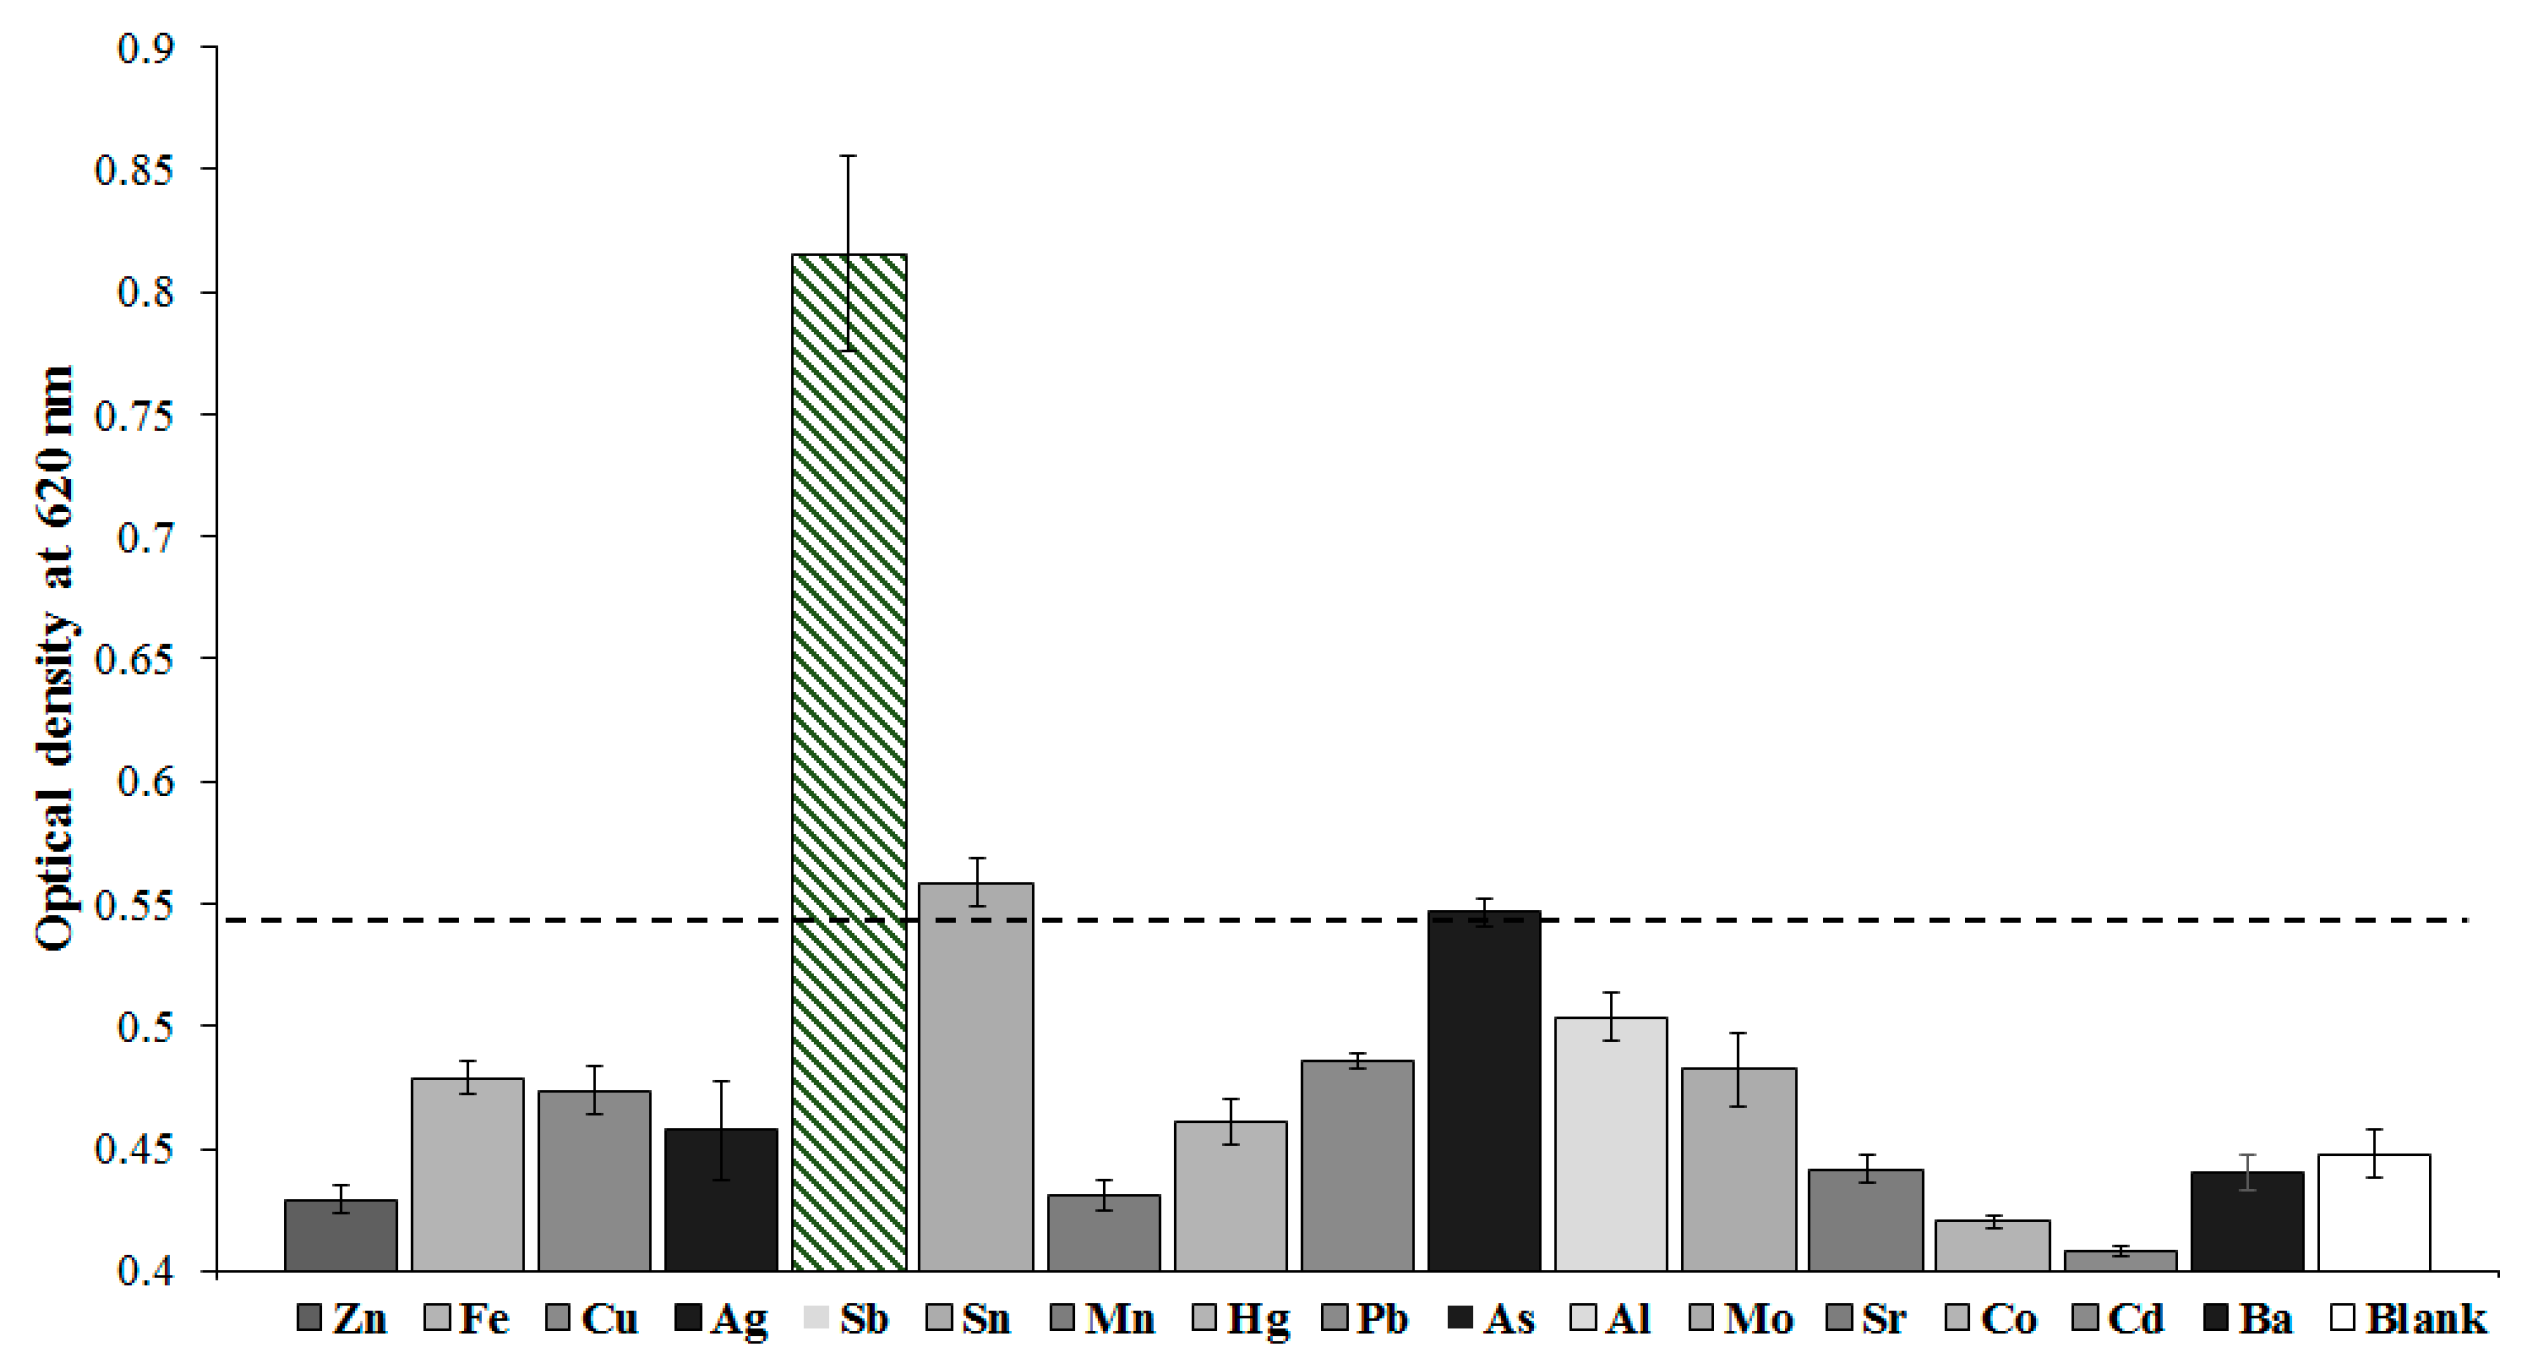
3.4. Selectivity Test

It is well known that the chemical composition of water in natural environments varies in accordance with the predominance of weathering, dissolution of atmospheric gases, and leaching of salts from ore [38]. Indeed, natural (e.g., river, lake, spring) waters have a different composition [39]. In the study, we tried to cover the maximum diversity of ions by considering both widely presented environmental contaminants and agents influenced by such types of reaction [40] to make sure there is no influence of external ions.
Figure 7 demonstrates the difference in intensities of optical density at 620 nm. As seen, insignificant nonspecific changes were observed. Only Sn4+ and As3+ influence the determination of Sb3+. However, the influence from As3+ is only observed when its concentration exceeds 1 mg/L, whereas an allowable concentration of As3+ in drinking water is 0.01 mg/L [41]. As for the tin ion (Sn4+), finding it in this form is almost impossible. Moreover, the content of tin ions is not standardized in drinking water. Despite this, we note this effect in this study.
Alkali metal ions (Na+, K+, Li+, and Cs+) did not affect the assay results up to the concentrations of 22.5 mg/L, and the optical density value continued to correspond to the blank solution. Earth alkali metal (Mg2+, Sr2+, and Ba2+) did not influence the conjugate PAO–GNPs’ stability, at least at 10 mg/L and Ca2+ at 13.5 mg/L. Nickel ions (Ni2+) at 4 mg/L did not cause the aggregation of the used PAO-modified GNPs. Such ions as Mo2+, Mn2+, Zn2+, Hg2+, Co2+, Ag+, Cd2+, Cu2+, and Fe3+ were taken at the concentration of 1 mg/L, and aggregation did not occur. Chromium ions (Cr3+) did not influence the stability of conjugates at 1 mg/L but influenced it at 1.8 mg/L. It should be noted that even the first concentration exceeded the maximum permissible level for drinking water. The chosen anions did not alter optical density even at 22.5 mg/L for chloride, 20.5 mg/L for sulfate, and 20.0 mg/L for nitrate ions. The low influence of other ions as interferences is explained by the selective interaction of the oligonucleotide sequence with Sb to induce aggregation.

3.5. Real Sample Analysis

To further demonstrate the applicability of this method, commercial drinking water was applied as a diluter for stock solution of Sb3+. The absence of Sb3+ in water samples is confirmed by a quality certificate from the manufacturer. Different concentrations of Sb3+ ions (0.5–1000 ng/mL) spiked the water sample with its following testing. The results presented in Figure 8 indicate this method is free from the matrix effect of drinking water. The relationship between optical density and Sb3+ concentration continues to be the same as for the calibration curve. Due to a sharp change in optical density at a concentration of 10 ng/mL, we can only identify positive or negative results. A blue color indicates a positive result, and red shows a negative result of Sb3+ assays.

3.6. Estimation of Analytical Characteristics

The simple and rapid analytical technique developed was characterized with the following analytical parameters. The first calibration curve obtained when ions were diluted by the distilled water is shown in Figure 4. Despite the development of positive–negative analysis, this calibration curve can be conditionally described by the four-parameter sigmoidal equation (y = A2 + (A1 −A2)/(1 + (x/x0)^p)) to demonstrate the nonlinear dependence. In accordance with this fitting, the detection limit was estimated as 3.2 ng/mL of antimony ions with a relatively narrow range of detectable concentrations from 4.2 ng/mL to 10.5 ng/mL. Such a narrow distribution is explained by the loss of stability of the applied PAO–GNP conjugate. Color transition is observed by the naked eye when the concentration of antimony reached 10 ng/mL. Similar results were obtained when distilled water was changed to actual drinking water (Figure 8). The detection limit of antimony in the real sample was estimated as 2.0 ng/mL, with the range of determined concentrations from 3.7 ng/mL to 25 ng/mL. The average error of detection is from 0.3% to 3.8% in inter-assay. According to these data, our results are promising in analytical sensitivity (LOD = 10 ng/mL), duration of analysis (2 min), and reproducibility (error of determination is less than 3.8% in three replicates). The present study confirmed the applicability of developed colorimetric techniques to determine Sb3+ as compared to the known methods. Table 1 shows publications related to Sb3+ determination by the different analytical techniques.

3.7. The Discussion of the Interaction Mechanism of Antimony (III) with poly-A Modified Gold Nanoparticles

The mechanism of interaction of metals and metalloids with DNA and proteins has been of interest to researchers since the successful use of compounds against tropical diseases began [49]. In particular, antimony preparations were used against leishmaniasis [50]. To understand the interaction mechanism, previous investigations are helpful. In some investigations, antimony acts as a complexation agent when interacting with organic compounds, with the resulting salts as stibogluconate or meglumine antimonite due to their properties of providing hydroxyl groups [49]. In the investigation by Baiocco et al., the authors [51] studied the mechanism of action of an anti-leishmaniosis drug with antimony compounds as the main components. Some molecules targeting antimony, trypanothione synthetase and trypanothione synthetase [52], are involved in this mechanism. Influencing the oxidative stress of bacteria also happens when antimony (III) blocks the reduction of the above-mentioned enzyme by NADPH and interacting with two catalytical cysteines (Cys52 and Cys57) in the active center [53].
Demicheli et al. [54] studied the interaction of antimony (V) with adenine nucleosides. Since the mechanism of interaction of antimony with targets in human organisms is not clear, the authors tried to understand how the interaction of this agent with nucleosides and nucleotides is possible. For its study, adenine was chosen as the nitrogen base. Authors used circular dichroism and NMR studies. Based on the obtained results, they concluded that Sb(V) seems to bind to the ribose moiety. This means that antimony can bind to ribose-containing compounds as ribonucleosides.
An investigation into the antimony (V) compounds with DNA showed no interactions [55]. Contrary to these results, linking of antimony (III) to DNA structures was estimated by short column capillary electrophoresis-ICP-MS assay [55]. During this investigation, authors confirmed the interaction of ribose moieties. Thus, having preliminary studies on this subject in hand, we assume that, most likely, trivalent antimony interacts with ribose nucleotide residues. In this case, the antimony (III) ion is involved in the complexation and convergence of several gold nanoparticles modified with poly-A sequences. Upon critical approach, the modified particles lose stability and form an aggregate.

4. Conclusions

We propose a novel, simple, and selective colorimetric assay for Sb3+ ions using gold nanoparticles conjugated with poly-A oligonucleotide. This approach is based on an aggregation of modified gold nanoparticles after the addition of Sb3+ into the solution as seen by the naked eye. The color of the resulting mixture turns from pink to blue at 10 ng/mL, corresponding to the maximum permissible level of target analyte in drinking water. Advantages of this assay are its ease of detection, high sensitivity, and selectivity. The demonstrated approach and research results will allow the use of aggregation methods for the determination of metal ions and the development and study of the capabilities of this technique. The developed method is promising for determining the presence of Sb3+ in drinking water due to the identity of the detection limit of the developed method and the maximum permissible concentration of antimony (III) in drinking water.

Author Contributions

Conceptualization, A.N.B., M.S.G. and A.V.Z.; Methodology, A.N.B., M.S.G. and N.S.K.; Software, N.S.K.; Writing—Original Draft Preparation, A.N.B. and N.S.K.; Writing, Review, and Editing, A.V.Z., B.B.D., A.N.B.; Visualization, A.N.B. and N.S.K.; Supervision, A.N.B., A.V.Z. and B.B.D.

Funding

This work was financially supported by Russian Science Foundation (project # 19-44-02020; obtaining reactants and assay development) and Department of Science and Technology (project # DST/INT/RUS/RSF/P-28G; studies of interaction mechanism). The authors are grateful to the researchers of the A.N. Bach Institute of Biochemistry: A.N. Antipov for help in the formation of ions collection; and S.M. Pridvorova and V.A. Grigoriev for transmission electron microscopy.

Conflicts of Interest

The authors declare no conflict of interest.

References

  1. Sundar, S.; Chakravarty, J. Antimony toxicity. Int. J. Environ. Res. Public Health 2010, 7, 4267–4277. [Google Scholar] [CrossRef] [PubMed]
  2. Herath, I.; Vithanage, M.; Bundschuh, J. Antimony as a global dilemma: Geochemistry, mobility, fate and transport. Environ. Pollut. 2017, 223, 545–559. [Google Scholar] [CrossRef] [PubMed]
  3. Filella, M. Antimony interactions with heterogeneous complexants in waters, sediments and soils: A review of data obtained in bulk samples. Earth-Sci. Rev. 2011, 107, 325–341. [Google Scholar] [CrossRef]
  4. He, M.; Wang, N.; Long, X.; Zhang, C.; Ma, C.; Zhong, Q.; Wang, A.; Wang, Y.; Pervaiz, A.; Shan, J. Antimony speciation in the environment: Recent advances in understanding the biogeochemical processes and ecological effects. J. Environ. Sci. 2019, 75, 14–39. [Google Scholar] [CrossRef] [PubMed]
  5. Wilson, S.C.; Lockwood, P.V.; Ashley, P.M.; Tighe, M. The chemistry and behavior of antimony in the soil environment with comparisons to arsenic: A critical review. Environ. Pollut. 2010, 158, 1169–1181. [Google Scholar] [CrossRef] [PubMed]
  6. Council of the European Communities. Council Directive Relating to the Quality of Water Intended for Human Consumption (80/778/EEC). Off. J. L 1980, 229, 11–29. [Google Scholar]
  7. Sanz, J.; Gallarta, F.; Galban, J.; Castillo, J.R. Antimony determination by hydride generation—UV-visible molecular absorption spectrophotometry with diode-array detection. Fresenius’ Z. Anal. Chem. 1988, 330, 510–515. [Google Scholar] [CrossRef]
  8. De Gregori, I.; Pinochet, H.; Fuentes, E.; Potin-Gautier, M. Determination of antimony in soils and vegetables by hydride generation atomic fluorescence spectrometry and electrothermal atomic absorption spectrometry. Optimization and comparison of both analytical techniques. J. Anal. Atomic Spectrom. 2001, 16, 172–178. [Google Scholar] [CrossRef]
  9. Gunduz, S.; Akman, S.; Baysal, A.; Kahraman, M. The use of silver nanoparticles as an effective modifier for the determination of arsenic and antimony by electrothermal atomic absorption spectrometry. Spectrochim. Acta B 2010, 65, 297–300. [Google Scholar] [CrossRef]
  10. Gunduz, S.; Akman, S.; Baysal, A.; Culha, M. The use of gold nanoparticles as an effective modifier for the determination of arsenic and antimony by electrothermal atomic absorption spectrometry. Microchim. Acta 2011, 172, 403–407. [Google Scholar] [CrossRef]
  11. Serrano, N.; Díaz-Cruz, J.M.; Ariño, C.; Esteban, M. Antimony-based electrodes for analytical determinations. TrAC Trends Anal. Chem. 2016, 77, 203–213. [Google Scholar] [CrossRef]
  12. Renedo, O.D.; González, M.J.G.; Martínez, M.J.A. Determination of antimony (III) in real samples by anodic stripping voltammetry using a mercury film screen-printed electrode. Sensors 2009, 9, 219–231. [Google Scholar] [CrossRef] [PubMed]
  13. Semenova, N.V.; Leal, L.O.; Forteza, R.; Cerdà, V. Antimony determination and speciation by multisyringe flow injection analysis with hydride generation-atomic fluorescence detection. Anal. Chim. Acta 2005, 530, 113–120. [Google Scholar] [CrossRef]
  14. Abbaspour, A.; Baramakeh, L. Simultaneous determination of antimony and bismuth by beta-correction spectrophotometry and an artificial neural network algorithm. Talanta 2005, 65, 692–699. [Google Scholar] [CrossRef] [PubMed]
  15. González, M.J.G.; Renedo, O.D.; Martínez, M.J.A. Simultaneous determination of antimony (III) and antimony (V) by UV–vis spectroscopy and partial least squares method (PLS). Talanta 2005, 68, 67–71. [Google Scholar] [CrossRef] [PubMed]
  16. Rath, S.; Jardim, W.F.; Dórea, J.G. A simple spectrophotometric procedure for the determination of antimony (III) and (V) in antileishmanial drugs. Fresenius’ J. Anal. Chem. 1997, 358, 548–550. [Google Scholar] [CrossRef]
  17. Tighe, M.; Edwards, M.M.; Cluley, G.; Lisle, L.; Wilson, S.C. Colorimetrically determining total antimony in contaminated waters and screening for antimony speciation. J. Hydrol. 2018, 563, 84–91. [Google Scholar] [CrossRef]
  18. Lintschinger, J.; Koch, I.; Serves, S.; Feldmann, J.; Cullen, W.R. Determination of antimony species with high-performance liquid chromatography using element specific detection. Fresenius’ J. Anal. Chem. 1997, 359, 484–491. [Google Scholar] [CrossRef]
  19. Fogg, A.G.; Burgess, C.; Burns, D.T. Use of basic dyes in the determination of anions, particularly as a means of determining antimony, thallium, and gallium. Talanta 1971, 18, 1175–1196. [Google Scholar] [CrossRef]
  20. Hu, M.; Chen, J.; Li, Z.Y.; Au, L.; Hartland, G.V.; Li, X.; Marquez, M.; Xia, Y. Gold nanostructures: Engineering their plasmonic properties for biomedical applications. Chem. Soc. Rev. 2006, 35, 1084–1094. [Google Scholar] [CrossRef] [PubMed]
  21. Berlina, A.N.; Zherdev, A.V.; Pridvorova, S.M.; Gaur, M.S.; Dzantiev, B.B. Rapid visual detection of lead and mercury via enhanced crosslinking aggregation of aptamer-labeled gold nanoparticles. J. Nanosci. Nanotechnol. 2019, 19, 5489–5495. [Google Scholar] [CrossRef] [PubMed]
  22. Du, J.; Zhu, B.; Chen, X. Urine for plasmonic nanoparticle-based colorimetric detection of mercury Ion. Small 2013, 9, 4104–4111. [Google Scholar] [CrossRef] [PubMed]
  23. Ullah, N.; Mansha, M.; Khan, I.; Qurashi, A. Nanomaterial-based optical chemical sensors for the detection of heavy metals in water: Recent advances and challenges. TrAC Trends Anal. Chem. 2018, 100, 155–166. [Google Scholar] [CrossRef]
  24. Zhou, W.; Saran, R.; Liu, J. Metal sensing by DNA. Chem. Rev. 2017, 117, 8272–8325. [Google Scholar] [CrossRef] [PubMed]
  25. Chen, Z.; Wang, X.; Cheng, X.; Yang, W.; Wu, Y.; Fu, F. Specifically and visually detect methyl-mercury and ethyl-mercury in fish sample based on DNA-templated alloy Ag–Au nanoparticles. Anal. Chem. 2018, 90, 5489–5495. [Google Scholar] [CrossRef] [PubMed]
  26. Yang, D.; Liu, X.; Zhou, Y.; Luo, L.; Zhang, J.; Huang, A.; Mao, Q.; Chen, X.; Tang, L. Aptamer-based biosensors for detection of lead (ii) ion: A review. Anal. Meth. 2017, 9, 1976–1990. [Google Scholar] [CrossRef]
  27. Gan, Y.; Liang, T.; Hu, Q.; Zhong, L.; Wang, X.; Wan, H.; Wang, P. In-situ detection of cadmium with aptamer functionalized gold nanoparticles based on smartphone-based colorimetric system. Talanta 2020, 208, 120231. [Google Scholar] [CrossRef]
  28. Zhou, M.; Lin, T.; Gan, X. Colorimetric aggregation assay for silver(I) based on the use of aptamer modified gold nanoparticles and C-Ag(I)-C interaction. Microchim. Acta 2017, 184, 4671–4677. [Google Scholar] [CrossRef]
  29. Zhang, L.; Chen, X.R.; Wen, S.H.; Liang, R.P.; Qiu, J.D. Optical sensors for inorganic arsenic detection. TrAC Trends Anal. Chem. 2019, 118, 869–879. [Google Scholar] [CrossRef]
  30. Huang, J.; Su, X.; Li, Z. Metal ion detection using functional nucleic acids and nanomaterials. Biosens. Bioelectron. 2017, 96, 127–139. [Google Scholar] [CrossRef] [PubMed]
  31. Frens, G. Controlled nucleation for the regulation of the particle size in monodisperse gold suspensions. Nat. Phys. Sci 1973, 241, 20–22. [Google Scholar] [CrossRef]
  32. Tan, D.; He, Y.; Xing, X.; Zhao, Y.; Tang, H.; Pang, D. Aptamer functionalized gold nanoparticles based fluorescent probe for the detection of mercury (II) ion in aqueous solution. Talanta 2013, 113, 26–30. [Google Scholar] [CrossRef] [PubMed]
  33. Zhu, Q.; Liu, G.; Kai, M. DNA aptamers in the diagnosis and treatment of human diseases. Molecules (Basel) 2015, 20, 20979–20997. [Google Scholar] [CrossRef] [PubMed]
  34. Kreibig, U.; Genzel, L. Optical absorption of small metallic particles. Surf. Sci. 1985, 156, 678–700. [Google Scholar] [CrossRef]
  35. Michen, B.; Geers, C.; Vanhecke, D.; Endes, C.; Rothen-Rutishauser, B.; Balog, S.; Petri-Fink, A. Avoiding drying-artifacts in transmission electron microscopy: Characterizing the size and colloidal state of nanoparticles. Sci. Rep. 2015, 5, 9793. [Google Scholar] [CrossRef] [PubMed]
  36. Mirkin, C.A.; Letsinger, R.L.; Mucic, R.C.; Storhoff, J.J. A DNA-based method for rationally assembling nanoparticles into macroscopic materials. Nature 1996, 382, 607–609. [Google Scholar] [CrossRef] [PubMed]
  37. Gordon, C.K.L.; Wu, D.; Feagin, T.A.; Pusuluri, A.; Csordas, A.T.; Eisenstein, M.; Hawker, C.J.; Niu, J.; Soh, H.T. Click-PD: A quantitative method for base-modified aptamer discovery. ACS Chem. Biol. 2019. [Google Scholar] [CrossRef] [PubMed]
  38. Hounslow, A. Water Quality Data: Analysis and Interpretation, 1st ed.; CRC Press: Boca Raton, FL, USA, 2018; p. 416. [Google Scholar]
  39. Hem, J.D. Study and Interpretation of the Chemical Characteristics of Natural Water, 3rd ed.; US Geological Survey: Charlottesville, VA, USA, 1985; p. 264.
  40. Berlina, A.N.; Zherdev, A.V.; Dzantiev, B.B. Progress in rapid optical assays for heavy metal ions based on the use of nanoparticles and receptor molecules. Microchim. Acta 2019, 186, 172. [Google Scholar] [CrossRef] [PubMed]
  41. WHO World Health Organization (WHO). Guidelines for Drinking-Water Quality, 4th ed.; WHO Library Cataloguing-in-Publication Data: Geneva, Switzerland, 2011. [Google Scholar]
  42. Hamilton, T.W.; Ellis, J.; Florence, T.M. Determination of arsenic and antimony in electrolytic copper by anodic stripping voltammetry at a gold film electrode. Anal. Chim. Acta 1980, 119, 225–233. [Google Scholar] [CrossRef]
  43. Renedo, O.D.; Martínez, M.J.A. A novel method for the anodic stripping voltammetry determination of Sb(III) using silver nanoparticle-modified screen-printed electrodes. Electrochem. Commun. 2007, 9, 820–826. [Google Scholar] [CrossRef]
  44. Renedo, O.D.; Martínez, M.J.A. Anodic stripping voltammetry of antimony using gold nanoparticle-modified carbon screen-printed electrodes. Anal. Chim. Acta 2007, 589, 255–260. [Google Scholar] [CrossRef] [PubMed]
  45. Rojas, C.; Arancibia, V.; Gómez, M.; Nagles, E. High sensitivity adsorptive stripping voltammetric method for antimony(III) determination in the presence of quercetin-5′-sulfonic acid. Substituent effect on sensitivity. Sens. Actuators B 2013, 185, 560–567. [Google Scholar] [CrossRef]
  46. Unutkan, T.; Koyuncu, İ.; Diker, C.; Fırat, M.; Büyükpınar, Ç.; Bakırdere, S. Accurate and sensitive analytical strategy for the determination of antimony: Hydrogen assisted T-shaped slotted quartz tube-atom trap-flame atomic absorption spectrometry. Bull. Environ. Contam. Toxicol. 2019, 102, 122–127. [Google Scholar] [CrossRef] [PubMed]
  47. Ge, S.; Zhang, C.; Zhu, Y.; Yu, J.; Zhang, S. BSA activated CdTe quantum dot nanosensor for antimony ion detection. Analyst 2010, 135, 111–115. [Google Scholar] [CrossRef] [PubMed]
  48. Zhu, Z.; Yang, C.; Yu, P.; Zheng, H.; Liu, Z.; Xing, Z.; Hu, S.H. Determination of antimony in water samples by hydride generation coupled with atmospheric pressure glow discharge atomic emission spectrometry. J. Anal. Atomic Spectrom. 2019, 34, 331–337. [Google Scholar] [CrossRef]
  49. Ong, Y.C.; Roy, S.; Andrews, P.C.; Gasser, G. Metal compounds against neglected tropical diseases. Chem. Rev. 2019, 119, 730–796. [Google Scholar] [CrossRef] [PubMed]
  50. Eddaikra, N.; Ait-Oudhia, K.; Kherrachi, I.; Oury, B.; Moulti-Mati, F.; Benikhlef, R.; Harrat, Z.; Sereno, D. Antimony susceptibility of Leishmania isolates collected over a 30-year period in Algeria. PLoS Negl. Trop. Dis. 2018, 12, e0006310. [Google Scholar] [CrossRef] [PubMed]
  51. Baiocco, P.; Colotti, G.; Franceschini, S.; Ilari, A. Molecular basis of antimony treatment in leishmaniasis. J. Med. Chem. 2009, 52, 2603–2612. [Google Scholar] [CrossRef] [PubMed]
  52. Krauth-Siegel, R.L.; Comini, M.A. Redox control in trypanosomatids, parasitic protozoa with trypanothione-based thiol metabolism. Biochim. Et Biophys. Acta Gen. Subj. 2008, 1780, 1236–1248. [Google Scholar] [CrossRef] [PubMed]
  53. Colotti, G.; Fiorillo, A.; Ilari, A. Metal-and metalloid-containing drugs for the treatment of trypanosomatid diseases. Front. Biosci. 2018, 23, 954–966. [Google Scholar]
  54. Demicheli, C.; Frézard, F.; Lecouvey, M.; Garnier-Suillerot, A. Antimony(V) complex formation with adenine nucleosides in aqueous solution. Biochim. Et Biophys. Acta Gen. Subj. 2002, 1570, 192–198. [Google Scholar] [CrossRef]
  55. Li, Y.; Liu, J.M.; Han, F.; Jiang, Y.; Yan, X.P. Probing interactions of antimony species with DNA by short column capillary electrophoresis coupled with inductively coupled plasma mass spectrometry. J. Anal. Atomic Spectrom. 2011, 26, 94–99. [Google Scholar] [CrossRef]
Figure 1. Principle of colorimetric determination of Sb3+ based on aggregation of modified gold nanoparticles (GNPs).
Applsci 09 04782 g001
Figure 2. Transmission electron microscopy (TEM) images of unmodified GNPs (a) and PAO-modified GNPs (b).
Applsci 09 04782 g002
Figure 3. Results of dynamic light scattering (DLS) characterization of native and PAO-modified gold nanoparticles in absence and presence of antimony at 10 ng/mL in the solutions (n = 3).
Applsci 09 04782 g003
Figure 4. Calibration curve for Sb3+ detection (with the use of GNP–PAO conjugate). The value of 0.55 indicates the absorbance of gold conjugate at 620 nm in the absence of antimony. The points above and to the right of optical density 0.5 correspond to the blue color of the final reaction mixture, and the points below and left of this level correspond to pink (y = 0.76 + (0.50 − 0.76)/(1 + (x/6.6)^3.19), (R2 = 0.95)). All experiments were undertaken in three replicates. Standard deviations from the mean were in the range 2.1–5.8%.
Applsci 09 04782 g004
Figure 5. (a) The absorbance spectra of PAO-immobilized GNPs after different additions of Sb3+ (normalized spectra, after subtracting the corresponding background signal); (b) the value of optical density (lower) and average hydrodynamic diameter (upper) of conjugated GNPs. All experiments were undertaken in three replicates.
Applsci 09 04782 g005
Figure 6. TEM image of PAO-modified GNPs after interaction with Sb3+ (10 ng/mL).
Applsci 09 04782 g006
Figure 7. The values of A620 for GNP–PAOs after adding 50 ng/mL ions. The value of 0.55 indicates the absorbance of gold conjugate at 620 nm in the absence of antimony. The dashed line indicates the border between background staining (red, below this line) and reliable signal (optical density, blue, above this line). Concentrations of the corresponding ions used: Sr2+, Ba2+—10 mg/L; Mo2+, Mn2+, Zn2+, Hg2+, Co2+, Ag+, Cd2+, Cr3+, As3+, Cu2+, Pb2+, and Fe3+—1 mg/L. All experiments were undertaken in three replicates.
Applsci 09 04782 g007
Figure 8. Dependence of optical intensity for detecting Sb3+ in drinking water (n = 3). The points above and to the right of optical density 0.5 correspond to the blue color of the final reaction mixture, and the points below and left to this level correspond to pink (y = 0.66 + (0.43 − 0.66)/(1 + (x/10.05)^1.38), (R2 = 0.98)). All experiments were undertaken in three replicates.
Applsci 09 04782 g008
Table 1. Described assays for the determination of antimony.
Heavy MetalSensing UnitDetection MethodLOD, Dynamic RangeProbeRef.
Sophisticated Instrumental Methods
1As3+, Sb3+Gold film electrodeAnodic stripping voltammetryAs3+: 1.12 ng/mL
5.5–0.5 μg/mL
Copper[42]
Sb3+: 0.56 ng/mL
2.6–0.6 μg/mL
2Sb3+Silver nanoparticle-modified screen-printed electrodes0.083 ng/mLSeawater samples and pharmaceutical preparations[43]
0.012–0.11 μg/mL
3Sb3+Gold nanoparticle-modified carbon screen-printed electrodes0.115 ng/mLSeawater samples, drug samples[44]
0.012–0.11 μg/mL
4Sb3+Mercury film screen-printed electrode1.54 ng/mLPharmaceutical preparations and seawater[12]
1.2–10.1 ng/mL
5Sb3+Quercetin-5’-sulfonic acidAdsorptive stripping voltammetric method3.6 pg/mL (60s) and 1.6 pg/mL (180s)Tap water and a commercial mineral water[45]
1.0–5.0 ng/mL
6As3+, Sb3+AgNPs as a modifierElectrothermal atomic absorption spectrometryAs3+: 0.022 ng/mLSeawater and tap water[9]
Sb3+: 0.046 ng/mL
7As3+, Sb3+GNPsAs3+: 2.3 ng/mLSeawater and tap water[10]
Sb3+: 3.0 ng/mL
8Sb3+-Trap-flame atomic absorption spectrometry0.75 ng/mLTap and mineral water[46]
5.0–10.0 ng/mL
9Sb3+, Sb5+EDTA and pyridine-2,6-dicarboxylic acid for chelating reaction with SbAnion exchange high-performance liquid chromatographySb5+: 0.5 μg/mLHot spring samples from New Zealand[18]
Sb3+: 0.8 μg/mL
5–200 μg/mL
10Sb3+-Electrothermal atomic absorption spectrometry0.45 μg/mL Soils and alfalfa samples[8]
0–50 μg/mL
11Sb3+-Hydride generation coupled to atomic fluorescence spectroscopy0.08 μg/mL Soils and alfalfa samples[8]
0.25–250 μg/mL
12Sb3+-Multi-syringe flow injection analysis with hydride generation-atomic fluorescence detection0.08 ng/mLHard drinking water, filtered and diluted lake water[13]
0.2–5.6 ng/mL
13Sb3+BSA activated (TGA)-capped CdTe quantum dot nano-sensorFluorescence0.0294 ng/mLArtificial pond water, spring water, sewage[47]
0.10–22.0 μg/mL
14Sb3+-Atmospheric pressure glow discharge atomic emission spectrometry0.14 ng/mLGroundwater samples[48]
0.5–100 ng/mL
15Sb3+Absorbance at 198 nm after hydride generationUV-visible molecular absorption spectrophotometry with diode-array detection3–440 μg/mLPVC sample[7]
16Sb3+, Bi3+Pyrogallol redβ-correction spectrophotometry0.05–5.0 μg/mLRiver, tap, and industrial wastewater[14]
0.2–3.2 μg/mL
16Sb3+, Sb5+Pyrogallol (complexing agent)UV–vis spectroscopySb5+: 1.26 μg/mLCommercial sample of Glucantime®[15]
Sb3+: 4.84 μg/mL
17Sb3+Bromopyrogallol redspectrophotometry0.2 μg/mLSamples of Glucantime[16]
5.19 ± 0.16–10.52 ± 0.15 mg/mL
Non-Instrumental Methods
18Sb3+Yellow potassium iodoantimonite KSbI4Colorimetry0.6 μg/mLContaminated waters[17]
0–5 μg/mL
19Sb3+GNPs modified with PAOColorimetry2.0 ng/mL (instrumental LOD)Drinking waterThis study
10 ng/mL (visual LOD)

