Article

A New Method to Determine How Compaction Affects Water and Heat Transport in Green Roof Substrates

by
Victoria Sandoval
1,2 and
Francisco Suárez
1,2,3,*
1
Departamento de Ingeniería Hidráulica y Ambiental, Pontificia Universidad Católica de Chile, Av. Vicuña Mackenna 4860, Santiago 7820436, Chile
2
Centro de Desarrollo Urbano Sustentable (CEDEUS), CONICYT/FONDAP/15110020, Santiago 7820436, Chile
3
Centro de Excelencia en Geotermia de los Andes (CEGA), CONICYT/FONDAP/15090013, Santiago 7820436, Chile
*
Author to whom correspondence should be addressed.
Appl. Sci. 2019, 9(21), 4697; https://doi.org/10.3390/app9214697
Submission received: 15 October 2019 / Revised: 30 October 2019 / Accepted: 1 November 2019 / Published: 4 November 2019
(This article belongs to the Special Issue New Trends of Sustainability in Civil Engineering and Architecture)

Abstract

:

Featured application

The method presented in this paper aims to estimate the hydrodynamic and thermal properties of green roofs after settling has occurred.

Abstract

Although compaction affects water and heat transport processes in porous media, few studies have dealt with this problem. This is particularly true for substrates, which are artificial porous media used for engineering and technological solutions, such as in vegetated or green roofs. We propose a methodology to study the effect of substrate compaction on the characterization of physical, hydrodynamic and thermal properties of five green roof substrates. The methodology consists in a parametric analysis that uses the properties of a substrate with known bulk density, and then modifies the substrate properties to consider how compaction affects water and heat fluxes. Coupled heat and water transport numerical simulations were performed to assess the impact of the changes in the previous properties on the hydraulic and thermal performance of a hypothetical roof system. Our results showed that compaction reduced the amplitude of the fluctuations in the volumetric water content daily cycles, increasing the average water content and reducing the breakthrough time of the green roof substrates. Compaction changes the thermal behavior of the green roof substrates in different ways for each substrate due to the dependence of the air, water and soil fraction of each substrate.

1. Introduction

Green roofs have been extensively adopted over the last few decades as a technological solution for sustainable development [1,2,3], as they integrate vegetation into buildings to minimize some negative impacts of urbanization [2,3,4,5]. A properly designed green roof can reduce pollution, noise levels, building energy consumption, and stormwater runoff [2,6,7]. At the same time, green roofs increase biodiversity and provide ecological services in urban environments [8,9].
Green roof overall performance strongly relies on the interaction between environmental conditions and the green roof’s biophysical components [2,5]. A systematic comprehension of the processes occurring in every component of a green roof, under site-specific conditions, is required to understand the benefits described above. This systematic comprehension is extremely important in arid and semi-arid areas, where construction materials may be different and meteorological conditions significantly differ from humid climates, where majority of green roof investigations have been carried out to date [1,2,10,11,12].
The vegetation and substrate layers are the central components that determine water and heat fluxes on green roofs [2,3,12,13]. This work focuses on green roof substrates, even when it is known that vegetation is relevant on green roof hydraulic and thermal performance. Substrates are engineered media with an improved performance compared to natural soils [14]. Substrates have been typically used in many civil engineering applications. The substrate provides resources that are critical for the vegetation, such as a support media, nutrients and water [2,15]. The thermal and water retention properties of a green roof greatly rest on the substrate’s physical properties [16]. The heat flux through a green roof and the substrate’s moisture content affect the buildings’ heat gains and losses, which impacts the consumption of energy in the building. Also, substrate’s moisture content is key for the survival of the vegetation, especially in arid and semi-arid areas [1,2]. Therefore, it is important to comprehend the physical, thermal, and hydrodynamic substrate properties and how they change through time.
Even when many investigations addressing green roofs thermal performance consider the impacts of moisture on the substrate thermal properties, they commonly neglect how water flow affects the energy balance [17,18]. Sailor [17] developed a widely used model that represents heat fluxes across the substrate and includes the atmosphere–vegetation–substrate energy exchange. Sailor’s [17] model assumes that moisture in the substrate diffuses at a constant rate. However, it is widely known that there are highly non-linear processes occurring in this system [2,19]. Sailor and Hagos [18] and Zhao et al. [20] incorporated how compaction affects the substrate thermal properties. However, their model did not account for the effect of water flow on the energy balance.
Soil compaction plays a key role in solute transport, nutrient availability, crop productivity, and water movement [21]. Soil compaction has been typically investigated without considering its impact on the coupled water and heat transport in porous media [22,23]. There are many investigations that deal with the impact of compaction on water fluxes [21,24,25,26], as well as many studies that investigate how compaction affects heat fluxes in soils [18,20]. Nonetheless, there is a lack of studies that have investigated the effect of substrate compaction on the combined water and heat transport in green roofs. Hence, substrate compaction in green roofs has been typically neglected. However, studies demonstrate that through time, the substrate settles and changes the thermal and hydraulic behavior of green roofs [7,12,27].
The objective of this study is to develop a methodology that can be used to represent the effect of compaction on the hydrodynamic and thermal properties of a porous medium. The proposed methodology combines the Richards’ [28] and the energy equations to predict water and heat fluxes in a compacted medium. Using numerical simulations populated with experimental data obtained from green roof substrates, the proposed methodology is used to predict water and heat fluxes in a hypothetical roof system and to determine the heat needed to maintain a constant reference temperature in a room located below the roof.

2. Materials and Methods

In this section, we briefly introduce the water flow and heat transport theory in porous media. Then, we describe the theory used to incorporate the effect of compaction on the hydrodynamic and thermal properties of porous media, which can then be used to determine the impact of substrate compaction on water and heat transport. Later, we present the substrates used to apply this methodology. Finally, the numerical simulations used to investigate the impacts of substrate compaction on water and heat transport through a hypothetical roof system are described.

2.1. Water Flow and Heat Transport Theory in Porous Media

Water transport in porous media usually is represented using the two-dimensional version of the Richards’ [28] equation:
θ t = x [ K ( θ ) h x ] + z [ K ( θ ) ( h z ) + 1 ] ,
where θ is the volumetric water content; K(θ) is the hydraulic conductivity curve; h is the pressure head; x and z are the horizontal and vertical directions, respectively; and t is the time. The water retention curve, h(θ), and the hydraulic conductivity curve, K(θ), are two important properties that control water flow in a partially saturated media [15], and are needed to solve Equation (1).
There are many expressions that can be used to represent the h(θ) [29,30,31]. The most used equation to represent the h(θ) is that proposed by van Genuchten [30]:
S e = θ θ r θ s θ r = 1 ( 1 + | α   h ( θ ) | n ) m ,
where Se is the effective saturation; θr, and θs are the residual and saturated volumetric water contents, respectively; α is the inverse of the air-entry pressure; and n and m are empirical parameters. Assouline et al. [31] also proposed a water retention model that has been used to investigate the impact of compaction on both h(θ) and K(θ); therefore, it is a relevant model for this investigation. The h(θ) model proposed by Assouline et al. [31] is given in Equation (3):
S e ( h ) = { 1 exp [ ξ ( | h | 1 | h L | 1 ) μ ] } 0 h h L ,
where ξ and μ are two fitting parameters, and hL = 15 bar is the pressure head corresponding to a very low water content. It is also interesting to note that the parameters of the h(θ) models of Assouline et al. [31] and van Genuchten [30] can be related using the following expressions:
μ = 0.51 ln 1.1 ,
ξ = 1.21 α 1 .
There are also many expressions to represent the K(θ). The most used expression is the van Genuchten–Mualem model with m = 1 − 1/n [32]:
K ( θ ) = K S S e l [ 1 ( 1 S e 1 / m ) m ] 2 ,
where KS is the saturated hydraulic conductivity, l is the pore-connectivity parameter (=0.5 [32]), and the Se is determined using the van Genuchten [30] model. Assouline and Tartakovsky [33], on the other hand, describes the K(θ) using the following expression:
K ( θ ) = K S S e [ ξ 1 / μ μ 1 γ ( μ 1 , ξ a h ) h 1 exp ( ξ a h ) + h L 1 ξ 1 / μ μ 1 Γ ( μ 1 ) + h L 1 ] 2 ,
where γ and Γ are the incomplete and complete Gamma functions, respectively, and a h = [ h 1 h L 1 ] μ .
The heat flow in a porous medium has been typically described using the energy equation [34]:
C p ( θ ) T t = x [ λ ( θ ) T x ] + z [ λ ( θ ) T z ] C w q l x T x C w q l z T z ,
where Cp(θ) and Cw are the volumetric heat capacities of the moist media and water, respectively; T is the temperature; qlx and qlz are the liquid flux density in the horizontal and vertical directions, respectively; and λ(θ) is the porous media apparent thermal conductivity, defined as [35]:
λ ( θ ) = λ 0 ( θ ) + β t C w | q l | ,
where βt is the thermal dispersivity; ql is the magnitude of the liquid flux density; and λ0(θ) is the thermal conductivity in absence of fluid flow, which in this work has been modeled using the Chung and Horton [36] method. The volumetric heat capacity of the moist soil, Cp(θ), is described using the following equation [35]:
C p ( θ ) = C n θ n + C o θ o + C w θ + C a a v C n θ n + C o θ o + C w θ ,
where C is the volumetric heat capacity; av is the air content; the subscripts n, a, and w refer to the solid, air, and liquid phases, respectively; and the subscript o refers to organic matter. To represent the water and heat flux through porous media, as described in Equations (1) and (8), both the hydrodynamic and thermal properties of the media must be known.

2.2. Impact of Compaction on the Hydrodynamic Properties

To consider the effect of compaction on the water retention curve, the method proposed by Assouline [37] was employed. In this method, a homogeneous porous medium with an initial bulk density, ρ, is compacted to a density ρc. After the porous medium is compacted, the compacted saturated and residual water contents, θsc and θrc, respectively, are calculated as follows:
θ s c = θ s [ ρ s ρ c ρ s ρ ] ,
θ r c = θ r ( ρ c ρ ) ,
where ρs is the solid particle density of the substrate. When the porous media is compacted, Assouline [37] proposed to estimate the change in the remainder parameters of his water retention curve as follows:
ξ c = ξ ( ρ c ρ ) 3.72 ,
μ c = μ ( ρ c ρ ) w ,
w = 2.3 - 1.9 ( SC CC ) 0.55 ,
where the subscript c refers to the compacted state, and w represents the effect of the silt content (SC) and the clay content (CC) on the way that the porous medium is compacted. Equations (13) and (14) can be also written using the α and n parameters of the van Genuchten [30] model:
α α c = ( ρ c ρ ) 3.72 ,
n c n = ( ρ c ρ ) 0.91 w .
The effect of compaction on the saturated hydraulic conductivity was estimated using the approach presented by Assouline [38]. He proposed obtaining the saturated hydraulic conductivity for a compacted bulk density using the following expression:
K S c K S = { ( θ s c θ r c ) [ ζ c 1 / μ c μ c 1 Γ ( μ c 1 ) + | h L | 1 ] } η c { ( θ s θ r ) [ ζ 1 / μ μ 1 Γ ( μ 1 ) + | h L | 1 ] } η ,
with ξ = ξμ, and where η is a parameter that depends on the coefficient of variation of the water retention model of Assouline [38]:
η = 3.04 exp ( σ r G ) ,
where σ2 and rG are the second and first moments of Equation (3):
r G = ζ 1 / μ Γ ( 1 + 1 / μ ) + 1 / | h L | ,
σ = { ζ 1 / μ [ Γ ( 1 + 2 / μ ) Γ 2 ( 1 + 1 / μ ) ] } 1 / 2 .
The calculation of KSc/Ks requires the utilization of Equations (19)–(21) to find the parameters for the uncompacted and compacted state, and the values of μ and μc from Equation (14). Using Equations (16) and (17), the parameters of the Assouline [38] model in the compacted state can be related to those of the van Genuchten [30] water retention curve.

2.3. Impact of Compaction on the Thermal Properties
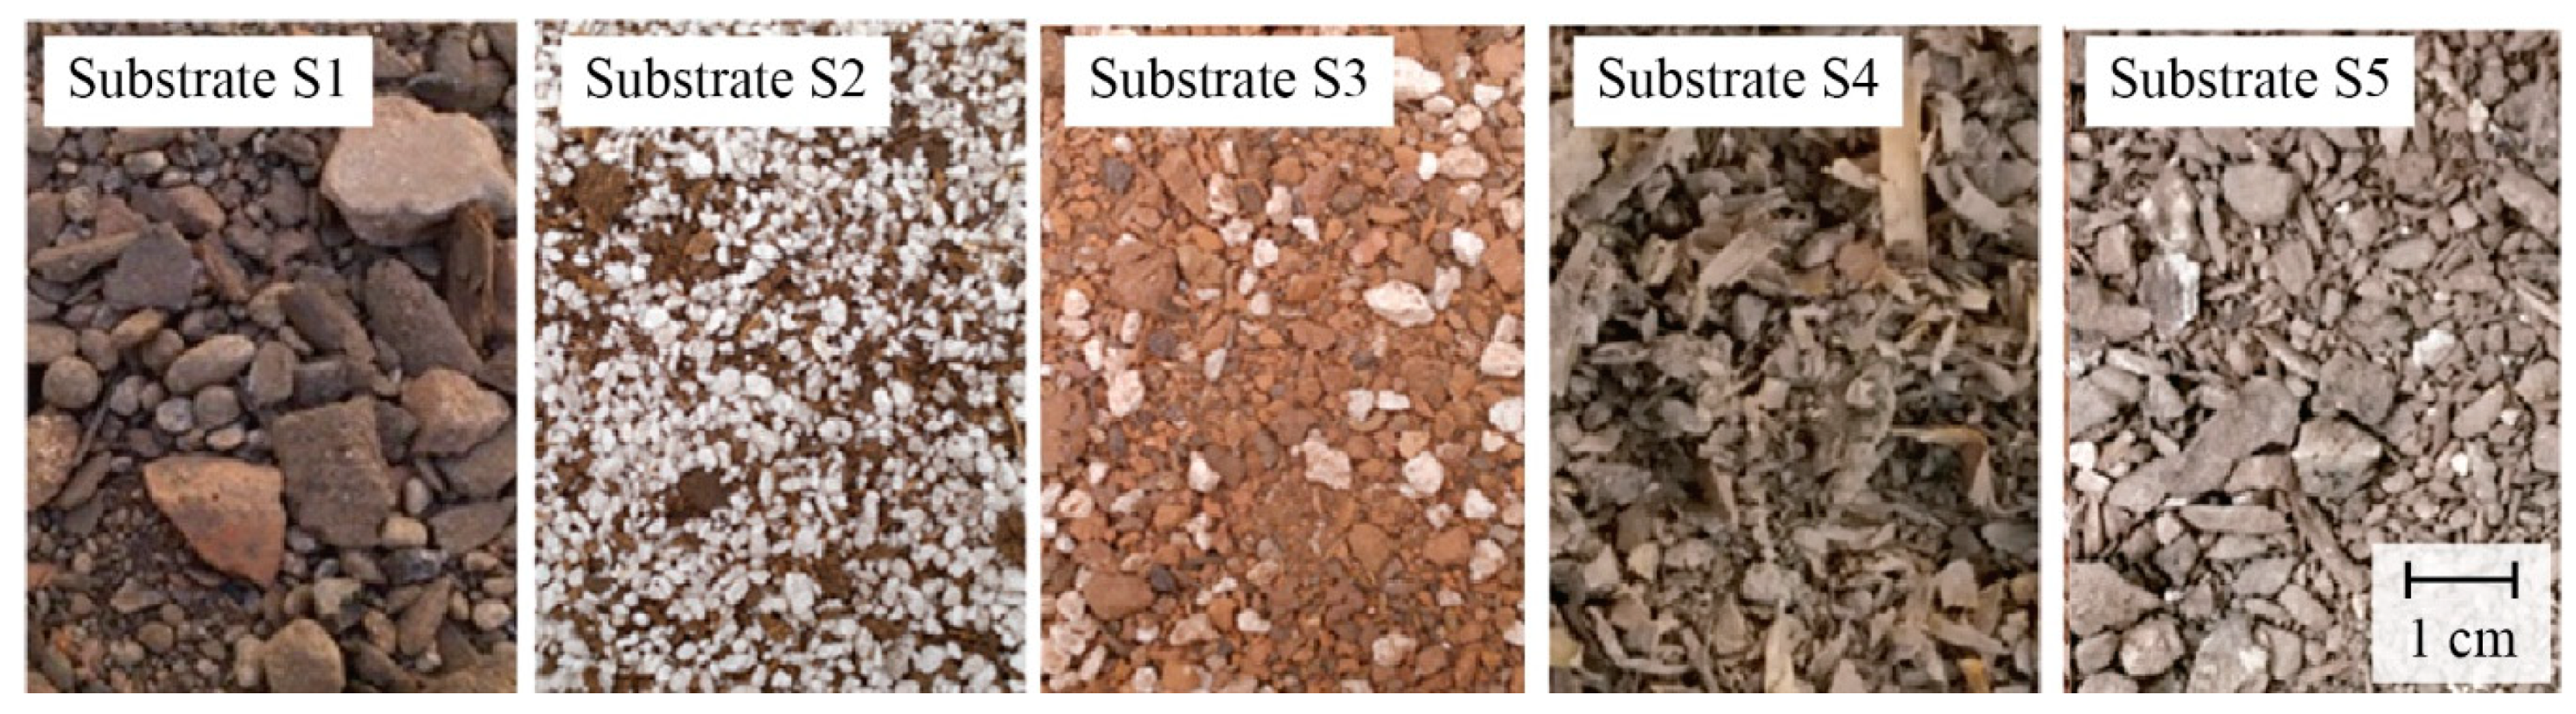
After knowing the thermal conductivity curve as a function of Se in an uncompacted porous media, e.g., a relationship such as that presented in Equation (9), it is of interest to characterize the impact of the compaction in the thermal conductivity curve. We proposed to use different theoretical approaches combined with empirical information to include the impact of compaction on the thermal conductivity curve. The Johansen [39] model can be used to represent λ0. This relationship depends on Se and on the bulk density (ρ) of the media [40]:
λ 0 ( S e ) = ( λ 0 s λ 0 d ) λ e + λ 0 d ,
where λ0s and λ0d are the thermal conductivities in the saturated and the dry states, respectively; and λe is the Kersten number, defined as [39,41]:
λ e = κ S e 1 + ( κ - 1 ) S e ,
where κ is an empirical parameter that depends on the soil type and does not change with ρ [42].
The λ0s is estimated using the following expression [39]:
λ 0 s = λ s o l ( 1 θ s ) λ w θ s ,
where λw is the water thermal conductivity and λsol is the solid particles thermal conductivity. Equation (24) assumes that the porosity of the porous media is similar to its saturated volumetric water content.
The λ0d is determined using the Ball and Arp model [40], which is suitable for any type of soil:
λ 0 d = ( a λ s o l λ a i r ) ρ + λ a i r ρ s ρ s ( 1 a ) ρ ,
where a is an empirical parameter, ρ is the bulk density, ρs is the particle density of the porous media, and λair is the thermal conductivity of air.
The thermal conductivity curve in absence of fluid flow for the compacted porous media, λc(θ), needs some inputs from the hydrodynamic properties: first, to determine λ0s, the θs is required, as shown in Equation (24); and second, the lower and upper bounds of the thermal conductivity curve are related to the θr and θs that also change as compaction occurs. Also, note that the impact of compaction on the λc(θ) is represented through the bulk density that is used to determine λ0d, but also through the change in the θs described in Equation (11), which modifies the λ0s.
The compaction methodology proposed in this investigation required the use of empirical data to determine how the thermal conductivity changed as compaction occurred. First, the thermal conductivity curve must be known for a specific ρ, i.e., the values of λ0(Se), λ0s, and λ0d were known. Combining this information with Equation (22) allowed the Kersten number (λe) to be found for different saturation degrees. Then, Equation (23) was used to find the value of κ that represents the best the λe for each porous media. Recall that κ does not change with ρ [42]. According to Coté and Konrad [41] the value of κ depends on soil type; well-graded gravels and coarse sands have κ ≈ 4.6, silts and clays have κ ≈ 1.9, and peat has a κ ≈ 0.6. In this study, we used the κ value as a fitting parameter to obtain a λe (Se) for each substrate that agreed with the experimental information. Later, Equations (24) and (25) were used to find the value of λsol that matched better the thermal conductivity curve of each porous medium, and to find the value of a that represented the behavior of all the porous media.
The change in the volumetric heat capacity of the porous media as compaction occurs could be readily considered using Equation (10) by modifying the saturated water content as described in Equation (11).

2.4. Substrates

To evaluate the proposed methodology that investigates the impact of compaction on the coupled water and heat flux, empirical information from five substrates was used. The substrates used in this study are those employed by Sandoval et al. [2]. Figure 1 presents photographs of each substrate and Table 1 provides a detailed characterization of their physical properties. These five substrates were chosen because they are commonly used in green roofs (S1–S3), and because they are easily found in the local market (S4,S5). A detailed characterization of the physical, hydrodynamic, and thermal properties of these substrates, for their uncompacted state, is presented elsewhere [2]. For the compacted state, the substrate’s hydrodynamic and thermal properties were estimated using the theory presented in Section 2.2 and Section 2.3.

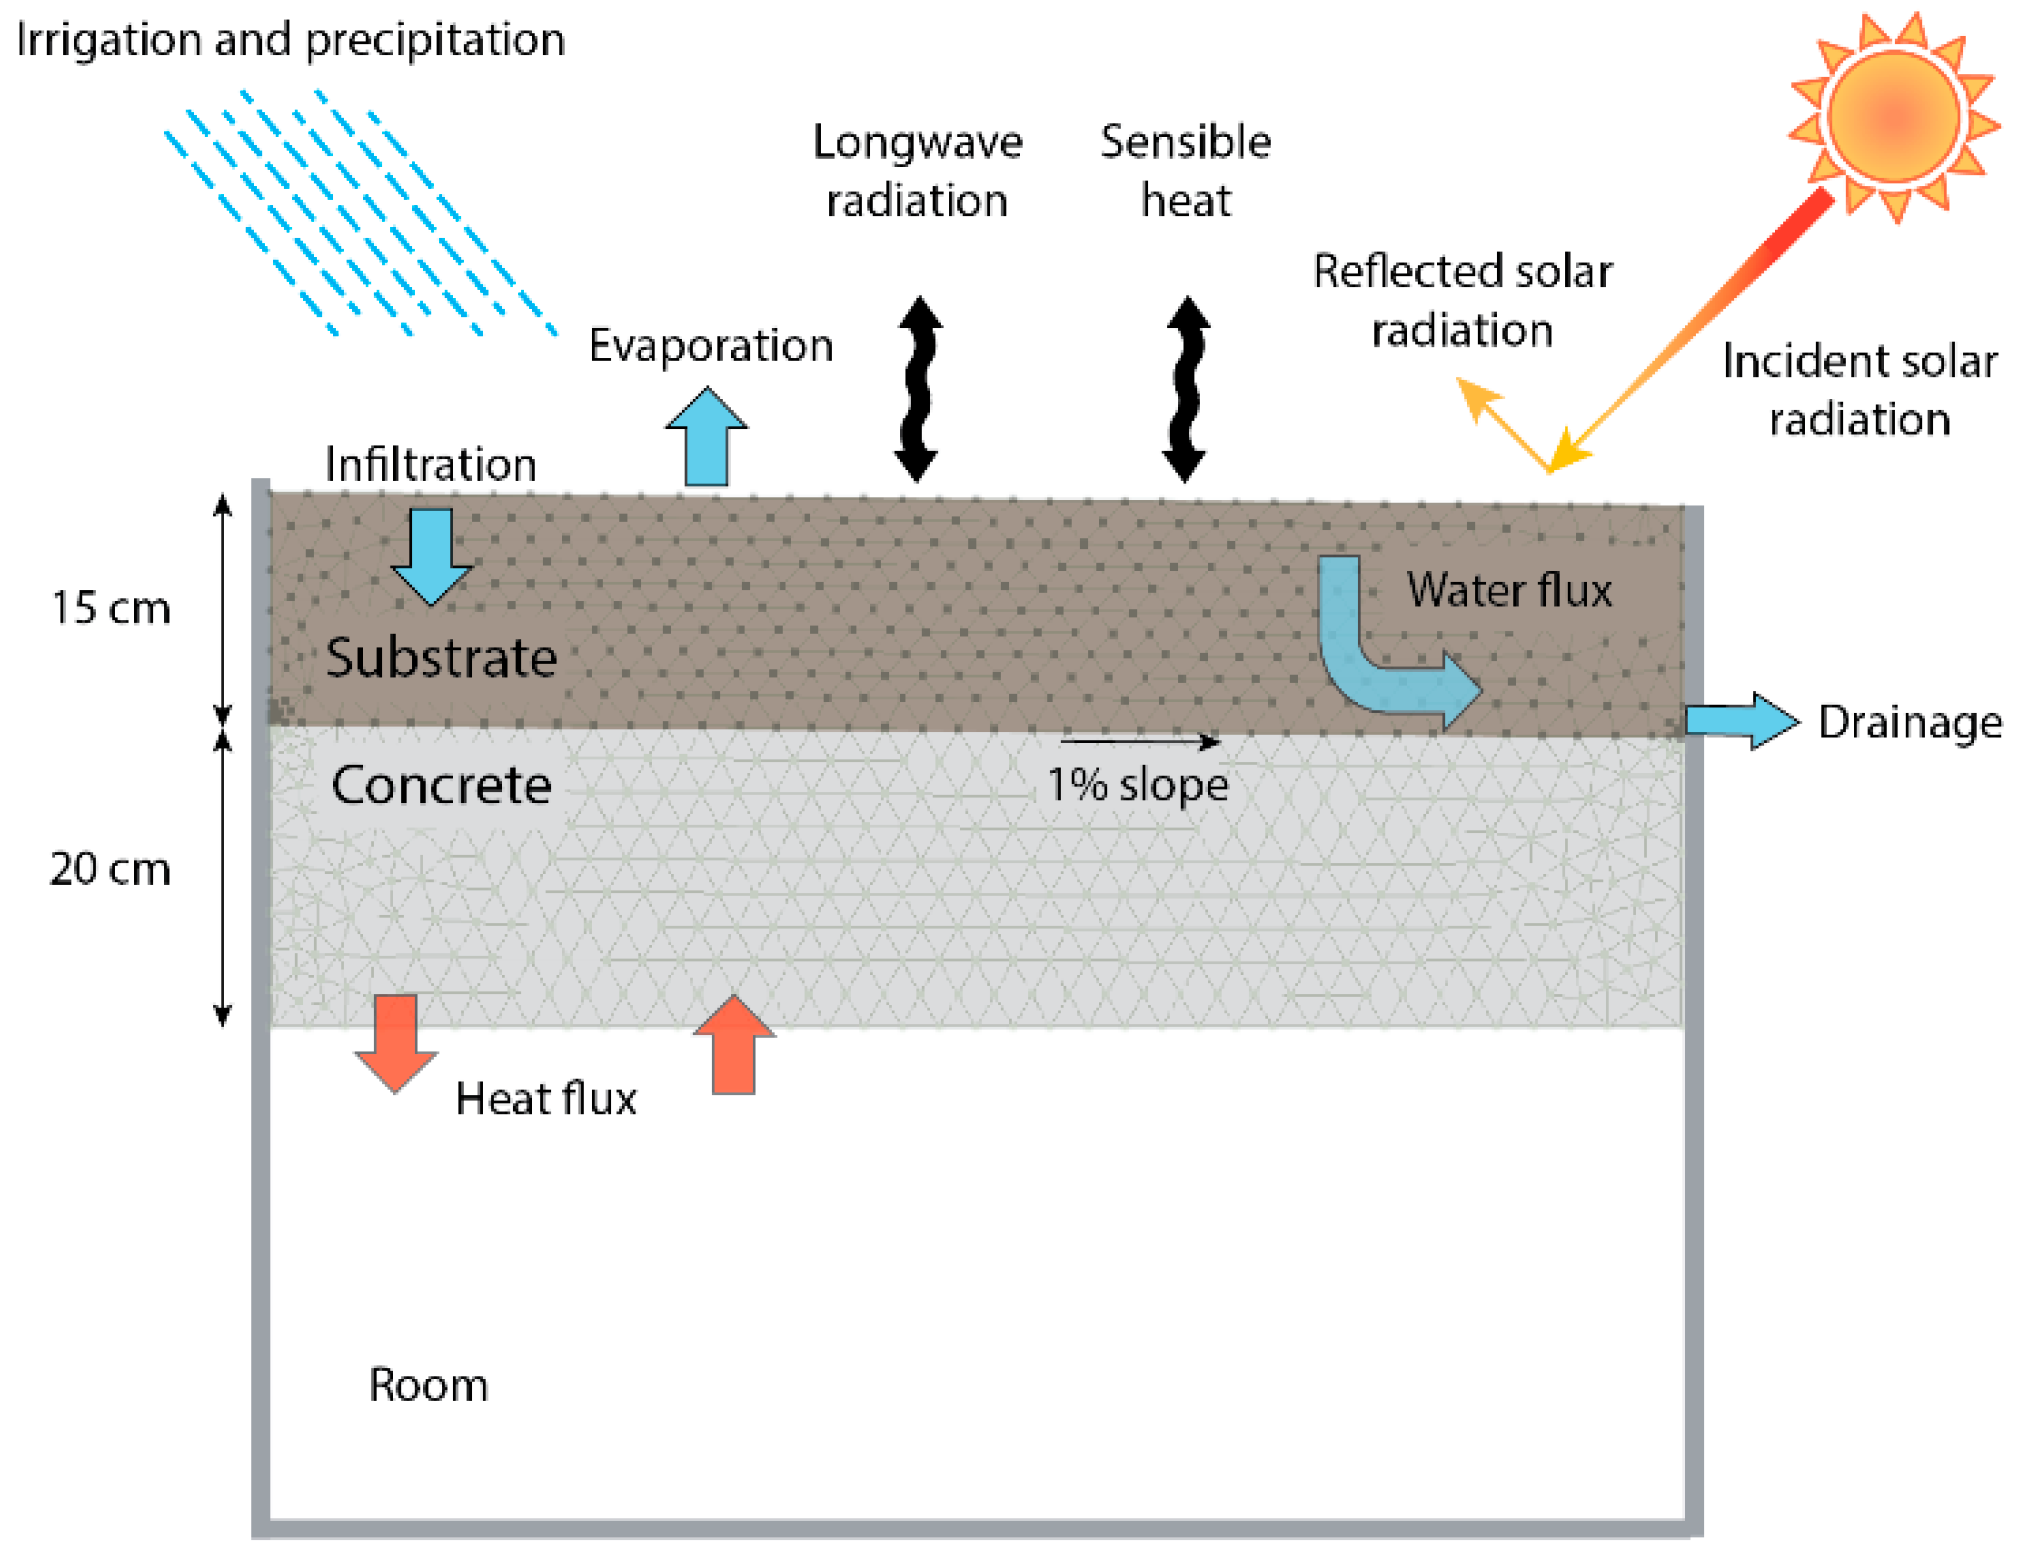
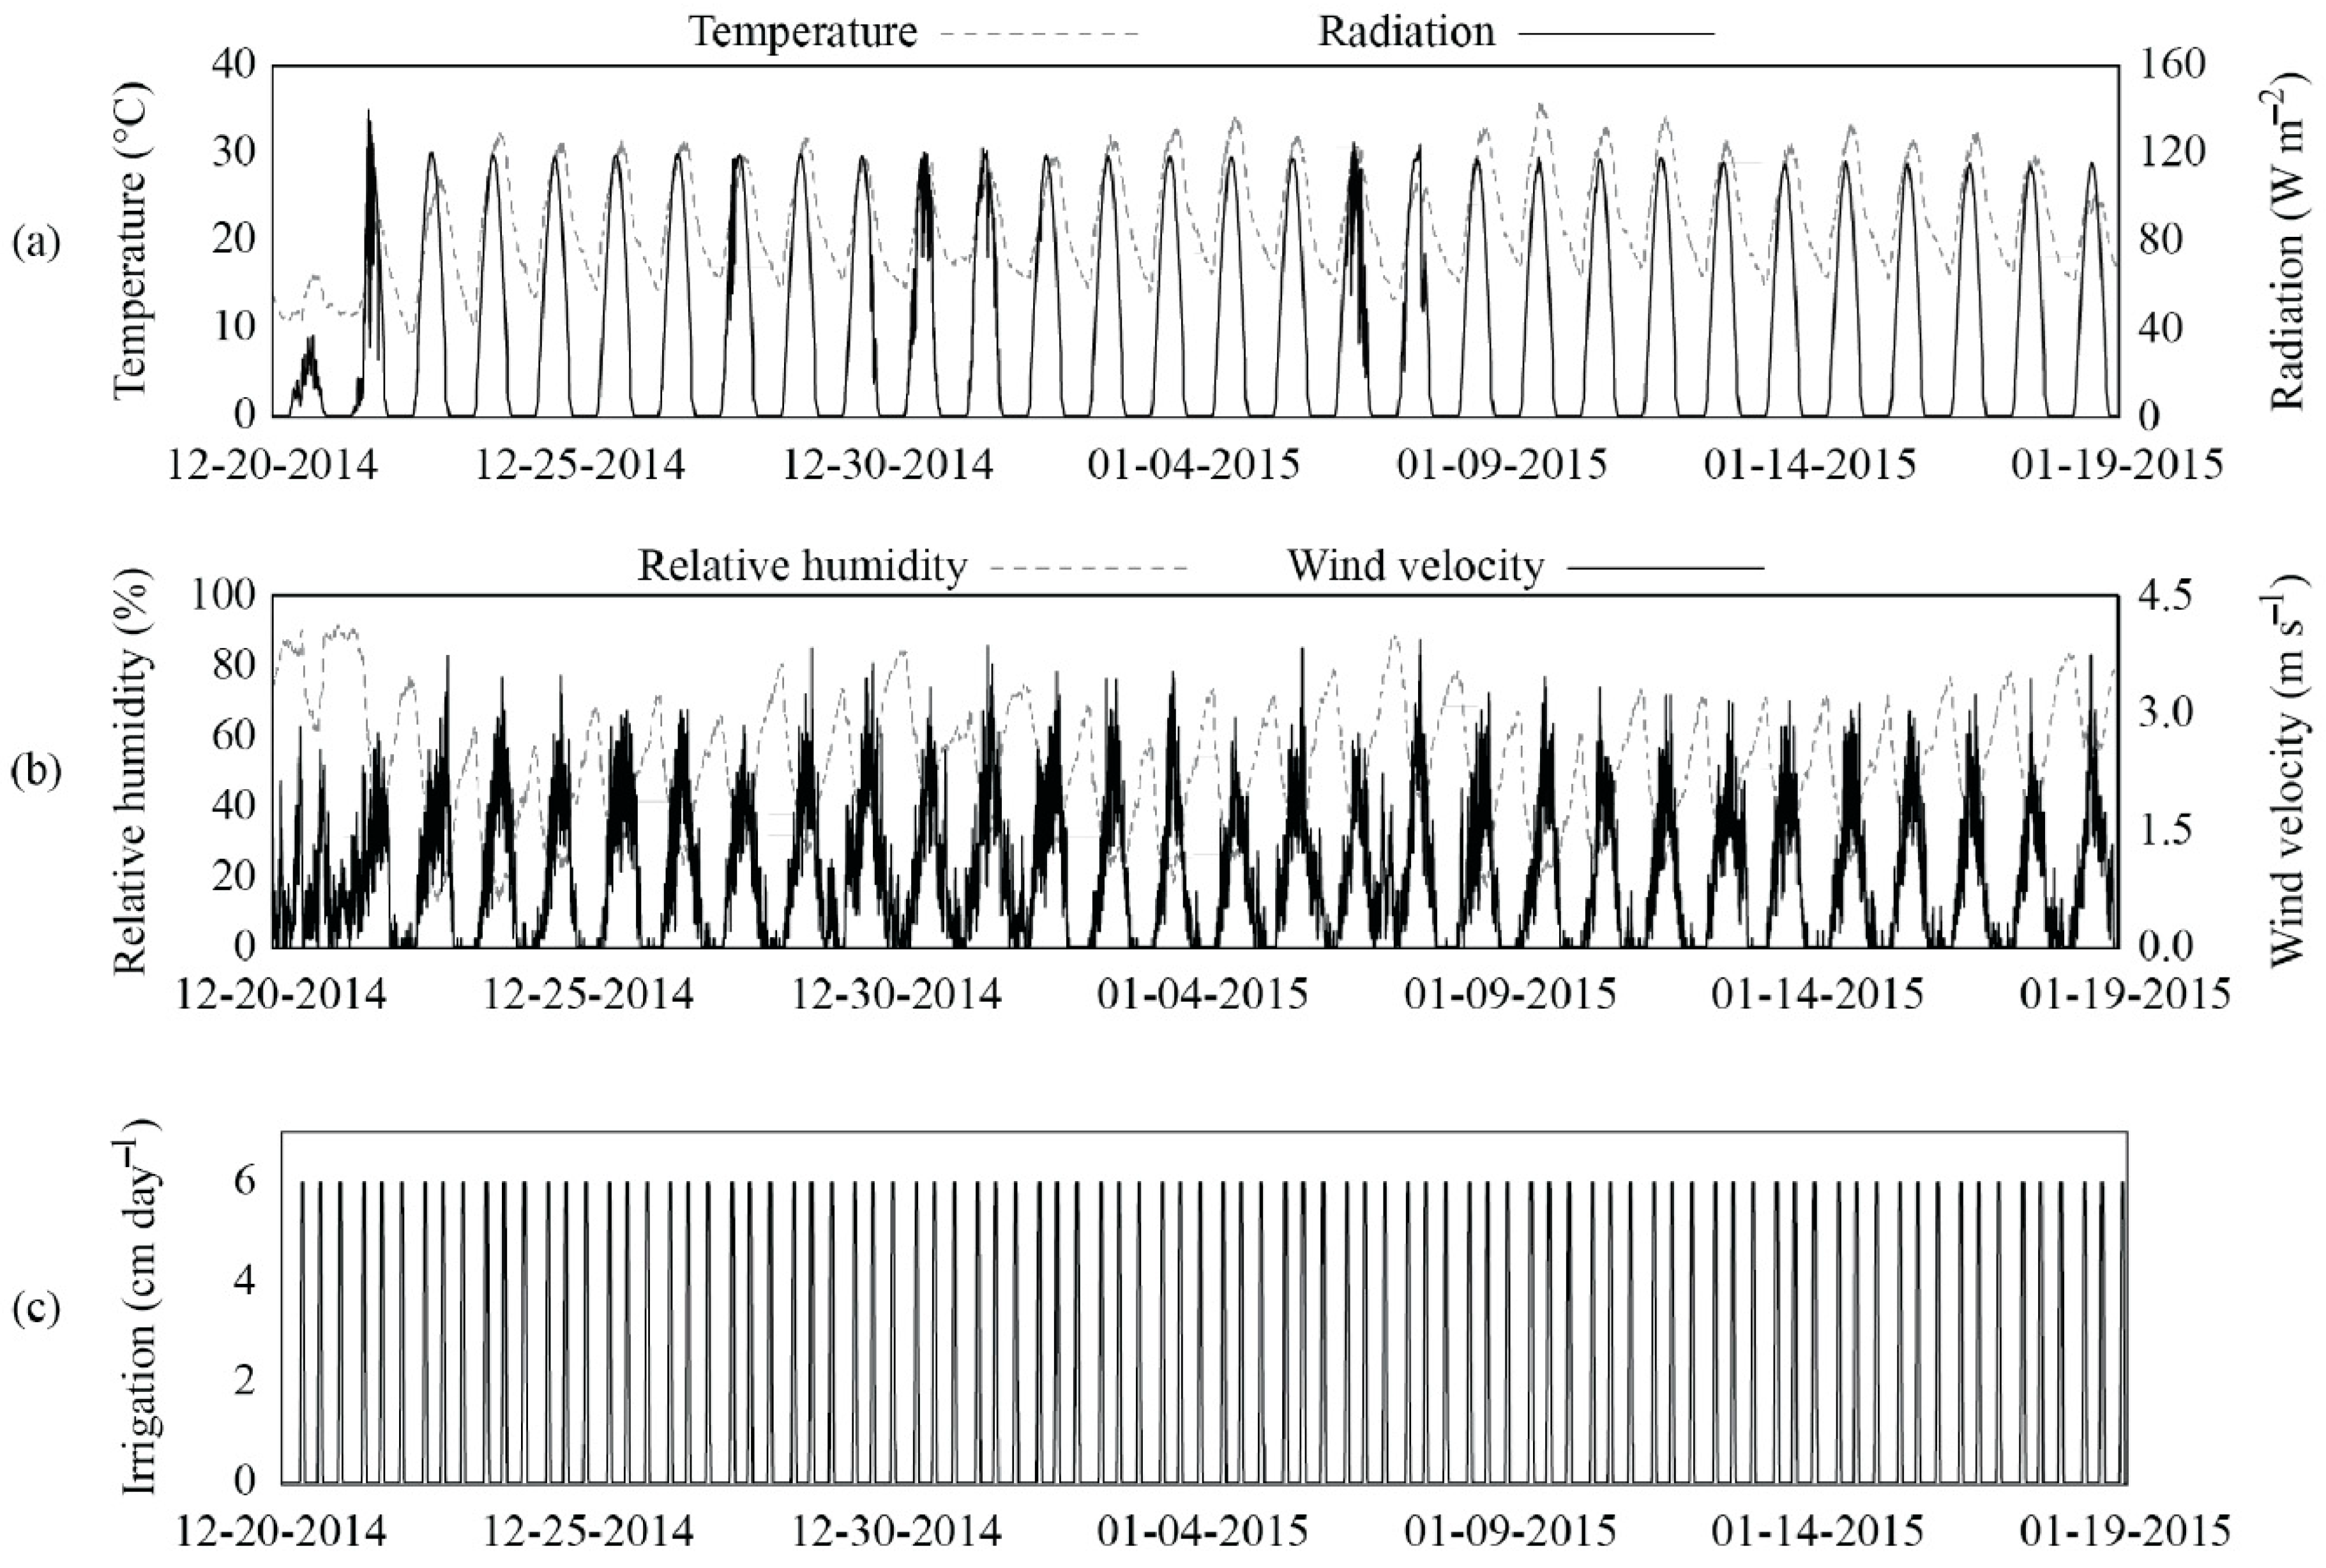
2.5. Influence of Substrate Compaction on the Performance of a Hypothetical Roof System

To assess the effects of substrate compaction on water and heat transport through green roof substrates, we carried out numerical simulations in the same hypothetical roof system investigated by Sandoval et al. [2]. As the simulations reported in this study used the same domain and boundary conditions used by Sandoval et al. [2], here we only provide a brief description of the numerical model.
Figure 2 presents the conceptual model utilized to investigate the effect of substrate compaction on roof functioning. The system was comprised by a substrate on top of a concrete layer that was above a room. As we focused on substrate compaction, and without diminishing the relevance that vegetation has on the overall green roof functioning, the vegetation layer of this system was not included. Instead, we put our attention in analyzing the effect of compaction on green roof functioning when the five substrates investigated in this study were employed. We also put our attention into a green roof located in a semiarid zone during summer (see meteorological conditions in Appendix A), so our results were focused on the response of the hypothetical roof system subject to irrigation for a period with no precipitation, in which it is relevant to know when the green roof begins to drain (the breakthrough time). For this reason, we did not analyze water retention efficiency, peak reduction, and delay of a precipitation event.
The combined water and heat fluxes (Equations (1) and (8)) were solved using the HYDRUS-2D software [43], and considering the uncompacted and compacted hydrodynamic and thermal properties for each simulation. We selected the HYDRUS-2D software to solve the governing equations, instead of more sophisticated simulation software such as EnergyPlus (http://energyplus.net/) or WUFI (https://wufi.de/), because it allows a detailed representation of the hydraulic and thermal processes occurring in the substrates. The uncompacted hydrodynamic properties of the substrates were defined according to the experimental values reported by Sandoval et al. [2], while the compacted properties were determined according to the proposed model. In all the simulations, a uniform and arbitrary initial moisture content of 0.3 cm3 cm−3 was selected. The flow boundary conditions at the top of the domain were defined using the precipitation, irrigation, and evaporation measured at the Laboratory of Vegetative Infrastructure of Buildings at Pontificia Universidad Católica de Chile [1]. The irrigation schedule used 10 mm/day allocated in three pulses per day at 7:00, 14:00, and 22:00 hours (see Appendix A). The lateral boundary conditions were defined as no-flux boundaries, except where the drainage was located. The seepage boundary condition [44] was used to represent the drain, and the interface between the concrete layer (ceiling) and the room was represented with a boundary condition of no flow. The cumulative water flow through the drain was employed to compare the hydraulic functioning of the substrates.
The thermal initial condition was a uniform temperature (=23 °C). At the domain’s top, the surface energy balance was utilized as a boundary condition for heat [44]. The lateral heat transport boundary conditions were adiabatic. The thermal functioning of the system was evaluated by considering that the roof is above a single room with adiabatic walls and floor, and using the cumulative thermal energy (cooling/heating) required to keep the room at 23 °C. This thermal energy balance was estimated as described by Causone et al. [45]. The reader is referred to the work of Sandoval et al. [2] for a detailed description of the simulations under the uncompacted state.

3. Results

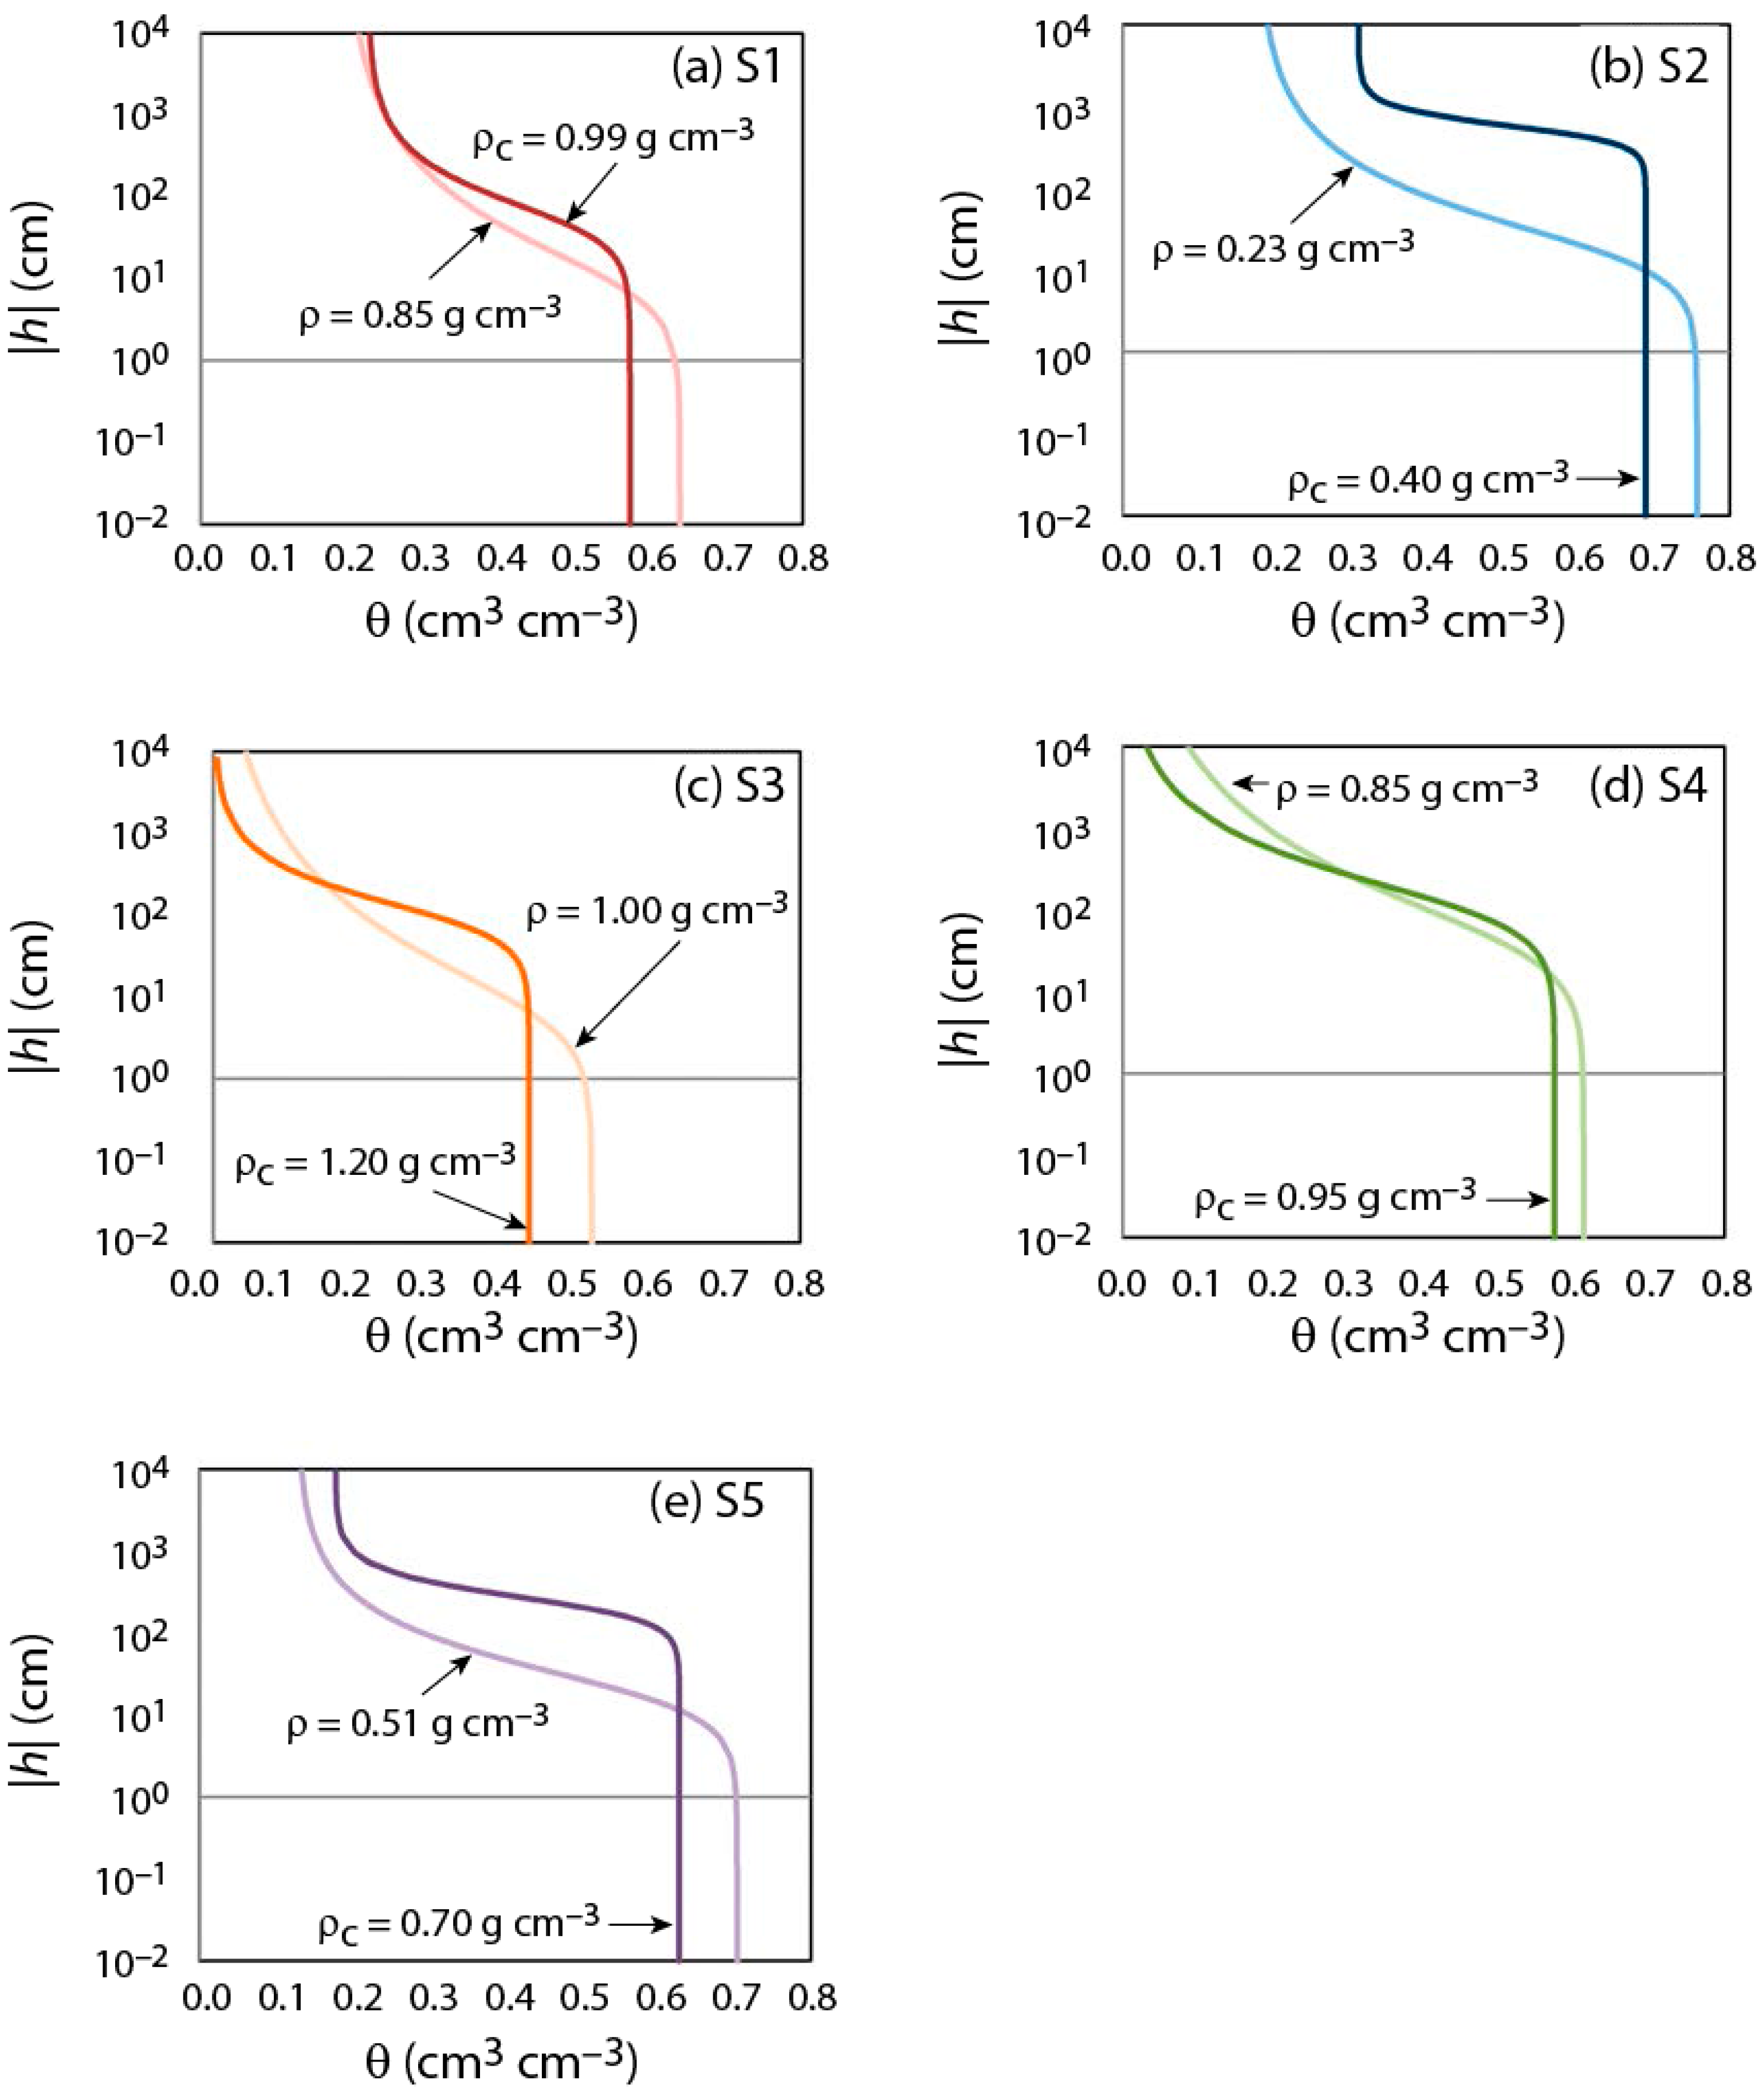
3.1. Impact of Compaction on the Substrate’s Hydrodynamic Properties

Figure 3a–e show the water retention curves of the five substrates using the van Genuchten [30] model for different bulk densities, and Table 2 presents the parameters of the water retention models for the uncompacted and compacted states of the substrates. In general, as compaction occurs, the size of the pores decreased, and capillary forces increased.

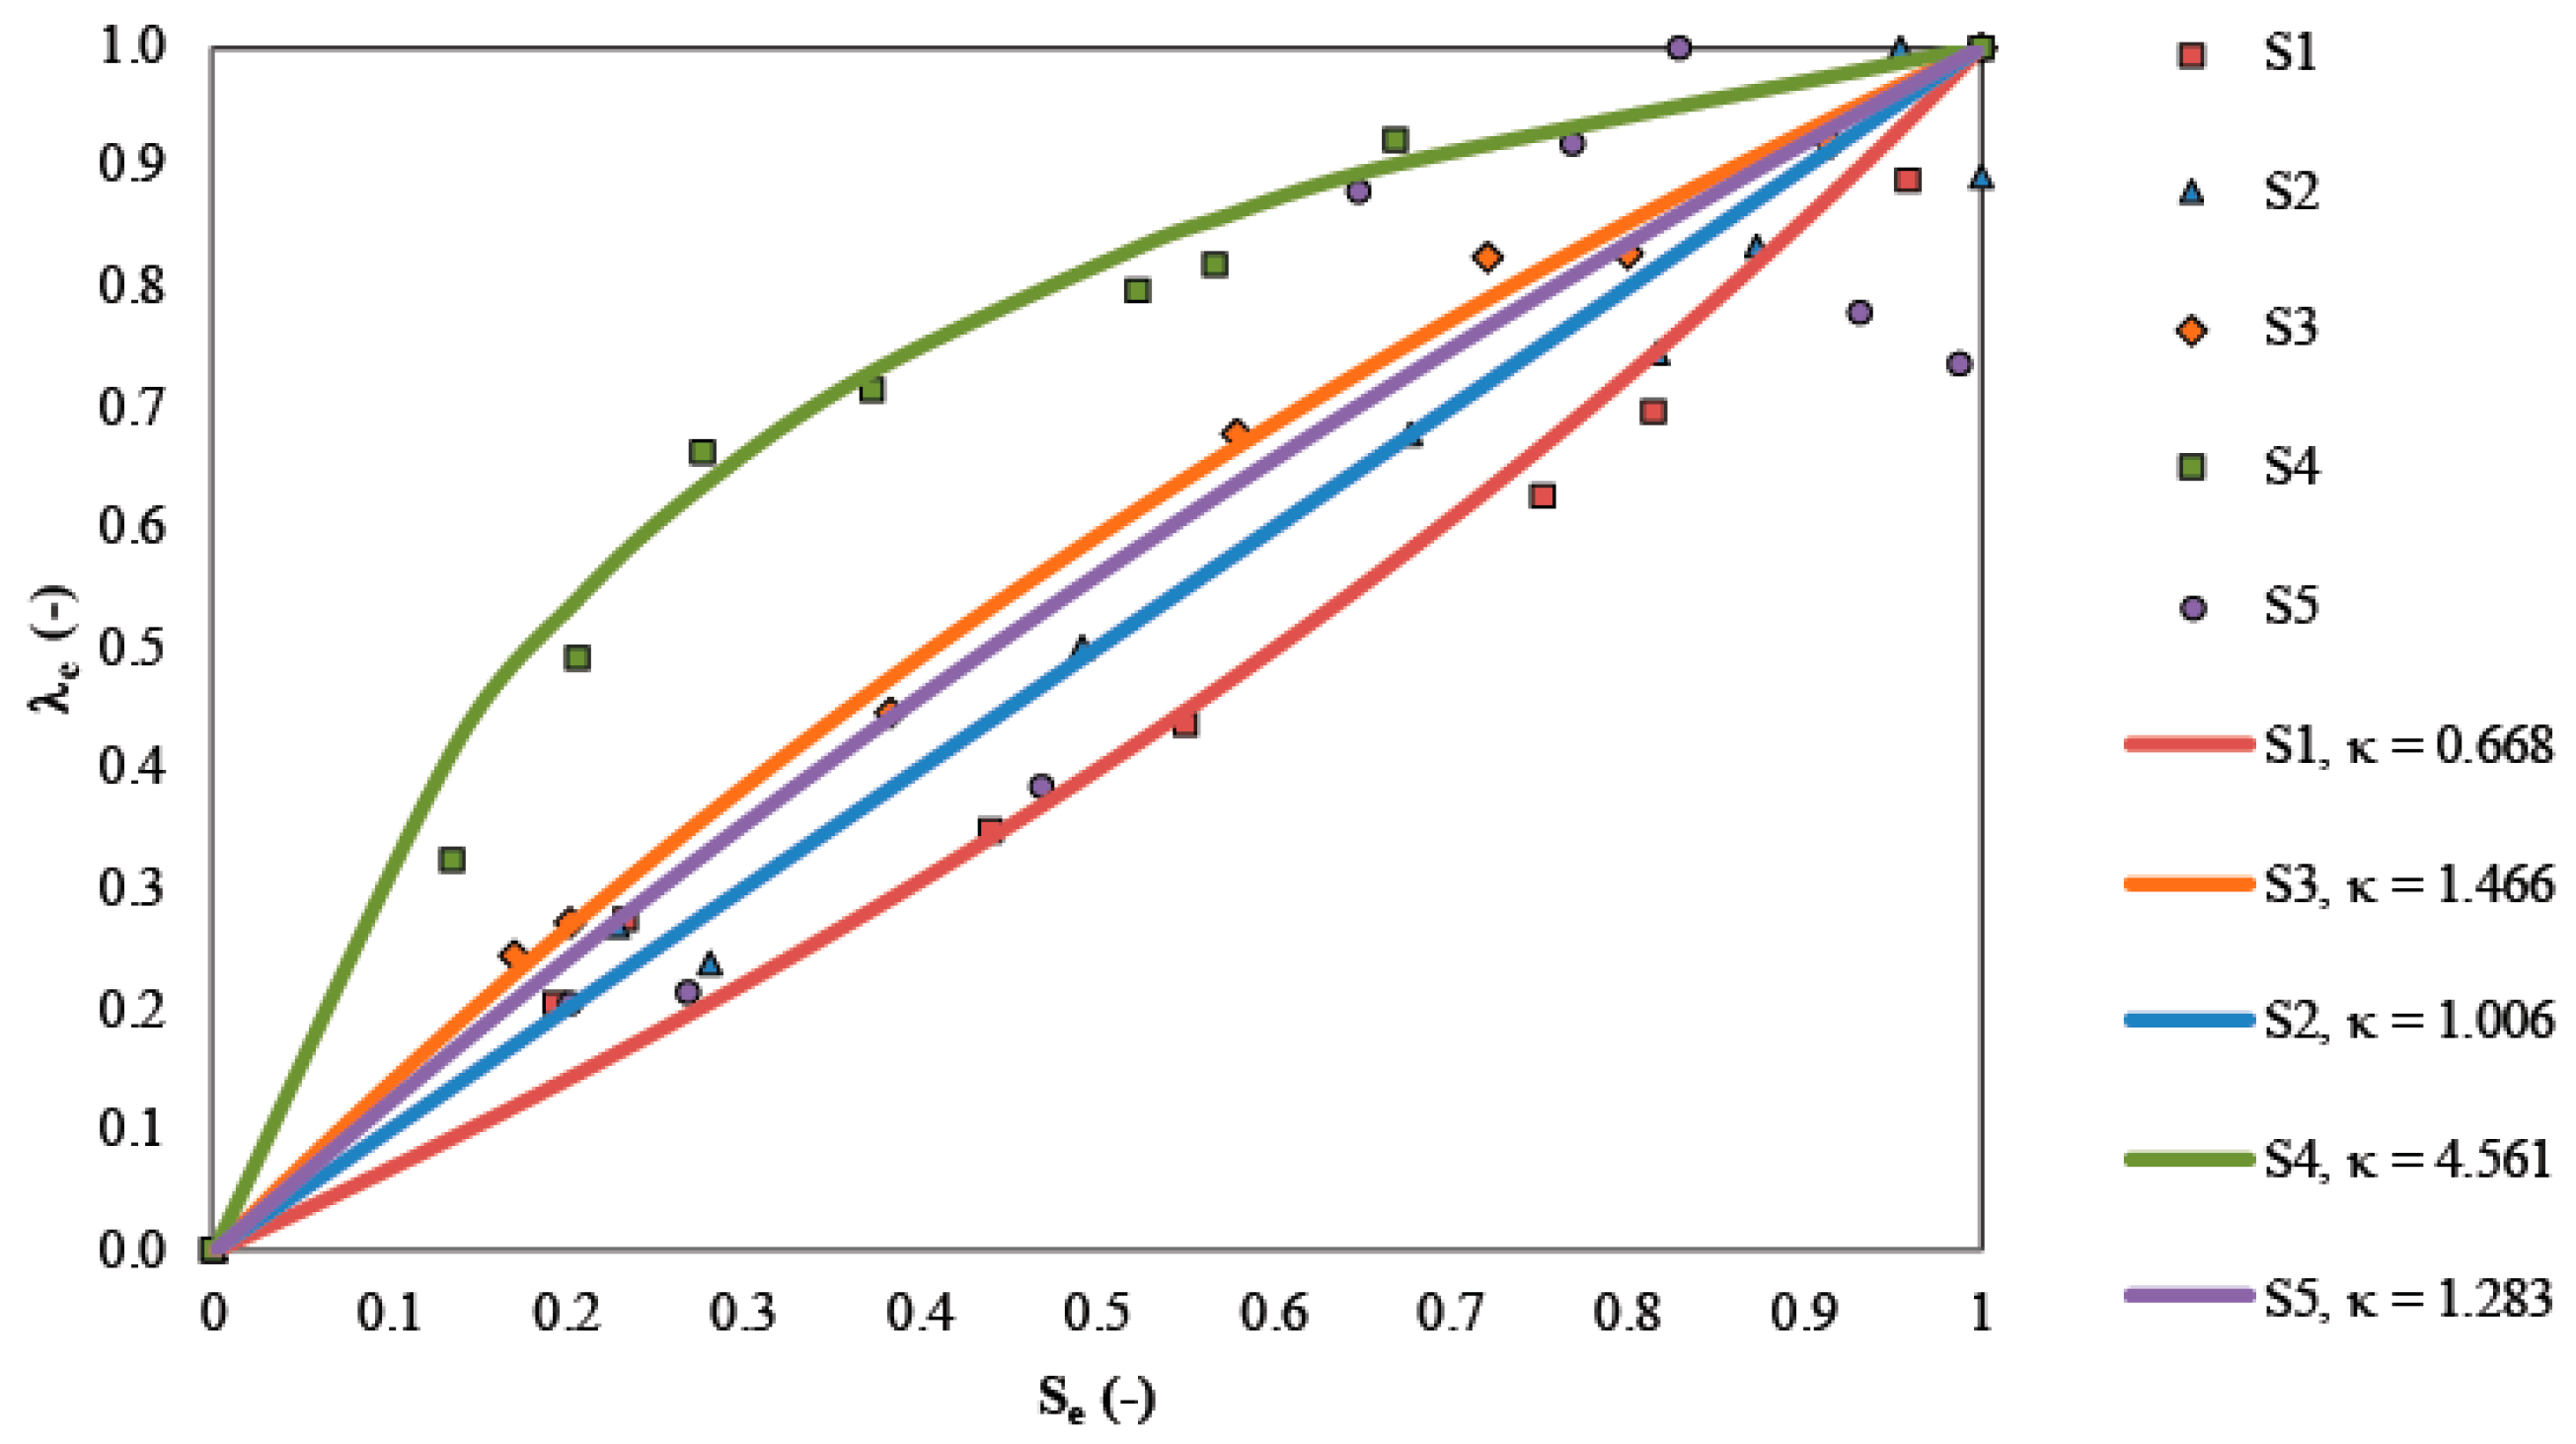
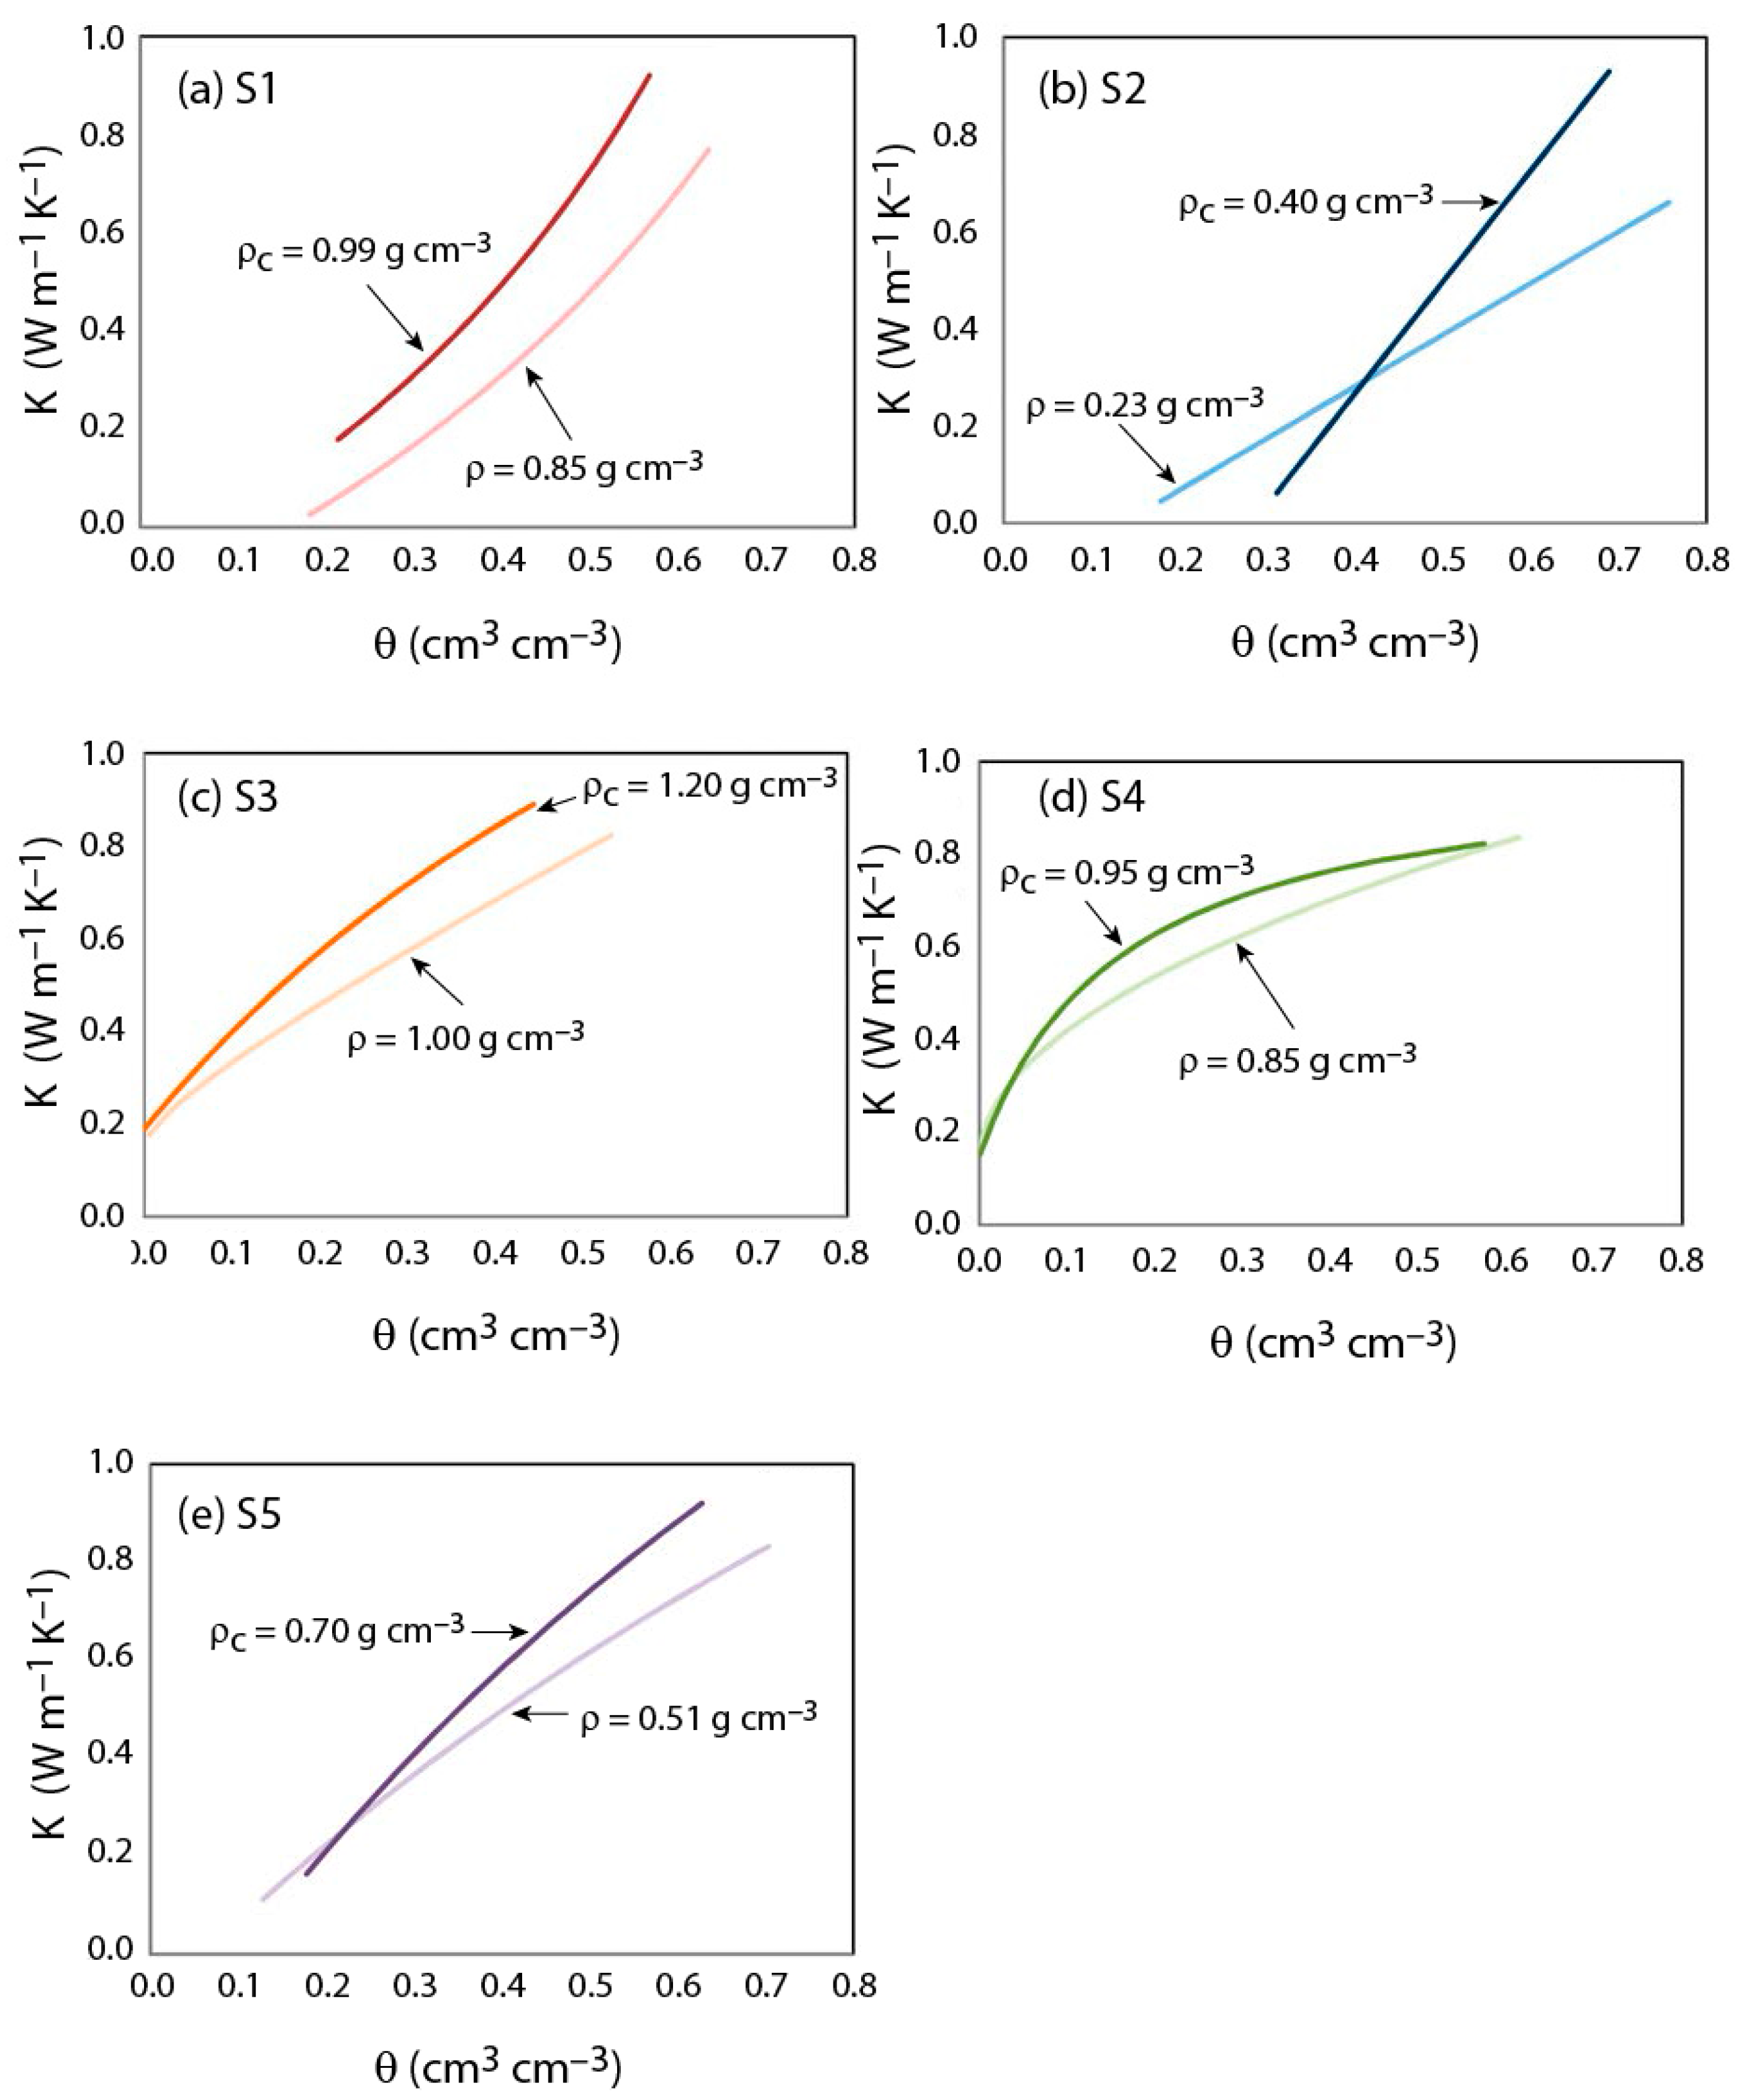
3.2. Impact of Compaction on the Substrate’s Thermal Properties

The parameters of the Chung and Horton model [36]—which was used to describe the thermal conductivity of the different porous media, λ0(θ)—are presented in Table 3.
To find how the thermal conductivity changes as compaction occurs, the first step in our methodology was to determine the λe, λsol, and κ for each substrate, and the a parameter for the set of substrates. Figure 4 presents the λe as a function of the Se for each of the substrates investigated, estimated by fitting Equation (23) to the experimental thermal conductivity data to find the κ parameter for each substrate; and by fixing the a parameter to 0.1614, which yielded a good representation of the experimental values of λ0d (Equation (25)) for all the substrates. In this process, λsol was also fitted to represent correctly the thermal conductivity of each substrate and, in particular, the experimental values of λ0s and λ0d. Table 3 also presents the values of κ and λsol obtained from this fitting process.
Figure 5a–e presents the thermal conductivity of the five substrates for both the uncompacted and the compacted state. In general, for a specific moisture level, as compaction occurred the thermal conductivity of the substrates increased.

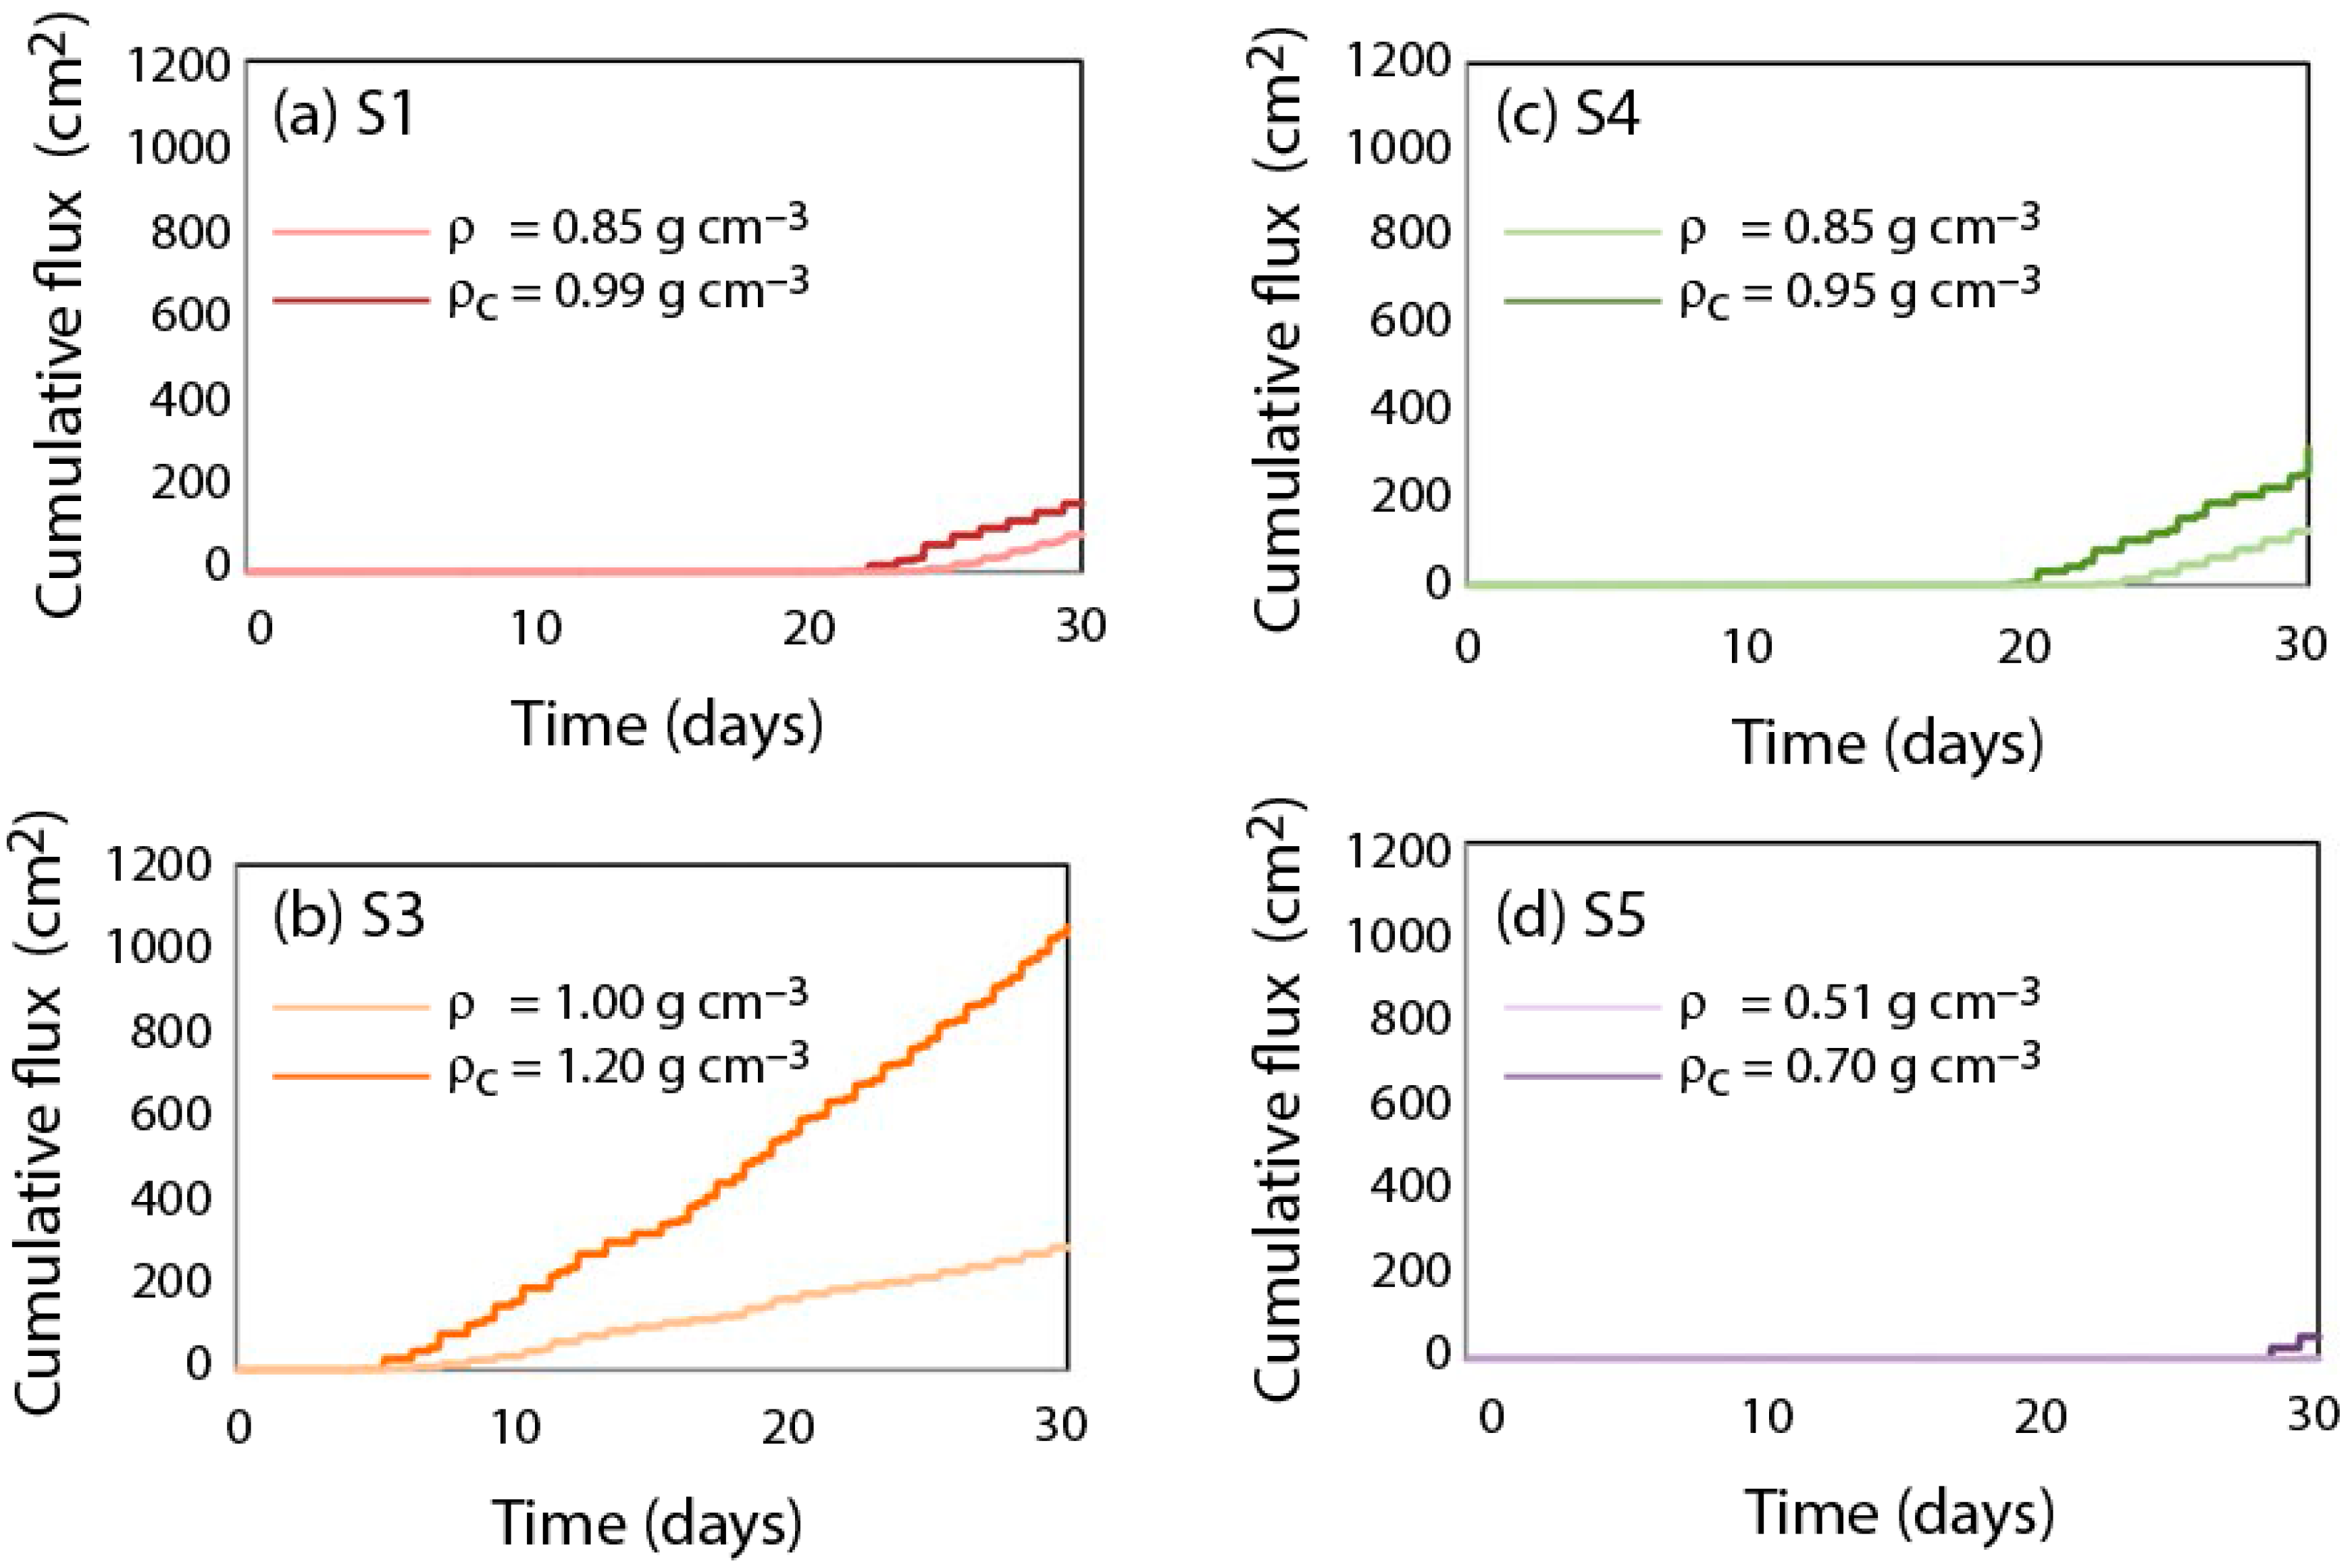
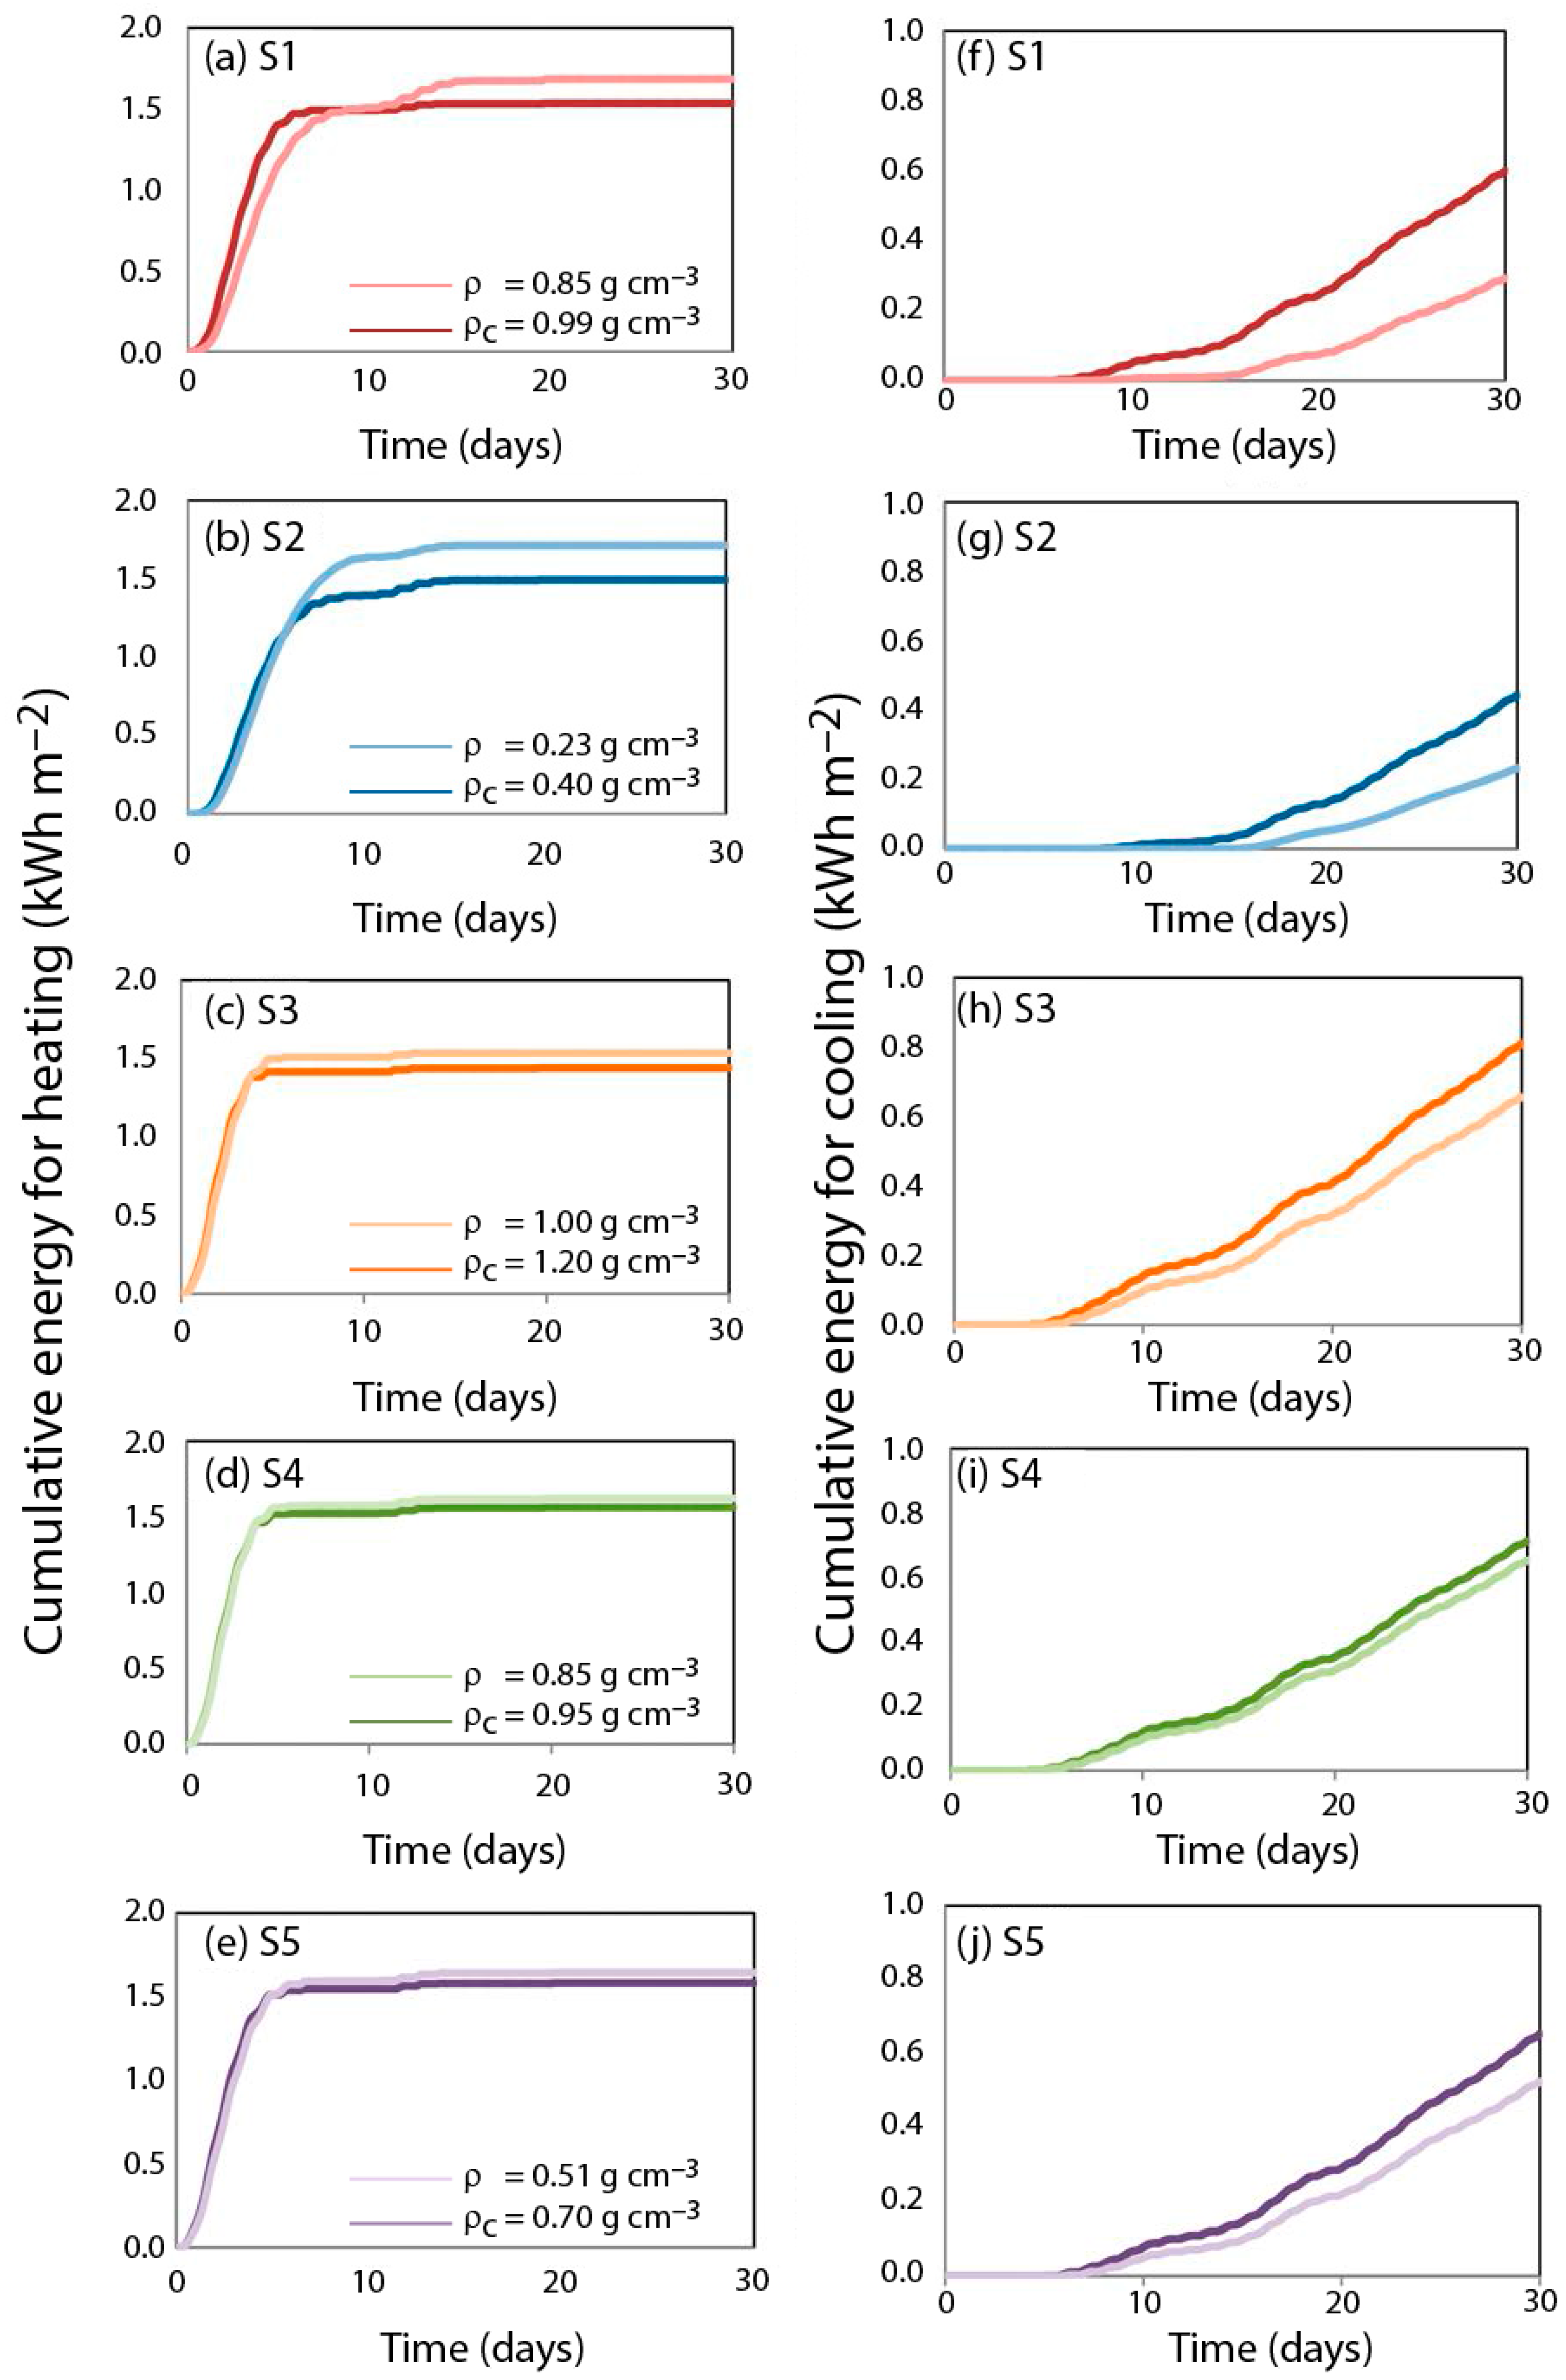
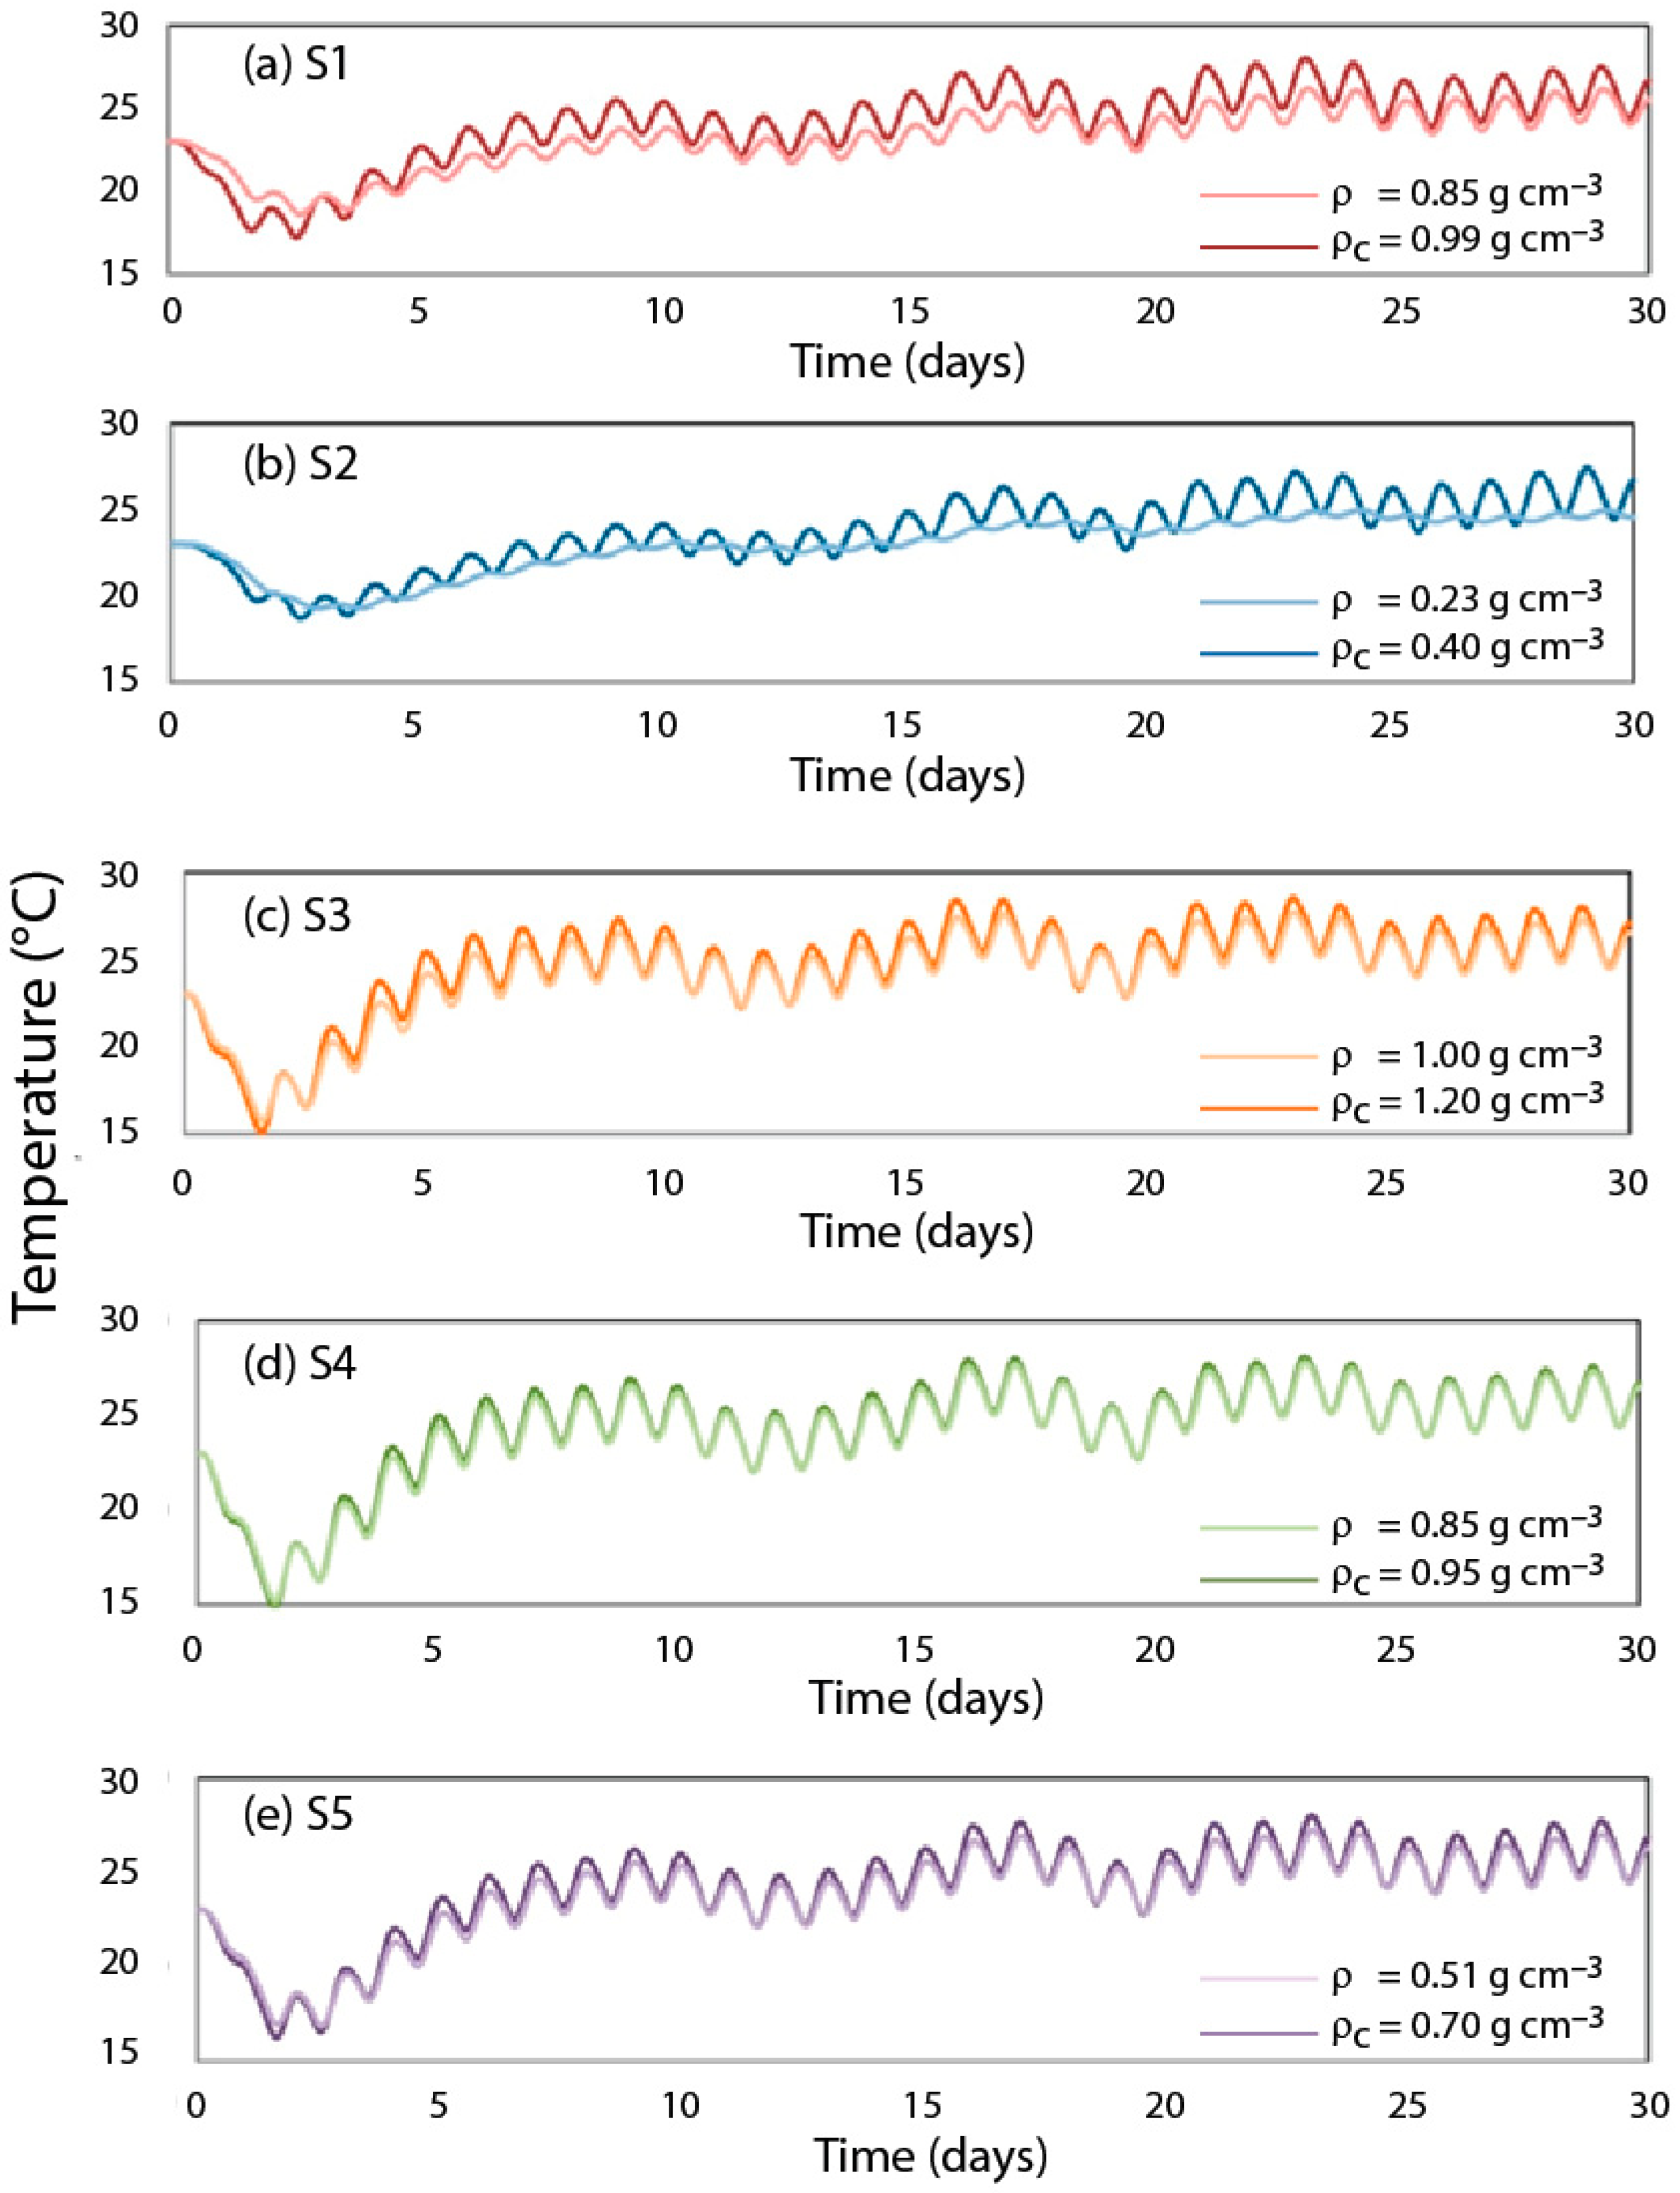
3.3. Influence of Substrate Compaction on the Performance of a Hypothetical Roof System

For conciseness, we solely present the water and heat fluxes exiting the hypothetical roof system. The temporal transition of the volumetric water contents and of the temperatures in the system are presented in Appendix B and Appendix C.
Figure 6a–d shows the cumulative water flux that exits from the bottom of each substrate during the simulations. Light colors correspond to the uncompacted substrate, and dark compacted substrate. The S2 substrate did not reach its total volume storage in either state, so it is not shown.
Figure 7 shows the cumulative thermal energy (heating and cooling) consumed to maintain 23 °C in the room for the entire simulation (30 days). The increment of the thermal daily amplitude, which is the result of substrate compaction, increased the heating and cooling energy due to natural convection. The biggest changes are related to substrates S1 and S2; in both cases the energy for heating was reduced and the cooling energy increased. This behavior occurs due to the mixed effects of the general increment in thermal conductivity with moisture and the high porosity that reduces the vertical diffusion.

4. Discussion

To truly quantify the urbanization negative impacts that a green roof mitigates, a quantitative assessment of each of its components must be performed, and the relevant physical processes must be included in this assessment. One aspect that has been typically neglected is the impact that substrate compaction has on the coupled water and heat fluxes across the roof. In this work, we developed a parametric methodology that used empirical substrate data to consider how compaction changed the substrate’s hydrodynamic and thermal properties.
By analyzing the changes in the water retention curve when the substrate was compacted (Figure 3), it was clear that the pores decreased their size, diminishing the θs and increasing the air-entry pressure (hb = α−1) due to an increase in the capillary forces [37]. These changes in the porous media water retention capacity are consistent with the observations published in the scientific literature [2,15,24,25,46,47]. For instance, in the S2 compacted water retention curve, the hb increased from 17 to 526 cm, while the hb of the S1 substrate increased from 9 to 53 cm. The increases in the hb values were on the same order of magnitude as those reported by Assouline [37]. However, the impact of compaction on the θr was not the same for all the substrates. S1, S2 and S5 showed an increase between 0.05 and 0.07 cm3cm−3 in θr as compaction occurred while S3 and S4 showed an insignificant change. The reason of this change is that the original density values of θr of S3 and S4 were near to zero and the Equation (12) used the original density to determine the compacted values of θr. In addition, the changes in n and small changes in θr drove unexpected retention curves as shown in Figure 3c: the compacted water retention curve of S3 (ρ = 1 g cm−3) intercepted the uncompacted curve (ρ = 1.2 g cm−3) at ~0.15 cm3cm−3, meaning that below this value the water retention decreased. However, as the pore size decreases, an increase in the capillary forces is expected and thus one would expect a general increase in water retention [21]. This phenomenon most likely occurs because the properties of these artificial substrates are very different than those of natural soils, which are the media used to develop the algorithms that predict the effect of compaction on the hydrodynamic properties [37]. Therefore, for substrates S3 and S4 the proposed model may not be the best representation of how compaction influences the hydrodynamic properties. From the results obtained for substrates S1–S5 (Figure 3), we concluded that the proposed method resulted in physically possible values for volumetric water contents that are greater than 0.2 cm3 cm−3.
Regarding the thermal properties, the values of κ were within the range of values reported for natural soils, and were typically in the range reported for silt, clay, and peat [41]. The difference between the κ values obtained for the substrates used in this study and those reported for natural soils are most likely explained by the artificial nature of the substrates. The λsol values depend on the fraction of gravel, sand, silt, clay, and percentage of quartz of each substrate. As a reference, soils with high organic matter have λsol ~0.25 W m−1 K−1, while silty loam soils have λsol ~2.05 W m−1 K−1, and crushed quartz has λsol ~7.2 W m−1 K−1 [42]. The λsol presented in Table 3 ranges between 1.103 and 2.124 W m−1 K−1. The lower values obtained for the λsol of each substrate, compared to natural soils, could be justified by the presence of organic matter and inorganic materials. The λsol values were fitted so the simulated λ0s and λ0d were similar to the experimental measures. This agreement between the simulated and experimental values was achieved in all the substrates except for substrate S2, where the fitted λ0d (0.047 W m−1 K−1) was lower than the measured λ0d (0.101 W m−1 K−1). However, the fitted and measured λ0s of this substrate agreed with a difference of ~1%.
In general, for a specific moisture level, as compaction occurs the thermal conductivity of the substrates increase. This behavior is consistent with the findings of other investigations [18,20] and occurs because as the substrate is compacted, there is more physical contact between the solid particles, which increase thermal conduction [20,24,25,35]. Also, the magnitude of the thermal conductivity is similar to that presented in the literature [15,20]. Figure 5a–e also shows that substrates S2, S3, and S5 present a linear increase of thermal conductivity with moisture, contrary to the non-linear behavior observed in substrates S1 and S4. In general, the impact of compaction on the thermal conductivity curve is more relevant in the saturated zone of the curve, i.e., when Se approaches 1. For example, in substrate S2 the λ0s increased by 0.17 W m−1 K−1 (~30% increase). In the dry zone of the curve, i.e., when Se approaches 0, the substrates’ λ0d presented slight increases, except for substrate S1, which exhibited an increment of 0.15 W m−1 K−1. Similar effects are reported in other investigations, where the thermal conductivity curves of different soils shows increases of 0.15 and of 0.4 W m−1 K−1 for λ0d and λ0s when the soil is compacted [18]. However, previous investigations do not account for the hydrodynamic effects of compaction on the conductivity curves. The addition of the hydrodynamic properties on the compaction method could be clearly seen in substrates S1 and S2, as shown in Figure 5a,b. The highest change between the uncompacted and compacted thermal conductivity curves occurred in substrates S1 and S2. In S1, the increase in thermal conductivity was similar in all the range of the curve; contrary to what was observed for substrate S2, where the increment near the saturated part was too large while the increment near the dry part of the curve was too small. The small increment of the dry thermal conductivity in substrate S2 was due to its very low bulk density (Equation (25)). In addition, the large change of density caused a large increment in θr (0.23 to 0.40 cm3 cm−3) (Equation (12)). As a result, the compacted and uncompacted curves intersected.
Regarding the hydrodynamic conditions through the hypothetical green roof, our results showed that compaction reduced the amplitude of the fluctuations in the volumetric water content daily cycles (see Appendix B). Also, the cumulative water that exits the roof (Figure 6) suggested that the breakthrough time occurred earlier in the compacted substrates, most likely due to a reduction in the pore spaces. After compaction, the reduction in the breakthrough time of the substrates ranged between one hour (S3) and three days (S4). This result highlights the nonlinearity effect that compaction has on water fluxes. In all the substrates the amount of water that drains the roof increased, especially in the S3 substrate where the cumulative water flux increased by more than three times. This significant increase in the cumulative water flux was the result of a decrease in the pore spaces and the changes in the response of each substrate to the atmospheric conditions.
The comparison among the thermal conductivity curves of the five substrates in the uncompacted and compacted state—near to their maximum densities as shown in Table 1—can help to understand how the heat fluxes change through time in a green roof (Figure 7). Before compaction, the substrates with higher thermal conductivity were S3 and S4 (Figure 5). After compaction, the same pattern was observed, except when all the substrates were saturated. At this point, all the substrates reached thermal conductivity values of ~0.9 W m−1 K−1. In the case of the S2 substrate, the saturated thermal conductivity increased from 0.65 (uncompacted state) to 0.93 W m−1 K−1 (compacted state). In addition, the S2 substrate had the lowest thermal conductivity values for the entire range of moisture for both the uncompacted and compacted state. On the other hand, after compaction, the thermal conductivity of substrates S1 and S5 presented similar values for the entire range of volumetric water content. The numerical simulations allow the comparison of the resulting thermal behavior of the substrates (see also Appendix C). It can be seen in Figure 7 that the energy required for heating and cooling for substrate S2 was smaller than that for substrates S1 and S5. Therefore, substrate S2 was more effective in reducing the vertical heat diffusion when compaction occurred. As explained by Sandoval et al. [2], the effect of the volumetric air content on the reduction of the heat diffusion is very important. In the simulations presented in this work, the S2 substrate presented a low average water content (i.e., the pore spaces have more air than water) since the substrate never reached saturation.

5. Conclusions

In this study, a new methodology to understand how compaction affects the hydrodynamic and thermal properties of a porous medium was developed. This methodology was used to investigate the effects of compaction on the coupled water and heat transport in green roof substrates through numerical simulations. The results showed that as the substrate was compacted, the pore-size of the substrates was reduced. As a result, the capillary forces increased and the water storage volume decreased. These results agree with other investigations performed in natural soils. However, because the foundations of the new methodology are based on compaction methods developed for natural soils that have higher residual water contents and bulk densities compared to the artificial substrates, the new approach failed to produce reasonable results for some substrates. For instance, for substrates S3 and S4 the methodology predicted compacted residual water contents that were lower than those of the uncompacted state. For this reason, the proposed method could be used for green roof substrates that present residual volumetric water contents larger than 0.05 cm3 cm−3.
Regarding the substrate’s thermal properties, the thermal conductivity curves increased their values as the bulk density increased. This increase in the thermal conductivity occurred because there was more physical contact between the solid particles of the media. The effect of compaction on the thermal conductivity curve was more relevant in the saturated part of the curves for all the substrates. Also, when considering that compaction also affects the hydrodynamic properties of the substrates, the variations of the thermal conductivity curve are now restricted to the new limits of moisture, which reduces the possible fluctuations of the thermal conductivity. When the substrates have a very low bulk density (<0.5 g cm−3), the proposed method can present problems, so care must be taken when analyzing the results.
The numerical simulations showed that the water and thermal behaviors of the roof system changed with compaction, reducing the amplitude of the fluctuations in the volumetric water content daily cycles, increasing the average water content and reducing the breakthrough time of the green roof substrates.
When comparing the overall thermal behavior within the substrates studied, the S2 substrate reduced the vertical heat diffusion through the roof. Compaction changes the thermal behavior of the green roof substrates in different ways for each substrate due to the dependence of the air, water, and soil fraction of each substrate. The results showed that compaction affected the coupled water and heat fluxes in a hypothetical green roof. However, the compaction methodology needs an experimental validation for artificial substrates that have low bulk densities and residual water contents. Future research should focus on performing an appropriate experimental validation of this methodology to further confirm the results from the numerical simulations.

Author Contributions

Conceptualization, methodology, writing original draft, review and editing, F.S. and V.S.; Formal analysis and investigation, V.S.; Supervision, F.S.

Funding

This research and the APC were funded by the Comisión Nacional de Investigación Científica y Tecnológica (CONICYT), by grant CONICYT/FONDECYT/1170850.

Acknowledgments

The authors thank the Centro de Desarrollo Urbano Sustentable (CEDEUS—CONICYT/FONDAP/15110020) and the Centro de Excelencia en Geotermia de los Andes (CEGA—CONICYT/FONDAP/15090013) for supporting this investigation.

Conflicts of Interest

The authors declare no conflict of interest and declare that the funders had no role in the design of the study; in the collection, analyses, or interpretation of data; in the writing of the manuscript, or in the decision to publish the results.

Appendix A

Figure A1 shows the meteorological and irrigation data used to drive the numerical simulations.
Figure A1. Meteorological and irrigation data used to drive the numerical simulations: (a) ambient temperature and solar radiation; (b) relative humidity and wind velocity; and (c) irrigation rate.
Applsci 09 04697 g0a1

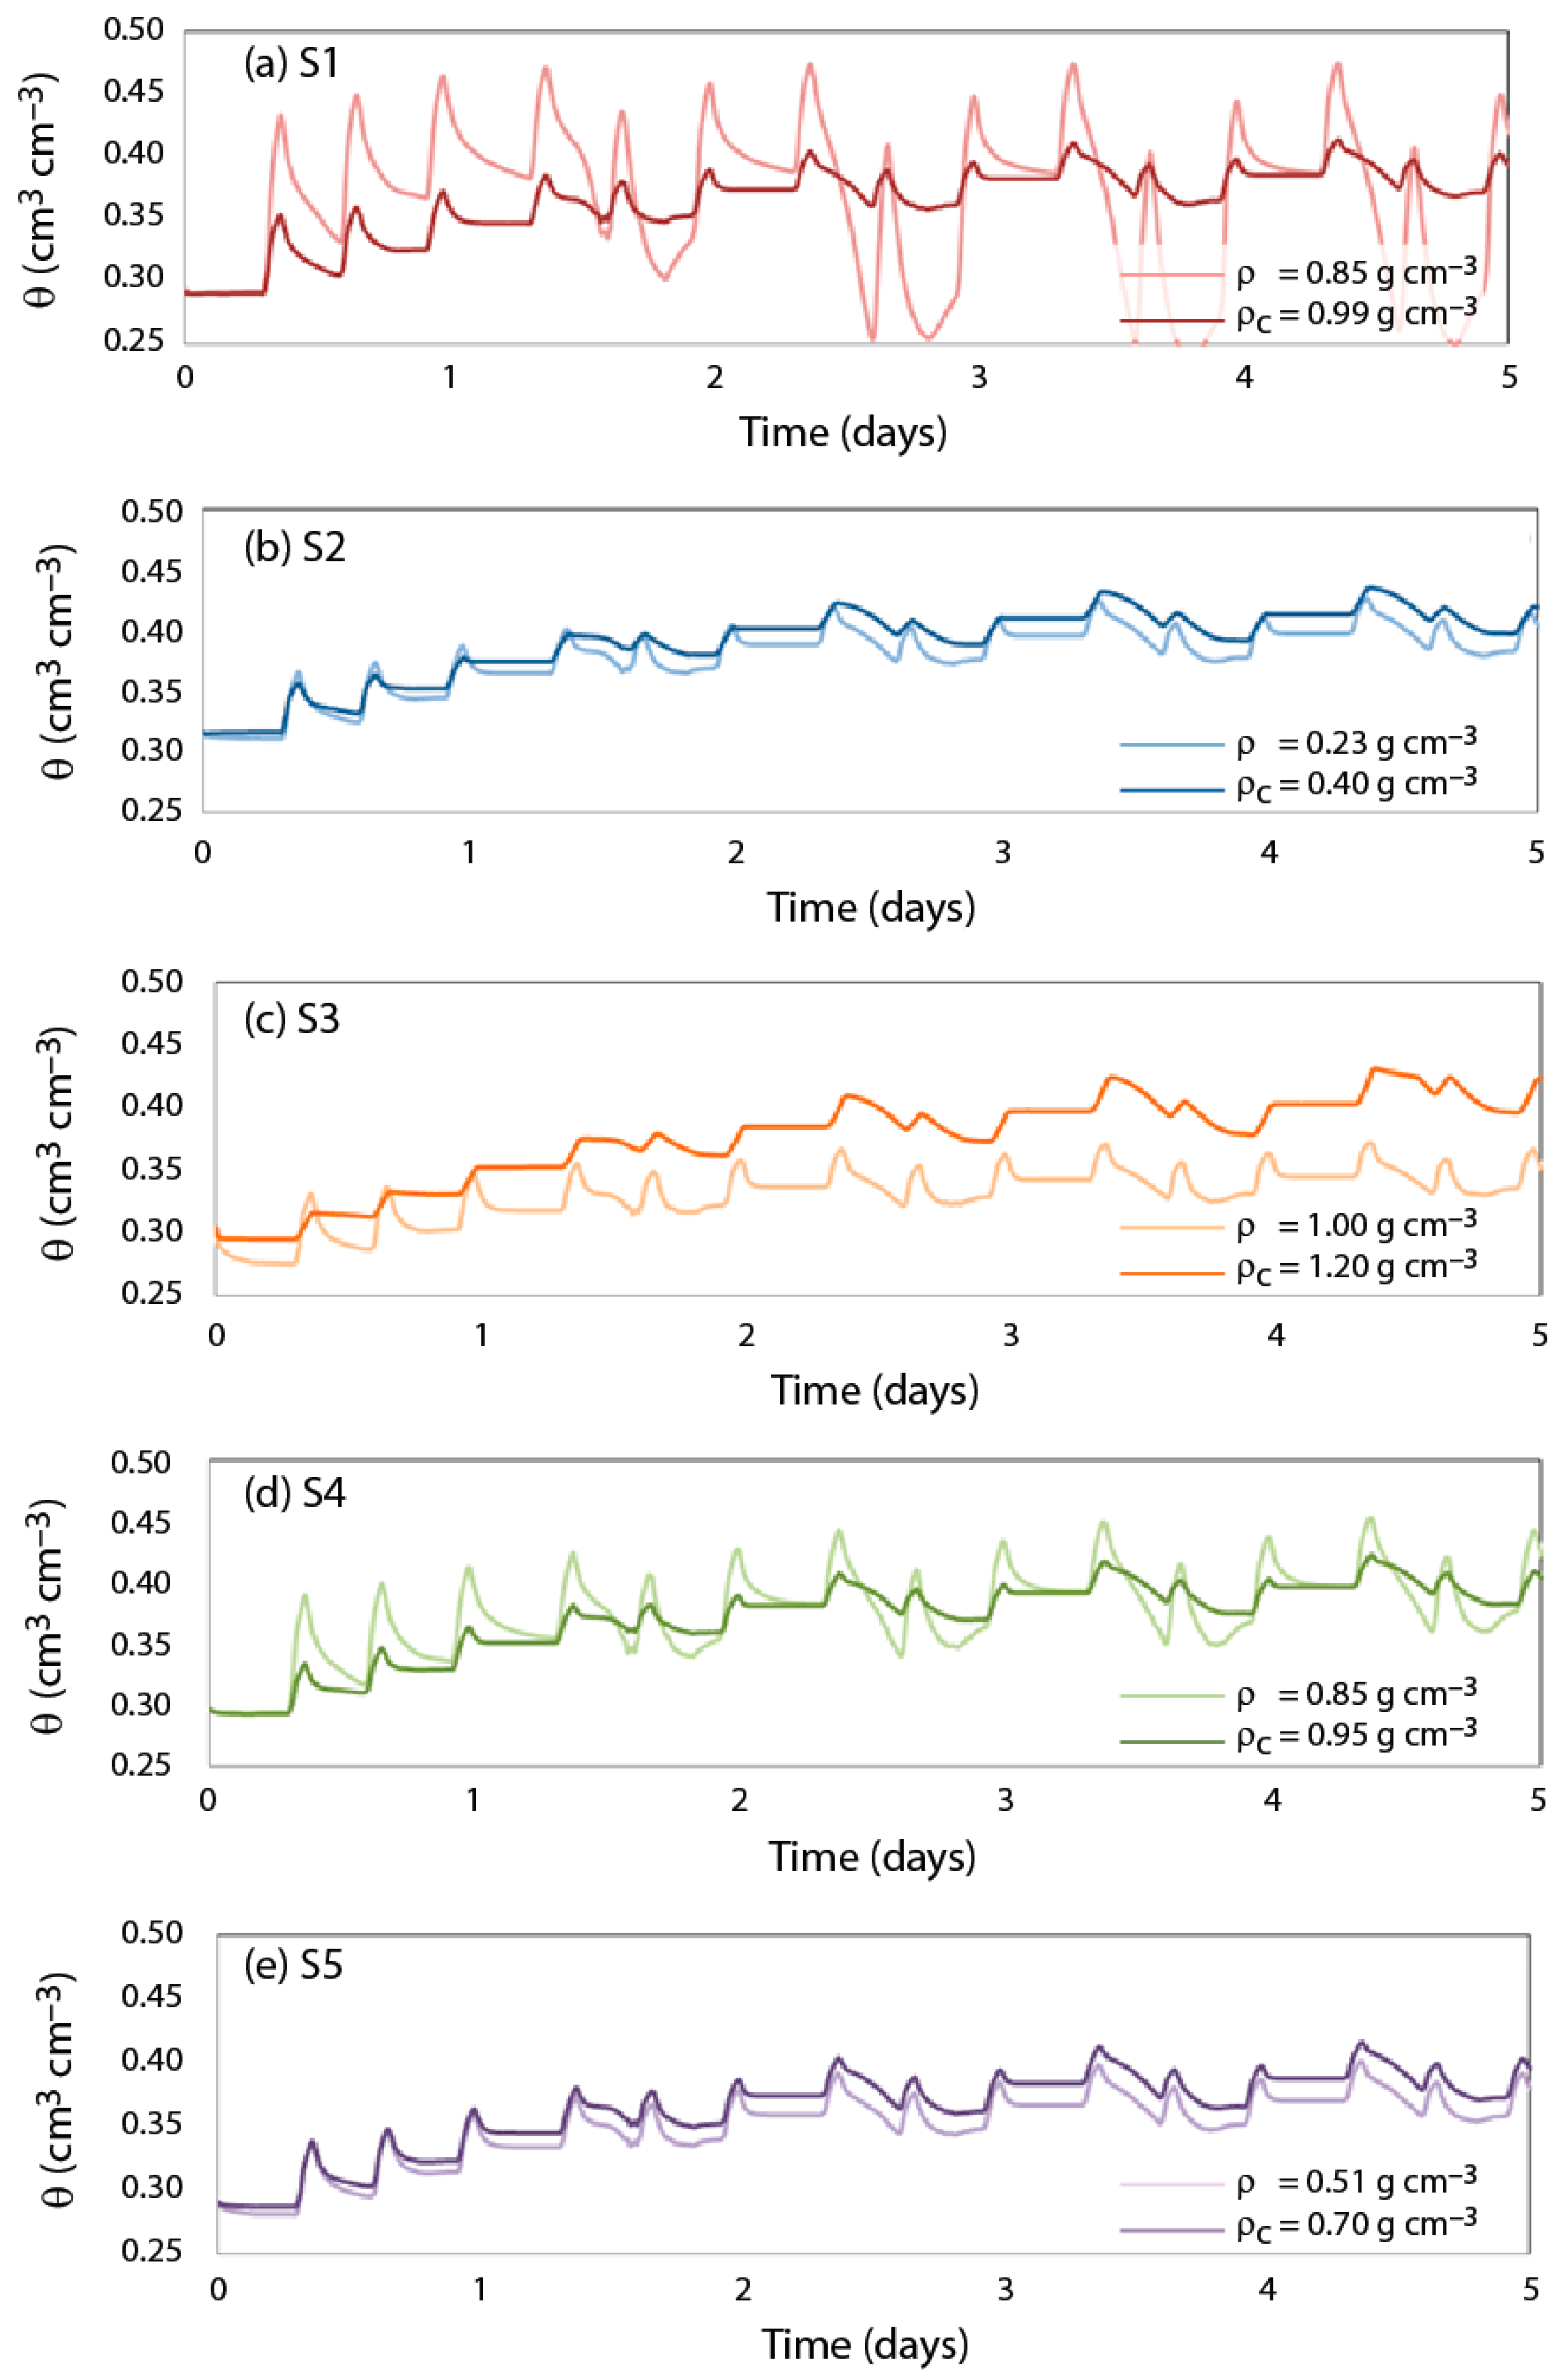
Appendix B. Evolution of the Volumetric Water Content in the Hypothetical Roof System under Uncompacted and Compacted Conditions

Figure A2a–e shows the temporal evolution of the volumetric water content during the first five days of simulation, at the atmosphere–substrate interface. Light colors correspond to the uncompacted substrate while dark colors are related to the compacted substrate. The water content evolution showed a daily cycle in all the substrates where the water content increased after the roof was irrigated, and then decreased due to evaporation. The effect of compaction on the moisture level is clear: after the substrates were compacted, the fluctuations in the volumetric water content were smaller. The reduction in the moisture fluctuations was clear for substrates S1 and S4. On the other hand, for substrates S2, S3, and S5 the mean water content increased most likely due to the reduction of water storage volume. Figure A2 demonstrates that there was a change in the hydrodynamic response of each substrate to the same meteorological conditions as compaction occurred.
Figure A2. Modeled volumetric water content at the atmosphere–substrate interface for substrates S1 (a), S2 (b), S3 (c), S4 (d) and S5 (e). Light colors correspond to the uncompacted substrate, and dark colors refer to the compacted substrate.
Applsci 09 04697 g0a2

Appendix C

Figure A3a–e shows the modeled temperature evolution of the five substrates in 30 days of simulation and at 34.5 cm below the surface, i.e., near the ceiling of the room. The changes at the roof ceiling when compaction occurs showed a general increment in the daily amplitude of the temperatures, which could be explained by the larger average water contents that can be seen in Figure A2 that provoked higher thermal conductivities and vertical heat diffusion. The change in temperatures at the ceiling due to compaction were mostly noticed in substrates S1 and S2. The temperature daily cycles of the uncompacted and compacted state were incremented by ~1 °C in the case of S1 and S2. These changes in the thermal amplitude agreed with the changes in the thermal conductivity curves shown in Figure 5.
Figure A3. Modeled temperature evolution of the five substrates in 30 days of simulation and at 34.5 cm (concrete) below the surface with an initial temperature of 23 °C and 10 mm/day of artificial irrigation. Light colors correspond to the uncompacted substrate, and dark colors refer to the compacted substrate. (a) S1, (b) S2, (c) S3, (d) S4 and (e) S5.
Applsci 09 04697 g0a3

References

  1. Reyes, R.; Bustamante, W.; Gironás, J.; Pastén, P.A.; Rojas, V.; Suárez, F.; Vera, S.; Victorero, F.; Bonilla, C.A. Effect of substrate depth and roof layers on green roof temperature and water requirements in a semi-arid climate. Ecol. Eng. 2016, 97, 624–632. [Google Scholar] [CrossRef]
  2. Sandoval, V.; Bonilla, C.A.; Gironás, J.; Vera, S.; Victorero, F.; Bustamante, W.; Rojas, V.; Leiva, E.; Pastén, P.; Suárez, F. Porous Media Characterization to Simulate Water and Heat Transport through Green Roof Substrates. Vadose Zone J. 2017, 16. [Google Scholar] [CrossRef]
  3. Shafique, M.; Kim, R.; Rafiq, M. Green roof benefits, opportunities and challenges—A review. Renew. Sustain. Energy Rev. 2018, 90, 757–773. [Google Scholar] [CrossRef]
  4. Hashemi, S.S.G.; Mahmud, H.B.; Ashraf, M.A. Performance of green roofs with respect to water quality and reduction of energy consumption in tropics: A review. Renew. Sustain. Energy Rev. 2015, 52, 669–679. [Google Scholar] [CrossRef]
  5. Raji, B.; Tenpierik, M.J.; van den Dobbelsteen, A. The impact of greening systems on building energy performance: A literature review. Renew. Sustain. Energy Rev. 2015, 45, 610–623. [Google Scholar] [CrossRef] [Green Version]
  6. Vijayaraghavan, K. Green roofs: A critical review on the role of components, benefits, limitations and trends. Renew. Sustain. Energy Rev. 2016, 57, 740–752. [Google Scholar] [CrossRef]
  7. De-Ville, S.; Menon, M.; Stovin, V. Temporal variations in the potential hydrological performance of extensive green roof systems. J. Hydrol. 2018, 558, 564–578. [Google Scholar] [CrossRef] [Green Version]
  8. Catalano, C.; Laudicina, V.A.; Badalucco, L.; Guarino, R. Some European green roof norms and guidelines through the lens of biodiversity: Do ecoregions and plant traits also matter? Ecol. Eng. 2018, 115, 15–26. [Google Scholar] [CrossRef]
  9. Mayrand, F.; Clergeau, P. Green Roofs and Green Walls for Biodiversity Conservation: A Contribution to Urban Connectivity? Sustainability 2018, 10, 985. [Google Scholar] [CrossRef]
  10. Peng, L.L.H.; Jim, C.Y. Seasonal and Diurnal Thermal Performance of a Subtropical Extensive Green Roof: The Impacts of Background Weather Parameters. Sustainability 2015, 7, 11098–11113. [Google Scholar] [CrossRef] [Green Version]
  11. Brunetti, G.; Šimůnek, J.; Piro, P. A Comprehensive Analysis of the Variably Saturated Hydraulic Behavior of a Green Roof in a Mediterranean Climate. Vadose Zone J. 2016, 15. [Google Scholar] [CrossRef]
  12. Eksi, M.; Rowe, D.B.; Wichman, I.S.; Andresen, J.A. Effect of substrate depth, vegetation type, and season on green roof thermal properties. Energy Build. 2017, 145, 174–187. [Google Scholar] [CrossRef] [Green Version]
  13. Buckland-Nicks, M.; Heim, A.; Lundholm, J. Spatial environmental heterogeneity affects plant growth and thermal performance on a green roof. Sci. Total Environ. 2016, 553, 20–31. [Google Scholar] [CrossRef] [PubMed]
  14. Brown, C.; Lundholm, J. Microclimate and substrate depth influence green roof plant community dynamics. Landsc. Urban Plan. 2015, 143, 134–142. [Google Scholar] [CrossRef]
  15. Campbell, G.S.; Norman, J.M. An Introduction to Environmental Biophysics; Springer: Berlin/Heidelberg, Germany, 2012. [Google Scholar]
  16. Assouline, S.; Or, D. Conceptual and Parametric Representation of Soil Hydraulic Properties: A Review. Vadose Zone J. 2013, 12. [Google Scholar] [CrossRef]
  17. Sailor, D.J. A green roof model for building energy simulation programs. Energy Build. 2008, 40, 1466–1478. [Google Scholar] [CrossRef]
  18. Sailor, D.J.; Hagos, M. An updated and expanded set of thermal property data for green roof growing media. Energy Build. 2011, 43, 2298–2303. [Google Scholar] [CrossRef]
  19. Sandoval, V.; Suárez, F.; Vera, S.; Pinto, C.; Victorero, F.; Bonilla, C.; Gironás, J.; Bustamante, W.; Rojas, V.; Pastén, P. Impact of the Properties of a Green Roof Substrate on its Hydraulic and Thermal Behavior. Energy Procedia 2015, 78, 1177–1182. [Google Scholar] [CrossRef] [Green Version]
  20. Zhao, M.; Tabares-Velasco, P.C.; Srebric, J.; Komarneni, S.; Berghage, R. Effects of plant and substrate selection on thermal performance of green roofs during the summer. Build. Environ. 2014, 78, 199–211. [Google Scholar] [CrossRef]
  21. Alaoui, A.; Lipiec, J.; Gerke, H.H. A review of the changes in the soil pore system due to soil deformation: A hydrodynamic perspective. Soil Tillage Res. 2011, 115–116, 1–15. [Google Scholar] [CrossRef]
  22. Zhou, A.-N.; Sheng, D.; Carter, J.P. Modelling the effect of initial density on soil-water characteristic curves. Géotechnique 2012, 62, 669–680. [Google Scholar] [CrossRef] [Green Version]
  23. Charpentier, S. Simulation of Water Regime and Sensible Heat Exchange Phenomena in Green Roof Substrates. Vadose Zone J. 2015, 14. [Google Scholar] [CrossRef]
  24. Aravena, J.E.; Berli, M.; Ghezzehei, T.A.; Tyler, S.W. Effects of Root-Induced Compaction on Rhizosphere Hydraulic Properties—X-ray Microtomography Imaging and Numerical Simulations. Env. Sci. Technol. 2011, 45, 425–431. [Google Scholar] [CrossRef] [PubMed]
  25. Aravena, J.E.; Berli, M.; Ruiz, S.; Suárez, F.; Ghezzehei, T.A.; Tyler, S.W. Quantifying coupled deformation and water flow in the rhizosphere using X-ray microtomography and numerical simulations. Plant Soil 2014, 376, 95–110. [Google Scholar] [CrossRef]
  26. Augeard, B.; Bresson, L.M.; Assouline, S.; Kao, C.; Vauclin, M. Dynamics of Soil Surface Bulk Density: Role of Water Table Elevation and Rainfall Duration. Soil Sci. Soc. Am. J. 2008, 72, 412–423. [Google Scholar] [CrossRef]
  27. Barozzi, B.; Bellazzi, A.; Maffè, C.; Pollastro, M.C. Measurement of Thermal Properties of Growing Media for Green Roofs: Assessment of a Laboratory Procedure and Experimental Results. Buildings 2017, 7, 99. [Google Scholar] [CrossRef]
  28. Richards, L.A. Capillary Conduction Of Liquids Through Porous Mediums. Physics 1931, 1, 318–333. Available online: https://aip.scitation.org/doi/10.1063/1.1745010 (accessed on 27 July 2019). [CrossRef]
  29. Brooks, R.H.; Corey, A.T. Properties of Porous Media Affecting Fluid Flow. J. Irrig. Drain. Div. 1966, 92, 61–90. [Google Scholar]
  30. Genuchten, V.; Th, M. A Closed-form Equation for Predicting the Hydraulic Conductivity of Unsaturated Soils 1. Soil Sci. Soc. Am. J. 1980, 44, 892–898. [Google Scholar] [CrossRef]
  31. Assouline, S.; Tessier, D.; Bruand, A. A conceptual model of the soil water retention curve. Water Resour. Res. 1998, 34, 223–231. [Google Scholar] [CrossRef]
  32. Mualem, Y. A new model for predicting the hydraulic conductivity of unsaturated porous media. Water Resour. Res. 1976, 12, 513–522. [Google Scholar] [CrossRef] [Green Version]
  33. Assouline, S.; Tartakovsky, D.M. Unsaturated hydraulic conductivity function based on a soil fragmentation process. Water Resour. Res. 2001, 37, 1309–1312. [Google Scholar] [CrossRef] [Green Version]
  34. Saito, H.; Šimůnek, J.; Mohanty, B.P. Numerical Analysis of Coupled Water, Vapor, and Heat Transport in the Vadose Zone. Vadose Zone J. 2006, 5, 784–800. [Google Scholar] [CrossRef] [Green Version]
  35. Jury, W.A.; Horton, R. Soil Physics; John Wiley & Sons: Hoboken, NJ, USA, 2004. [Google Scholar]
  36. Chung, S.-O.; Horton, R. Soil heat and water flow with a partial surface mulch. Water Resour. Res. 1987, 23, 2175–2186. [Google Scholar] [CrossRef] [Green Version]
  37. Assouline, S. Modeling the Relationship between Soil Bulk Density and the Water Retention Curve Contribution of the Agricultural Research Organization, Institute of Soil, Water and Environmental Sciences, Bet Dagan, Israel, No. 607/05. Vadose Zone J. 2006, 5, 554–563. [Google Scholar] [CrossRef]
  38. Assouline, S. Modeling the Relationship between Soil Bulk Density and the Hydraulic Conductivity Function. Vadose Zone J. 2006, 5, 697–705. [Google Scholar] [CrossRef]
  39. Johansen, O. Thermal Conductivity of Soils; Cold Regions Research and Engineering Laboratory: Hanover, NH, USA, 1977. [Google Scholar]
  40. Balland, V.; Arp, P.A. Modeling soil thermal conductivities over a wide range of conditions. J. Env. Eng. Sci. 2005, 4, 549–558. [Google Scholar] [CrossRef]
  41. Côté, J.; Konrad, J.-M. A generalized thermal conductivity model for soils and construction materials. Can. Geotech. J. 2005, 42, 443–458. [Google Scholar] [CrossRef]
  42. Barry-Macaulay, D.; Bouazza, A.; Wang, B.; Singh, R.M. Evaluation of soil thermal conductivity models. Can. Geotech. J. 2015, 52, 1892–1900. [Google Scholar] [CrossRef]
  43. Šimůnek, J.; van Genuchten, M.T.; Šejna, M. Recent Developments and Applications of the HYDRUS Computer Software Packages. Vadose Zone J. 2016, 15. [Google Scholar] [CrossRef]
  44. Šimůnek, J.; van Genuchten, M.T.; Šejna, M. Development and Applications of the HYDRUS and STANMOD Software Packages and Related Codes. Vadose Zone J. 2008, 7, 587–600. [Google Scholar] [CrossRef] [Green Version]
  45. Causone, F.; Corgnati, S.P.; Filippi, M.; Olesen, B.W. Experimental evaluation of heat transfer coefficients between radiant ceiling and room. Energy Build. 2009, 41, 622–628. [Google Scholar] [CrossRef]
  46. Zhang, X.; Mavroulidou, M.; Gunn, M.J. A study of the water retention curve of lime-treated London Clay. Acta Geotech. 2017, 12, 23–45. [Google Scholar] [CrossRef]
  47. Wong, J.T.F.; Chen, Z.; Chen, X.; Ng, C.W.W.; Wong, M.H. Soil-water retention behavior of compacted biochar-amended clay: A novel landfill final cover material. J. Soils Sediment. 2017, 17, 590–598. [Google Scholar] [CrossRef]
Figure 1. Substrates utilized in this investigation.
Applsci 09 04697 g001
Figure 2. Conceptual model of the hypothetical roof system used in the numerical simulations.
Applsci 09 04697 g002
Figure 3. Water retention curves for the uncompacted (ρ) and compacted (ρc) substrates: (a) substrate S1; (b) substrate S2; (c) substrate S3; (d) substrate S4; (e) substrate S5.
Applsci 09 04697 g003
Figure 4. Kersten number (λe), which represents the normalized thermal conductivity curves of the five substrates investigated in this study. The λe values were obtained using the empirical data reported by Sandoval et al. [2]. The κ values correspond to those of the Coté and Konrad [41] model.
Applsci 09 04697 g004
Figure 5. Thermal conductivity curves for the uncompacted (ρ) and compacted (ρc) substrates: (a) substrate S1; (b) substrate S2; (c) substrate S3; (d) substrate S4; (e) substrate S5.
Applsci 09 04697 g005
Figure 6. Cumulative flux that exits the bottom of the uncompacted (light lines) and compacted (dark lines) substrates during the 30 days of simulation. (a) substrate S1; (b) substrate S3; (c) substrate S4; (d) substrate S5. The results of the substrate S2 are not shown as this substrate did not drain water during the entire simulation.
Applsci 09 04697 g006
Figure 7. (ae) Heating cumulative thermal energy required to maintain a reference room temperature of 23 °C below the roof system. (fj) Cooling cumulative thermal energy required to maintain a reference room temperature of 23 °C below the roof system.
Applsci 09 04697 g007
Table 1. Properties of the substrates: texture determined using the United States Department of Agriculture (USDA) soil classification system, organic matter (OM), soil particle density (ρs), maximum density (ρmax), uniformity (Cu) and curvature (Cc) coefficients for the substrate’s uncompacted state. Modified from Reference [2].
SubstrateTextureOM (%)ρs (g/cm3)ρmax (g/cm3)Cu (-)Cc (-)
Sand (%) 0.05–2 mmSilt (%) (SC) 0.002–0.05 mmClay (%) (CC) <0.002 mm
S188.18.53.312.02.200.9948.40.7
S265.629.25.230.72.130.4467.50.5
S382.813.33.94.12.511.2043.05.9
S450.734.414.910.22.441.13240.00.6
S553.437.69.035.52.320.9889.11.2
Table 2. Hydrodynamic properties of the substrates used in this study. The first row of each substrate refers to the uncompacted (UC) values and the second row corresponds to the compacted (C) values obtained with the parametric analysis.
SubstrateStateρθr1θs1α1n1Ksξ2μ2w2η3ε3ϛ 3
(g/cm3)(-)(-)(1/cm)(-)(cm/d)(bar)(-)(-)(-)(-)(-)
S1UC0.850.190.640.11701.443480.0320.762 1.0251.3290.072
C0.990.220.570.01901.902390.0561.0351.9961.3820.9620.051
S2UC0.230.180.760.05901.6536900.0861.445 1.1201.1320.094
C0.400.310.690.00194.184100.2522.4611.8501.7810.6660.067
S3UC1.000.000.520.16001.3318500.0340.701 0.9281.4580.094
C1.200.000.440.01751.8515400.0671.0001.9491.3440.9940.067
S4UC0.850.000.610.02701.351720.1140.709 0.9461.4320.210
C0.950.000.500.00282.271150.3281.2582.0111.2141.1180.246
S5UC0.510.130.700.05101.7513800.0290.946 1.2771.0560.035
C0.700.180.630.00413.074420.0981.7491.8821.9120.5790.017
1 Parameters of the van Genuchten [30] water retention model. 2 Parameters of the Assouline [31] water retention model. 3 Parameters of the Assouline [38] hydraulic conductivity model.
Table 3. Thermal properties of the substrates studied in this investigation. The first row of each substrate refers to the uncompacted (UC) state, while the second row corresponds to the compacted (C) values obtained with the parametric analysis.
SubstrateStateρb11b21b31κ2λsol3
(g/cm3)(W m−1 K−1)(W m−1 K−1)(W m−1 K−1)(-)(W m−1 K−1)
S1UC0.850.5133.854−2.769
C0.991.0265.780−4.5140.6681.338
S2UC0.23−0.1521.0480.022
C0.40−0.6902.2120.1151.0061.103
S3UC1.000.1460.8220.330
C1.200.1451.0010.4811.4661.286
S4UC0.850.1250.0000.929
C1.130.1540.0000.9874.5611.382
S5UC0.51−0.2860.5520.889
C0.700.1990.0000.9541.2832.125
1 Parameters of Chung and Horton [36] thermal conductivity model: λ 0 ( θ ) = b 1 + b 2 θ + b 3 θ 0.5 . 2 κ parameter of Equation (23). 3 From Johansen [39].

