Seismological and Engineering Demand Misfits for Evaluating Simulated Ground Motion Records

Civil Engineering Department, Middle East Technical University, 06800 Ankara, Turkey
Appl. Sci. 2019, 9(21), 4497; https://doi.org/10.3390/app9214497
Submission received: 30 August 2019
/
Revised: 17 October 2019
/
Accepted: 18 October 2019
/
Published: 23 October 2019
(This article belongs to the Special Issue Meta-heuristic Algorithms in Engineering)
Abstract
:Featured Application
Simulated ground motion records are alternatives of real ground motion records for regions of sparse seismic networks or lack of potential large events. Before their use in earthquake engineering, evaluation of them from both seismological and engineering points of view is necessary.
Abstract
Simulated ground motions have recently gained more attention in seismology and earthquake engineering. Since different characteristics of waveforms are expected to influence alternative structural response parameters, evaluation of simulations, for key components of seismological and engineering points of view is necessary. When seismological aspect is of concern, consideration of a representative set of ground motion parameters is imperative. Besides, to test the applicability of simulations in earthquake engineering, structural demand parameters should simultaneously cover a descriptive set. Herein, simulations are evaluated through comparison of seismological against engineering misfits, individually defined in terms of log-scale misfit and goodness-of-fit score. For numerical investigations, stochastically simulated records of three earthquakes are considered: The 1992 Erzincan-Turkey, 1999 Duzce-Turkey and 2009 L’Aquila-Italy events. For misfit evaluation, seismological parameters include amplitude, duration and frequency content, while engineering parameters contain spectral acceleration, velocity and seismic input energy. Overall, the same trend between both misfits is observed. All misfits for Erzincan and Duzce located on basins are larger than those corresponding to L’Aquila mostly placed on stiff sites. The engineering misfits, particularly in terms of input energy measures, are larger than seismological misfits. In summary, the proposed misfit evaluation methodology seems useful to evaluate simulations for engineering practice.
1. Introduction
Earthquakes are amongst the most destructive natural hazards and disasters resulting in major seismic losses to the built environment. Many researchers have studied the hazard and intensity proposed by large and destructive earthquakes (e.g., [1,2,3,4]). In most engineering applications, ground motion time histories are required in order to perform time history analyses of geotechnical or structural systems (e.g., [5,6,7,8,9]). In regions of sparse ground motion networks or lack of potential large earthquakes, simulated ground motion time histories have been increasingly recommended in earthquake engineering practice in recent years (e.g., [10,11]). Depending on the solution approach, ground motion simulation methods can be deterministic, stochastic or hybrid. The low frequencies, which are solved mostly by deterministic methods, need precise source and velocity models (e.g., [12,13,14,15,16,17,18]). On the other hand, incoherency of the phase angles can be modeled using stochastic approaches (e.g., [19,20,21,22,23,24,25,26,27,28]). In order to model the broadband frequency range, hybrid ground motion simulation techniques are introduced (e.g., [29,30,31,32,33]).
During recent years, validation of ground motion simulation records has gained considerable interest among many researchers (e.g., [34,35,36]). Since accuracies and computational costs of different ground motion simulation techniques vary, investigation of the efficiency of the simulated seismological measures compared to the real values is essential. Recently, a few studies have investigated the Goodness of Fit (GOF) criteria between real and simulated time histories based on characteristics of the seismic waveforms (e.g., [37,38,39]). In these studies, GOF evaluation has been accomplished generally through ground motion intensity measures such as Fourier amplitude, peak ground intensity values or duration. However, the main concern in engineering practice is that simulated ground motion records may not be representative of real ones when estimation of structural seismic demand is required (e.g., [40,41]). Further investigation is necessary to evaluate alternative structural responses (i.e., elastic and inelastic spectral values as well as seismic energy contents) obtained from simulated records against those from corresponding recorded motions.
The objective of this study is to evaluate suitability of seismologically validated simulated ground motion records corresponding to the selected past events in the prediction of alternative engineering demand parameters. Evaluation of the simulated time histories is accomplished through the definition of different seismological and engineering demand misfits. The misfits are defined in terms of both log-scale misfits and GOF scores using the approach proposed by Olsen and Mayhew [39]. For misfit evaluation, the seismological measures employed here consist of duration, peak ground motion amplitudes and frequency as well as energy content of the records while the engineering demand parameters include Single Degree of Freedom (SDOF) structural responses in terms of both elastic and inelastic spectral acceleration, spectral velocity and seismic input energy contents.
Simulated records corresponding to the three past events with different source mechanisms in regions of different geological features are selected in this study. The 1992 Erzincan earthquake with a moment magnitude of 6.6 [42], which occurred in the eastern part of North Anatolian Fault Zone (NAFZ) in Turkey on a strike-slip fault mechanism, is selected as the first case study. The second case study is the 1999 Duzce event which occurred in the western part of NAFZ with Mw = 7.1 on the same fault mechanism [43]. The last case study is considered as the 2009 L’Aquila (Italy) earthquake with Mw = 6.3 [44] which occurred on a normal fault zone. Input parameters for simulations of the selected events from the stochastic finite-fault ground motion simulation approach [22] have been validated by previous studies [24,45,46]. In those studies, simulated motions have been validated by comparing them with the recorded motions corresponding to the past events mentioned herein. In this study, for the selected cases, first, seismological and engineering demand misfits (in terms of both log-scale misfits as well as GOF scores) are obtained and compared. Next, for a specified region, it is checked whether the seismologically defined misfits between the recorded and simulated time histories represent the same level of accuracy with those assessed through the use of alternative engineering demand parameters.
2. Study Area
In this study, three past earthquakes which occurred in regions with different geological characteristics are considered: The 1992 Erzincan-Turkey, the 1999 Duzce-Turkey and the 2009 L’Aquila-Italy events with corresponding magnitudes of 6.6, 7.1 and 6.3, respectively. Simulated records have been generated and verified by previous studies [24,45,46,47] using the stochastic finite-fault simulation method based on a dynamic corner frequency approach as introduced by Motazedian and Atkinson [22]. This approach is an extension of the stochastic point-source method which considers contribution of the source, propagation and path effects. The fault plane in the stochastic finite-fault method is divided into smaller sub-faults, each of them is treated as a stochastic point-source with an ω−2 spectrum [48,49]. Then, to obtain the entire time history in terms of one horizontal component, the contribution of all sub-faults is added in time domain with suitable time delays. Details corresponding to the simulation technique can be found in Motazedian and Atkinson [22]. In the following sections, the chosen study areas and the results of ground motion simulations are presented. All time histories at the selected stations for all case studies are baseline corrected then filtered with the fourth-order Butterworth filter type in the low and high cut frequencies of 0.1 Hz and 10 Hz, respectively.
2.1. Simulated Records of the 1992 Erzincan (Turkey) (Mw = 6.6) Earthquake
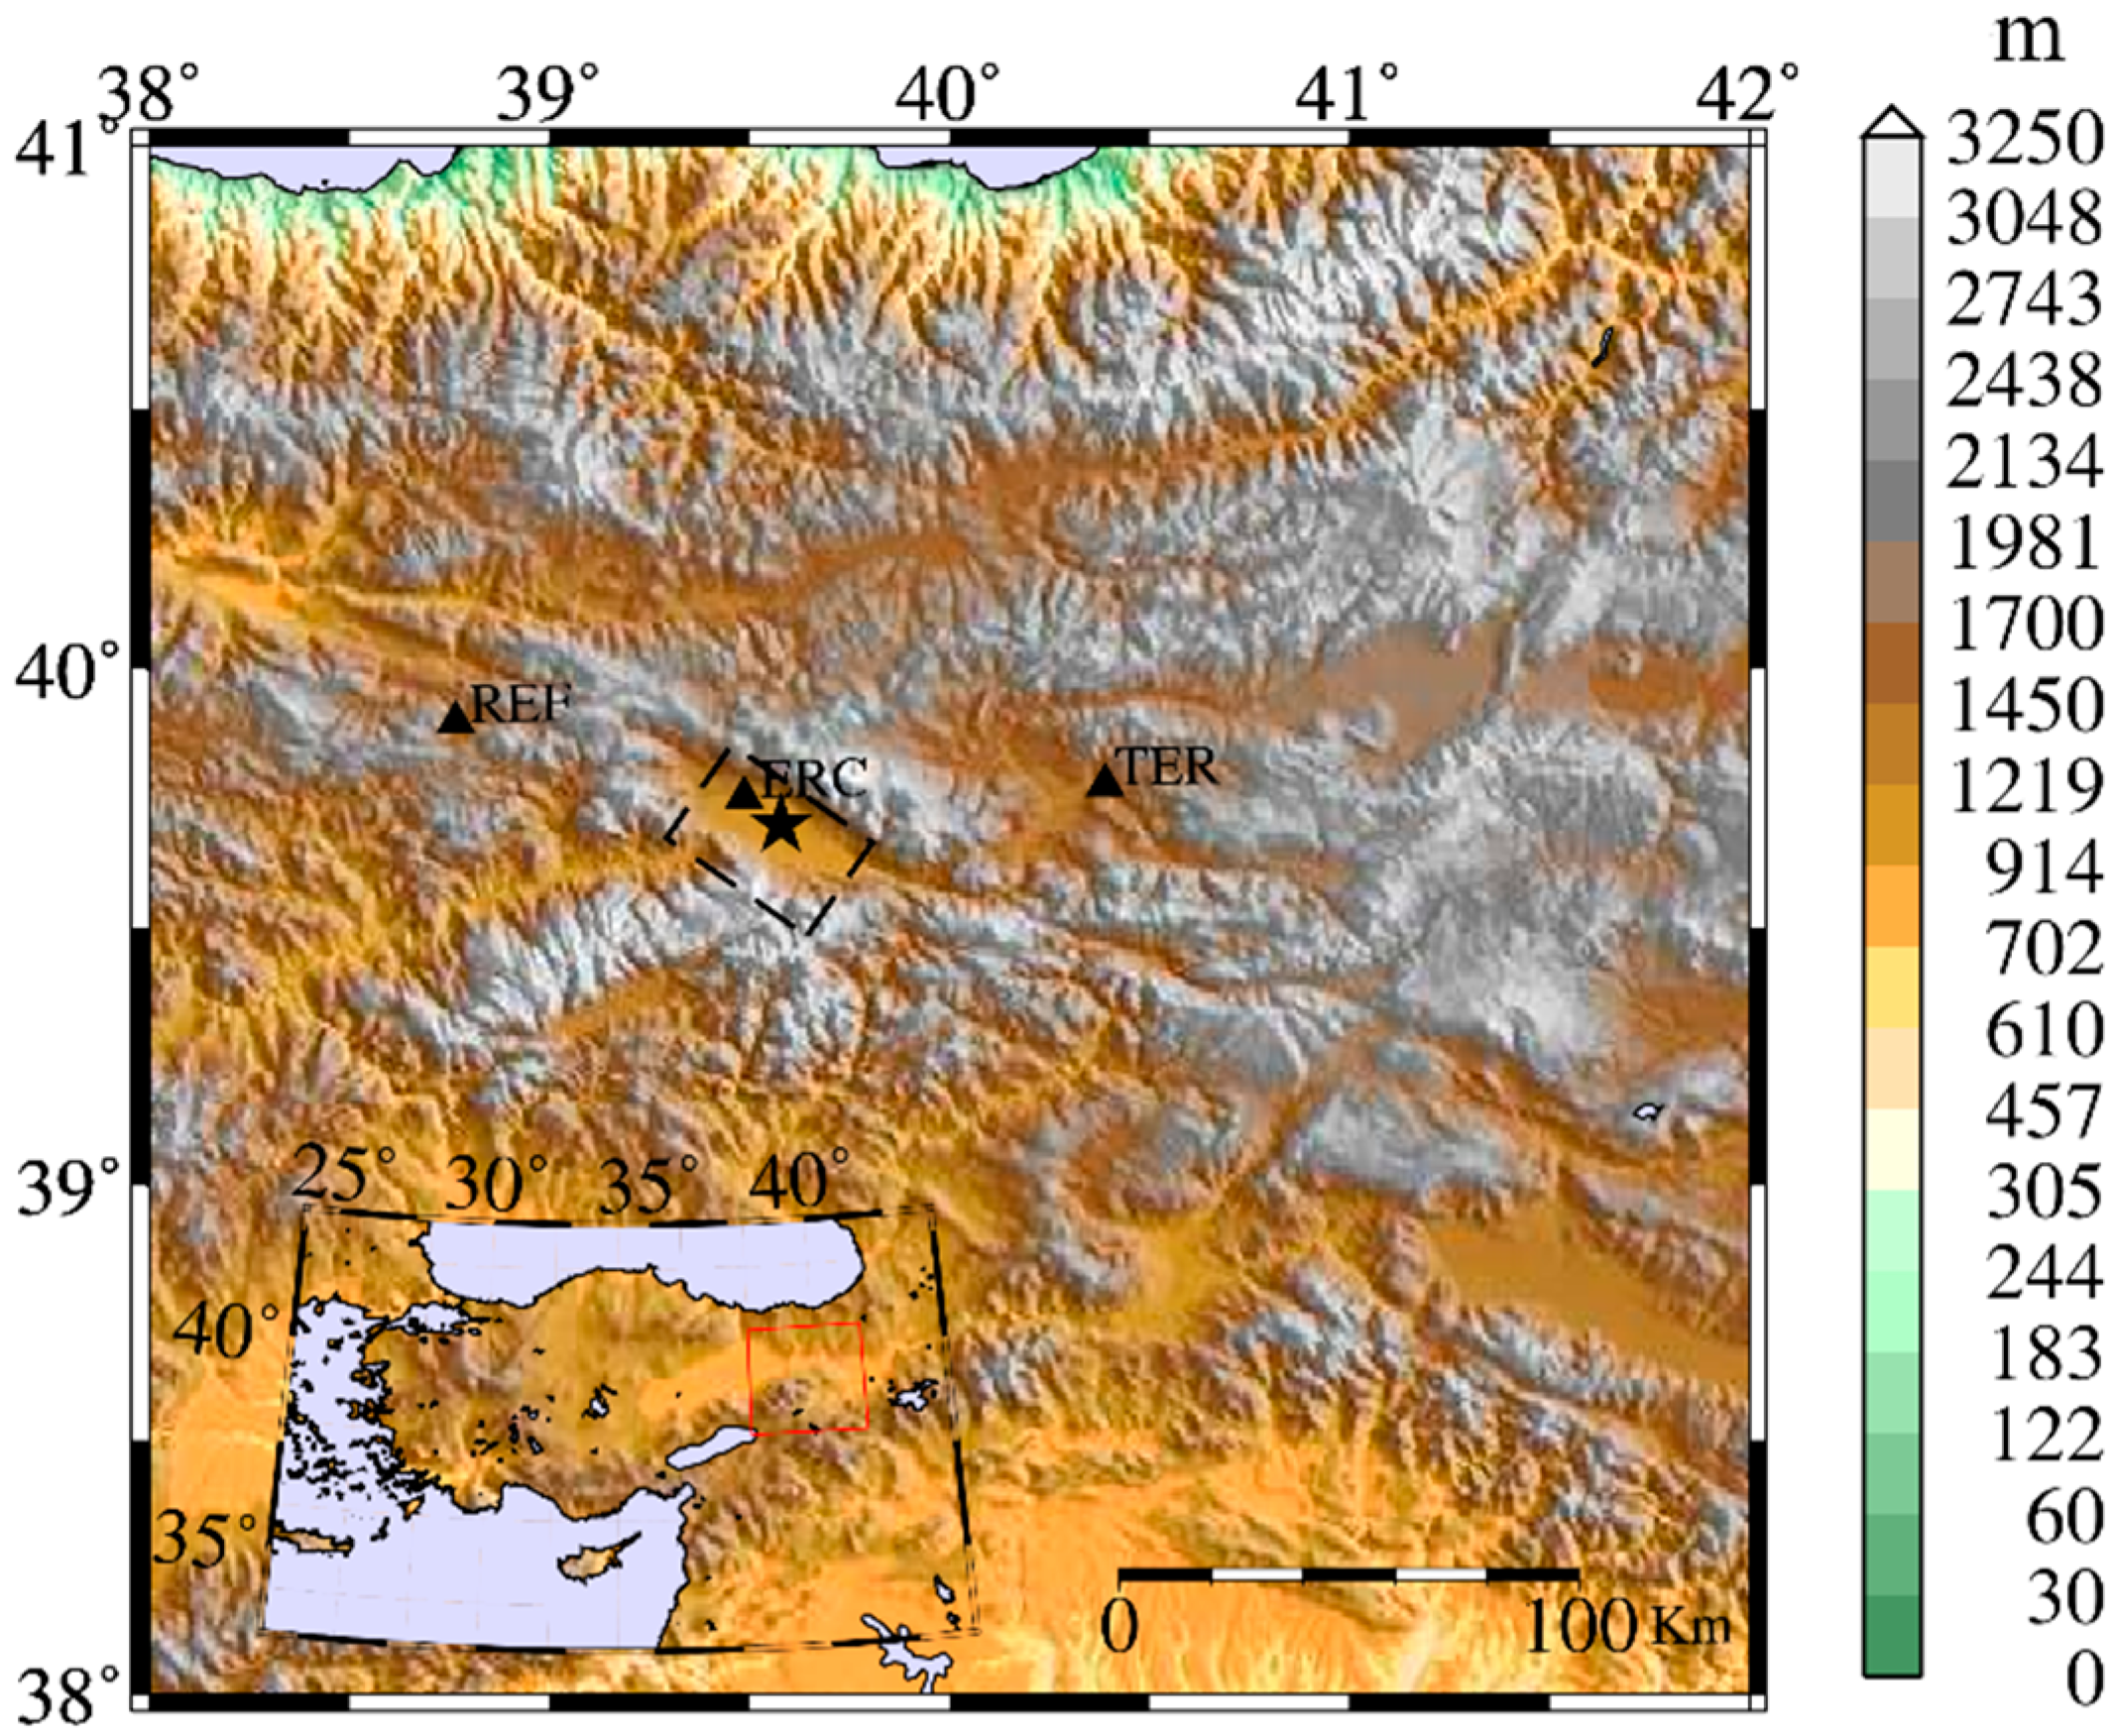
The NAFZ, with an active right-lateral strike-slip fault mechanism, is situated in the northern part of Turkey. In the eastern segments of the NAFZ, the 1992 Erzincan earthquake with the moment magnitude of 6.6 occurred. This earthquake led to at least five hundred mortalities besides an economical damage cost of five to ten trillion Turkish Liras [50]. Erzincan is an area placed on a deep alluvial basin with softer soil conditions [47]. The region is formed at the conjunction of three active faults with strike-slip mechanisms: the left-lateral North East Anatolian, the right-lateral North Anatolian and the left-lateral Ovacik faults. In spite of the intense seismicity of the region, only three stations recorded the 1992 Erzincan event. Thus, as the first case study, simulations are evaluated for the 1992 Erzincan event that occurred on a tectonically complex zone. Due to sparse seismic networks and limited number of recorded motions, simulations have been calibrated using the data at only three stations [46]. Figure 1 shows the epicenter, fault plane and location of the existing stations during the 1992 Erzincan event. Table 1 summarizes the information corresponding to the selected three stations.
The recorded raw time histories at the selected stations are taken from the Turkish strong ground motion database [42]. For simulation of the time histories at the selected three stations the validated parameters corresponding to the source, propagation and site effects proposed by Askan et al. [46] are employed. In that study, calibration of the simulation parameters corresponding to the 1992 Erzincan event has been performed using the recorded time histories at the existing three stations. The simulated Peak Ground Acceleration (PGA) and Peak Ground Velocity (PGV) values at the selected stations in both North-South (NS) and East-West (EW) directions are provided in Table 1.
2.2. Simulated Records of the 1999 Duzce (Turkey) (Mw = 7.1) Earthquake
The 1999 Duzce (Mw = 7.1) earthquake occurred in the western segment of the NAFZ in Turkey. The 12 November 1999 Duzce (Turkey) earthquake with Mw = 7.1, caused severe damage in the city with nearly 900 deaths and 3000 injuries [52]. Duzce city is set on an alluvial basin in the western segment of the NAFZ. The western part of Turkey not only is located on a seismologically active area but also includes high population density and a larger number of facilities which make the region critical for risk assessment studies. In this study, a total of four strong ground motion stations that recorded the 1999 Duzce earthquake are selected. All selected stations have epicentral distances less than 125 km. The epicenter of the event, fault plane and location of the selected stations are illustrated in Figure 2. The information corresponding to the selected stations for simulations are given in Table 2.
The website corresponding to the strong ground motion database of Turkey [42] is accessed to get the raw time histories at the selected four stations. For simulation of the time histories of the 1999 Duzce earthquake, the verified regional source, propagation and site parameters proposed by Ugurhan and Askan [24] are employed. In that study, the calibration of the simulation parameters was performed using the records corresponding to a total of existing nine stations. Table 2 presents the simulated PGA and PGV values at the selected stations of this case study.
2.3. Simulated Records of the 2009 L’Aquila (Italy) (Mw = 6.3) Earthquake
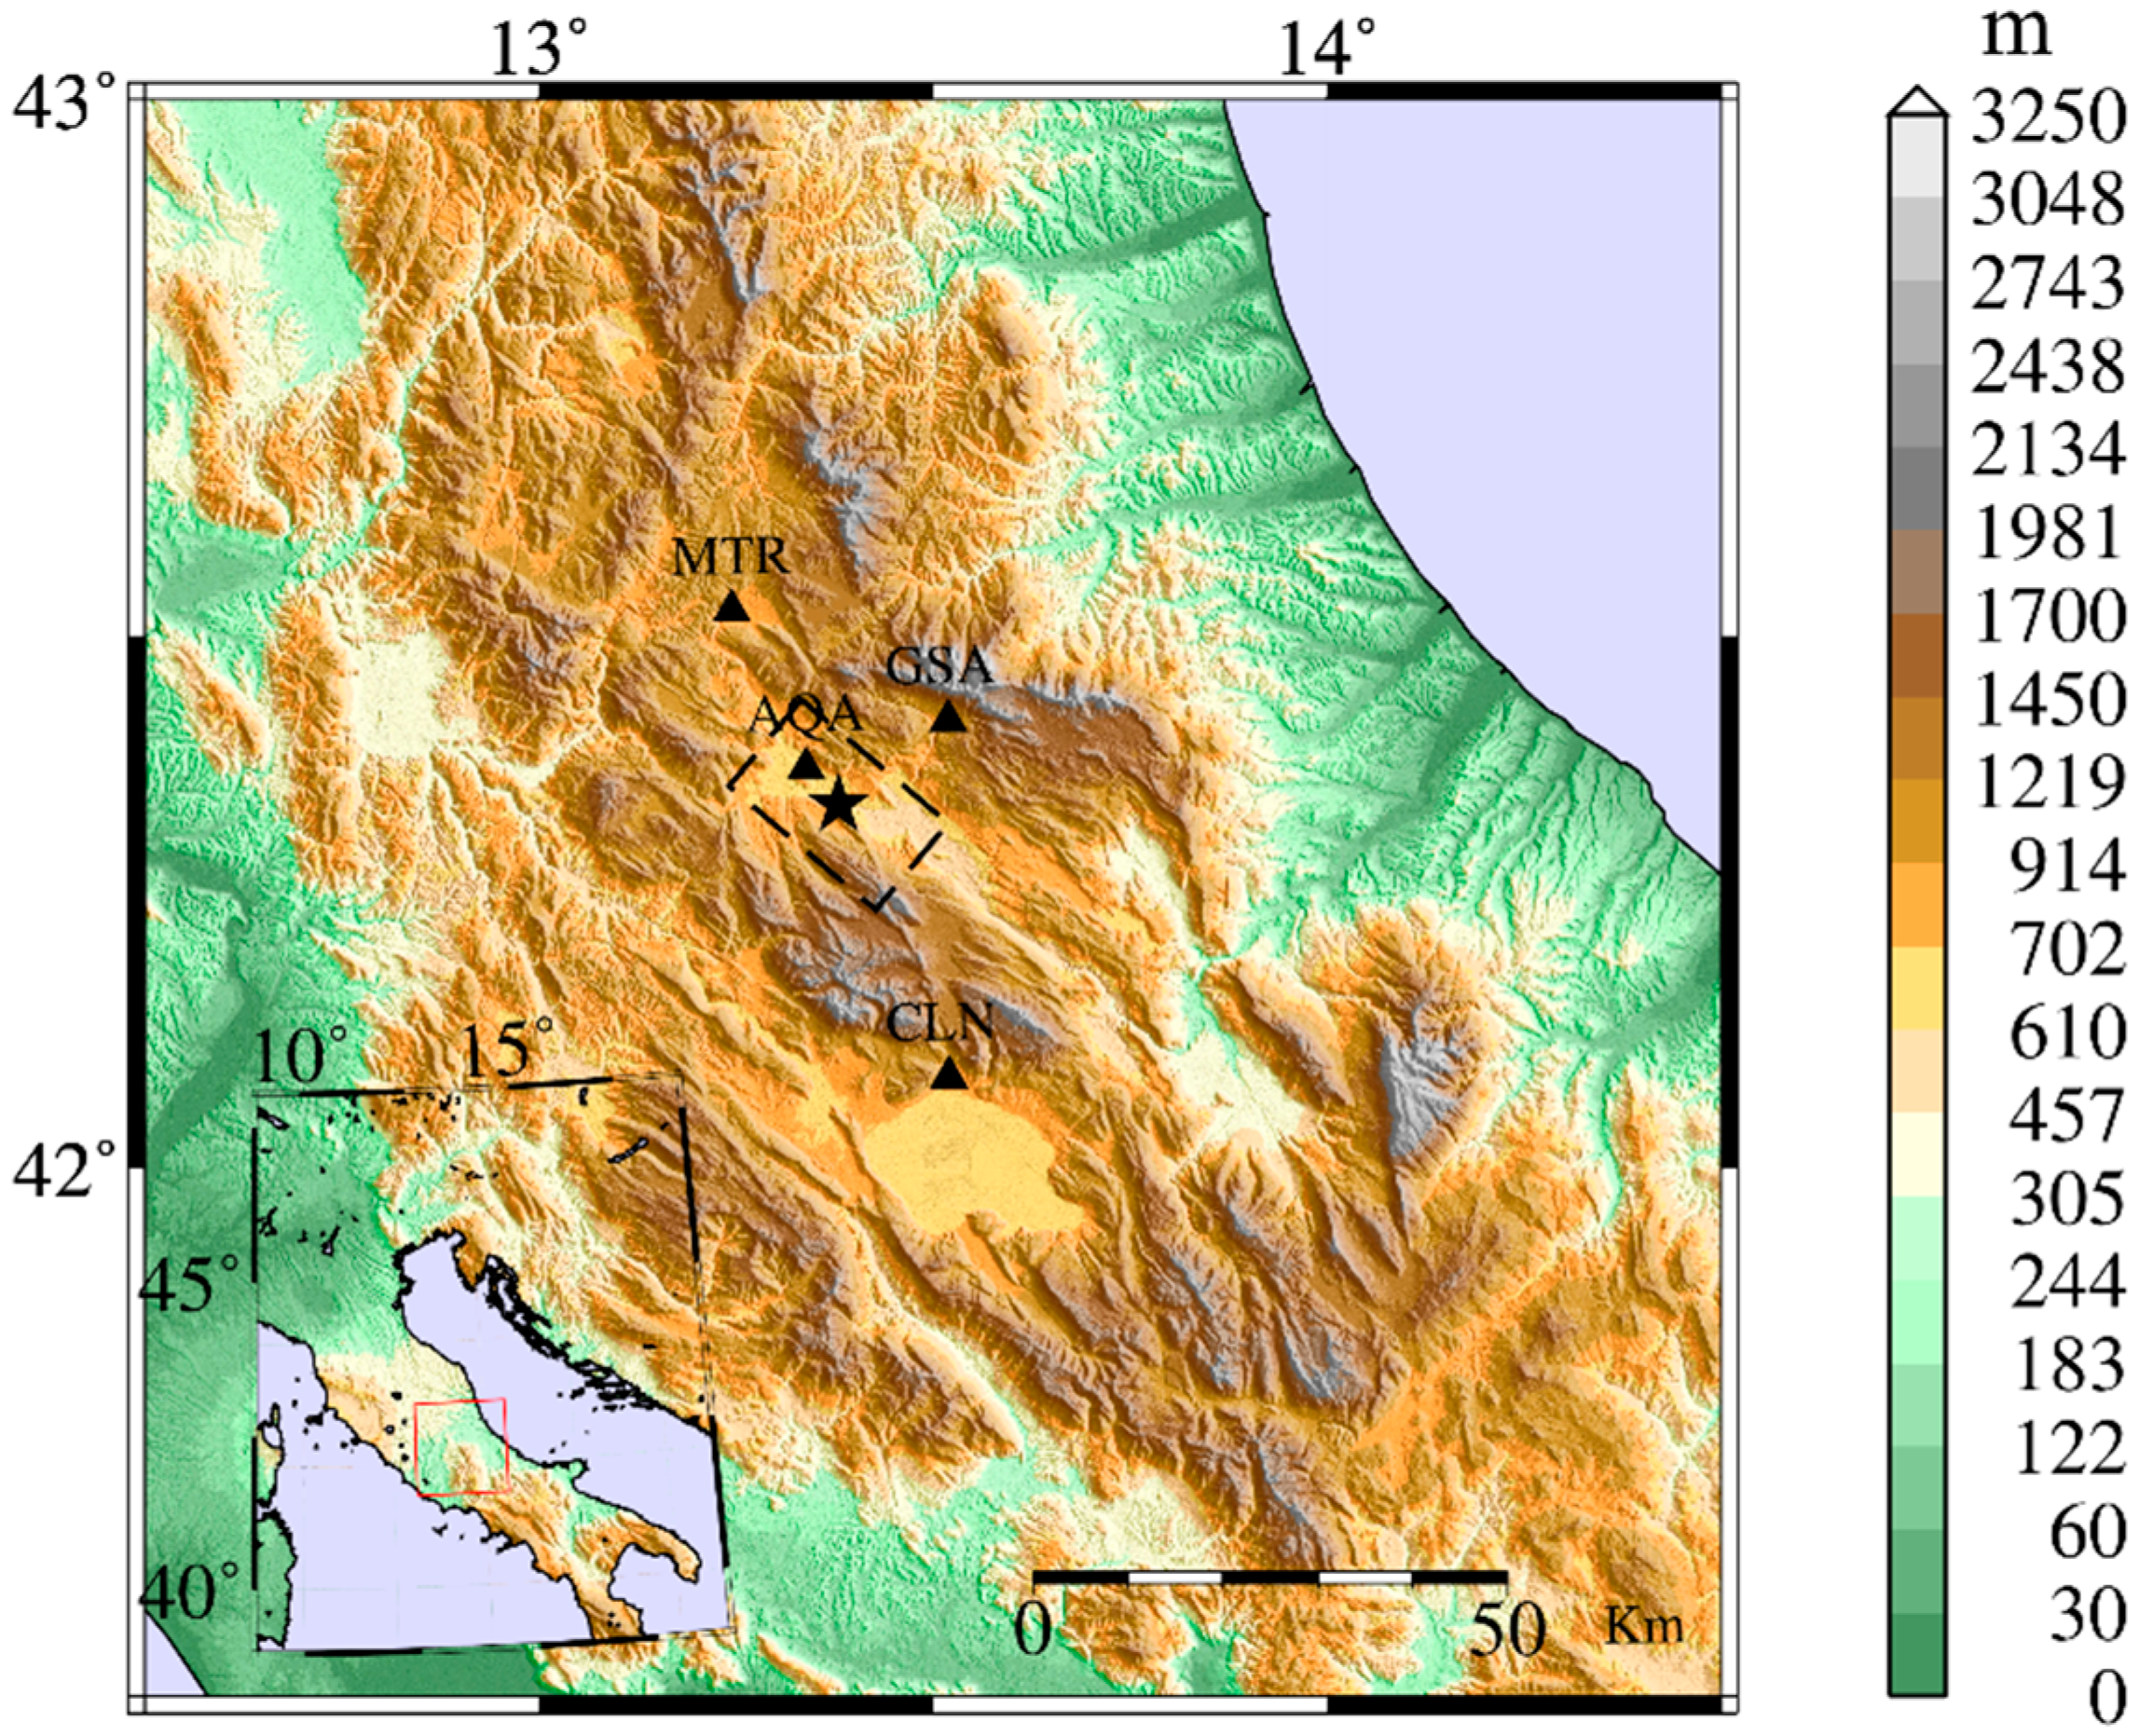
The 2009 L’Aquila (Italy) event with Mw = 6.3 occurred in the Abruzzo region, located in central Italy in a close vicinity of the L’Aquila town. The event had the moderate size of Mw = 6.3 but it caused nearly 300 casualties, 1500 injured people in addition to a total cost of 2–3 billion Euros structural damage [53]. The fault plane in which the 2009 L’Aquila event occurred has a normal mechanism. Majority of the near-fault strong ground motion stations that recorded the 2009 L’Aquila earthquake are located on stiff soils or rock sites. Yet, local site effects are observed in time histories of some stations which are located on softer soils. In order to investigate the efficiency of ground motion simulation methodology in predicting the real records of this event, a total of four stations having epicentral distances less than 50 km are selected. Figure 3 shows the location of the selected four stations along with the fault plane. Table 3 presents the selected four stations and their information.
The real records at the selected four stations are taken from the website corresponding to the strong ground motion database of Italy [55]. For ground motion simulations at the selected stations the validated source, path and site parameters proposed by Ugurhan et al. [45] are used. In that study, the simulation parameters of the 2009 L’Aquila event have been calibrated with respect to the observed records at fourteen stations. Table 3 shows the simulated PGA and PGV levels at the selected stations.
3. Seismological Misfits
The observed and simulated records at the selected three study areas and the corresponding stations are evaluated through definition of misfits in terms of alternative seismological measures. In this study, for evaluation of the seismological misfits, seismological parameters are considered to be Fourier Amplitude Spectrum (FAS), PGA, PGV, PGV to PGA ratio (PGV/PGA), Cumulative Absolute Velocity () [56], Arias Intensity () [57] and Significant Duration () [58] (determined as the time interval of 5–95% of the accumulated ). In the aforementioned formulas, Td corresponds to total duration of ground motion record, is acceleration time series, and shows the absolute value of at time.
In this study, seismological misfits are defined in terms of both log-scale misfits and GOF scores. For calculation of FAS log-scale misfits, the following function is used:
where, corresponds to the total number of discrete frequencies varying between 0.1 and 10 Hz.
For the remaining single-value parameters defined above, log-scale misfits are calculated using the following formula:
where, stands for the seismological parameters defined including PGA, PGV, PGV/PGA, CAV, and .
For calculation of all seismological log-scale misfits, the geometric mean of the seismological parameters from the observed records in NS and EW directions at every station for each case study is considered. The results of station-wise seismological log-scale misfits for all study regions are illustrated in Figure 4, Figure 5 and Figure 6. These illustrations reveal that for all case studies, the overall log-scale misfits are less than 1, in log-scale. However, depending on the study area and station, there is variability in terms of seismological log-scale misfits corresponding to alternative seismological measures. Next, for each station in each study area, the average seismological log-scale misfits are calculated by averaging the individual log-scale misfits in terms of and (including PGA, PGV, PGV/PGA, CAV, and ). The results are presented in Table 4. For Erzincan, as the first case study, among all selected three stations, the least log-scale misfit is obtained for station ERC which is located in the closest distance to the fault plane. The same observation is valid for Duzce and L’Aquila as the second and third case studies, since the least average log-scale misfits are obtained for stations DZC and AQA located in the nearest vicinity of the fault planes.
Next, the mean seismological log-scale misfit for each study area is calculated by taking the average of the entire log-scale misfits at all stations of that case study. The mean seismological log-scale misfits for the Erzincan, Duzce and L’Aquila are, respectively, obtained as 0.21, 0.21 and 0.16. The values demonstrate that the mean seismological log-scale misfits corresponding to the Erzincan and Duzce, both placed on alluvial basins, are larger than the mean log-scale misfit corresponding to the L’Aquila which is mostly located on stiff soil conditions. This may be attributed to the drawback of the stochastic finite-fault method in simulating the predominant basin effects which leads to large amplitude surface waves.
To evaluate the seismological misfits in a more straightforward way, the seismological misfits herein are expressed in terms of the GOF scores as proposed by Olsen and Mayhew [39]. In calculation of the GOF scores for all seismological parameters considered herein, a uniform weight is used. Table 5 presents the results for all stations corresponding to all case studies. Comparison of the statistical values presented in Table 4 and Table 5 reveals the consistency between the seismological GOF scores and the seismological log-scale misfits for all case studies. In other words, for a specific study area, as the average seismological log-scale misfit decreases, the GOF score increases. For the Erzincan and Duzce regions located on alluvial basins, the mean seismological GOF scores are calculated as 57 and 55. For the L’Aquila region mostly located on the rock or stiff soil conditions, the average GOF criteria in terms of the seismological parameters is estimated as 64 which is higher than the previous two case studies. This observation is consistent with the mean seismological log-scale misfit of this case study as obtained previously.
4. Engineering Demand Misfits
In order to have an idea about the use of simulations in earthquake engineering practice, engineering demand misfits are defined next. These misfits are calculated in terms of the differences between the real and simulated values of different engineering demand parameters including Housner Intensity () [59], Acceleration Spectrum Intensity () [60], Velocity Spectrum Intensity ( [60], both Elastic and Inelastic SDOF Acceleration Response Spectra using 5% viscous damping ratio (E-Sa and IE-Sa, respectively) and seismic Input Energy for both Elastic (E-Ei) as well as Inelastic (IE-Ei) SDOF systems. Herein, PSV, Sa and Sv correspond to the Pseudo-Velocity Spectrum, Acceleration Spectrum and Velocity Spectrum, respectively. The terms T and ξ stand for the period and viscous damping ratio, respectively. Seismic input energy is calculated by taking the integral of the equation of motion for an either elastic or inelastic (elasto-plastic model with strength factor of 0.1 and damping ratio of 5% herein) SDOF system as stated in Uang and Bertero [61]:
where, the right-hand side term shows the input energy for an either elastic (E-Ei) or inelastic (IE-Ei) SDOF system. The three left-hand side terms, respectively, correspond to the kinetic energy, damping energy and absorbed energy (including the strain energy for the elastic system in addition to the hysteretic energy for the inelastic system). In this study, the spectral SDOF misfits in terms of spectral acceleration (E-Sa and IE-Sa) and input energy (E-Ei and IE-Ei) are evaluated for different SDOF systems with varying period values between 0.1 and 4 s.
Similar to the seismological misfits, the engineering demand misfits are defined in terms of both the log-scale misfits and GOF scores. Equation (2) is used for calculation of the log-scale misfits including HI, ASI and VSI, while the remaining log-scale misfits in terms of E-Sa, IE-Sa, E-Ei and IE-Ei are evaluated through the following equation:
where, and take values corresponding to, respectively, the simulated and real parameters of E-Sa, IE-Sa, E-Ei or IE-Ei for a SDOF system with the period of T. The term nT is the total number of discrete periods between 0.1 and 4 s.
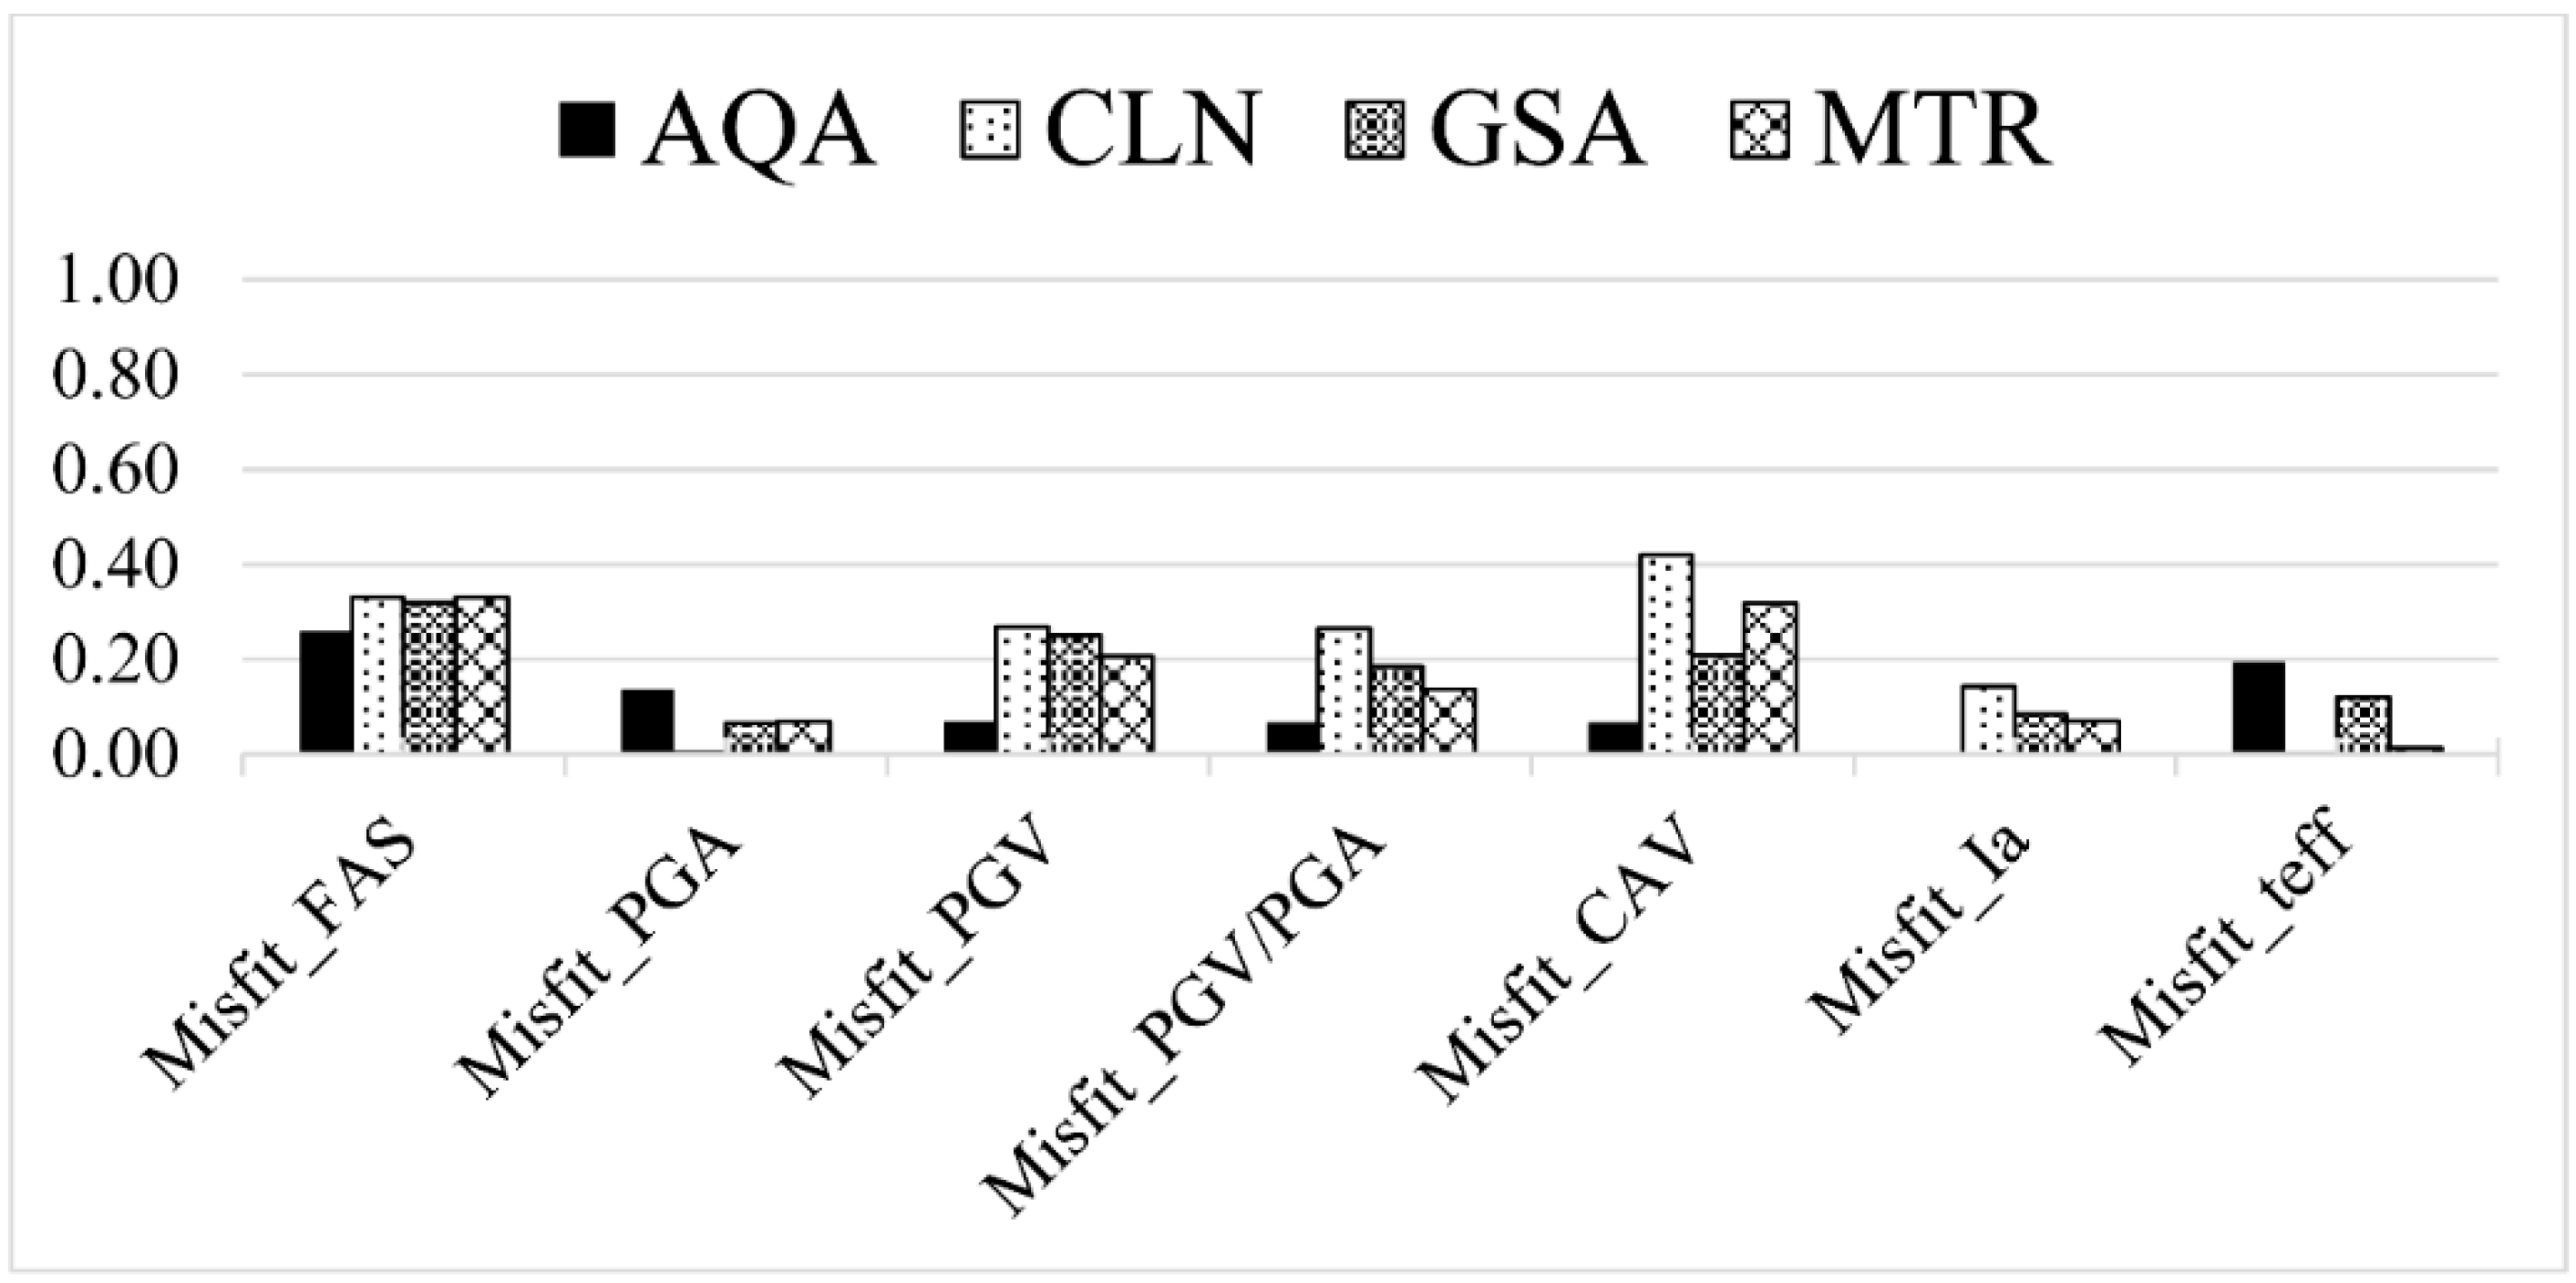
Figure 7, Figure 8 and Figure 9 present the station-wise engineering demand log-scale misfits for all case studies. For each case study, similar to the seismological log-scale misfits, the engineering demand log-scale misfits are defined based on the geometric mean of the engineering demand parameters from the observed records in NS and EW directions at every station. The results corresponding to the station-wise engineering demand log-scale misfits for all case studies reveal that the overall log-scale misfits are less than 1 unit in log-scale. Yet, there is variability in terms of alternative engineering demand log-scale misfits where among all types of these misfits, energy-demand dependent log-scale misfits (the upper bound being approximately 0.6) are generally larger than the other types. This can be attributed to the inherent definition of energy as a more complex phenomenon. The values of the average engineering demand log-scale misfits for each station at each study area are given in Table 6. Results for Erzincan (Table 6) present that, consistent with the mean seismological log-scale misfits (Table 4), the smallest misfit corresponds to the station ERC having the closest distance to the fault plane. The same observation is valid for the other study areas including Duzce and L’Aquila, where the least average engineering demand log-scale misfits correspond to the stations DZC and AQA having the closest distance to the fault planes as compared to the other stations. The same observation is also observed for the seismological log-scale misfits of Table 4.
Next, the mean engineering demand log-scale misfit for each study area is calculated by taking the average of the entire log-scale misfits at all stations of that case study. The mean log-scale misfits corresponding to the engineering demand parameters for the Erzincan, Duzce and L’Aquila regions are, respectively, calculated as 0.27, 0.28 and 0.23. The values show that the mean engineering demand log-scale misfits corresponding to the Erzincan and Duzce, both located on alluvial basins, are greater than that corresponding to the L’Aquila mostly placed on stiff soil conditions. So, the results of engineering demand log-scale misfits are in agreement with the seismological log-scale misfits defined in this study. The maximum difference between the two types of the log-scale misfits is observed for L’Aquila as approximately 30 percent. On the other hand, for Erzincan and Duzce this difference is nearly 25 percent.
Finally, GOF scores proposed by Olsen and Mayhew [39] are calculated for the engineering demand parameters for all case studies in order to compare them with the GOF scores defined previously in terms of the seismological measures. Table 7 presents the results for all stations and all case studies. Similar to the seismological GOF scores, in the calculation of engineering demand GOF scores, a uniform weight is considered for all engineering demand parameters. The comparison of the results in Table 6 and Table 7 reveals that there is good agreement between the engineering demand log-scale misfits and the engineering demand GOF scores for most case studies. In other words, as the average engineering demand log-scale misfit increases for a specific case study at a selected station, the engineering demand GOF score goes down. For the Erzincan and Duzce regions placed on alluvial basins, the mean engineering demand GOF scores are, respectively, 51 and 49. For the third case study, L’Aquila, which is mostly located on the rock or stiff soil conditions, the mean engineering demand GOF score is estimated as 54. The result for L’Aquila is larger than the previous two case studies. This observation is in agreement with the results in terms of the seismological GOF scores. Finally, the results for all case studies reveal the consistency between the seismological and engineering demand log-scale misfits and GOF scores.
5. Conclusions
In this study, the simulated ground motion records of different past earthquakes are evaluated through definition of alternative seismological and engineering demand misfits. To accomplish this, the 1992 Erzincan-Turkey, the 1999 Duzce-Turkey and the 2009 L’Aquila-Italy earthquakes with magnitudes of 6.6, 7.1 and 6.3, respectively are considered. The first two case studies (Erzincan and Duzce) are located in alluvial basins while the last case study (L’Aquila) is placed mostly on the rock and stiff soil conditions. The simulated records validated for the past earthquakes are generated based on the stochastic finite-fault ground motion simulation methodology and considered in the analyses. In order to evaluate the simulated ground motion dataset considered herein, alternative seismological and engineering demand misfits in terms of both log-scale misfits and GOF scores are defined. Seismological parameters employed represent the amplitude, duration and frequency content of the records whereas engineering demand parameters involve the spectral acceleration, velocity and seismic input energy of several SDOF structural systems. Comparisons of the seismological and engineering demand misfits are made both visually and quantitatively. The numerical analyses results lead to the following conclusions:
- An obvious variability is observed in both seismological and engineering demand log-scale misfits calculated in terms of alternative ground motion measures and engineering demand parameters.
- It is demonstrated that the seismological and engineering demand log-scale misfits are generally in good agreement. The average log-scale misfits corresponding to the seismological parameters for the Erzincan, Duzce and L’Aquila cases are calculated as 0.21, 0.21 and 0.16, respectively. On the other hand, the average engineering demand log-scale misfits are 0.27, 0.28 and 0.23 for the same regions, respectively. The maximum difference between the two types of the misfits is approximately 30 percent which is observed for L’Aquila. For Erzincan and Duzce this difference is 25 percent.
- When the log-scale misfits for all engineering demand parameters are compared, it is seen that misfits obtained in terms of either elastic or inelastic seismic input energies are mostly larger than those corresponding to the spectral acceleration responses. This is because energy by definition is a more complex phenomenon. The upper bound of the energy dependent log-scale misfits is computed to be approximately 0.6 that is obtained for Erzincan region.
- The GOF score in terms of the seismological and engineering demand parameters are studied in detail. For the 1992 Erzincan records, the average seismological and engineering demand GOF scores are calculated as 57 and 51, respectively. For the Duzce records, the average seismological GOF score is computed as 55 while the engineering response GOF value is 49. For the L’Aquila records, with stations mostly located in stiff soil conditions, the GOF scores in terms of both seismological and engineering demand parameters are estimated to be higher than the previous two case studies. The values corresponding to the seismological and engineering demand parameters are, respectively, 64 and 54.
- There is consistency between the results of both seismological and engineering demand log-scale misfits as well as GOF scores. For each case study, as the seismological log-scale misfit decreases, the engineering demand log-scale misfit also takes smaller value. In addition, as the seismological GOF score increases, the engineering demand GOF score also increases.
- The stochastic finite-fault ground motion simulation methodology based on the validated input parameters is observed to yield more precise results at stations located in stiff soil conditions. This observation is valid for both seismological and engineering perspectives.
- Overall, the engineering demand misfits are larger than the seismological misfits in logarithmic scale. Similarly, the engineering demand GOF scores are generally less than the seismological GOF values. These discrepancies are believed to arise from the additional uncertainties involved in the structural responses.
Finally, in this study, a misfit evaluation methodology is proposed which includes both seismological and engineering demand misfit definitions. The proposed approach should be further tested with other simulated datasets in different regions. The presented method and similar approaches will provide a means for quantitative evaluation of simulated ground motion records in engineering applications.
Funding
This research received no external funding.
Conflicts of Interest
The funders had no role in the design of the study; in the collection, analyses, or interpretation of data; in the writing of the manuscript, or in the decision to publish the results.
References
- Bao, C.; Xu, F.; Chen, G.; Ma, X.; Mao, M.; Zhang, S. Seismic vulnerability analysis of structure subjected to uneven foundation settlement. Appl. Sci. 2019, 9, 3507. [Google Scholar] [CrossRef]
- Lu, X.; Cheng, Q.; Xu, Z.; Xu, Y.; Sun, C. Real-time city-scale time-history analysis and its application in resilience-oriented earthquake emergency responses. Appl. Sci. 2019, 9, 3497. [Google Scholar] [CrossRef]
- Jianhua, S.; Kai, W.; Sakdirat, K.; Wenhua, C.; Zhanguang, W. experimental investigations into earthquake resistance of steel frame retrofitted by low-yield-point steel energy absorbers. Appl. Sci. 2019, 9, 3299. [Google Scholar] [CrossRef]
- Asteris, P.G.; Moropoulou, A.; Skentou, A.D.; Apostolopoulou, M.; Mohebkhah, A.; Cavaleri, L.; Rodrigues, H.; Varum, H. Stochastic vulnerability assessment of masonry structures: Concepts, modeling and restoration aspects. Appl. Sci. 2019, 9, 243. [Google Scholar] [CrossRef]
- Avsar, O.; Yakut, A.; Caner, A. Analytical fragility curves for ordinary highway bridges in Turkey. Earthq. Spectra 2011, 27, 971–996. [Google Scholar] [CrossRef]
- Shaban, N.; Caner, A.; Yakut, A.; Askan, A.; Karimzadeh Naghshineh, A.; Domanic, A.; Can, G. Vehicle effects on seismic response of a simple-span bridge during shake tests. Earthq. Eng. Struct. D 2015, 44, 889–905. [Google Scholar] [CrossRef]
- Gharibdoust, A.; Aldemir, A.; Binici, B. Seismic behaviour of roller compacted concrete dams under different base treatments. Struct. Infrastruct. E 2019. [Google Scholar] [CrossRef]
- Nikoomanesh, M.R.; Moeini, M.; Goudarzi, M.A. An innovative isolation system for improving the seismic behaviour of liquid storage tanks. Int. J. Pres. Vessel. Pip. 2019, 173, 1–10. [Google Scholar] [CrossRef]
- Ucar, T.; Merter, O. Effect of design spectral shape on inelastic response of RC frames subjected to spectrum matched ground motions. Struct. Eng. Mech. 2019, 69, 293–306. [Google Scholar] [CrossRef]
- American Society of Civil Engineering (ASCE). Minimum Design Loads for Buildings and Other Structures (7–10); Standards ASCE/SEI 7–10; American Society of Civil Engineers: Reston, VA, USA, 2010. [Google Scholar]
- Ministry of Interior, Disaster and Emergency Management Presidency (AFAD). Turkish Building Earthquake Code (TBEC); Official Gazette, Number: 30364; Ministry of Interior, Disaster and Emergency Management Presidency (AFAD): Ankara, Turkey, 2018. (In Turkish) [Google Scholar]
- Olsen, K.B.; Archuleta, R.J.; Matarese, J.R. Three-dimensional simulation of a magnitude 7.75 earthquake on the San Andreas fault. Science 1995, 270, 1628–1632. [Google Scholar] [CrossRef]
- Ghayamghamian, M.R.; Hisada, Y. Near-fault strong motion complexity of the 2003 Bam earthquake (Iran) and low-frequency ground motion simulation. Geophys. J. Int. 2007, 170, 679–686. [Google Scholar] [CrossRef] [Green Version]
- Aagaard, B.T.; Graves, R.W.; Schwartz, D.P.; Ponce, D.A.; Graymer, R.W. Ground-motion modeling of Hayward fault scenario earthquakes, part i: Construction of the suite of scenarios. Bull. Seismol. Soc. Am. 2010, 100, 2927–2944. [Google Scholar] [CrossRef]
- Sadeghi, H.; Miyake, H.; Riahi, A. Strong ground motion simulation of the 2003 Bam, Iran, earthquake using the empirical Green’s function method. J. Seismol. 2013, 17, 297–312. [Google Scholar] [CrossRef]
- Mert, A.; Fahjan, Y.M.; Pinar, A.; Hutchings, L. Earthquake simulation studies for the marmara region using empirical green’s functions method. Earth Sci. 2014, 35, 55–78. (In Turkish) [Google Scholar]
- Taborda, R.; Bielak, J. Ground-motion simulation and validation of the 2008 Chino Hills, California, earthquake using different velocity models. Bull. Seismol. Soc. Am. 2014, 104, 1876–1898. [Google Scholar] [CrossRef]
- Riahi, A.; Sadeghi, H.; Hosseini, S.K. Simulation of 2003 Bam (Iran) earthquake using empirical Green’s function method via very small and near-fault events. Geophys. J. Int. 2015, 201, 1264–1286. [Google Scholar] [CrossRef]
- Heaton, T.; Hartzell, S. Source characteristics of hypothetical subduction earthquakes in the northwestern United States. Bull. Seismol. Soc. Am. 1986, 76, 675–708. [Google Scholar]
- Beresnev, I.A.; Atkinson, G.M. FINSIM: A FORTRAN program for simulating stochastic acceleration time histories from finite faults. Seismol. Res. Lett. 1998, 69, 27–32. [Google Scholar] [CrossRef]
- Beresnev, I.A.; Atkinson, G.M. Stochastic finite-fault modeling of ground motions from the 1994 Northridge, California, earthquake. I. Validation on rock sites. Bull. Seismol. Soc. Am. 1998, 88, 1392–1401. [Google Scholar]
- Motazedian, D.; Atkinson, G.M. Stochastic finite-fault modeling based on a dynamic corner frequency. Bull. Seismol. Soc. Am. 2005, 95, 995–1010. [Google Scholar] [CrossRef]
- Yalcinkaya, E. Stochastic Finite-Fault Modeling of Ground Motions from the June 27, 1998 Adana-Ceyhan Earthquake. Earth Planets Space 2005, 57, 107–115. [Google Scholar] [CrossRef]
- Ugurhan, B.; Askan, A. Stochastic strong ground motion simulation of the 12 November 1999 Düzce (Turkey) earthquake using a dynamic corner frequency approach. Bull. Seismol. Soc. Am. 2010, 100, 1498–1512. [Google Scholar] [CrossRef]
- Heidari, R. Stochastic finite-fault simulation of ground motion from the August 11, 2012, Mw 6.4 Ahar earthquake, northwestern Iran. J. Seismol. 2016, 20, 463–473. [Google Scholar] [CrossRef]
- Askan, A.; Karimzadeh, S.; Bilal, M. Seismic intensity maps for North Anatolian Fault Zone (Turkey) based on recorded and simulated ground motion data. In Neotectonics and Earthquake Potential of the Eastern Mediterranean Region, in Active Global Seismology; Cemen, I., Yilmaz, Y., Eds.; John Wiley & Sons, Inc.: Hoboken, NJ, USA, 2017. [Google Scholar]
- Beresnev, I.A. Simulation of near-fault high-frequency ground motions from the representation theorem. Pure Appl. Geophys. 2017, 174, 4021–4034. [Google Scholar] [CrossRef]
- Uckan, E.; Umut, O.; Sisman, F.N.; Karimzadeh, S.; Askan, A. Seismic Response of Base Isolated Liquid Storage Tanks to Real and Simulated Near Fault Pulse Type Ground Motions. Soil Dyn. Earthq. Eng. 2018, 112, 58–68. [Google Scholar] [CrossRef]
- Kamae, K.; Irikura, K.; Pitarka, A. A technique for simulating strong ground motion using hybrid Green’s function. Bull. Seismol. Soc. Am. 1998, 88, 357–367. [Google Scholar]
- Halldorsson, B. Near-fault and far-field strong ground-motion simulation for earthquake engineering applications using the specific barrier model. J. Struct. Eng. 2010, 137, 433–444. [Google Scholar] [CrossRef]
- Mai, P.; Imperatori, W.; Olsen, K. Hybrid broadband ground-motion simulations: Combining long-period deterministic synthetics with high-frequency multiple S-to-S backscattering. Bull. Seismol. Soc. Am. 2010, 100, 2124–2142. [Google Scholar] [CrossRef]
- Tanircan, G. Ground Motion Simulation for Istanbul with a three dimensional velocity Model. J. Fac. Eng. Archit. Gaz. 2012, 2, 27–36. (In Turkish) [Google Scholar]
- Pitarka, A.; Thio, H.K.; Somerville, P.; Bonilla, L.F. Broadband ground-motion simulation of an intraslab earthquake and nonlinear site response: 2010 Ferndale, California, earthquake case study. Seismol. Res. Lett. 2013, 84, 785–795. [Google Scholar] [CrossRef]
- Star, L.; Stewart, J.P.; Graves, R.W. Comparison of ground motions from hybrid simulations to NGA prediction equations. Earthq. Spectra 2011, 27, 331–350. [Google Scholar] [CrossRef]
- Seyhan, E.; Stewart, J.P.; Graves, R.W. Calibration of a semistochastic procedure for simulating high frequency ground motions. Earthq. Spectra 2013, 29, 1495–1519. [Google Scholar] [CrossRef]
- Karagoz, O.; Chimoto, K.; Yamanaka, H.; Ozel, O.; Citak, S.O. Broadband Ground-Motion Simulation of the May 2014 Gokceada (North Aegean Sea) Earthquake (Mw 6.9) in NW Turkey Considering Local Soil Effects. B Earthq. Eng. 2018, 16, 23–43. [Google Scholar] [CrossRef]
- Anderson, J.G. Quantitative measure of the goodness-of-fit of synthetic seismograms. In Proceedings of the 13th World Conference on Earthquake Engineering, Vancouver BC, Canada, 1–6 August 2004; pp. 775–784. [Google Scholar]
- Kristekova, M.; Kristed, J.; Moczo, P.; Day, S.M. Misfit criteria for quantitative comparison of seismograms. Bull. Seismol. Soc. Am. 2006, 96, 1836–1850. [Google Scholar] [CrossRef]
- Olsen, K.B.; Mayhew, J.E. Goodness-of-fit criteria for broadband synthetic seismograms, with application to the 2008 Mw 5.4 Chino Hills, California, earthquake. Seismol. Res. Lett. 2010, 81, 715–723. [Google Scholar] [CrossRef]
- Naeim, F.; Graves, R.W. The case for seismic superiority of well-engineered tall buildings. Struct. Design Tall Spec. Build. 2006, 14, 401–416. [Google Scholar] [CrossRef]
- Jones, P.; Zareian, F. Relative safety of high-rise and low-rise moment-resisting frames in Los Angeles. Struct. Design Tall Spec. Build. 2010, 19, 183–196. [Google Scholar] [CrossRef]
- AFAD, Strong Ground Motion Database of Turkey. Available online: https://deprem.afad.gov.tr/ (accessed on 10 September 2018).
- Utkucu, M.; Nalbant, S.S.; McCloskey, J.; Steacy, S.; Alptekin, Ö. Slip distribution and stress changes associated with the 1999 November 12, Duzce (Turkey) earthquake (Mw = 7.1). Geophys. J. Int. 2003, 153, 29–241. [Google Scholar] [CrossRef]
- Cirella, A.; Piatanesi, A.; Cocco, M.; Tinti, E.; Scognamiglio, L.; Michelini, A.; Lomax, A.; Boschi, E. Rupture history of the 2009 L’Aquila (Italy) earthquake from non-linear joint inversion of strong motion and GPS data. Geophys. Res. Lett. 2009, 36, L19304. [Google Scholar] [CrossRef]
- Ugurhan, B.; Askan, A.; Akinci, A.; Malagnini, L. Strong-ground-motion simulation of the 6 April 2009 L’Aquila, Italy, earthquake. Bull. Seismol. Soc. Am. 2012, 102, 14291445. [Google Scholar] [CrossRef]
- Askan, A.; Sisman, F.N.; Ugurhan, B. Stochastic strong ground motion simulations in sparsely-monitored regions: A validation and sensitivity study on the 13 March 1992 Erzincan (Turkey) earthquake. Soil Dyn. Earthq. Eng. 2013, 55, 170–181. [Google Scholar] [CrossRef]
- Askan, A.; Karimzadeh, S.; Asten, M.; Kılıc, N.; Sisman, F.N.; Erkmen, C. Assessment of seismic hazard in Erzincan (Turkey) region: Construction of local velocity models and evaluation of potential ground motions. Turk. J. Earth Sci. 2015, 24, 529–565. [Google Scholar] [CrossRef]
- Brune, J. Tectonic stress and the spectra of seismic shear waves from earthquakes. J. Geophys. Res. 1970, 75, 4997. [Google Scholar] [CrossRef]
- Boore, D.M. Stochastic simulation of high-frequency ground motions based on seismological models of the radiated spectra. Bull. Seismol. Soc. Am. 1983, 73, 1865–1894. [Google Scholar]
- Akinci, A.; Malagnini, L.; Herrmann, R.B.; Pino, N.A.; Scognamiglio, L.; Eyidogan, H. High frequency ground motion in the Erzincan region, Turkey: Inferences from small earthquakes. Bull. Seismol. Soc. Am. 2001, 91, 1446–1455. [Google Scholar] [CrossRef]
- Applied Technology Council (ATC). NEHRP Guidelines for the Seismic Rehabilitation of Buildings; Report No. FEMA 273 (ATC-33 Project); Federal Emergency Management Agency: Washington, DC, USA, 1997. [Google Scholar]
- Akyuz, H.S.; Hartleb, R.; Barka, A.; Altunel, E.; Sunal, G.; Meyer, B.; Armijo, R. Surface rupture and slip distribution of the 12 November 1999 Duzce earthquake (M 7.1), North Anatolian fault, Bolu, Turkey. Bull. Seismol. Soc. Am. 2002, 92, 61–66. [Google Scholar] [CrossRef]
- Salamon, A. The Mw6. 3, 2009, L’aquila Earthquake, Central Italy: Report of the GSI Team Visit to the Affected Area; Report; Ministry of National Infrastructures-Geological Survey of Israel: Jerusalem, Israel, 2010. [Google Scholar]
- EC8, Eurocode 8. Design of Structures for Earthquake Resistance. Part 1: General Rules, Seismic Actions and Rules for Buildings; European Norm, Management Centere: Brussels, Belgium, 2004. [Google Scholar]
- ITACA. Italian Accelerometric Archive, Version 2.2. Available online: http://itaca.mi.ingv.it (accessed on 20 November 2018).
- EPRI. A Criterion for Determining Exceedance of the Operating Basis Earthquake; (Report No. EPRI NP-5930); Electrical Power Research Institute: Palo Alto, CA, USA, 1988. [Google Scholar]
- Arias, A. A Measure of Earthquake Intensity; MIT Press: Cambridge, MA, USA, 1970; pp. 438–483. [Google Scholar]
- Trifunac, M.D.; Brady, A.G. A study on the duration of strong earthquake ground motion. Bull. Seismol. Soc. Am. 1975, 65, 581–626. [Google Scholar]
- Housner, G.W. Behavior of structures during earthquakes. J. Eng. Mech. Div. ASCE 1959, 85, 109–129. [Google Scholar]
- Von Thun, J.L.; Roehm, L.H.; Scott, G.A.; Wilson, J.A. Earthquake ground motions for design and analysis of dams. Geotech. Spec. Publ: Earthq. Eng. Soil. Dyn. II—Recent Adv. Ground Motion Eval. 1988, 20, 463–481. [Google Scholar]
- Uang, C.; Bertero, V.V. Evaluation of seismic energy in structures. Earthq. Eng. Struct. D 1990, 19, 77–90. [Google Scholar] [CrossRef]
Figure 1.
Selected stations along with the epicenter of the 1992 Erzincan event where the rectangular box shows the fault projection.
Figure 1.
Selected stations along with the epicenter of the 1992 Erzincan event where the rectangular box shows the fault projection.

Figure 2.
Selected stations along with the epicenter of the 1999 Duzce event where the rectangular box shows the fault projection.
Figure 2.
Selected stations along with the epicenter of the 1999 Duzce event where the rectangular box shows the fault projection.

Figure 3.
Selected stations along with the epicenter of the 2009 L’Aquila event where the rectangular box shows the fault projection.
Figure 3.
Selected stations along with the epicenter of the 2009 L’Aquila event where the rectangular box shows the fault projection.

Figure 4.
Station-wise seismological log-scale misfits between the real and simulated records of the Erzincan event.
Figure 4.
Station-wise seismological log-scale misfits between the real and simulated records of the Erzincan event.

Figure 5.
Station-wise seismological log-scale misfits between the real and simulated records of the Duzce event.
Figure 5.
Station-wise seismological log-scale misfits between the real and simulated records of the Duzce event.

Figure 6.
Station-wise seismological log-scale misfits between the real and simulated records of the L’Aquila event.
Figure 6.
Station-wise seismological log-scale misfits between the real and simulated records of the L’Aquila event.

Figure 7.
Engineering demand log-scale misfits in terms of HI, ASI, VSI, E-Sa, IE-Sa, E-Ei, and IE-Ei between the real and simulated records of the Erzincan event.
Figure 7.
Engineering demand log-scale misfits in terms of HI, ASI, VSI, E-Sa, IE-Sa, E-Ei, and IE-Ei between the real and simulated records of the Erzincan event.

Figure 8.
Engineering demand log-scale misfits in terms of HI, ASI, VSI, E-Sa, IE-Sa, E-Ei, and IE-Ei between the real and simulated records of the Duzce event.
Figure 8.
Engineering demand log-scale misfits in terms of HI, ASI, VSI, E-Sa, IE-Sa, E-Ei, and IE-Ei between the real and simulated records of the Duzce event.

Figure 9.
Engineering demand log-scale misfits in terms of HI, ASI, VSI, E-Sa, IE-Sa, E-Ei, and IE-Ei between the real and simulated records of the L’Aquila event.
Figure 9.
Engineering demand log-scale misfits in terms of HI, ASI, VSI, E-Sa, IE-Sa, E-Ei, and IE-Ei between the real and simulated records of the L’Aquila event.


Table 1.
Information on the selected stations corresponding to the 1992 Erzincan (Turkey) event with Mw = 6.6.
Table 1.
Information on the selected stations corresponding to the 1992 Erzincan (Turkey) event with Mw = 6.6.
| Station | Code | Latitude (°) | Longitude (°) | Site Class (NEHRP) [51] | Repi (km) | PGA-EW (cm/s2) | PGA-NS (cm/s2) | PGA-Sim. (cm/s2) | PGV-EW (cm/s) | PGV-NS (cm/s) | PGV-Sim. (cm/s) |
|---|---|---|---|---|---|---|---|---|---|---|---|
| Erzincan-Merkez | ERC | 39.752 | 39.487 | D | 12.83 | 430.66 | 509.20 | 445.81 | 56.80 | 79.84 | 33.25 |
| Refahiye | REF | 39.899 | 38.768 | C | 76.45 | 75.26 | 66.78 | 39.36 | 3.67 | 3.93 | 2.30 |
| Tercan | TER | 39.777 | 40.391 | D | 65.62 | 25.56 | 37.90 | 35.95 | 4.30 | 2.86 | 3.07 |
Table 2.
Information on the selected stations corresponding to the 1999 Duzce (Turkey) event (Mw = 7.1).
Table 2.
Information on the selected stations corresponding to the 1999 Duzce (Turkey) event (Mw = 7.1).
| Station | Code | Latitude (°) | Longitude (°) | Site Class (NEHRP) [51] | Repi (km) | PGA-EW (cm/s2) | PGA-NS (cm/s2) | PGA-Sim. (cm/s2) | PGV-EW (cm/s) | PGV-NS (cm/s) | PGV-Sim. (cm/s) |
|---|---|---|---|---|---|---|---|---|---|---|---|
| Duzce | DZC | 40.8436 | 31.1488 | D | 9.314 | 520.41 | 328.03 | 332.32 | 86.54 | 54.53 | 70.69 |
| Goynuk | GYN | 40.3965 | 30.7830 | D | 55.163 | 22.17 | 25.79 | 55.50 | 5.84 | 4.49 | 4.53 |
| Iznik | IZN | 40.4416 | 29.7168 | D | 123.67 | 20.06 | 21.25 | 32.76 | 1.97 | 2.27 | 5.16 |
| Izmit | IZT | 40.7665 | 29.9172 | C | 100.7 | 16.41 | 18.73 | 28.40 | 2.27 | 1.73 | 5.75 |
Table 3.
Information on the selected stations corresponding to the 2009 L’Aquila (Italy) event (Mw = 6.3).
Table 3.
Information on the selected stations corresponding to the 2009 L’Aquila (Italy) event (Mw = 6.3).
| Station | Code | Latitude (°) | Longitude (°) | Site Class (EC8) [54] | Repi (km) | PGA-EW (cm/s2) | PGA-NS (cm/s2) | PGA-Sim. (cm/s2) | PGV-EW (cm/s) | PGV-NS (cm/s) | PGV-Sim. (cm/s) |
|---|---|---|---|---|---|---|---|---|---|---|---|
| V. Aterno-F. Aterno | AQA | 42.376 | 13.339 | B | 4.2 | 350.46 | 347.59 | 254.94 | 29.86 | 24.07 | 22.87 |
| Celano | CLN | 42.085 | 13.5207 | A | 31.79 | 73.49 | 76.57 | 75.59 | 4.61 | 6.56 | 10.21 |
| Gran Sasso | GSA | 42.421 | 13.5194 | B | 14.15 | 131.88 | 139.02 | 157.36 | 9.63 | 7.41 | 15.03 |
| Montereale | MTR | 42.524 | 13.2448 | A | 22.13 | 42.17 | 51.65 | 54.66 | 3.25 | 3.09 | 5.09 |
Table 4.
Average seismological log-scale misfits at all stations for all case studies.
| Case Study | Station | Average Seismological Log-Scale Misfit |
|---|---|---|
| Erzincan | ERC | 0.16 |
| REF | 0.25 | |
| TER | 0.22 | |
| Duzce | DZC | 0.11 |
| GYN | 0.27 | |
| IZN | 0.22 | |
| IZT | 0.26 | |
| L’Aquila | AQA | 0.11 |
| CLN | 0.20 | |
| GSA | 0.18 | |
| MTR | 0.16 |
Table 5.
Station-wise seismological GOF scores for all case studies.
| Case Study | Station | Seismological GOF Score |
|---|---|---|
| Erzincan | ERC | 68 |
| REF | 49 | |
| TER | 54 | |
| Duzce | DZC | 75 |
| GYN | 47 | |
| IZN | 52 | |
| IZT | 46 | |
| L’Aquila | AQA | 74 |
| CLN | 58 | |
| GSA | 60 | |
| MTR | 64 |
Table 6.
Average engineering demand log-scale misfits at all stations for all case studies.
| Case Study | Station | Average Engineering Demand Log-Scale Misfit |
|---|---|---|
| Erzincan | ERC | 0.13 |
| REF | 0.37 | |
| TER | 0.30 | |
| Duzce | DZC | 0.12 |
| GYN | 0.38 | |
| IZN | 0.30 | |
| IZT | 0.30 | |
| L’Aquila | AQA | 0.13 |
| CLN | 0.33 | |
| GSA | 0.28 | |
| MTR | 0.19 |
Table 7.
Station-wise engineering demand GOF scores for all case studies.
| Case Study | Station | Engineering Demand GOF Score |
|---|---|---|
| Erzincan | ERC | 68 |
| REF | 35 | |
| TER | 49 | |
| Duzce | DZC | 79 |
| GYN | 39 | |
| IZN | 38 | |
| IZT | 45 | |
| L’Aquila | AQA | 72 |
| CLN | 42 | |
| GSA | 44 | |
| MTR | 59 |
© 2019 by the author. Licensee MDPI, Basel, Switzerland. This article is an open access article distributed under the terms and conditions of the Creative Commons Attribution (CC BY) license (http://creativecommons.org/licenses/by/4.0/).
Share and Cite
MDPI and ACS Style
Karimzadeh, S. Seismological and Engineering Demand Misfits for Evaluating Simulated Ground Motion Records. Appl. Sci. 2019, 9, 4497. https://doi.org/10.3390/app9214497
AMA Style
Karimzadeh S. Seismological and Engineering Demand Misfits for Evaluating Simulated Ground Motion Records. Applied Sciences. 2019; 9(21):4497. https://doi.org/10.3390/app9214497
Chicago/Turabian StyleKarimzadeh, Shaghayegh. 2019. "Seismological and Engineering Demand Misfits for Evaluating Simulated Ground Motion Records" Applied Sciences 9, no. 21: 4497. https://doi.org/10.3390/app9214497
Note that from the first issue of 2016, this journal uses article numbers instead of page numbers. See further details here.