Article

The Effect of Tempering on the Microstructure and Mechanical Properties of a Novel 0.4C Press-Hardening Steel

1
Materials and Mechanical Engineering, Centre for Advanced Steels Research, University of Oulu, 90014 Oulu, Finland
2
Raahe Works, SSAB Europe, 92100 Raahe, Finland
*
Author to whom correspondence should be addressed.
Appl. Sci. 2019, 9(20), 4231; https://doi.org/10.3390/app9204231
Submission received: 12 September 2019 / Revised: 2 October 2019 / Accepted: 4 October 2019 / Published: 10 October 2019
(This article belongs to the Special Issue Recent Trends in Advanced High-Strength Steels)

Abstract

:

Featured Application

Potential wear-resistant steel for harsh environments in agricultural sector, i.e., chisel ploughs and disc harrows.

Abstract

In this paper, the effects of different tempering temperatures on a recently developed ultrahigh-strength steel with 0.4 wt.% carbon content were studied. The steel is designed to be used in press-hardening for different wear applications, which require high surface hardness (650 HV/58 HRC). Hot-rolled steel sheet from a hot strip mill was austenitized, water quenched and subjected to 2-h tempering at different temperatures ranging from 150 °C to 400 °C. Mechanical properties, microstructure, dislocation densities, and fracture surfaces of the steels were characterized. Tensile strength greater than 2200 MPa and hardness above 650 HV/58 HRC were measured for the as-quenched variant. Tempering decreased the tensile strength and hardness, but yield strength increased with low-temperature tempering (150 °C and 200 °C). Charpy-V impact toughness improved with low-temperature tempering, but tempered martensite embrittlement at 300 °C and 400 °C decreased the impact toughness at −40 °C. Dislocation densities as estimated using X-ray diffraction showed a linear decrease with increasing tempering temperature. Retained austenite was present in the water quenched and low-temperature tempered samples, but no retained austenite was found in samples subjected to tempering at 300 °C or higher. The substantial changes in the microstructure of the steels caused by the tempering are discussed.

1. Introduction

Steels with yield strength greater than 1300 MPa are becoming more widely used in different applications. An increase in strength provides the possibility to use less material, i.e., to design and use lighter structures. The result is increased energy efficiency and fuel savings that not only translate into financial gains but also may be required by different norms and regulations. Also, increased steel strength leads to higher hardness and abrasive wear resistance. Generally, the strongest steels used in structural, wear, and protection applications have martensitic microstructures. The hardness of quenched martensite increases with the increasing carbon content (up to 0.6–0.8 wt.%) up to more than 800 HV with tensile strength levels exceeding 2500 MPa for quenched plain carbon and low-alloy compositions [1]. Martensite may be lath or plate-like or a mixture of both. Below the 0.6 wt.% carbon content, the fine lath martensite is dominant. The substructure of prior austenite grains in martensite can be divided into packets which contain blocks and sub-blocks of individual laths [2,3]. These features comprise the fine and complex structure of the martensite phase that can be altered by chemical composition and processing. Carbon atoms segregated in the structure, prior austenite grain size, dislocation density, different precipitates, and retained austenite together contribute to the superior strength and hardness of martensite, with carbon responsible for the main contribution [1,2,3,4,5,6,7,8]. Furthermore, the highest hardness and strength levels are often achieved by expensive, heavy alloying, or by the utilization of time-consuming heat treatments in order to meet requirements related to usability and toughness. However, thermomechanical controlled processing (TMCP) is nowadays utilized to refine the grain structure for improved impact toughness, especially in the case of ultrahigh-strength steels. The rolling schedule is adjusted to include passes in the non-recrystallization regime (NRX), which results in an elongated austenite grain structure with an increased dislocation density and improved impact toughness [9,10,11]. However, the formability of ultrahigh-strength steels with relatively high carbon content is limited and might turn out be challenging when producing complex shapes or small components, i.e., blades for furrow ploughs or disc harrows. Therefore, these types of high-hardness steels are provided in the hot-rolled condition to the parts manufacturer for further processing: the final shape is given to the part in the reheating process while in the soft and easily formable condition, after which suitable quenching can be applied. Different press and hardening methods are utilized for processing high-hardness steels. Oil, water, or different aqueous solutions are used for the quenching, which requires careful planning to avoid quench-cracking. Often the process includes tempering to improve the impact toughness of the material. When abrasive wear resistance is required, high hardness needs to be retained after tempering. AISI 4340, 300M, and 51CrV4 with a carbon content of around 0.4–0.5 wt.% are commonly used in the aforementioned applications.
Tempering is a common method to improve the ductility and impact toughness of steels. It is widely applied for ultrahigh-strength martensitic steels due to the limited toughness properties of quenched medium- and high-carbon steels. Often, the increasing carbon content and the subsequent increase in hardness and strength impairs the toughness properties of carbon steels in their as-quenched state. Therefore, different temperatures and tempering times can be used depending on the desired mechanical properties, such as suitable hardness and impact toughness levels [1,12,13]. Tempering temperatures up to 650 °C can be utilized to adjust the mechanical properties of steels for different applications: low-alloy, low-carbon steels benefit from improved low-temperature impact toughness and bendability properties. Low-temperature tempering in the temperature range of 150–200 °C is applied to ultrahigh-strength carbon steels with a medium carbon content, as it usually provides a significant improvement of impact toughness without drastically decreasing hardness and tensile strength. Generally, the tempering temperature affects the mechanical properties more than the tempering time when tempering temperatures are 500 °C or less [14]. Apart from the tempering applied after the quenching process, auto-tempering may also take place during the cooling process. The higher the martensite start temperature (Ms), the more time there is for the carbon atoms to diffuse and form carbides during quenching [12]. The martensite that is formed near the Ms temperature has the highest probability for auto-tempering with the remaining cooling process [13]. After auto-tempering, the fraction of less-tempered hard martensite decreases, which in turn may improve ductility [15] and impact toughness [16].
In order to study the effect of tempering on an ultrahigh-strength quenched steel, a newly developed quench and press-hardening steel, was investigated. Different tempering temperatures were applied to understand the microstructural changes and the evolution of mechanical properties. The steel has been designed to be used in its as-quenched or tempered condition in different applications that require high abrasive wear resistance.

2. Materials and Methods

A hot-rolled steel sheet with 10 mm thickness was obtained from the strip mill production line from SSAB, Raahe, Finland. The large sheet was cut to smaller test plates with dimensions of 300 mm × 250 mm. The plates were then reheated and held at 980 °C for 40 min before submerging into a water tank for a rapid quenching (cooling rate > 80 °C/s). The quenched samples were then tempered for 2 h at selected temperatures (150 °C, 200 °C, 300 °C, and 400 °C). A hot-rolled sample and water quenched sample without any tempering were also included for comparison (abbreviated HR and WQ in the article, respectively).
A Gleeble 3800 thermomechanical simulator was used in order to create a continuous cooling transformation (CCT) diagram for the steel. Samples were cut from the received hot-rolled material in the longitudinal direction. A total of six cooling rates in the range 3–96 °C/s were applied. Samples were machined to a cylindrical shape with dimensions of 6 mm × 9 mm (cooling rates from 3 to 48 °C/s) or 5 mm × 7.5 mm (cooling rate 96 °C/s). The heating rate was 10 °C/s and austenitization temperature was 920 °C. The holding time was 10 min for each sample. No strain was applied during the Gleeble testing. Phase transformation temperatures were identified from the Gleeble dilatation data and phase fractions were calculated from the images taken with an optical microscope. In order to simulate the industrial reheating and quenching process, the samples were not homogenized prior to the Gleeble testing.
The chemical composition for the steel is presented in Table 1. The composition has been designed to give full hardening for a plate thickness of approximately 12 mm. Carbon content was 0.4 wt.%, which should provide hardness exceeding 650 HV10 (Vickers hardness number) or 58 HRC (Rockwell C hardness). The avoidance of expensive alloying elements, such as nickel, was a major consideration in the alloy design. Instead of nickel and chromium, molybdenum has been selected as the main hardenability element along with the medium carbon content. Earlier trials with laboratory casts showed that molybdenum had a strong effect on the hardenability of the steel and could be utilized to achieve the desired hardness levels. Manganese has been kept relatively low to avoid the possible deterioration of impact toughness inflicted by segregation. Microalloying with Nb and Ti has been used to prevent excessive grain growth at higher austenitization temperatures. The studied steel has a lower manganese, chromium, and nickel content in comparison to the well-known commercial steel grades, such as the AISI 4340, 300M, and 51CrV4. Furthermore, commercial boron steels used in similar applications often have notably higher manganese levels.
The test plates were water jet cut and machined to suitable dimensions for mechanical testing and microstructural inspection. Three longitudinal flat tensile test specimens of each material variant were tested using an MTS 810 servohydraulic universal testing machine. The dimensions for the reduced section of the tensile test specimens were 10 mm × 20 mm × 120 mm. Charpy-V impact toughness testing was conducted at room temperature and at −40 °C with three specimens for each material condition at both temperatures. The transverse impact tests were made according to ISO 148-1 standard. The specimen size was 7.5 mm × 10 mm × 55 mm for the impact tests for all samples. A Struers Duramin A-300 tester was used to measure hardness with a minimum of seven indentations (HV10) through the thickness of the material.
Microstructural characterization was done with a field emission scanning electron microscope (FESEM, Zeiss Sigma) and with a laser scanning confocal microscope (Keyence VK-X200). Samples were polished and etched with Nital (2%) prior to the inspection. Prior austenite grain size (PAGS) measurements were done from planar sections of samples etched with picric acid.
X-Ray diffraction (XRD) studies were carried out on specimens with their surfaces at the quarter-thickness depth from the surface using a Rigaku SmartLab 9 kW X-ray diffractometer with cobalt Kα radiation. PDXL2 analysis software (version 2.6.1.2, Rikagu Corporation, Tokyo, Japan) was used to estimate the lattice parameters, microstrains, and crystallite sizes of the studied steels. Rietveld’s whole powder profile fitting method was used also for the determination of retained austenite content. Furthermore, dislocation densities were calculated using the Williamson–Hall method (Equation (1)) [17,18]:
ρ = ρ s ρ p
where ρs is the dislocation density calculated from strain broadening, and ρp is the dislocation density calculated from crystallite size. According to Williamson et al. ρs and ρp can be calculated using the following Equations (2) and (3) [17,18]:
ρ s = k   ε 2 F   b 2
and
ρ p = 3 n D 2
where ε is the microstrain, b is the Burgers vector, F is an interaction factor assumed to be 1, factor k is assumed as 14.4 for body-centred cubic metals, and D is crystallite size. In the equation, n is dislocations per block face, assumed as 1 [18].

3. Results

3.1. Dilatometry and CCT Diagram

The continuous cooling transformation (CCT) diagram determined from the Gleeble dilatometer traces is presented in Figure 1. The hardness was nearly 650 HV10 with the highest cooling rate (96 °C/s), but 600 HV10 was still achieved with 24 °C/s. Since the hardness level of 600 HV was still obtained with lower cooling rates, more time for auto-tempering could be provided with the use of a slower cooling media, such as oil or a polymer suspension. The slower cooling rates will not result in a fully martensitic microstructure, as shown in the CCT diagram of Figure 1 and the micrographs in Figure 2. The martensite start temperature was estimated as approximately 350–380 °C based on the CCT diagram.
The optical microscope images show that low cooling rates produced multiphase microstructures. The hot-rolled (HR) sample represents the microstructure prior to Gleeble testing or reheating and quenching. The lowest cooling rate (3 °C/s) tested with the Gleeble had a highly mixed microstructure consisting of bainite (approximately 50–55%), pearlite (30–40%), and ferrite (5–10%). There was very little pearlite and ferrite with a cooling rate of 12 °C/s and the phase fractions were estimated at 50%–60% for martensite and 40–50% for bainite. Bainite was still present at 48 °C/s but at less than 10%. The highest cooling rate (96 °C/s) showed close to 100% martensite with only a minor fraction of bainite. The phase fractions were highly localized within the Gleeble samples with the slow and medium cooling rates (<48 °C/s). Based on the dilatometry, high quenching rates can be used to obtain hard, fully martensitic microstructures, whereas slower cooling rates with possible isothermal holding provide possibilities for obtaining different bainitic or multiphase structures.

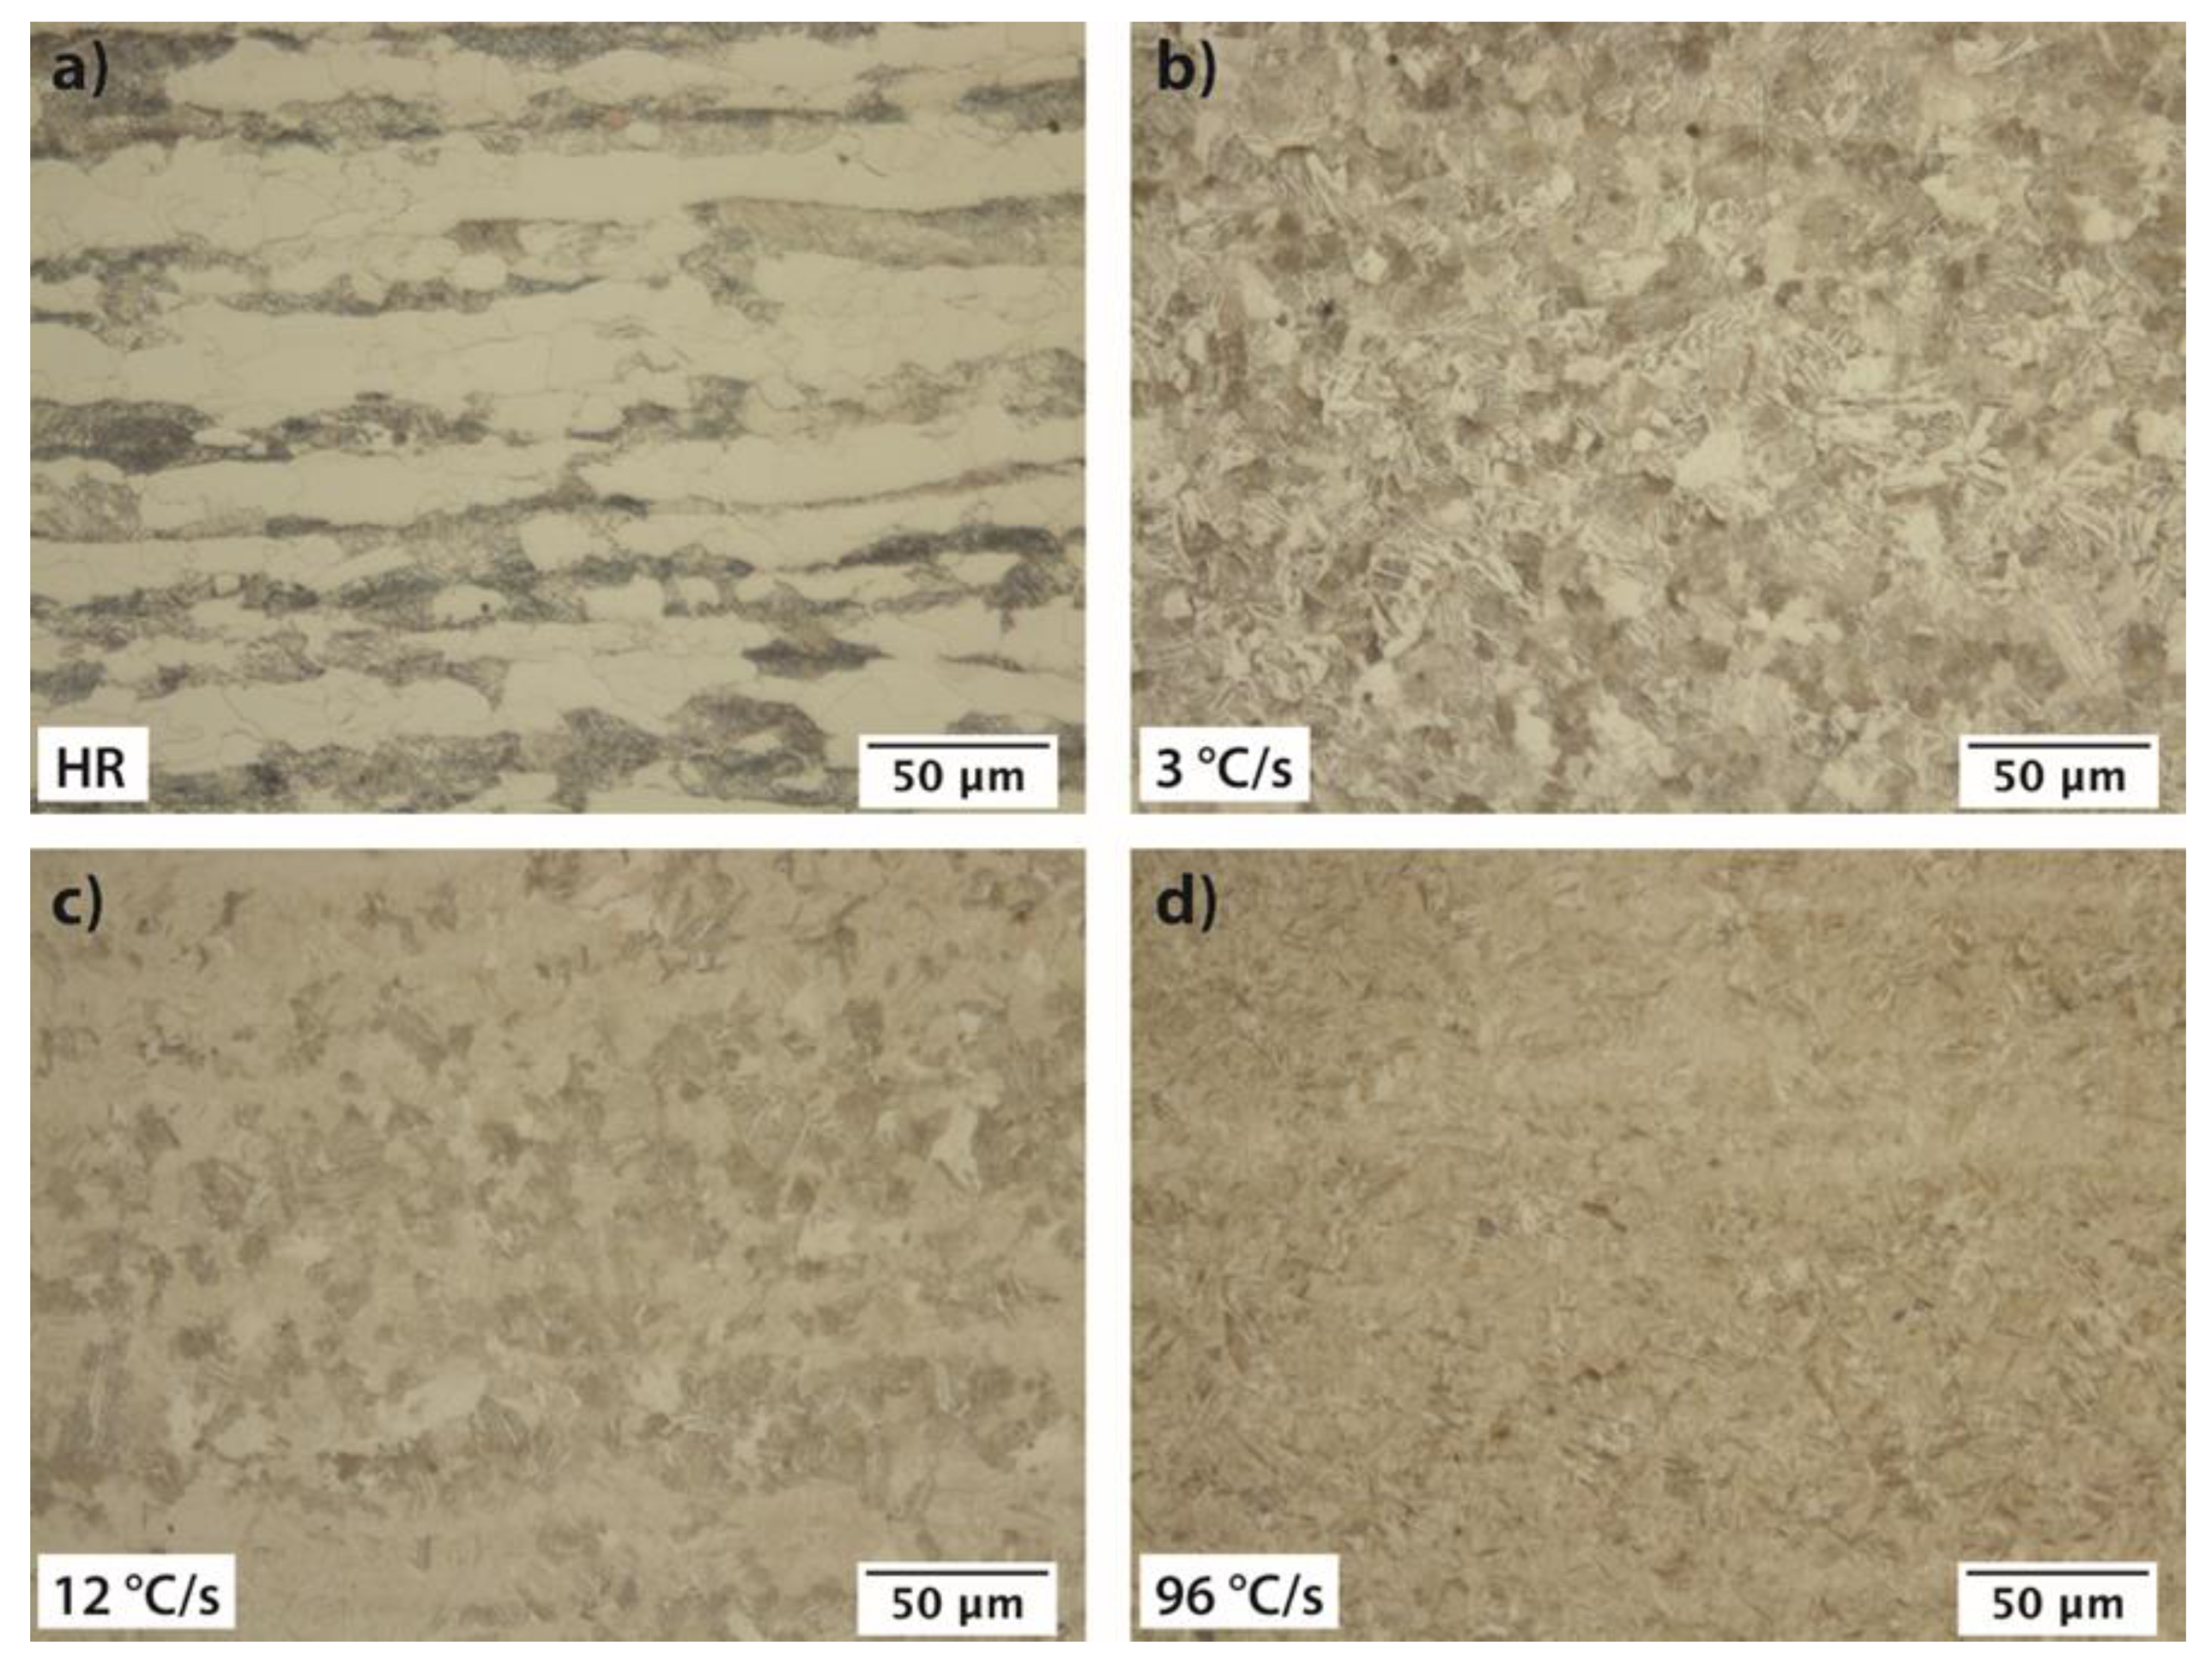
3.2. Microstructures

The hot-rolled sample (HR) showed a banded ferritic-pearlitic microstructure with no martensite present (Figure 2a) and with a hardness below 200 HV10. The absence of martensite and bainite was due to the low level of alloying combined with the fact that the hot-rolled material was coiled at around 700 °C, after which it cooled very slowly, which can take up to three days to cool down to room temperature. Figure 3a shows the resulting ferritic-pearlitic microstructure. This is a typical microstructure for plain carbon steels when quenching has not been applied.
Microstructural evolution during tempering is seen in the quenched and tempered samples in the FESEM images in Figure 3b–f. Starting from the water quenched sample, the microstructure consisted of lath-like martensite comprising packets, blocks, and sub-blocks. The darkest auto-tempered martensite was the most dominant phase in the water quenched microstructure (Figure 3b), as is typical of other commercial medium carbon steels, such as some wear-resistant steels [19,20,21,22,23]. Auto-tempering is desirable for this type of steel in order to improve the impact toughness in the as-quenched state. Despite being subjected to rapid water cooling, the samples did not display any signs of immediate or delayed quench-cracking indicating that milder quenching media are not required for the 10 mm plate thickness concerned, at least.
The effects of tempering begin to appear more distinctly at 150 °C. The fraction of precipitate-rich, light areas increased, but the precipitate size was generally very small. The sample tempered at 200 °C showed significantly less untempered martensite, i.e., the darkest areas without visible traces of precipitates, than the water quenched (WQ) and 150 °C samples. This is consistent with the first stages of tempering, i.e., precipitation of fine, presumably transition, carbides [12,13]. Both the 150 °C and 200 °C samples contained a high number density of fine transition carbides, but in the sample tempered at 200 °C the precipitates were notably larger, and their needle-like shape could be distinguished more easily. These differences result in the microstructure of the 200 °C sample showing more light contrast in the low magnification FESEM images.
The water quenched (WQ) sample had more carbide-free areas while the auto-tempering had introduced some carbide formation (Figure 4a). In the FESEM images, this was also seen as the different depth of the areas as the regions could be assumed to have different carbon concentrations in the solid solution [24]. This supports the concept of martensite formation in rapid sequences rather than as a single massive transformation throughout the whole sample at once. The darker areas appeared as there would have been nearly a total absence of precipitates. Therefore, this martensite may be assumed to have had formed in the later stages of the phase transformation, having less time for the interstitial carbon to diffuse into precipitates.
At the higher tempering temperatures of 300 °C and 400 °C there is a higher contrast between the dark martensite matrix and the white carbides (Figure 4b,c), presumably cementite (θ-carbide), which have replaced the small transition carbides found at the lower tempering temperatures [12]. The various lath, block, packet, and grain boundaries are seen to act as sites for cementite nucleation [25]. The precipitates are clearly coarser after tempering at 400 °C than at 300 °C. Therefore, the microstructure of the 400 °C tempered sample was assumed closer to conventional tempered ferrite and cementite than that of martensite [12,13].
Based on the FESEM imaging, the evolution of the martensitic steel from the as-quenched state to the 400 °C tempered microstructure appeared as to have decreased homogeneity. The water quenched sample had far less precipitates and they were clearly smaller than those of the tempered steels. Then, the carbon migration slowly altered the structure into a clearer two-component structure with the dark matrix and the white carbides when the tempering temperature exceeded 300 °C. The water quenched variant and the 150 °C tempered samples had the most uniform structure, and also showed mechanical properties very close to each other, which will be discussed further in the next section.
The prior austenite grain size (PAGS) was measured for the 300 °C tempered sample using a calculation tool recently developed by Seppälä et al. [26]. The calculation is based on the mean linear intercept method of Sellars and Higginson [27]. The calculated mean prior austenite grain size was 12.3 µm with a standard deviation of 0.6 µm. Therefore, the somewhat high austenitization temperature of 980 °C had not caused excessive grain growth as seen in both the optical image (Figure 5a) and in the grain size distribution calculations (Figure 5b). Only a few large grains were detected (24–30 µm) and no abnormal grain growth was present. For comparison, some examples of PAGS for austenitization temperatures below 1000 °C of similar grade steels have been reported by Ritchie et al. [28]. For AISI 4340, austenitization at 870 °C for 1 h resulted in a grain size ranging from 24 to 32 µm. Austenite grain growth for the 300M ultrahigh-strength steel (a modified version of 4340 with higher silicon content) has also been studied in the temperature range of 850 to 1150 °C with different holding times. Zhang et al. [29] discovered that the grain growth rate increased rapidly when soaking 300M above 900 °C. Heat treatment at 950 °C resulted in an average grain size of 31 µm, while a heating temperature of 1000 °C increased the grain size to 46 µm. Chen et al. [30] have found in their work that the average grain size for 300M was greater than 50 µm in when austenized at 900 °C or above for 40 min. Horn et al. [31] measured PAGS of 20 µm for 4340 and 300M steels with an 870 °C austenitization temperature. Therefore, the mean prior austenite grain size (12.3 µm) can be considered to be small for austenitization temperatures of 950 to 1000 °C. This is probably attributable to the presence of the microalloying elements Ti and Nb, which have inhibited the grain growth through the formation of small finely dispersed carbides or carbonitrides [32]. Also, the relatively large amount of molybdenum (0.7 wt.%) can hinder the austenite grain growth by producing strong solute drag effect by segregating at the austenite grain boundaries and thus pinning the grain boundary movement [33].

3.3. Mechanical Properties

3.3.1. General Observations

The mechanical properties are presented in Figure 6. The hot-rolled variant showed poor performance when compared to the quenched and tempered variants. The strength and hardness were inferior to the other tested samples that had a martensitic microstructure. Yield strength remained under 500 MPa at 471 ± 24 MPa while the tensile strength was 711 ± 23 MPa for the hot-rolled state (Figure 6a). The measured hardness was 195 ± 4 HV10 (Figure 6b). Also, the ferritic-pearlitic steel had very poor impact toughness as the tested Charpy-V samples showed only a few joules of impact energy. Only the uniform elongation exceeded that of the martensitic variants. Nevertheless, the steel has not been designed to be used in the hot-rolled condition, but the HR variant was included for comparison to understand the effect of both quenching and tempering on the mechanical properties of the steel.
The water quenched version without any tempering exhibited the highest tensile strength exceeding 2200 MPa (Figure 6c). However, the highest hardness (668 ± 15 HV10) was measured for the variant tempered at 150 °C. The highest yield strength (1616 ± 13 MPa) was measured for the sample tempered at 200 °C, which surpassed the WQ (1528 ± 13 MPa) and 150 °C (1606 ± 22 MPa) samples. Both yield and tensile strength decreased rapidly with tempering temperatures of 300 °C and 400 °C, and hardness decreased as well. Uniform elongation also followed the same decreasing trend with the tensile strength and hardness. Impact toughness was improved with the low-temperature tempering up to 200 °C but tempering at 300 °C or 400 °C did not produce any further improvement in the low-temperature Charpy-V energies (Figure 6d). Impact energies were measured in joules and converted directly proportional to J/cm2.

3.3.2. Strength and Hardness

The general strength decrease during tempering can be attributed to the diffusion of carbon atoms, decomposition of retained austenite, and dislocation recovery effects [24] in the tempering temperatures used in the current study. As stated earlier, the precipitation of cementite was observed in the FESEM images, and the microstructures of the 300 °C and 400 °C samples differed greatly from the quenched and low-temperature tempered samples. Now, the effect on the mechanical properties can be distinguished in Figure 6. Ultimate tensile strength (UTS) began to decrease already with the 150 °C tempering temperature. The measured difference was very small (WQ: 2233 ± 9 MPa vs. 150 °C: 2168 ± 28 MPa) and almost within the limits of measuring error. The decrease of UTS was more prominent for the 200 °C tempered variant. The temperature increase of 50 °C from the 150 to 200 °C tempering temperature had a significant effect on the tensile strength, when comparing to the clearly less dramatic difference in tensile strength between the WQ and 150 °C samples. Further, the tempering at 300 °C and 400 °C caused the ultimate tensile strength to decrease even more.
The hardness for the water quenched steel was on the expected level reaching 653 ± 16 HV10. The low tempering at 150 °C also resulted in very high hardness exceeding the water quenched sample. However, the values were very close to each other, almost within the limits of error, similar to the tensile strength values. Hardness is generally considered to be related to the tensile strength, and therefore it can be stated that both the tensile strength and hardness were both almost on par with the WQ and 150 °C samples. Nevertheless, the lowest tempering temperature did not significantly reduce the strength nor the hardness. Tempering at 200 °C produced a slightly more distinct decrease of hardness as it also did for the tensile strength. Yet, the hardness was above 600 HV10 for the 200 °C tempered sample. Higher tempering temperatures caused a more severe drop of hardness to levels below 500 HV10. The ratio of tensile strength to hardness varied within 3.2 to 3.4 (Rm/HV10) and 2.3 to 3.2 for yield strength and hardness (Rp0.2/HV10). The latter showed an increase with increasing tempering temperature, following the increasing yield-to-tensile strength ratio.
Yield strength of the tested steels did not directly follow the same behavior as the tensile strength. Low-temperature tempering increased the yield strength to 1606 ± 2 MPa (150 °C) and to 1616 ± 13 MPa (200 °C), as the water quenched variant had yield strength of 1528 ± 13 MPa. The yield-to-tensile strength ratio increased steadily from 0.66 to 0.68 (HR and WQ) to 0.92 for the 400 °C tempered variant. Uniform elongation decreased linearly for the quenched and tempered samples. A plateau for the elongation was reached at 400 °C as the martensite strength decrease was already substantial. Hutchinson et al. [5,6] have discussed the yielding phenomena in martensitic steels, noting that uniform elongation may increase with increasing strength level, i.e., tempered samples have decreased uniform elongation as was also seen in the current study. They argued that the relaxation of internal stresses was the main cause for earlier instability that subsequently led to the decrease of uniform elongation.
Also, Hutchinson et al. [5,6] studied the increase of yield strength caused by low-temperature tempering, which could be also explained by the relaxation of internal stresses. The quenched martensite has very high internal stresses, which are decreased by the tempering. This does not affect the flow stress as drastically, hence the ultimate tensile strength does not necessarily decrease. Their model predicted a large increase of yield strength for tempered steel when internal stresses were removed [6]. There was a very smooth curvature to the stress–strain relation of the quenched and low-temperature tempered samples, but a sharp yield point appeared at higher tempering temperatures, as can be seen in Figure 7. Due to the different shapes and nature of the stress–strain curves, attention has to be paid to the shape of the curve and not just the numerical value of the 0.2% proof stress.

3.3.3. Impact Toughness

For the studied steels, the tempering up to 200 °C improved the impact toughness, but eventually the higher temperatures in the temper martensite embrittlement (TME) range (300 °C and 400 °C) resulted in even or slightly decreasing Charpy-V impact energies when tested at −40 °C (Figure 6d). Interestingly, the hot-rolled sample also fitted this curve quite well, though other mechanical properties did not seem to have any direct linear relationship with the quenched and tempered variants. Only the yield-to-tensile strength ratio was very close for the HR and WQ steels. The room temperature testing (+20 °C) showed that the 400 °C tempered sample had better impact toughness over the 300 °C sample. The main reason for the higher room temperature impact toughness energy was presumably a shift of the transition temperature region towards lower temperatures. Nevertheless, impact energies are all relatively low when tested at subzero or room temperatures. The improved Charpy-V result for the 400 °C might have been due to the tempering temperature surpassing the temper embrittlement temperature range.
Temper embrittlement in martensitic steels is an extensively studied phenomenon [12,13,14,31,34], and a reduction of impact toughness is often found in steels tempered at these temperatures. It is related to the formation of cementite in the temperature range of approximately 300 °C to 400 °C, depending on the alloying content. Interlath retained austenite decomposes and creates brittle cementite films, which form pathways for cracks to propagate. Concurrently, impurities may also segregate to the grain boundaries inflicting brittle behavior by providing weak interfaces for crack propagation. The severity of the tempered martensite embrittlement is affected by chemical composition. For example, silicon shifts cementite formation to higher temperatures [31]. In the current tests, it was found that samples tempered in the TME region showed a slight decrease of Charpy-V impact energies in the subzero temperature testing (−40 °C) when compared to the low-temperature tempered samples. The microstructure of these steels (300 °C and 400 °C) already revealed the formation of cementite (Figure 3e,f), which causes the temper embrittlement. In addition, the XRD results showed that retained austenite was present in the quenched and low-temperature tempered samples but was diminished with the higher tempering temperatures.
Fracture surfaces of the Charpy-V-notch impact toughness testing specimens are presented in Figure 8 and Figure 9. Fracture occurred completely in the brittle mode in HR samples without any significant formation of shear lips. In the samples tempered at 200 °C or higher, the formation of shear lips is pronounced, which partially explains higher energy absorption of these samples. The shear lips cover already about 30–40% of the fracture surface area with the samples tempered at 400 °C. Similar behavior was observed in the fracture toughness specimens in the study of Li et al. [35], where AISI 4340 steel was tempered at various temperatures. In their study, shear lips on the edges of the samples increased with the increasing tempering temperature, which also occurred in the present study.
FESEM images taken from near the notch tip (a–b) and the middle of the fracture surface area (d–f) of chosen samples are presented in Figure 9. Surprisingly, even the fracture surface of the WQ sample consisted of a significant amount of small and scattered dimples with most of the surface area consisting of separate cleavage facets and locally sheared features between the narrow multi-void-coalesced strips (Figure 9a). As the tempering temperature increases, the fraction of the dimpled area increases steadily from WQ to the samples tempered at 400 °C. The respective impact energies for the given samples in Figure 9 were 18 ± 5 J/cm2 (WQ), 31 ± 2 J/cm2 (200 °C), and 43 ± 2 J/cm2 (400 °C), i.e., the absorbed energy almost doubled from the WQ sample to 400 °C tempered sample. This is credited to the increased dimple fraction, and the increase of shear lips, of which the latter consumes about half the energy of ductile fracture [36]. These observations are also in line with the ones made by Li et al. [35] in case of fracture toughness specimens of tempered AISI 4340. Though the absolute values for the impact toughness energies were low throughout all the samples tested due to the nature of the given steel, the evolution of the fracture surfaces and moreover the increasing impact energy could be clearly seen in the fracture surface images.

3.4. XRD Results

Table 2 presents the microstrains, crystallite sizes, dislocation densities, and retained austenite contents of tested materials based on the XRD measurements. Tempering increased the crystallite size and reduced the amount of internal strains, which can be assumed to be attributed from the reduced amount of dislocations after tempering. Calculated dislocation densities correlated well with the condition of the steels giving the highest value of 8.31 × 10¹⁵ m−2 in the case of the untempered, martensitic water quenched steel, and decreasing with higher tempering temperature as seen also from Figure 10. The strengthening effect of dislocation density on martensitic steel can be calculated using Equation (4) presented by Bhadeshia et al. [37].
σ disl. = K D ρ 1 / 2
where KD is 0.38 μb for bcc metals, μ is the shear modulus (used here 82 GPa for Fe), and b is the Burgers vector, which is 0.2485 nm in the present case. Based on the calculations using Equation (1), the strengthening effect of measured dislocation densities starting from WQ steel moving towards the higher tempering temperatures were 668 MPa (WQ), 620 MPa (150 °C), 522 MPa (200 °C), 444 MPa (300 °C), and 373 MPa (400 °C). Therefore, part of the softening, especially at tempering temperatures of 300 °C and 400 °C, can be attributed to clearly lower dislocation density.
The decrease of dislocation density with increasing tempering temperature followed the results found in the literature [22,25,38,39,40]. Saastamoinen et al. [38] reported dislocation density for both direct quenched (DQ) and reheated and quenched (RAQ) around 4.0 × 10¹⁵ m−2 for martensite containing 0.1% C, which explains some of the difference with the current results. Using the same Williamson–Hall method as used here, in the case of 0.3% C martensite, Kennett et al. [39] found dislocation densities in the as-quenched state in the range 8–10 × 1015 m−2, depending on PAGS, while Takebayashi et al. [40] found a dislocation density of 2.0 × 10¹⁶ m−2.
Furthermore, retained austenite contents were determined from the XRD data showing ~3% austenite content in the case of WQ, 150 °C and 200 °C steels. Tempering at 300 °C and 400 °C decomposed the retained austenite, as seen from retained austenite values in Table 2. The previously discussed transformation of retained austenite during tempering was therefore confirmed by the XRD measurements. This also affects the mechanical properties of the steel along with precipitation and carbon redistribution during tempering.

4. Conclusions

The recently developed ultrahigh-strength press-hardening steel was studied in this paper. The steel was tempered at different temperatures in the range of 150 °C to 400 °C, and subsequently tested for mechanical properties. Microstructural characterization along with XRD measurements and fracture surface inspection were conducted. The following findings were made:
  • A hardness greater than 650 HV/58 HRC was obtained with a tensile strength exceeding 2200 MPa. Reheating at 980 °C prior to quenching resulted in a prior austenite grain size of 12.3 µm and no quench-cracking was detected after the water quenching. Therefore, milder quenching media are not necessary to avoid quench cracking in the case of the 10 mm thick plate studied.
  • Tempering had a significant effect on both the mechanical properties and microstructure of the steel. The most notable changes in the microstructure were the amount and size of the precipitates formed during tempering. The water quenched variant showed only minor traces of auto-tempering, but transition carbides began to form when tempering at 150 °C and 200 °C. Tempering at 300 °C and 400 °C altered the microstructure from martensite to more ferritic with cementite.
  • The hardness and tensile strength reductions were not substantial for the low-temperature tempered variants (150 °C and 200 °C). Further increases in tempering temperature resulted in a decrease of hardness, strength, and uniform elongation. The yield-to-tensile strength ratio increased with increasing tempering temperatures. Low-temperature Charpy-V impact toughness energies increased with tempering until the tempered martensite embrittlement (TME) range was reached.
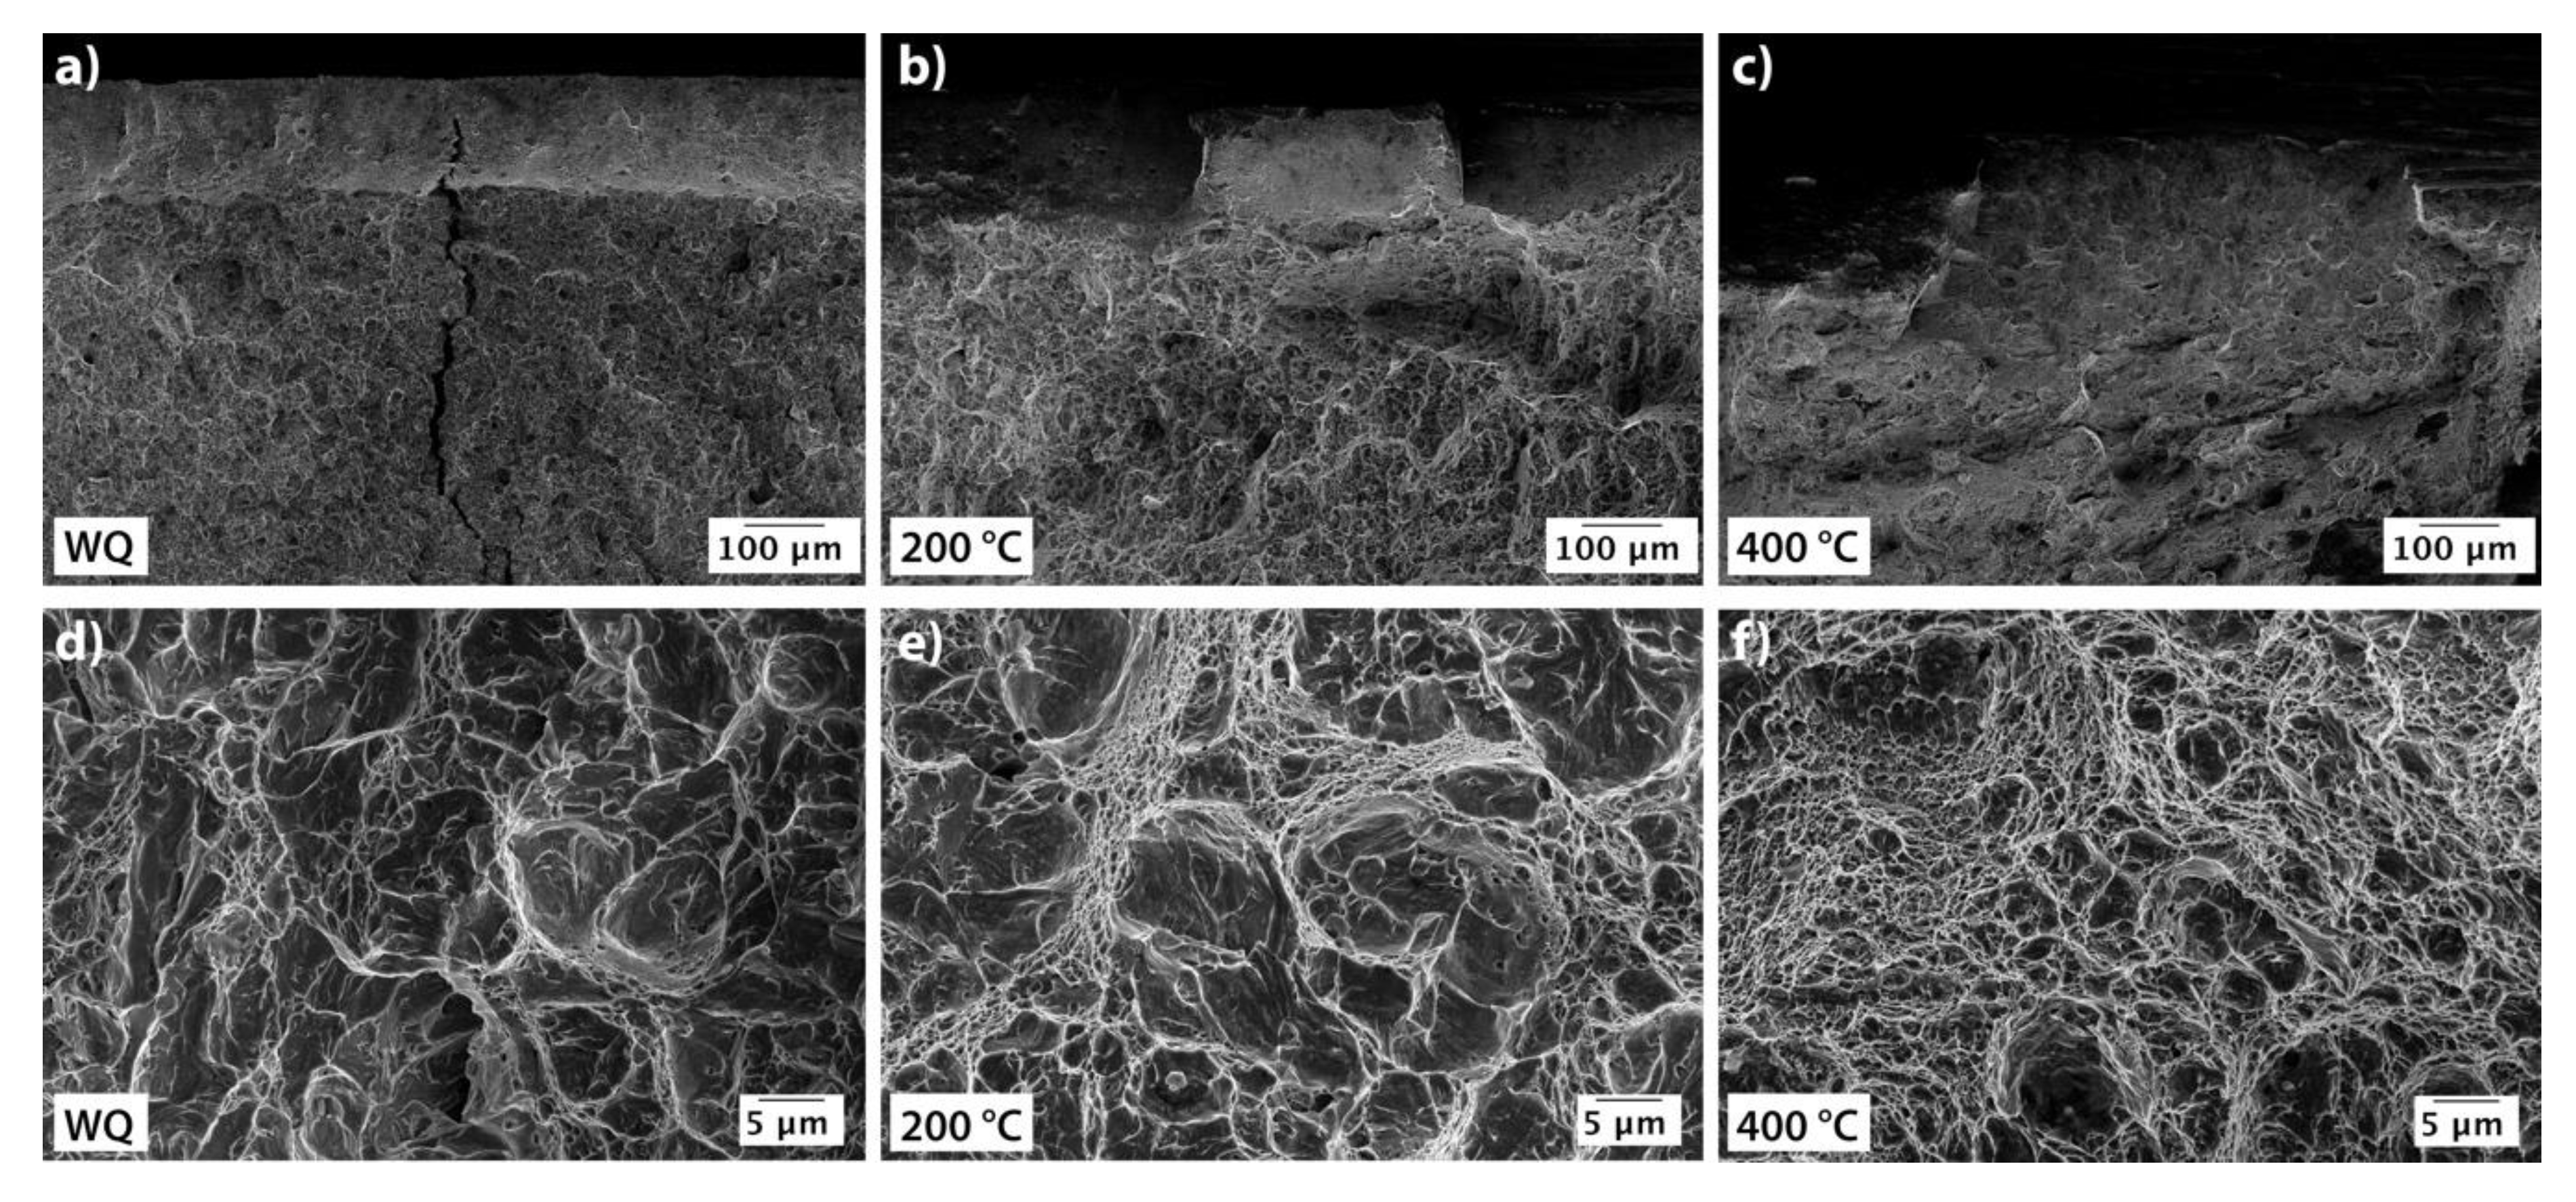
  • Fracture surface inspection showed that the shear lip formation increased with increasing tempering temperature for the impact toughness samples tested at room temperature, with the highest fraction of ductile fracture in the specimens tempered at 400 °C. However, tempering at 300 °C or above resulted in decrease in impact toughness when tested at −40 °C due to martensite temper embrittlement.
  • X-ray diffraction (XRD) analysis revealed a decrease of dislocation density with the increasing tempering temperature, as expected. The retained austenite content was approximately 3% for the quenched and low-temperature tempered steels but after tempering at 300 °C and 400 °C there were no traces of retained austenite, i.e., the decomposition of austenite had occurred.

Author Contributions

Supervision, D.P., J.K.; writing–original draft, O.H.; writing–review and editing, D.P., A.K., J.K., T.L.; XRD analyses, J.H.; fracture surface analysis, S.P.

Funding

This research has been done within the program Steel Ecosystem for Focused Applications (StEFA). We gratefully acknowledge financial support from Business Finland and the companies participating in the program.

Acknowledgments

The corresponding author would like to express his gratitude for the support provided by the University of Oulu Graduate School through the Advanced Materials Doctoral Program (ADMA-DP).

Conflicts of Interest

The authors declare no conflict of interest.

References

  1. Krauss, G. Martensite in steel: Strength and structure. Mater. Sci. Eng. A 1999, 273–275, 40–57. [Google Scholar] [CrossRef]
  2. Morito, S.; Yoshida, H.; Maki, T.; Huang, X. Effect of block size on the strength of lath martensite in low carbon steels. Mater. Sci. Eng. A 2006, 438–440, 237–240. [Google Scholar] [CrossRef]
  3. Morito, S.; Adachi, Y.; Ohba, T. Morphology and Crystallography of Sub-Blocks in Ultra-Low Carbon Lath Martensite Steel. Mater. Trans. 2009, 50, 1919–1923. [Google Scholar] [CrossRef] [Green Version]
  4. Hutchinson, B.; Hagström, J.; Karlsson, O.; Lindell, D.; Tornberg, M.; Lindberg, F.; Thuvander, M. Microstructures and hardness of as-quenched martensites (0.1–0.5%C). Acta Mater. 2011, 59, 5845–5858. [Google Scholar] [CrossRef]
  5. Hutchinson, B.; Lindell, D.; Barnett, M. Yielding Behaviour of Martensite in Steel. ISIJ Int. 2015, 55, 1114–1122. [Google Scholar] [CrossRef] [Green Version]
  6. Hutchinson, B.; Bate, P.; Lindell, D.; Malik, A.; Barnett, M.; Lynch, P. Plastic yielding in lath martensites—An alternative viewpoint. Acta Mater. 2018, 152, 239–247. [Google Scholar] [CrossRef]
  7. Galindo-Nava, E.I.; Rivera-Díaz-Del-Castillo, P.E.J. Understanding the factors controlling the hardness in martensitic steels. Scr. Mater. 2016, 110, 96–100. [Google Scholar] [CrossRef]
  8. Galindo-Nava, E.I.; Rivera-Díaz-Del-Castillo, P.E.J. A model for the microstructure behaviour and strength evolution in lath martensite. Acta Mater. 2015, 98, 81–93. [Google Scholar] [CrossRef] [Green Version]
  9. Ouchi, C. Development of Steel Plates by Intensive Use of TMCP and Direct. ISIJ Int. 2001, 41, 542–553. [Google Scholar] [CrossRef]
  10. Kaijalainen, A.J.; Suikkanen, P.P.; Limnell, T.J.; Karjalainen, L.P.; Kömi, J.I.; Porter, D.A. Effect of austenite grain structure on the strength and toughness of direct-quenched martensite. J. Alloys Compd. 2013, 577, S642–S648. [Google Scholar] [CrossRef]
  11. Kaijalainen, A.J.; Suikkanen, P.; Karjalainen, L.P.; Jonas, J.J. Effect of Austenite pancaking on the microstructure, texture, and bendability of an ultrahigh-strength strip steel. Metall. Mater. Trans. A Phys. Metall. Mater. Sci. 2014, 45, 1273–1283. [Google Scholar] [CrossRef]
  12. Krauss, G. Tempering of martensite in carbon steels. In Phase Transformations in Steels: Volume 2: Diffusionless Transformations, High Strength Steels, Modelling and Advanced Analytical Techniques; Woodhead Publishing Limited: Cambridge, UK, 2012; pp. 126–150. [Google Scholar]
  13. Bhadeshia, H.K.D.H.; Honeycombe, R. The Tempering of Martensite. In Steels: Microstructure and Properties; Butterworth-Heinemann: Oxford, UK, 2006; pp. 183–208. [Google Scholar]
  14. Lee, W.S.; Su, T.T. Mechanical properties and microstructural features of AISI 4340 high-strength alloy steel under quenched and tempered conditions. J. Mater. Process. Technol. 1999, 87, 198–206. [Google Scholar] [CrossRef]
  15. Matsuda, H.; Mizuno, R.; Funakawa, Y.; Seto, K.; Matsuoka, S.; Tanaka, Y. Effects of auto-tempering behaviour of martensite on mechanical properties of ultra high strength steel sheets. J. Alloys Compd. 2013, 577, S661–S667. [Google Scholar] [CrossRef]
  16. Li, C.N.; Yuan, G.; Ji, F.Q.; Ren, D.S.; Wang, G.D. Effects of auto-tempering on microstructure and mechanical properties in hot rolled plain C-Mn dual phase steels. Mater. Sci. Eng. A 2016, 665, 98–107. [Google Scholar] [CrossRef]
  17. Williamson, G.K.; Hall, W.H. X-Ray broadening from filed aluminium and tungsten. Acta Metall. 1953, 1, 22–31. [Google Scholar] [CrossRef]
  18. Williamson, G.K.; Smallman, R.E., III. Dislocation densities in some annealed and cold-worked metals from measurements on the X-ray Debye-Scherrer spectrum. Philos. Mag. 1956, 1, 34–46. [Google Scholar] [CrossRef]
  19. Haiko, O.; Miettunen, I.; Porter, D.; Ojala, N.; Ratia, V.; Heino, V.; Kemppainen, A. Effect of Finish Rolling and Quench Stop Temperatures on Impact-Abrasive Wear Properties of 0.35% Carbon Direct-Quenched Steel. Tribol. Finnish J. Tribol. 2017, 35, 5–21. [Google Scholar]
  20. Haiko, O.; Somani, M.; Porter, D.; Kantanen, P.; Kömi, J.; Ojala, N.; Heino, V. Comparison of impact-abrasive wear characteristics and performance of direct quenched (DQ) and direct quenched and partitioned (DQ&P) steels. Wear 2018, 400–401, 21–30. [Google Scholar]
  21. Vuorinen, E.; Heino, V.; Ojala, N.; Haiko, O.; Hedayati, A. Erosive-abrasive wear behavior of carbide-free bainitic and boron steels compared in simulated field conditions. Proc. Inst. Mech. Eng. Part J J. Eng. Tribol. 2018, 232, 3–13. [Google Scholar] [CrossRef]
  22. Saha, D.C.; Biro, E.; Gerlich, A.P.; Zhou, Y. Effects of tempering mode on the structural changes of martensite. Mater. Sci. Eng. A 2016, 673, 467–475. [Google Scholar] [CrossRef]
  23. Khani Sanij, M.H.; Ghasemi Banadkouki, S.S.; Mashreghi, A.R.; Moshrefifar, M. The effect of single and double quenching and tempering heat treatments on the microstructure and mechanical properties of AISI 4140 steel. Mater. Des. 2012, 42, 339–346. [Google Scholar] [CrossRef]
  24. Ohlund, C.E.I.C.; Schlangen, E.; Erik Offerman, S. The kinetics of softening and microstructure evolution of martensite in Fe-C-Mn steel during tempering at 300 °C. Mater. Sci. Eng. A 2013, 560, 351–357. [Google Scholar] [CrossRef]
  25. Furuhara, T.; Kobayashi, K.; Maki, T. Control of Cementite Precipitation in Lath Martensite by Rapid Heating and Tempering. ISIJ Int. 2004, 44, 1937–1944. [Google Scholar] [CrossRef]
  26. Seppälä, O.; Uusikallio, S.; Larkiola, J. A tool for computer-aided calculation of grain size. In Proceedings of the Abstracts of the XXVI International Conference on Computer Methods in Materials Technology KomPlasTech 2019, Zakopane, Poland, 13–16 January 2019; pp. 128–130, ISBN 978-83-947091-4-3. [Google Scholar]
  27. Higginson, R.; Sellars, M. Worked Examples in Quantitative Metallography, 1st ed.; CRC Press: Boca Ralton, FL, USA, 2003; ISBN 9781902653808. [Google Scholar]
  28. Ritchie, R.O.; Francis, B.; Server, W.L. Evaluation of toughness in AISI 4340 alloy steel austenitized at low and high temperatures. Metall. Trans. A 1976, 7, 831–838. [Google Scholar] [CrossRef]
  29. Zhang, S.S.; Li, M.Q.; Liu, Y.G.; Luo, J.; Liu, T.Q. The growth behavior of austenite grain in the heating process of 300 M steel. Mater. Sci. Eng. A 2011, 528, 4967–4972. [Google Scholar] [CrossRef]
  30. Chen, R.C.; Hong, C.; Li, J.J.; Zheng, Z.Z.; Li, P.C. Austenite grain growth and grain size distribution in isothermal heat-treatment of 300M steel. Procedia Eng. 2017, 207, 663–668. [Google Scholar] [CrossRef]
  31. Horn, R.M.; Ritchie, R.O. Mechanisms of tempered martensite embrittlement in medium-carbon steels. Metall. Trans. A 1978, 9, 1039–1053. [Google Scholar] [CrossRef]
  32. Baker, T.N. Microalloyed steels. Ironmak. Steelmak. 2016, 43, 264–307. [Google Scholar] [CrossRef] [Green Version]
  33. Lee, S.J.; Lee, Y.K. Prediction of austenite grain growth during austenitization of low alloy steels. Mater. Des. 2008, 29, 1840–1844. [Google Scholar] [CrossRef]
  34. Krauss, G. Low toughness and embrittlement phenomena in steels. In Steels: Processing, Structure, and Performance; ASM International: Cleveland, OH, USA, 2015; pp. 439–485. ISBN 9781627080842. [Google Scholar]
  35. Li, H.F.; Wang, S.G.; Zhang, P.; Qu, R.T.; Zhang, Z.F. Crack propagation mechanisms of AISI 4340 steels with different strength and toughness. Mater. Sci. Eng. A 2018, 729, 130–140. [Google Scholar] [CrossRef]
  36. Wallin, K. Fracture Toughness of Engineering Materials—Estimation and Application; FESI Publishing: Warrington, UK, 2011; ISBN 978-0-9552994-6-9. [Google Scholar]
  37. Bhadeshia, H.K.D.H.; Young, C.H. Strength of mixtures of bainite and martensite. Mater. Sci. Technol. 1994, 10, 209–214. [Google Scholar]
  38. Saastamoinen, A.; Kaijalainen, A.; Heikkala, J.; Porter, D.; Suikkanen, P. The effect of tempering temperature on microstructure, mechanical properties and bendability of direct-quenched low-alloy strip steel. Mater. Sci. Eng. A 2018, 730, 284–294. [Google Scholar] [CrossRef]
  39. Kennett, S.C.; Krauss, G.; Findley, K.O. Prior austenite grain size and tempering effects on the dislocation density of low-C Nb-Ti microalloyed lath martensite. Scr. Mater. 2015, 107, 123–126. [Google Scholar] [CrossRef]
  40. Takebayashi, S.; Kunieda, T.; Yoshinaga, N.; Ushioda, K.; Ogata, S. Comparison of the Dislocation Density in Martensitic Steels Evaluated by Some X-ray Diffraction Methods. ISIJ Int. 2010, 50, 875–882. [Google Scholar] [CrossRef] [Green Version]
Figure 1. Continuous cooling transformation (CCT) diagram for the steel. Abbreviations: P + F is pearlite and ferrite, B is bainite and M is martensite.
Applsci 09 04231 g001
Figure 2. Optical micrographs of the hot-rolled (HR) microstructure and Gleeble samples with different cooling rates: (a) hot-rolled, (b) 3 °C/s, (c) 12 °C/s, (d) 96 °C/s.
Applsci 09 04231 g002
Figure 3. Field emission scanning electron microscope (FESEM) micrographs of the tested steels. Images taken from ¼ depth from the top surface in normal-to-rolling direction (longitudinal). Samples: (a) hot-rolled, (b) water quenched, (c) tempered at 150 °C, (d) tempered at 200 °C, (e) tempered at 300 °C, (f) tempered at 400 °C.
Applsci 09 04231 g003
Figure 4. FESEM images of (a) water quenched, (b) tempered at 200 °C for 2 h and (c) tempered at 400 °C for 2 h.
Applsci 09 04231 g004
Figure 5. (a) Picric acid etched sample (300 °C tempered) revealing the prior austenite grain boundaries (normal-to-rolling direction) and (b) the prior austenite grain size distribution.
Applsci 09 04231 g005
Figure 6. Mechanical properties of the tested steels: (a) engineering tensile test curves, (b) material hardness and plastic component of the uniform elongation (UE), (c) yield strength (0.2% offset, Rp0.2) and tensile strength (Rm), and (d) Charpy-V impact test energies at +20 and −40 °C temperatures. Standard deviations are included in (bd).
Applsci 09 04231 g006
Figure 7. Engineering stress–strain curves for the water quenched (WQ) and 400 °C tempered samples.
Applsci 09 04231 g007
Figure 8. Macroscopic fracture surfaces of the Charpy-V samples (width 7.5 mm) tested at +20 °C. Notch is in the upper part of the specimens.
Applsci 09 04231 g008
Figure 9. FESEM images of fracture surfaces taken from the upper part (a) water quenched, (b) tempered at 200 °C, (c) tempered at 400 °C and the middle part (d) water quenched, (e) tempered at 200 °C, (f) tempered at 400 °C of selected impact toughness samples tested at +20 °C.
Applsci 09 04231 g009
Figure 10. Dislocation densities of the tested steels (WQ tempering temperature set as 25 °C).
Applsci 09 04231 g010
Table 1. Chemical composition of the steel (wt.%, balance Fe).
CSiMnAlCrMoNiTiNbVN
0.430.190.250.0350.050.70.050.0130.0130.040.004
Table 2. Microstrain, crystallite size, dislocation density, and retained austenite content based on the X-Ray diffraction (XRD) measurements.
MaterialCrystallite Size
[Å]
Microstrain
[%]
Dislocation Density
[×1015 m−2]
Retained Austenite
[%]
WQ2310.5908.33.6
150 °C2770.6117.12.8
200 °C3690.5775.12.8
300 °C3380.3823.7-
400 °C3520.2812.6-

