1. Introduction
Exopolysaccharides (EPS) are biopolymers which are associated with the cell envelope or can be released into the external environment [
1]. Bacterial EPS biosynthesis seems to be related to cell protection and abiotic/biotic stress [
2,
3,
4]. They have strong potential to act as an immunoregulator, antioxidant, anti-hypertensive, anti-biofilm, cholesterol-lowering, or prebiotic agent [
5,
6,
7]. However, reported low yields of EPS limit their production on a larger scale and there is a lack of clinical studies on the effective bio functionality of these polymers [
8]. EPS have physicochemical properties that can enhance the sensorial and textural attributes of a variety of food and beverage products. Traditionally, lactic acid bacteria exopolysaccharides have an important role in fermented dairy products and more recently are being applied for the improvement of bakery products or gluten free products. Several studies reported that the use of EPS led to increased water absorption of the dough, better dough rheology and machinability, increased loaf volume, and decreased bread staling rate. The application of LAB EPS, when produced in situ, does not require labeling and therefore is seen as positive in an industry where consumers continually demand products containing less additives [
5,
7].
Obtaining bioingredients rich in microbial EPS is still a challenge. Alternatives to improve EPS production on a larger scale require more in-depth knowledge regarding EPS regulation and biosynthesis, optimizing fermentation conditions and formulating bacterial culture medium such as whey permeate [
4] to valorize residual co-products of the agri-food industry, which can represent environmental and economic advantages [
9].
Among other LAB,
Lactobacillus rhamnosus strains are able to produce EPS. In particular,
Lactobacillus rhamnosus R0011,
Lactobacillus rhamnosus ATCC 9595, and
Lactobacillus rhamnosus RW-9595M produce a range of quantities of the same exopolysaccharide [
10]. This EPS is composed of a repetitive structure: a heptasaccharide containing glucose, galactose, and rhamnose in a 2:1:4 ratio and a pyruvate group [
11]. Strain RW-9595M is the most productive of these three strains, with 543 mg/L of EPS without pH control and 1611–2775 mg/L in fermenters using whey permeate as the culture medium at controlled pH 6 [
12,
13].
In biotechnology, co-culture has been shown to be more robust to environmental fluctuations and can perform more complex activities through the combination of metabolic capacities of different strains [
14,
15]. It is also an important tool to better understand microorganism physiology, provide interspecific or interkingdom (eukaryotes – prokaryotes) communication, and to discover new substances [
16]. Mixed populations of yeast
Saccharomyces cerevisiae and LAB are found together in numerous fermented products (kefir, kimchi, sourdough, wine, and cocoa), but the understanding of their interactions is still unclear [
17,
18].
In the production of useful metabolites by LAB, the lactic acid must be removed to increase bacterial productivity and to enhance the economic feasibility of processes on an industrial scale [
19,
20]. A beneficial aspect of LAB–yeast association is the improvement of EPS production (kefiran) or bacteriocins (nisin), probably due to lactate consumption by the yeast in pH-controlled culture [
21,
22,
23]. Co-culture with
S. cerevisiae supplied alanine to
L. delbrueckii subspecies
bulgaricus, enhanced the viability of
L. rhamnosus HN001 under acidic conditions, and enhanced the tolerance of
L. paracasei H9 to simulated gastrointestinal juices as well as adhesion to intestinal mucosa cells [
24,
25,
26].
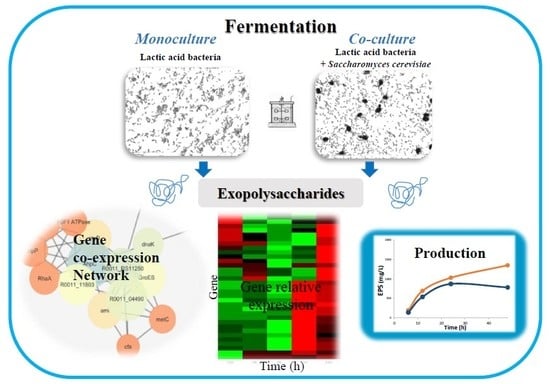
However, until now, no studies on LAB gene expression related to EPS biosynthesis in co-culture with S. cerevisiae have been reported under acidic conditions. The main objective of the present study was to determine the influence of co-culture of S. cerevisiae and three L. rhamnosus strains (ATCC 9595, R0011, and RW-9595M) on growth, viability, substrate bioconversion, and gene expression related to EPS biosynthesis during whey permeate fermentation without pH control.
2. Materials and Methods
2.1. Strains and Media
L. rhamnosus ATCC 9595 was purchased from the American Type Culture Collection (ATCC; Manassas, VA).
L. rhamnosus RW-9595M and
L. rhamnosus R0011 were obtained from our lactic acid bacteria culture collection (Université Laval, Quebec, Canada). The three strains of
Lactobacillus rhamnosus were selected for their capacity to produce the same EPS composed of L-rhamnose, D-glucose and pyruvate-substituted D-galactose in a molar ratio of 4:2:1 [
10,
11]. The stock culture was kept frozen in 6% (
v/
v) rehydrated skim milk and 10% (
v/
v) glycerol at −80 °C. The baker’s yeast
Saccharomyces cerevisiae (Lallemand Instaferm Gold Instant dry yeast) was cultured on YEPAL solid medium (1% yeast extract, 2% peptone, 1% lactic acid, and 2% Bacto agar).
Supplemented whey permeate (SWP) medium was composed of whey permeate supplemented with minerals, corn steep liquor, and yeast extract [
13]. It was prepared as follows: Whey permeate powder (Agropur, Quebec) was rehydrated to give a final concentration of 5% (
w/
w); MgSO
4·7H
2O, MnSO
4·H
2O, and Tween 80 were added to give final concentrations of 0.5 g/L, 0.05 g/L, and 1 mL/L, respectively. The pH of the solution was adjusted to 4.9 with 6 N HCl and then the solution was autoclaved (121 °C, 15 min), cooled to room temperature and filtered with a Whatman 42 filter. A concentrated corn steep liquor (CSL) was prepared by adding 25 g of CSL (Solulys 95, Roquette) to 100 mL deionized water. A concentrated yeast extract (YE) solution was prepared by adding 40 g of YE (Bacto Yeast extract) to 100 mL deionized water. These solutions were autoclaved (121 °C, 15 min) and added to whey permeate to give final concentrations of 1% and 1.5% (
w/
v), respectively in SWP medium.
2.2. Mono- and Co-Culture Fermentation Experiments
Fermentations were carried out in triplicate in 1-L bioreactors (Système quadruple automatisé; Biogénie, Québec, QC, Canada) containing SWP in monoculture fermentation experiments with the strains of
L. rhamnosus and co-culture fermentation experiments with both lactic acid bacteria and yeast. After autoclaving the bioreactors at 121 °C for 20 min, the sterilized CLS and YE solutions were added aseptically [
13]. Temperature and agitation of the bioreactors were controlled online and kept constant at 37 °C and 200 rpm, respectively. The stock culture cells of
L. rhamnosus were first inoculated into 10 mL of MRS and incubated at 37 °C for 8 h. Next, 50 mL of WP supplemented with yeast extract was inoculated at 2% (
v/
v) with the MRS culture and incubated at 37 °C for 12 h. A yeast colony from YEPAL agar was inoculated into 20 mL of YEPAL broth followed by incubation at 30 °C in a shaker at 180 rpm for 24 h. The bioreactors were inoculated at 1% (
v/
v) with
L. rhamnosus from the WP 12-h culture and
S. cerevisiae from the 24 h YEPAL culture. Samples of the bioreactor culture broth were taken after 0 h, 3 h, 6 h, 9 h, 12 h, 15 h, 24 h, and 48 h of fermentation.
2.3. Monitoring of Bacterial Growth
The concentrations of cells were determined in samples taken during mono- and co-culture by:
(i) Plate count determination
Viable (cultivable) Lactobacilli or yeast counts were determined by spread-plating 10-fold serial dilutions (in 0.1%, w/v, sterilized peptone water) on MRS agar (de Mann, Rogosa and Sharpe agar is selective for Lactobacillus due to lack of lactose consumption by yeast) or on YEPAL agar (selective for S. cerevisiae due to lack of consumption of lactic acid by Lactobacillus), and incubated aerobically at 37 °C and 30 °C for 48 h for lactic acid bacteria strains and the yeast, respectively. The viable (cultivable) counts were expressed as the number of colony-forming units (CFU) per mL.
(ii) qPCR (total cells) and PMA-qPCR (viable cells) analysis
To distinguish viable from dead cells of
L. rhamnosus, qPCR in combination with propidium monoazide (PMA) (PMA-qPCR) was used to determine the log of total cells (qPCR) or viable cells per mL (PMA-qPCR). As PMA is cell membrane-impermeable, it only covalently binds, after photoactivation, to double-stranded DNA of damaged cells and will inhibit DNA amplification during qPCR [
27,
28]. Samples taken were immediately diluted 1:10 with peptone water (1 g/L BactoPeptone and 0.5 g/L NaCl). For the PMA-qPCR analyses, the diluted samples were treated with 50 µM PMA (Biotium, Hayward, CA, USA) and incubated in the dark at room temperature for 5 min while gently being shaken. Next, the PMA-treated cell suspensions were placed in an LED-Active Blue system (Ingenia Bio- systems, Barcelona, Spain) for 15 min and centrifuged at 15,000×
g for 20 min at 4 °C. Samples not treated with PMA were centrifuged immediately after dilution at 15,000×
g for 20 min at 4 °C. Cell pellets were stored at −80 °C until DNA extraction.
Genomic DNA (gDNA) was extracted using the DNeasy Blood and Tissue kit (Qiagen, Mississauga, ON, Canada) with minor modifications of the manufacturer’s protocol for Gram-positive bacteria (Qiagen): 2.5 µL/mL mutanolysin (20 U/mL; Sigma-Aldrich) was added to the lysis buffer and an additional incubation with DNase-free RNase (Roche, Laval, QC, Canada) was performed at 37 °C for 60 min according to the manufacturer’s instructions. The extracted gDNA was stored at −20 °C until qPCR amplification.
Primers for qPCR targeting the
tuf gene in
L. rhamnosus (
Table S1 in the
supplemental material) were designed with Geneious Pro 5.3 (Biomatters, Auckland, New Zealand) on the basis of the complete genome sequence of
L. rhamnosus R0011 and the EPS gene cluster of the strains of
L. rhamnosus R0011, ATCC9595, and RW-9595M (National Center for Biotechnology Information [NCBI; NCBI Resource Coordinators, 2015] database accession numbers NZ_AGKC00000000 and AY659978.1; AY659976.1; AY659979.1, respectively). With the same software, the presence of hairpins, self-dimers, and pair-dimers was checked. The primers were synthesized by Integrated DNA Technologies (Coralville, IA, USA). Gene- and strain-specificity of the primers was confirmed in silico by Primer-Blast and by qPCR analysis on gDNA of both strains (the cycle threshold value [Ct] was undetermined for
S. cerevisiae (
Table S1 due to lack of amplification) [
29]. qPCR was performed using a 7500 Fast Real-Time PCR system (Applied Biosystems, Carlsbad, CA, USA) with 96-well plates. Each PCR reaction mixture of 20 µL contained 10 µL of Fast SYBR Green Master Mix (Life Technologies, Burlington, ON, Canada), 1 µL of the extracted gDNA, 1 µL of each primer at their optimal concentrations (
Table S1), and 8 µL of sterile nuclease-free water (Qiagen). The qPCR amplification program consisted of an initial denaturation step at 95 °C for 20 s, followed by 40 two-step cycles at 95 °C for 3 s and at 60 °C for 30 s. In each run negative (without gDNA) and positive controls (known gDNA) were run for the two primers sets. After each amplification run, the specificity of the primer sets of each PCR product was controlled by checking the melting curves. The Ct values were determined using the 7500 software (v2.0.6; Applied Biosystems) after taking the average of the automatic thresholds for each primer set and using this average for all qPCR runs. All qPCR amplifications were performed in triplicate [
28].
Finally, the log of the total cells/mL or viable cells/mL of the
L. rhamnosus strains during mono- and co-culture fermentations were calculated from the Ct values using the corresponding standard curve [
27,
28]. The standard curve and detection limit were determined using a pure culture of each strain of
L. rhamnosus. One mL of culture was serially diluted eight times in sterile culture medium. Next, 1 mL of each dilution was treated with PMA as described above. DNA extraction and quantification were performed as for the fermentation samples.
2.4. Monitoring of Sugar Consumption and Metabolite Production
Samples taken during fermentation were immediately centrifuged at 5000× g for 20 min at 4 °C and stored at −20 °C until analysis.
(i) Determination of sugars, organic acids and ethanol
Lactose, acetate, ethanol, and lactate concentrations were determined through HPLC with a Waters chromatograph (Waters, Milford, MA, USA), equipped with a Hitachi (Foster City California, USA) differential refractive index (RI) detector (L-7490), 600E controller, column oven (40 °C), and cooled 717 Plus autosampler. An ICSep ION-300 column (Transgenomic, Omaha, NE, USA) was used with an 8.5-mM H2SO4 solution as the mobile phase at a flow rate of 0.4 mL/min. Samples were diluted two-thirds with Milli-Q water, centrifuged at 20,000 x g for 15 min at 4 °C, and filtered (pore size of 0.45 µm; Chromspec Syringe Filter; Chromatographic Specialties, Brockville, ON, Canada) before injection (15 µL). A mixture of acetate, lactate (Sigma-Aldrich), and ethanol (JT Baker Chemical) was used as an external standard to perform quantifications. All samples were analyzed in triplicate.
(ii) Exopolysaccharide determination
EPS isolation and purification were carried out by ethanol precipitation, as described previously [
30] with a few modifications. Samples were heated for 15 min at 100 °C, then cells were eliminated by centrifugation at 12,000×
g for 45 min at 4 °C. EPS were precipitated from the supernatant with 3 volumes 95% ethanol at 4 °C for 16 h, and collected by centrifugation at 12,000×
g for 20 min. EPS pellets were dissolved in deionized water and dialyzed over a period of 2 days at 4 °C, with two water changes per day, and the dialysate was lyophilized. The crude EPS was further purified by dissolving it in 10% trichloroacetic acid, and the precipitate was washed twice in order to recover the total polymer. After dialysis for 3 days, with two changes of water per day, the solution was freeze-dried. Total sugars were measured by the phenol/sulfuric acid method [
31], with glucose as a standard, and the results are expressed in mg glucose L-1. The SWP medium without inoculation was used as control. The blank value of unfermented SWP medium was subtracted from the EPS concentrations.
(iii) Determination of phenolic compounds
The UPLC analysis of the phenolic acids was performed using a Waters Acquity Ultra-Performance TM LC system (Waters), equipped with a quaternary pump system (Waters). The Acquity high-strength silica (HSS) T3 column (150 mm 2.1 mm id, 1.8 mm particle size) from Waters was used. The stationary phase was 100% silica particles. The phenolic acids were separated with a mobile phase that consisted of 0.1% Formic acid (eluent A) and acetonitrile (eluent B), The flow-rate was 0.4 mL/min and the gradient elution was initial, 5% B; 0–4.5 min, 5%–20% B; 4.5–6.45 min, isocratic 20% B; 6.45–13.5 min, 20%–45% B; 13.5–16.5 min 45%–100% B; 16.5–19.5 min isocratic 100% B; 19.5–19.52 min 5%–100% B; 19.52–22.5 min isocratic 5% B. The analyses were carried out on a TQD mass spectrometer (Waters) equipped with a Z-spray electrospray interface. The analysis was performed in negative mode and the data was acquired through multiple reactions monitoring (MRM). The ionization source parameters were capillary voltage, 2.75 kV; source temperature, 140 °C; cone gas flow rate, 80 L/h and desolvation gas flow rate, 900 L/h; desolvation temperature, 350 °C. Nitrogen (99% purity) and argon (99% purity) were used as nebulizing and collision gases, respectively. Data acquisition was carried out with the Mass Lynx 4.1 software.
2.5. Relative Gene Expression
Relative expression of genes involved in carbohydrate metabolism, EPS operons, amino acid transport, lipid metabolism, stress and cellular responses and other functions (microbial metabolism in diverse environments) (see
Table S1–S3 in the
supplemental material) in
L. rhamnosus R0011,
L. rhamnosus ATCC 9595 and
L. rhamnosus RW-9595M during co-culture fermentation with
S. cerevisiae was studied after 6, 9, 12, 15, and 24 h of fermentation, representing exponential (mid and late) and stationary growth phases. The co-culture was compared to the control fermentation (monoculture fermentations with
L. rhamnosus R0011,
L. rhamnosus ATCC 9595, or
L. rhamnosus RW-9595M). The protocol has been established in accordance with good practice (MIQE) in gene expression experiments by RT-qPCR [
32].
(i) Primer and probe design
TaqMan gene expression assays (containing both primers and probes) were manually designed with Geneious Pro 5.3 for 40 target genes and for six reference genes based on the complete genome sequences of
L. rhamnosus R0011 and the EPS gene clusters of
L. rhamnosus R, ATCC 9595, and RW-9595M (NCBI). Putative gene functions were obtained from the NCBI database and from the pathway databases BioCyc and Genomes (KEGG) (NCBI Resource Coordinators, 2015) (December 2015,
Tables S1 to S34). With Geneious Pro 5.3 the presence of hairpins, self-dimers, and pair-dimers in the TaqMan gene expression assays was predicted. The TaqMan gene expression assays were synthesized by Life Technologies. The PCR amplification was simulated with both primers (
http://insilico.ehu.es/PCR/). To confirm gene- and strain-specificity of the TaqMan gene expression assays, qPCR amplification was simulated in silico by Primer-Blast [
29] and performed on genomic DNA of both strains (Ct results were at least 10 Ct higher for the strains of
L. rhamnosus, respectively;
Table S2) [
28].
(ii) RNA extraction
Samples (300 µL) were taken of mono- and co-culture fermentations of the three strains of
L. rhamnosus and immediately treated with RNAprotect Bacteria Reagent (Qiagen) according to the manufacturer’s instructions. The cell pellets were stored at −80 °C until RNA extraction. Total RNA was extracted using the RNeasy Mini kit (Qiagen), with minor modifications of the manufacturer’s RNA protect Bacteria Reagent protocol (Qiagen). The cell pellets were suspended in 100 µL (RNeasy Mini kit) TE buffer (30 mM Tris base, 1 mM EDTA, pH 8.0) containing 20 mg/mL lysozyme (Sigma-Aldrich), 10 µL proteinase K (20 mg/mL, Sigma-Aldrich), and 10 µL mutanolysin (20 U/mL; Sigma-Aldrich) and were incubated at 37 °C for 60 min. After the addition of 700 µL (RNeasy Mini kit) of RLT buffer, cell suspensions were transferred to sterile tubes containing 50 mg of zirconium beads (0.5 mm; Biospec Products, Bartlesville, OK, USA), shaken three times at high intensity for 60 s in a Bead Ruptor (Omni International), and centrifuged at maximum speed for 20 s to remove cell debris. DNA was removed during RNA isolation by performing an on-column RNase-free DNase I (Qiagen) treatment according to the manufacturer’s instructions. After elution of RNA with 50 µL (RNeasy Mini kit) of RNase-free water, 2 µL (RNeasy Mini kit) of Protector RNase inhibitor (40 U/µL; Roche) was added and a second RNase-free DNase I treatment (3 µL Dnase I [10 U/μL]; Roche) was performed for 30 min at 37 °C. DNase I was inactivated by adding 2 µL of EDTA (25 mM) to the reaction mixture and heating at 65 °C for 15 min. The absence of DNA in the RNA samples was verified by qPCR using the
tuf primers designed for the strains of
L. rhamnosus (
Table S1). RNA quality (RNA quality control RNA integrity number [RIN]) and quantity were determined using an Agilent 2100 Bioanalyzer (Agilent Technologies, Santa Clara, CA, USA). All extracted RNA was of good quality and RIN varied between 8.3 and 10.0 (with an average RIN of 9.5 ± 0.4).
(iii) Monitoring of gene expression
Total RNA (50 ng/µL) was reverse transcribed to cDNA in a final volume of 100 µL with the High Capacity cDNA Reverse Transcription kit with RNase Inhibitor (Applied Biosystems) according to the manufacturer’s instructions using a TProfessional Basic Gradient thermocycler at 25 °C for 10 min, 37 °C for 120 min, and 85 °C for 5 min. cDNA samples were stored at −20 °C for RT-qPCR analysis and the remaining RNA was stored at −80 °C.
A qPCR based on TaqMan fluorescence was performed using a Vii™A7 Real-Time PCR System (Applied Biosystems) with 384-well plates. Each PCR reaction mixture of 10 µL contained 5 μL TaqMan Fast Advanced Master Mix (Life Technologies), 4 µL of the 2.5X TaqMan designed Gene Expression Assay Mix (containing both primers and TaqMan probe), and 1 µL of cDNA. The qPCR amplification program consisted of an initial denaturation step at 95 °C for 20 s, followed by 40 two-step cycles at 95 °C for 1 s and at 60 °C for 20 s. In each run negative (without cDNA) and positive controls (with known gDNA) were included. The Ct values were determined using the Vii™A7 software (Applied Biosystems) after taking the average of the automatic thresholds for each primer set and using this average for all qPCR runs. All qPCR amplifications were performed in triplicate.
(iv) Relative quantification of gene expression levels
The relative (co-culture fermentations relative to monoculture fermentations) expression ratio of each target gene in relation to multiple reference genes was calculated by an efficiency-corrected relative quantification methodology by the REST 2009 software [
33] (Qiagen) (2004) for each time point (6 h, 9 h, 12 h, 15 h, and 24 h) for
L. rhamnosus R0011,
L. rhamnosus ATCC 9595, and
L. rhamnosus RW 9595M. Briefly, this method first transforms the Ct values of each target gene during co-culture fermentation into expression values using E
Ct, where E is the PCR amplification efficiency, and divides this value by the corresponding E
Ct,control value for the same target gene in the control sample (monoculture fermentation) to obtain E
ΔCt. In a next step, the relative expression ratio is determined by dividing the ratio (E
ΔCt) by a normalization factor, which is the geometric mean of the E
ΔCt values of the most stable reference genes. The E value for each TaqMan gene expression assay (target genes and reference genes) was determined by performing qPCR reactions of a 5-log dilution range of gDNA and plotting the logarithm of the gDNA concentrations as a linear function of the Ct values [
26]. From the slope of each standard curve, E was calculated as follows: The efficiencies of the TaqMan gene expression assays varied between 1.81 and 2.04 (
Table S2). The Ct cut-off value (highest allowed Ct value) was set at 32 as it was found that above this value the Ct values did not fit the standard curve. The software geNorm [
33] was used to identify which reference genes out of six candidate genes for each strain of
Lactobacillus were the most stable for each time point in this experimental set-up (
Table S3).
2.6. Statistical Analyses
The results of growth, viability, pH, and metabolite production were calculated as means of at least three replicate values. The data were analyzed by one-way ANOVA. The statistics were carried out with GraphPad Prism 6 (GraphPad software). The fermentation data was analyzed through Principal Component Analysis (PCA), using the software Statgraph Centurion VII. A Pearson correlation test (𝑟) was conducted to determine correlations between the variables.
Statistical significance of the calculated gene expression ratios (RER) was determined by REST 2009 using a Pair Wise Fixed Reallocation Randomization Test [
34] with 2000 permutations to determine whether the observed effects are the result of the co-culturing of each strain of
L. rhamnosus or by chance only, with p-values less than 0.05 considered statistically significant. Gene expression corresponding to a negative relative expression ratio is further referred to as underexpression, whereas gene expression corresponding to a positive RER is further referred to as overexpression in relation to monoculture condition.
Cytoscape (version 3.4.0) was used to sort through and visualize the correlations generated to create networks showing the gene co-expression of 34 genes for each strain [
35]. Two network topology characteristics for the network were calculated using Network Analyzer in Cytoscape: a) the Betweenness centrality (BC) of a node reflects the amount of control that this node exerts over the interactions of other nodes in the network. The more a node is included in shortest paths between any two other nodes, the higher its betweenness centrality (values near to 1) is within this network; b) Degree distribution, the node degree of a node n is the number of edges linked to n. These two parameters are frequently used to identify nodes for which the disruption could greatly affect a network response [
35,
36,
37].
3. Results
3.1. Co-culture of Lactobacillus Rhamnosus Strains and Saccharomyces Cerevisiae
(i) Effect of co-cultivation on bacterial growth
The growth curves of three
L. rhamnosus strains showed the same pattern in monoculture as in co-culture with
S. cerevisiae (
Figure 1A,D,G). Viable cell counts (CFU/mL) revealed a stationary growth phase after 9 h for
L. rhamnosus strains ATCC 9595 (
Figure 1D) and RW-9595M (
Figure 1G), and 12 h for
L. rhamnosus R0011 (
Figure 1A). The quantification in genome copy numbers of
L. rhamnosus ATCC 9595 obtained by PMA-qPCR were lower than those obtained by qPCR, indicating the presence of dead cells, especially in co-culture, with 95 % viability. Nevertheless, as for the other strains, plate counts did not decrease during fermentation (
Figure 1E,F). These results indicate that viability of targeted strains persisted in mono- and co-culture, despite the media culture acidity until 48 h (pH < 3.5).
(ii) Effect of co-culture on sugar consumption and metabolite production
Differences in sugar consumption and metabolite production were found between the monoculture and co-culture fermentations (
Figure 2A–F). In monoculture fermentation, lactose consumption by
L. rhamnosus ATCC 9595 was significantly higher (p < 0.05) in relation to co-culture. However, the amount of lactic acid detected was the same in both types of culture (
Figure 2A–C). Comparison of the conversion rates of lactose to lactic acid by
L. rhamnosus RW-9595M and R0011 in mono and co-culture showed no significant differences (p < 0.05).
L. rhamnosus R0011 produced 1.8 g/L less lactic acid than the other strains at the end of the process due to a lower lactose consumption. Throughout fermentation, pH values for co-culture with
L. rhamnosus R0011 were 5% and 2.7% higher than the pH values of RW-9595M and ATCC 9595, respectively (
Supplemental Figure S1).
After 24 h of fermentation, the presence of acetic acid was observed in media. Acetic acid concentrations in culture broth were significantly (p < 0.05) superior in monoculture (
Supplemental Figure S2) compared to co-culture for
L. rhamnosus ATCC 9595 (54%) and RW-9595M (38%).
L. rhamnosus R0011 did not show any difference between culture types for acetic acid concentration.
Additionally, the content of phenolic acids from corn steep liquor such as ferulic acid, 4-hydroxybenzoic acid, caffeic acid, and p-coumaric acid, were determined [
38]. After 48 h of fermentation, the profile of phenolic acids was modified by the
L. rhamnosus strains. Ferulic acid decreased while caffeic acid increased and protocatechuic acid appeared in culture broth (
Supplemental Table S4). The phenolic acid profile for yeast monoculture did not show any difference compared to non-fermented medium; therefore, this activity was linked to LAB (data not shown).
(iii) Effect of co-culture on exopolysaccharide (EPS) production
Exopolysaccharide production was modified between monoculture and co-culture for all tested strains (
Figure 2D–F). The
L. rhamnosus R0011 strain had a 12-hour delay to maximal EPS concentration in co-culture compared to monoculture. After 48 hours, EPS concentration was higher in co-culture (99 mg/L; 39%) for strain R0011, but along the entire process, total EPS production was similar to that obtained in monoculture. In contrast, for
L. rhamnosus ATCC 9595 and RW-9595M, EPS production in co-culture was significantly different (p < 0.05) from monoculture after the 48-hour fermentation period, with an increase of 49% (224 mg/L) and 42% (568 mg/L), respectively. Strain RW-9595M showed a production of EPS 81% (1095 mg/L) and 66% (888 mg/L) higher than strains R0011 and ATCC 9595, respectively. Co-culture appears to have a positive effect on EPS production, even under acid stress.
Principal Component Analysis (PCA) was carried out on the combined data for all three
L. rhamnosus strains in mono and co-culture. For each strain, significant correlations (p < 0.05) showed that in all cases two variables explained 70% of total variance (
Figure 3D–F). EPS production was principally associated with growth and with lactic acid production for
L. rhamnosus strains. It was determined that lactose and pH were negatively correlated with EPS production for the strains.
3.2. Analysis of Relative Gene Expression in Co-Culture
Statistical analyses indicate significant differences in the relative gene expression ratio (RER) in co-culture compared to the control (monoculture) for all three strains (
Table 1,
Table 2 and
Table 3 and
Figure 4A–C). The RER varied from −4.35 to 7.75 for R0011; −21.74 to +17.29 for ATCC 9595 and −30.3 to +11.191 for RW-9595M. In co-culture compared to monoculture,
L. rhamnosus R0011 and RW-9595M had more over-expressed genes (67% and 71%) than under-expressed genes (33% and 29%). For the ATCC 9595 strain, the proportion of over-expressed genes (42%) was lower than under-expressed genes (58%).
L. rhamnosus RW-9595M was the strain with the highest number of genes influenced by
S. cerevisiae during co-culture fermentation. In general for all the strains, the target gene expression in co-culture was under-expressed at the end of the fermentation process compared to monoculture.
(i) Group 1: Carbohydrate catabolism (G1)
Co-culture significantly influenced (p < 0.05) sugar metabolism for the three strains. A clear over-expression of genes was observed during the first 12 h of fermentation. L. rhamnosus R0011 in co-culture had 62.5% of target genes over-expressed between 6 and 12 h (bgaC, lacT, galR, lacD, ackA, and pyK). The largest change in gene expression was found for the bgaC gene (RER = 7.754, P < 0.001) after 6 h of co-culture. For L. rhamnosus ATCC 9595, the percentage of over-expressed genes was limited to 50% (galR, ackA, fbp, and pyK) between six and 12 h, while genes lacT, fbp galK, and galR were under-expressed between 15 and 24 h. Pyruvate kinase (pyk) was over-expressed (RER of 3.517, P = 0.000) during 80% of experience duration (6, 12, 15, and 24 h). In contrast, L. rhamnosus RW-9595M showed an over-expression of 75% of target genes for this group (galK, bgaC, galE, lacT, galR, lacD, fbp and ackA) at 6, 9, and 12 h of fermentation. Tagatose 1,6-diphosphate aldolase gene (lacD) was over-expressed for 80% of the samples (6, 9, 12, 15 and 24 h) in co-culture compared with monoculture. The largest change in gene expression was found for the bgaC gene (RER = 10.247, P = 0.007) after 6 h of fermentation.
(ii) Group 2: EPS operons (G2)
In all strains, exopolysaccharide biosynthesis was influenced by yeast presence. L. rhamnosus R0011 showed over-expression of genes wzm, rmlA, rmlD, wzb and welE after 6 and 12 h (RER between 1.972 and 7.056 P < 0.05). However, gene wzd was under-expressed in co-culture during 60% of the fermentation time when compared to monoculture. L. rhamnosus ATCC 9595 exhibited an over-expression of genes wzb, welE, and nrp after 6 h (RER 1.452, 1.865 and 2.416 P < 0.05, respectively) and wzd after 9 and 24 h (RER 1.803 and 1.484 P < 0.05, respectively). After 15 hours, wzr, wzb, welE, and nrp were under-expressed. The rmlD gene was under-expressed during 60% of the fermentation time. Strain RW-9595M showed more than 60% of targeted genes for the EPS operon (wzd, wzm, rmlA, wzr, wzb, welE, and nrp) were over-expressed after 6, 9, and 12 h (RER ranging between 2.951 and 11.522 P < 0.05). After 24 hours, the rmlD gene was significantly under-expressed in co-culture (RER −1.595 P = 0.001).
(iii) Group 3: Amino acid biosynthesis and lipid metabolism (G3)
In all tested strains, amino acid biosynthesis and lipid metabolism were influenced significantly by the presence of S. cerevisiae. For the R0011 strain, the over-expressed genes were: cysK, fabG, ami, R0011_RS11250, and metC (RER ranging between 1.504 and 3.485 P <0.05) after 6 and 12 h. After 15 hours, genes coding for metC, metA, R0011_RS11250 and cfa were under-expressed in co-culture (RER ranging between −1.761 and −3.984 P < 0.01). L. rhamnosus ATCC 9595 had 50% of target genes (R0011_RS4490, ami, R0011_RS11250, and cfa) over-expressed after 15 h (RER ranging between 3.671 and 5.175 P < 0.05). In contrast, after 24 h, most target genes (> 80%) were under-expressed in relation to monoculture (RER ranging between −2.075 and −21.739 P < 0.01). L. rhamnosus RW-9595M showed two trends: a strong over-expression after 9 hours for 80% of targeted genes (cysK, R0011_RS4490, ami, R0011_RS11250, metC, metA, and cfa); for two genes (R0011_RS11250 and cfa) after 6 h and finally for genes metA and cfa after 15 h (RER values ranging between 1.790 and 5.721 P < 0.05). Meanwhile, after 12 and 24 h, 75% of target genes (R0011_RS4490, ami, R0011_RS11250, metC, metA, cfa, and fabG, P < 0.005) were under-expressed.
(iv) Group 4: Stress and cellular response (G4)
For strain R0011, the overexpressed genes at 6, 12, and 15 h were
luxS, atpD, ahpC, and
clpP (RER range, 2.248 to 3.392,
P < 0.05). The gene coding for
atpA was repressed at 9 and 24 h in co-culture (
Table 1). For strain ATCC 9595, all target genes involved with stress and cellular responses were over-expressed after 12 h of co-culture compared to monoculture (RER range, +3.01 to +17.29,
P < 0.05). However, at the end of the process (15–24 h), genes
atpA, clpP, atpD, dnaK, and
groES were under-expressed in co-culture (
Table 2). RW9595-M showed that a higher percentage (75%–100%) of the targeted genes were over-expressed (
atpD, dnaK, luxS, groES, ahpC, atpA, and
clpP) after 6 and 9 h of co-culture (RER values ranging between 2.091 and 11.191
P < 0.05). In contrast, all the genes were under-expressed principally at 12 h (RER range, −2.73 to −30.3
P < 0.05) (
Table 3).
(v) Group 5: Other functions (microbial metabolism in diverse environments) (G5)
After 15 h, the
L. rhamnosus R0011 strain showed over-expression of the gene coding for carboxymuconolactone decarboxylase
pcaC (RER = 3.372,
P = 0.045,
Table 1). In contrast, the other two genes, the xylanase coding gene
R0011_11803 and the rhamnose isomerase,
rhaA, were under-expressed in co-culture after 24 h. For ATCC 9595, the genes
pcaC and
R0011_11803011 were over-expressed between 6 and 12 h, but after 15 h, all three genes were under-expressed in co-culture (
Table 2).
L. rhamnosus RW-9595M revealed an over-expression of three genes between 6 and 9 h. The gene coding for xylanase,
R0011_11083 was also over-expressed after 15 h. However, after 12 h, all these same genes were under-expressed in co-culture.
3.3. Gene Co-Expression Networks
A co-expression network is evident from significant (p < 0.05) and strong (p < 0.01) correlations between gene pairs. For each strain, the best network (
Figure 5A–C) only shows nodes (genes) with strong (r > 0.8) correlations and high significance (
P < 0.05 or
P < 0.01). For
L. rhamnosus R0011, the network is composed of the co-expression of 23 genes belonging to a number of functional groups (Fig. 6A). The genes (nodes) forming the network are interconnected by the gene coding for dipeptidyl aminopeptidase (
R0011_04490) with BC = 0.49 and degree = 6. In the central part of the network, genes linked to groups G3 and G4 are surrounded by genes belonging to G1 and G2 groups. Most are positively correlated, but
groES is negatively correlated with
galE and
ackA. Gene
cysK was expressed together with genes of the G2 group and at the same time with the gene (
R0011_04490). A complementary network indicated that the expression of rhamnose isomerase (
rhaA) and carboxymuconolactone decarboxylase (
pcaC) are strongly correlated.
For
L. rhamnosus ATCC 9595, the relationship between the target genes formed more than one significant network (
Figure 5B). A bigger network composed of 16 genes from groups G3, G4 and G5 all linked to the
wzm gene (G2), which is also connected to G1 genes such as
ackA. Gene
ahpC (BC = 0.345 and degree = 10) seems to be an important node between two sub-networks. The other smaller networks show EPS operon genes (G2) principally associated with G1-type genes. An interaction between genes coding
wzd (G2) and
cysK (G3) was also observed.
For
L. rhamnosus strain RW-9595M, two distinct networks were obtained (
Figure 5C). The first of these, formed by 14 genes from groups G1 and G2, represent the co-expression of gene
cysK (G3) with
lacD (G1) or G2-type genes such as
welE and
rmlD. Genes coding for
ackA (BC = 0.54 and degree = 5),
wzb (BC = 0.54 and degree = 4) and
rmlD (BC = 0.38 and degree = 4) connect the parts of the network and are important genes because of their centrality. The second network represents the correlation between 16 genes, all belonging to groups G3, G4 and G5. In this network, as was also observed for
L. rhamnosus strain ATCC 9595, the gene coding for
ahpC (BC = 0.297 and degree = 11) appeared as a node with high connectivity. Genes
metC and
metA are correlated with genes linked to cell membrane composition. The analysis of the networks (
Figure 5) displays the common co-expression of genes such as
wzb-lacT,
rmlA with
galR, and/or with
bgaC for the three strains of
L. rhamnosus.
4. Discussion
This study demonstrates that co-culture with the yeast S. cerevisiae was effective in enhancing the exopolysaccharide production of three strains of L. rhamnosus R0011, ATCC 9595, and RW-9595M in cultures without pH control. This is a very important aspect because the absence of pH control could allow the simplification and reduction of cost of the fermentation process coupled to a better EPS production in co-culture.
Our results clearly showed that 48 h of co-culture did not show any impact on the growth or viability of strains measured by viable cultivable counts in CFU/mL, total counts by qPCR and by PMA-qPCR. A previous study found that co-culture improved the viability of
L. rhamnosus HN001 in fermented milk after 1 week of storage at 30 °C [
39]. Further experiments are required in order to evaluate the effect of time of co-culture and storage on viability of the strains in co-culture.
Similarities between the three strains were detected during fermentation. The co-culture did not affect lactose consumption or lactic acid production for RW-9595M or R0011. On the contrary, co-culture had an effect on L. rhamnosus ATCC 9595 with relation to lactose consumption. These differences showed that the interactions between bacteria and yeast are strain-dependent.
Relative gene expression depended on the growth phase for all studied strains. In co-culture, the three strains of
L. rhamnosus show simultaneous transcription of two pathways to metabolize lactose from whey; through the tagatose-6-phosphate and the Leloir pathway. Tsai and Li (2006) [
40] reported that these two pathways depend on the activation of the
lacTEGF operon by the inducing gene
lacT. Lactose can be hydrolyzed by the activation of beta-galactosidase (
bgaC) to obtain glucose and galactose. Galactose could then be metabolized by the Leloir pathway by the activation of the
galKETRM operon. During fermentation, bacterial cells were in an acid medium (pH < 4), with the presence of lactate issuing from the catabolism of sugars to obtain energy. Linked to lactic acid production, strains showed over-expression of genes coding for pyruvate kinase (
pyK) and fructose 1,6 biphosphatase (
fbp) during co-culture.
During the stationary phase, the gene coding for acetate kinase (
ackA) was over-expressed for all three strains. The presence of acetic acid in media was detected and indicated the induction of the mixed acid metabolic pathway for
Lactobacillus strains. In co-culture, acetic acid concentration in the culture media was similar (
L. rhamnosus R0011) or inferior (
L. rhamnosus RW-9595M and ATCC 9595) to monoculture. In this sense, Shang et al. [
41] reported that
S. cerevisiae can remove acetic acid and is used to eliminate excessive amounts of it as a practical approach during alcoholic fermentation.
For the
L. rhamnosus RW-9595M strain, producing the highest amount of EPS, gene
ackA seems to be an important node for the co-expression network, as gene
wzb for the EPS operon (G2). Gene
ackA interacts with genes coding for G2 group EPS operon enzymes (
wzd, wzb, wzm and
rmlA) and one of G1 group sugar metabolism (
bgaC). For ATCC 9595, gene
ackA showed co-expression only with gene
wzm. For R0011, gene
ackA had a positive co-expression with gene
galE, however it had negative correlation with
groES. Acetate belongs to the metabolic pathway used for lactate degradation in mixed acid metabolism. The amount of acetate kinase (
ackA) increased during growth on cheese broth without pH control [
42]. There is some evidence that Lactobacilli modify the pyruvate metabolism and increase the synthesis of basic compounds (e.g., lysine, diacetyl/acetoin), energy-rich intermediates (such as ATP and NADH), exopolysaccharides, and/or glycogen at the expense of lactic acid [
43]. According to the literature,
L. rhamnosus strains can utilize pyruvate as a growth substrate during cheese ripening, in this way they are able to increase the amount of pyruvate oxidase (POX) or phosphotransacetylase for synthesizing acetate [
44]. Additional ATP generated by acetate kinase is an alternative carbon source for
Lactobacillus that permits an increment of biomass production [
45,
46].
Throughout fermentation, the phenolic acid profile of corn steep liquor used as nitrogen source in the culture medium was modified with an increase of caffeic and protocatechuic acid and a reduction of ferulic acid concentration in the medium. At the same time, the bioconversion of phenolic acids showed the over-expression of
pcaC genes involved in the conversion of protocatechuate to 3-oxoadipate. Over-expression of gene
rhaA was observed for
L. rhamnosus strains in co-culture with baker’s yeast. Network analysis of
L. rhamnosus strains revealed co-expression of
(rhaA) with carboxymuconolactone (
pcaC) and/or xylanase (
R0011_11803). Recently, studies have shown that lactic acid bacteria can use phenolic acids as external electron acceptors to gain additional metabolic energy to counteract the stressful conditions generated by phenolics [
47,
48]. On the other hand, the utilization of corn steep liquor in the culture medium leads to bioactive substances with potential health benefits for humans through bacterial metabolism of phenolic acids [
48].
The PCA indicates that EPS production was principally associated with growth and lactic acid production for
L. rhamnosus strains, as previously shown [
4,
10]. The stimulation of kefiran production and the growth of
L. kefiranofaciens JCM 6985 by yeast began in the early exponential growth phase [
20]. Previous reports indicated that the largest EPS production of
L. rhamnosus RW-9595M (about 85% of the maximum EPS concentration) occurred during the growth phase with a concentration of 2.3 g/L in immobilized conditions and under pH control [
13]. In this study, the EPS production increased in co-culture relative to monoculture for the three strains. It was demonstrated that co-culture of
L. paracasei with
S. cerevisiae resulted in over-expression of a gene coding for polyprenyl glycosylphosphotransferase linked to EPS production [
49]. The same authors suggested that EPS production could be induced by direct contact of bacteria and yeast through recognition of mannan in the yeast cell wall and that adhesion of LAB cells to yeast cells triggers EPS production in the LAB cells because the adhesion leads to more efficient consumption of lactic acid by the yeast cells.
Despite the positive effect of co-culture, the quantity of EPS produced was different for each strain. The most productive strain was
L. rhamnosus RW-9595M with 1.35 g/l in co-culture without pH control in this study, corresponding to a production five times greater than the other strains. Transcriptome analysis of the three strains indicates that after 6 h (exponential phase) of co-culture, each strain over-expressed the gene responsible for EPS polymerization: phosphatase (
wzb). However, for
L. rhamnosus RW-9595M, this gene is over-expressed and the network analysis of co-expression indicated it as an important node in target gene interactions. Network analysis also revealed a common behavior among all three strains with the co-expression of
wzb (G2) and
lacT (G1). The
wzb protein is involved in chain length determination and
LacT acts as an anti-terminator protein of the
galKETRM operon. The co-expression of genes coding for
rmlA (G2) with
galR and/or
bgaC (G1) represent a complementary aspect of network analysis. In the EPS operon,
rmlA and
wzb are co-expressed for R0011 and ATCC 9595 and
rmlD and
wzr are co-expressed for ATCC 9595 and RW-9595M. The expression of
rmlA-D genes was activated independently of EPS biosynthesis to form the cell wall polysaccharides, but co-transcription of these genes with the EPS biosynthesis gene cluster might increase the dTDP-L-rhamnose pool available for biosynthesis of EPS [
10]. The levels of EPS production and even the repeating unit sugar composition of EPS could be influenced by using a conditional
rfbBD (
rmlBD) mutant of
L. lactis [
50].
Other potential targets for acid stress exist, such as the cell wall and cytoplasmic membrane. In co-culture, an over-expression of the gene coding for enzyme cyclopropane-fatty-acyl-phospholipid synthase (
cfa) or the gene encoding the enzyme regulating non-saturated fat acids elongation (
fabG) for
L. rhamnosus RW-9595M and
L. rhamnosus ATCC 9595 was observed. Acetyltransferase (
R0011_RS11250) coding for membrane fatty acid biosynthesis was over-expressed for the three strains. Cyclopropanation increases membrane stability when facing stress conditions affecting the membrane, such as acid stress [
51]. The same strategy to resist stress conditions was described for
Lactobacillus plantarum at pH 3 [
52].
From Group 3, the overexpression of the gene coding for cysteine synthase (cysK) which participates in cysteine and methionine biosynthesis was observed for L. rhamnosus R0011 and L. rhamnosus RW-9595M. This gene is coded by the metA-cysK operon and permits cysteine production from serine. These genes form the cysteine-cystathionine cycle, allowing NH3 production and stimulating lactic and acetic acid synthesis by the pyruvate pathway.
Genes linked to pH homeostasis regulation such as the proton pump F0F1-ATPase, expression of general proteins associated with stress and the chaperone proteins that repair damaged DNA were monitored during fermentation (G4). Genes coding for F0F1 ATP synthase (
atpD or
atpA), proteins responsible for maintaining the proton gradient throughout the cell membrane, were over-expressed in all three strains. In the same manner,
L. plantarum under acid stress showed increased expression of the
atpA gene, which was proposed to increase acid tolerance [
53].
The gene coding for alkyl hydroperoxyde reductase (
ahpC), a catalyzer for the reduction of organic hydroxide to protect cells, was over-expressed by the three strains. Genes
dnaK,
groES and
clpP were over-expressed in
L. rhamnosus RW-9595M and ATCC 9595. Transcriptomic and proteomic studies highlighted that
dnaK and
groESL operons were positively regulated by the catabolite control protein [
54]. Proteases linked to
clp (ATP dependent) such as sub-unit
clpP are highly active under general cell stress (heat, acid, ethanol, or p-coumaric acid). Similarly, a set of genes involved in tolerance to one or more environmental stresses was induced during the acid stress responses (class I and III stress response pathways) for
Lb. plantarum [
52]. The involvement of the heat-shock proteins with the
Clp proteins, pertinent to acid-mediated stress, is a feature across
Lactobacillus species [
43].


