Article

Time Frequency Representation Enhancement via Frequency Matching Linear Transform for Bearing Condition Monitoring under Variable Speeds

1
School of Computer Science and Technology, Soochow University, Suzhou 215006, China
2
School of Urban Rail Transportation, Soochow University, Suzhou 215131, China
*
Author to whom correspondence should be addressed.
Appl. Sci. 2019, 9(18), 3828; https://doi.org/10.3390/app9183828
Submission received: 28 June 2019 / Revised: 5 September 2019 / Accepted: 6 September 2019 / Published: 12 September 2019
(This article belongs to the Special Issue Fault Diagnosis of Rotating Machine)

Abstract

:
Instantaneous frequency (IF) of shaft rotation is pivotal for bearing fault diagnosis under variable speed operations. However, shaft IF cannot always be measured as tachometers are not allowed to be installed in every case due to design reasons and cost concerns. Extracting the shaft IF ridge from time frequency representation (TFR) of vibration signals, therefore, becomes an alternative. Linear transform (LT), such as short time Fourier transform (STFT), has been widely adopted for such a purpose. Nevertheless, the accuracy of extracted IF ridges relies on the readability of TFR. Unfortunately, readability of TFR from STFT is often impaired by the smearing effect caused by non-synchronous frequencies between bases and signal components and limited time frequency resolution capability, which in turn adversely influences the accuracy of IF ridge extraction. To accurately extract IF ridges from vibration signals, this paper focuses on the first factor, which causes the smearing problem, and proposes a method named frequency matching linear transform (FMLT) to enhance the TFR, where transforming bases with frequencies varying with the shaft IF are constructed to alleviate the smearing effects. To construct the transforming bases with frequencies synchronous with shaft IF, a fast path optimization (FPO) algorithm, which generates all possible optimization paths among amplitude peaks and thereby ensures the continuity of extracted IF ridges, is adopted for IF pre-estimation. The TFR with improved readability can be subsequently obtained via FMLT, paving the way for accurate IF ridge extraction. Then, multiple IF ridges can be iteratively extracted using the FPO algorithm. The accuracy of extracted IF ridges before and after TFR enhancement is compared, indicating that the proposed FMLT can enhance the readability of TFR and lead to more accurate IF ridge extraction for bearing condition monitoring.

1. Introduction

Bearings are one of key components in rotating machinery; thus, their fault detection and diagnosis have long been investigated to prevent severe equipment damage and unscheduled downtime [1]. When a local fault occurs on the surface of the outer race, inner race or rolling elements, the measured vibration signals present repetitive fault impulses with exponential decay [2]. These fault-induced impulses are the main features to be detected to perform bearing fault diagnosis for both constant and variable speed conditions. There are state of the art methods for bearing fault diagnosis [3,4,5]. For constant speed conditions, once these impulses are extracted, the frequency and its harmonics of impulse repetition can be obtained by frequency analysis, which is related to the fault existence and fault category. However, when the rotational speed is non-stationary, the speed fluctuations may cause “smearing” of the discrete frequencies in the frequency representation, indicating that these frequencies are no longer detectable [6]. As a result, approaches developed for bearing fault diagnosis under constant speed operations would be ineffective. Order tracking has proven powerful in bearing fault detection under variable speeds [7]. Nevertheless, order tracking may propagate errors to the result because the resampling is achieved via polynomial interpolations, while vibration signals are generated by cyclic phenomena, and are thus sinusoidal rather than polynomial in nature [8,9]. Moreover, order tracking might cause the carrier frequencies of the transient responses to extend to a wider scope as the natural characteristics of bearing systems rarely vary, which is not effective in bearing fault feature extraction [10]. Undoubtedly, order tracking is one of the most useful tools for bearing health condition monitoring under variable speed conditions. Nevertheless, as stated, it still has drawbacks. Ref. [11] analyzes different factors that incur errors and influence the accuracy of order tracking. More importantly, order tracking requires the shaft instantaneous frequency (IF). However, shaft IF cannot always be measured by tachometers, which may be not allowed to be mounted due to design reasons. In this case, extracting shaft IF from time frequency analysis (TFA) of vibration signals is preferred.
TFA is also an effective approach for vibration-based bearing fault diagnosis under time-varying speeds as it has strong potential to characterize both time and frequency features of vibration signals, in addition to order tracking [12]. LT is the extensively used technique for TFA of nonstationary signals. Most common LT approaches include short time Fourier transform (STFT) [13], wavelet transform (WT) [14], and chirplet transform (CT) [15] and its variants, such as polynomial chirplet transform (PCT) [16,17]. However, as revealed by Guan et. al. [18], the frequencies of bases of both STFT and WT are time-invariant, which cannot match the frequencies of target signal components. Then, the smearing problem may be incurred. The frequencies of transforming bases of CT and its variants vary with time; however, the chirp rate of bases is invariant and this kind of LT method can only eliminate the smearing effects of the signal with the same chirp rate as the pre-set one. In reality, the chirp rate of frequencies of vibration signals from the bearing is often time-varying and unknown in advance. The CT and its advanced versions, hence, cannot generate a smearing-free time frequency representation (TFR). To address the problem that the frequencies of transforming bases do not match the frequencies of signal components, Guan et al. propose a method named velocity synchronous linear chirplet transform, which can relieve the smearing of TFR and result in a desirable time frequency resolution [18]. However, the method may be ineffective for analyzing signals with strong noise from mechanical systems because the frequencies of bases are easily mis-estimated under the guidance of the kurtosis index for the signal with corruptive noise. Since the estimated frequencies of bases do not match the target signal components, TFR readability cannot be enhanced at all. Then, IF paths are neither clearly observed on TFR nor accurately extracted from such TFR. LT often acts as a pre-process of TFA, from which a string of TFR reassignment methods have been developed. WT or STFT is integrated with reassignment strategy in order to improve the readability of TFR and highlight weak features from the recorded signals. For example, Clotaire and Philippe use standard TFA methods with amplitude normalization and reassignment to observe smaller variations in earthquakes [19]. As reported in ref. [20], wavelet scalogram is combined with the reassignment method to improve the concentration of TFR and alleviate the interference terms. STFT is incorporated with generalized demodulation to post-process the STFT-resulting TFR to improve the energy concentration [9,21]. Another popular TFR reassignment method is synchrosqueezing transform (SST) [22] and its improved version, the synchroextracting method (SET) [23]. These reassignment techniques can trim TFRs and have enriched the literature of TFA for nonstationary signal processing. However, these TFA reassignment methods are devised to post-process TFRs, instead of addressing the root cause that LT cannot produce a smear-free TFR. Furthermore, IF estimation in advance is required for performing post-processing. Accurate IF estimation from vibration signals from mechanical systems is always challenging.
With the literature reviewed above, the motivations of this paper are as follows: (1) IF estimation is vital for bearing fault diagnosis under time-varying speeds without a tachometer being involved; (2) accuracy of extracted IF depends on the readability of TFR which often suffers from the smearing problem due to base frequencies not matching the frequencies of signal components; (3) TFA is a promising tool for bearing fault diagnosis under variable speeds in addition to order tracking. Motivated by this, this paper aims at solving the smearing problems of TFR and exploiting the TFA-based fault diagnosis method for bearing condition monitoring under time-varying operations, from which multiple IF ridges are attempted to be extracted for the purpose of fault diagnosis.
To achieve the purpose mentioned above, this paper proposes the frequency matching linear transform (FMLT) with the guidance of fast path optimization (FPO) for TFR enhancement and then IF path extraction for bearing fault diagnosis under time-varying speed operations. The FPO algorithm, which is effective in IF estimation [24,25], is used for IF extraction to tackle the problem of improper IF estimation. It is worth mentioning that the most straightforward IF extraction method is to select a start point and locate the ridges forwards or backwards point-by-point with the guidance of optimization functions. The disadvantage of this method is that its accuracy largely depends on the start point. An improperly selected start point may result in a completely incorrect IF ridge [24]. Therefore, the FPO algorithm is adopted. With the extracted IF (pre-IF), the transforming bases for FMLT can be subsequently constructed and the TFR free from smearing can be obtained. Then, more accurate multiple IF ridges can be extracted using FPO again from the improved TFR for bearing health condition monitoring under variable speeds.
The paper is organized as follows. Section 2 presents the proposed FPO-guided FMLT method, including the FPO approach for the pre-IF estimation and details of FMLT for TFR readability enhancement. Section 3 gives the experimental examination. The paper is summarized in Section 4.

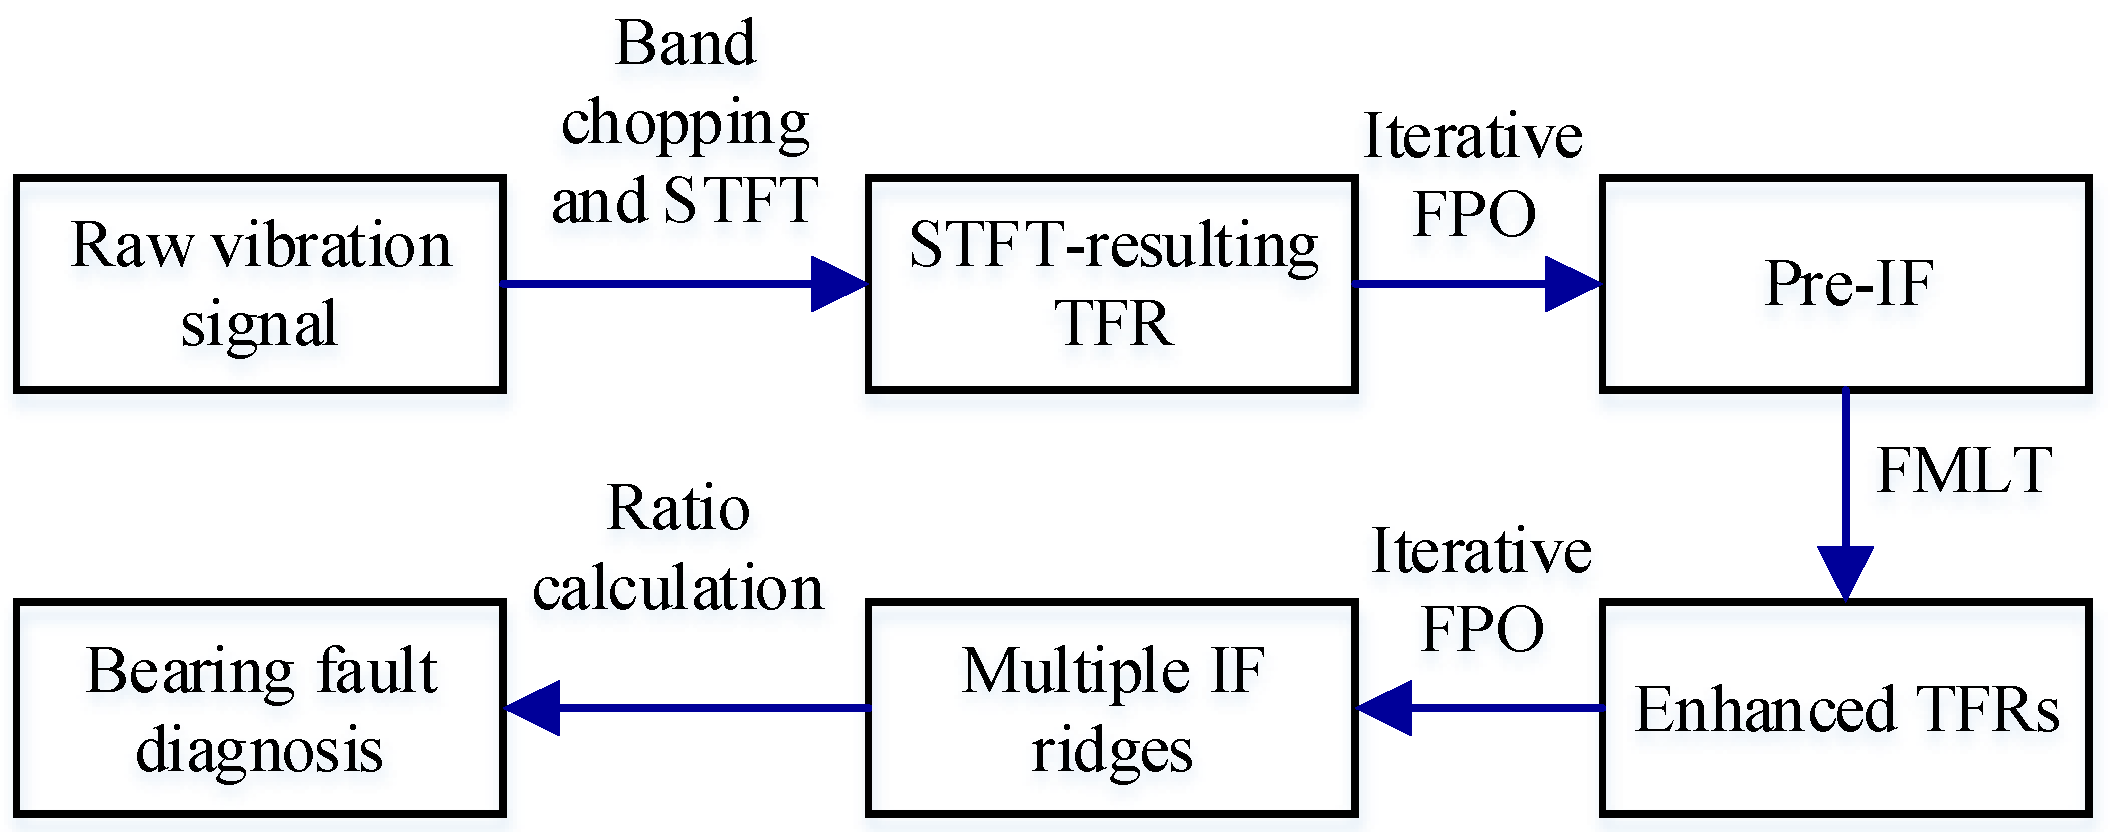
2. Presentation of Proposed FPO-Guided FMLT Method

In this section, the introduction of the FPO is firstly elaborated and a pre-IF can then be extracted. Subsequently, the proposed FMLT method is detailed. TFRs with improved readability can then be led so that more accurate IF paths can be extracted from the improved TFRs to realize the bearing fault diagnosis.

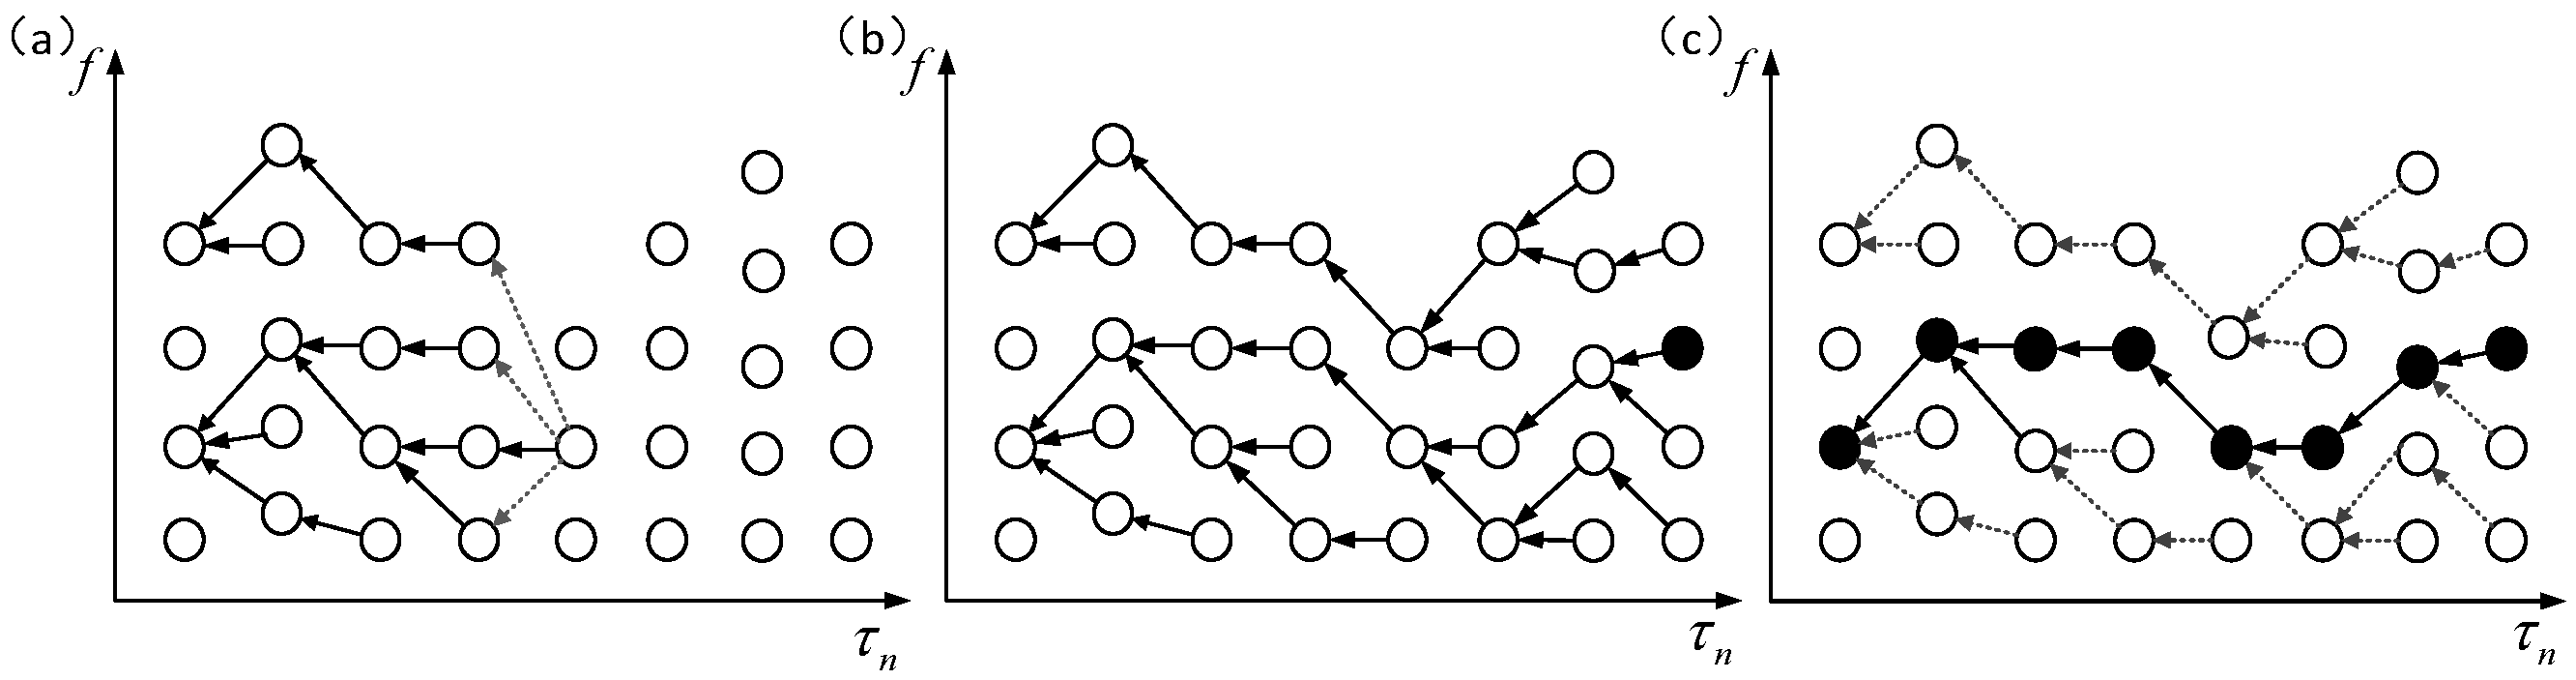
2.1. Pre-IF Estimation via FPO Algorithm

As stated previously, the construction of bases of the proposed FMLT requires the information of shaft IF information to make sure that the frequencies of bases match those of the signal components. The FPO algorithm is used for the shaft IF extraction from the original TFR generated by LT (i.e., STFT in this paper).
For a signal x(t), the LT can be formulated as:
X ( τ , f ) = + x w i n ( τ ) ( t ) P * ( τ , f ) ( t ) d t
where x w i n ( τ ) ( t ) stands for windowed signal, P ( τ , f ) ( t ) represents the set of the transforming base function and the asterisk denotes the complex conjugate. S P ( τ , f ) = | X ( τ , f ) | 2 is the spectrum of the signal. Transforming bases P ( τ , f ) ( t ) can be expressed as:
P ( τ , f ) ( t ) = e j θ ( t ) = e j 2 π + f b ( τ , f ) ( t ) d t
where f b ( τ , f ) ( t ) denotes the frequencies of bases. For STFT, base frequencies f b ( τ , f ) ( t ) equal a time-invariant frequency f. Equation (1) then is reduced to:
X ( τ , f ) = + x w i n ( τ ) ( t ) e j 2 π + f d t d t = + x w i n ( τ ) ( t ) e j 2 π f t d t
Based on the TFR from STFT, local maximum values of amplitudes (i.e., local peaks) at time point τn on the TFR can be searched and the frequencies corresponding to the local peaks at the time point τn can then be obtained, which can be formulated as:
f m ( τ n ) = f , s . t . , { d [ X ( τ n , f ) ] / d f = 0 d 2 [ X ( τ n , f ) ] / d f 2 < 0 ( m = 1 , 2 , , N p ) ,
where τn (n = 1,2,…,N) is time bins throughout the whole TFR, N p ( τ n ) is the number of local peaks at τn, f m ( τ n ) represents the frequency of the mth local peak at τn, and N stands for the number of time bins (i.e., the number of windows used for STFT).
All the local peaks of amplitudes in the whole TFR are denoted by circles in the peak map, as shown in Figure 1a. In order to extract an accurate IF ridge, the FPO algorithm is proposed to determine which peak should be identified at every time bin. Frequencies corresponding to extracted peaks constitute the estimated IF. The FPO algorithm can be expressed as [25]:
{ m c ( τ 1 ) , , m c ( τ N ) } = arg max { m 1 , , m N } n = 1 N F [ τ n , S P m n ( τ n ) , f m n ( τ n ) , { f m 1 ( τ n ) , , f m n ( τ n ) } ]
where m c ( τ n ) denotes the extracted peak at τn, F [   ] represents a support function for optimization, and S P m ( τ n ) denotes the amplitude of the mth local peak. The IF ridge can then be connected as f p ( τ n ) = f m c ( τ n ) ( τ n ) . The support function can be formulated as [24,25]:
F [   ] = { log S P m ( τ n ) + ω 2 ( f m ( τ n ) , m [ f d ] , I Q R [ f d ] , 1 )     + ω 1 ( f m ( τ n ) f d ( τ n 1 ) , m [ Δ f d ] , I Q R [ Δ f d ] , 1 )   , n 3 log S P m ( τ n ) + ω 2 ( f m ( τ n ) , m [ f d ] , I Q R [ f d ] , 1 ) , n = 2 log S P m ( τ n ) , n = 1
where
ω 1 (   ) = | f m ( τ n ) f d ( τ n 1 ) m [ Δ f d ] I Q R [ Δ f d ] |
ω 2 (   ) = | f m ( τ n ) m [ f d ] I Q R [ f d ] |
m [   ] = p e r c 0.5 [   ] , I Q R [   ] = p e r c 0.75 [   ] p e r c 0.25 [   ]
and where f d ( τ n 1 ) is the candidate frequency value at τ n 1 , Δ f d is the derivative of fd, p e r c p [ f ( t ) ] is the pth quantile of f(t), fd represents the frequencies of a set of candidate ridge points in [ τ 1 , τ 2 , , τ n 1 ] , m [   ] stands for the median and I Q R [   ] represents the interquartile range, as defined in Equation (9). Solutions of the support function can be given as:
q ( m , τ n ) = arg max k { F [ S P m ( τ n ) , f m ( τ n ) , f k ( τ n 1 ) ] + U ( k , τ n 1 ) } , n > 1
U ( m , τ n ) = { F [ S P m ( τ n ) , f m ( τ n ) , f m ( τ n ) ] , n = 1 F [ S P m ( τ n ) , f m ( τ n ) , f q ( m , τ n ) ( τ n 1 ) ] + U ( q ( m , τ n ) , τ n 1 ) , n > 1
where n = 1,2,…,N, m = 1,2,…,Np(τn), k = 1 , 2 , , N p ( τ n 1 ) , and q ( m , τ n ) determines which peak at the previous time bin τn-1 should be connected to peaks at the current time bins τn (n = 2,…,N). Then, all possible paths are generated, as presented in Figure 1b. The U ( m , τ n ) is an intermediate vector which is devoted to the optimization, i.e., pick the frequency value corresponding to the peak at time τN where U ( m , τ N ) takes the maximum and the path corresponding to the picked frequency value at τN determined by q ( m , τ n ) is extracted as the IF ridge, as shown in Figure 1c.
Based on the above analysis, it can be seen that the FPO algorithm takes all local peaks in the TFR into account and generates all possible optimization paths among amplitude local peaks at the previous and current moment, which can ensure the continuity and accuracy of the extracted IF ridge to some extent. However, it should be noted that the accuracy of extracted IF ridges also relies upon the readability of TFR, in addition to the extraction algorithm. The underlying reason of TFR readability being impaired by smearing effects is that the base frequencies do not match the frequencies of the signal component, as reported in ref. [18]. Thus, the FMLT is proposed to improve the readability of TFR.

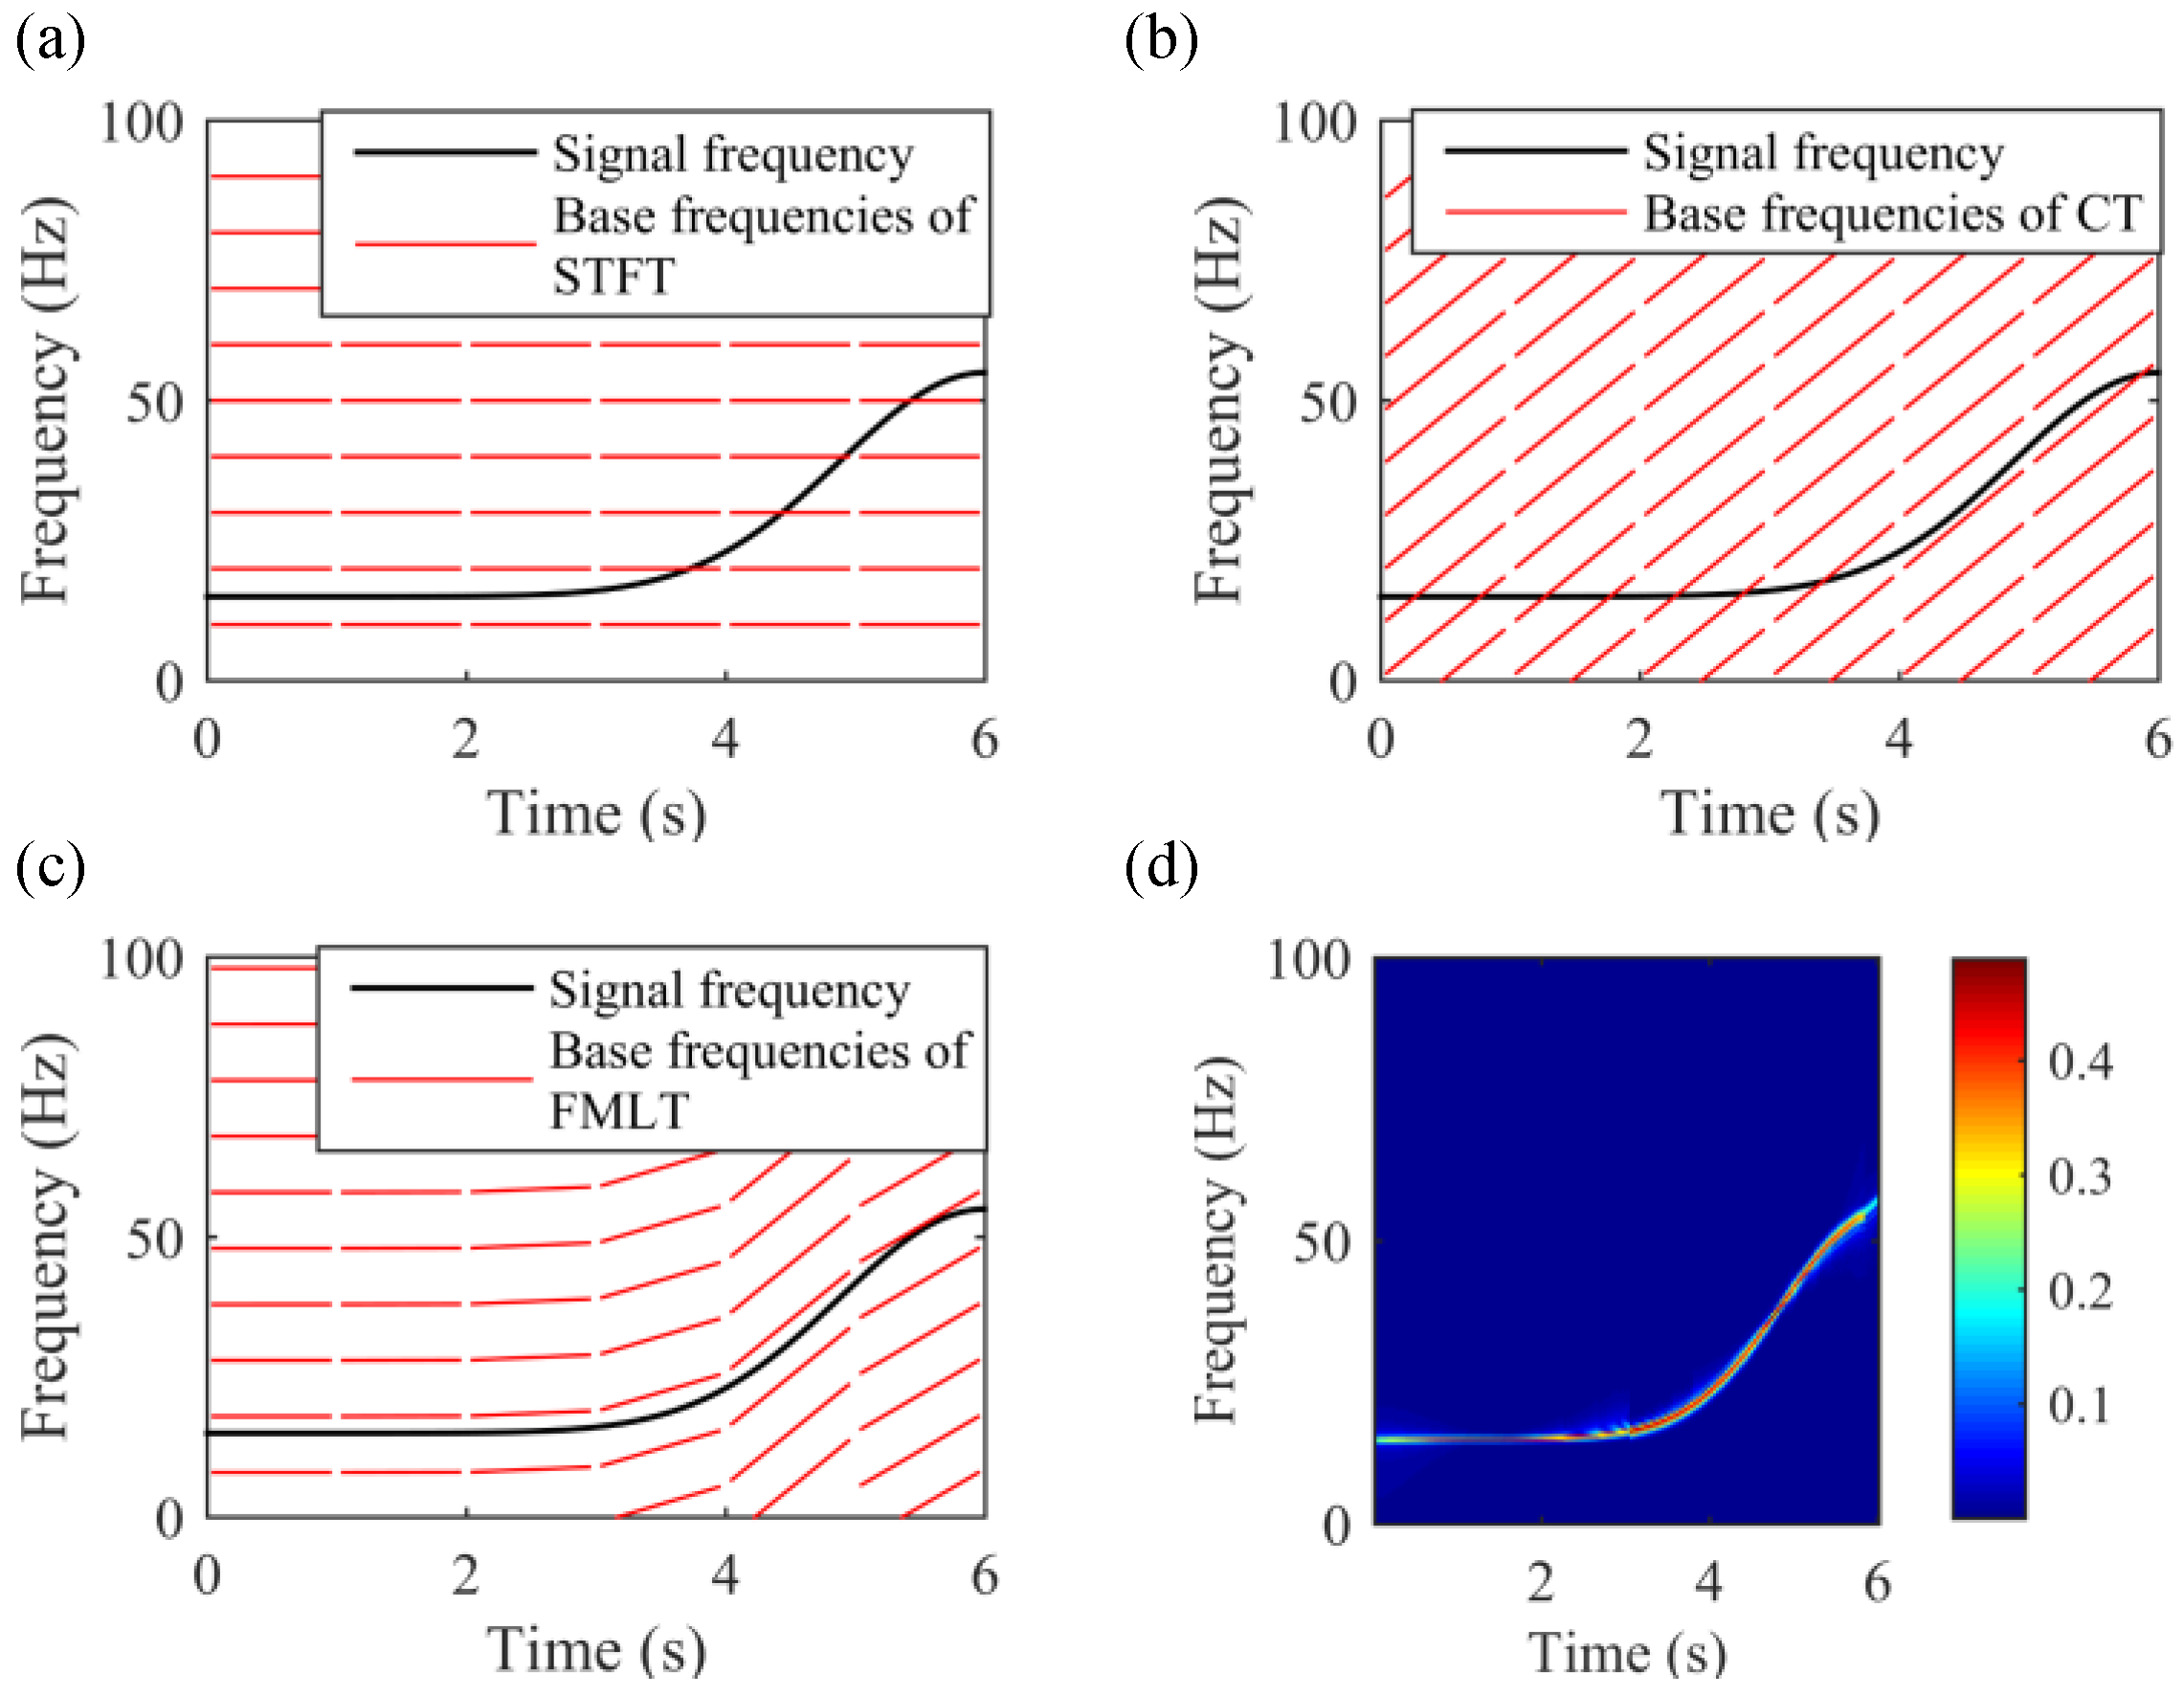
2.2. FMLT for TFR Enhancement

To illustrate the influence of matching degree between base frequencies and signal frequencies on TFR readability, a simulated signal x(t) is constructed as:
x ( t ) = sin ( 2 π 0 t f s ( τ ) d τ )
where f s ( τ ) denotes the shaft IF and is set as:
f s ( t ) = 40 e 0.4 ( t 6 ) 2 + 15
The signal is displayed in Figure 2a and the shaft IF f s ( τ ) is plotted in Figure 2b.
The conventional LT methods, STFT and CT, are applied to process the signal defined by Equations (12) and (13). Resulting TFR is presented in Figure 2c,d, respectively. It can be observed in Figure 2c that the TFR in the first 3 s, where the IF is almost time invariant, has no smear problem; however, the IF ridge in the range of 3–6 s is not concentrated and suffers from the smearing. On the contrary, TFR in 4–6 s in Figure 2d is energy-concentrated and has a sharp IF ridge; but the TFR in the first 4 s has the smear problem. The reason for this is that bases of STFT, which have time-invariant frequencies, match the frequency of the signal in the first 3 s, while bases of CT, which linearly varies with time, match the frequency of the signal in the last 2 s, as shown in Figure 3a,b.
To address the TFR smearing problem caused by frequency un-matching between bases and signals, the FMLT approach is proposed. The key step of FMLT is to construct the bases with frequency matching the signal components of interests. Since the FPO algorithm can be used for IF extraction, it facilitates the establishment of such transforming bases. The derivation of FMLT is presented in the following.
Recall the LT of the signal x(t):
X ( τ , f ) = + x w i n ( τ ) ( t ) P * ( τ , f ) ( t ) d t = + x w i n ( τ ) ( t ) e j 2 π + f b ( τ , f ) ( t ) d t d t
where the base frequencies f b ( τ , f ) ( τ ) equals f and transforming bases P ( τ , f ) ( t ) and P * ( τ , f ) ( t ) are orthogonal pairs. Since the frequencies of signal components are proportional to shaft IF denoted by fs(t), f b ( τ , f ) ( t ) can be defined as follows to realize that the base frequencies match the frequencies of signal components:
f b ( τ , f ) ( t ) = C ( τ , f ) f s ( t )
where C ( τ , f ) is the coefficient. In a small time window t [ τ Δ t ,   τ + Δ t ] , the frequency ridge can be considered as linear; therefore, the shaft IF in such a window can be approximated using Taylor series:
f s ( t ) | t [ τ Δ t ,   τ + Δ t ] = f s ( τ ) + f s ( τ ) ( t τ )
The base frequencies f b ( τ , f ) ( t ) can then be calculated as:
f b ( τ , f ) ( t ) = f ( f s ( τ ) ( t τ ) f s ( τ ) + 1 )
From Equation (17), one can observe that the base frequencies are determined by shaft IF fs(t), which can be pre-estimated by FPO algorithm from STFT-resulting TFR. With the f b ( τ , f ) ( t ) , the transforming kernel can be written as:
P ( τ , f ) ( t ) = e j 2 π + f b ( τ , f ) ( t ) d t = e j π f f s ( τ ) f s ( τ ) ( t 2 2 τ t )
However, the transforming kernel pair, i.e., P ( τ , f ) ( t ) and P * ( τ , f ) ( t ) , with modified frequencies may be not orthonormal any more. For this reason, a new transforming kernel denoted by K ( τ , f ) ( t ) is introduced. The LT can then be re-formulated as:
X ( τ , f ) = + x w i n ( τ ) ( t ) K * ( τ , f ) ( t ) d t
According to ref. [18], the base set of P ( τ , f ) ( t ) may be non-orthogonal; however, it has to satisfy the following conditions:
{ + P ( t , f ) ( t n ) K * ( t , f ) ( t m ) d f = δ ( t n t m ) + P ( t , f n ) ( t ) K * ( t , f m ) ( t ) d t = δ ( f n f m )
where δ(t) is the delta Dirac function. Solving Equation (20), one can obtain the transforming kernel K ( τ , v ) ( t ) , which is expressed as:
K ( τ , f ) ( t ) = π f s ( τ ) f s ( τ ) ( 2 t τ ) e j π f f s ( τ ) f s ( τ ) ( t 2 2 τ t )
Then, the FMLT can be obtained:
X ( τ , f ) = + x w i n ( τ ) ( t ) π f s ( τ ) f s ( τ ) ( 2 t τ ) e j π f f s ( τ ) f s ( τ ) ( t 2 2 τ t ) d t
where f s ( τ ) can be obtained by calculating the derivative of f s ( t ) , which is extracted from STFR-resulting TFR (without enhancement) using the FPO algorithm. The FMLT can then be performed and the TFR can be enhanced for a more accurate IF estimation. The constructed bases of FMLT are shown in Figure 3c. It can be observed that the frequencies of bases match the IF trajectories. The FMLT-resulting TFR of the simulated signal defined by Equation (12) is exhibited in Figure 3d, where the IF ridge is quite sharp and concentrated.
To further test the effectiveness of the proposed method in TFR enhancement, a multicomponent signal is constructed as:
x m u l t i ( t ) = sin ( 2 π 0 t f s ( τ ) d τ ) + 1.5 sin ( 2 π 0 t 1.3 f s ( τ ) d τ ) + 1.2 sin ( 2 π 0 t 1.6 f s ( τ ) d τ )
where f s ( τ ) is defined by Equation (13). White Gaussian noise is also added to the signal and the signal to noise ratio is set as −1. The noisy signal in the time domain is shown in Figure 4a,b, which plots the IF ridges of the signal components. Then, STFT, CT and FMLT methods are used to time-frequency analyze the signal, resulting in TFRs in Figure 4c–e. It can be easily observed that STFT and CT are either subjected to smearing problem in the first four seconds or in the last two seconds Neither can generate a TFR free from smearing. The FMLT-resulting TFR is exhibited in Figure 4e, from which the IF trajectories can be clearly recognized, indicating that the FMLT can concentrate the energy and improve the TFR readability via matching the frequencies between the bases and signal components.

2.3. Bearing Fault Diagnosis Based on Extracted IF Ridges

With the improved TFR, the bearing fault diagnosis cannot be finished yet because the fault type cannot be identified without knowing the relationships among IF ridges related to shaft speed and instantaneous fault characteristic frequency (IFCF). Therefore, multiple IF ridges are required to be extracted from the improved TFRs by iteratively using the FPO algorithm. To obtain multiple IF ridges associated with the IFCF as well as shaft IF, the frequency band of the signal is chopped to obtain a lower frequency band signal and a resonance frequency band signal. The lower frequency band signal can be obtained by low-pass filtering the signal. The cut-off frequency of the low-pass filter should be set to cover the shaft IF and several harmonics of the shaft IF. The resonant frequency band signal is gained by the popular spectral kurtosis (SK) method. The details of the SK method can be found in ref. [27].
A pre-IF of shaft is first extracted from the STFT-resulting TFR of the lower frequency band signal using the FPO to construct the bases of FMLT. Subsequently, the proposed FMLT can be implemented and enhanced TFRs can be obtained. The shaft IF and its harmonics can then be iteratively extracted from the enhanced TFR of the lower frequency band signal, and similarly, the IFCF and its harmonics can be extracted from the enhanced TFR of the resonant frequency band signal. The involved iteration operation means that peaks associated with the extracted IF ridge are removed from the peak map and a new peak map is formed, i.e., the FPO algorithm is iteratively used to extract the next IF ridge from the newly generated peak map. The number of IF ridges is user-specified as long as that the fault diagnosis can be fulfilled. Generally, two IF ridges respectively extracted from lower and resonant frequency band signals can be enough for the bearing fault diagnosis under time-varying speed.
With the extracted IF curves, the bearing fault type can be diagnosed in the light of the ratio of any two IF ridges respectively from the lower frequency band signal and resonant frequency band signal. The flow chart of the bearing condition monitoring under variable speed operations via the proposed FPO-guided FMLT method is presented in Figure 5.

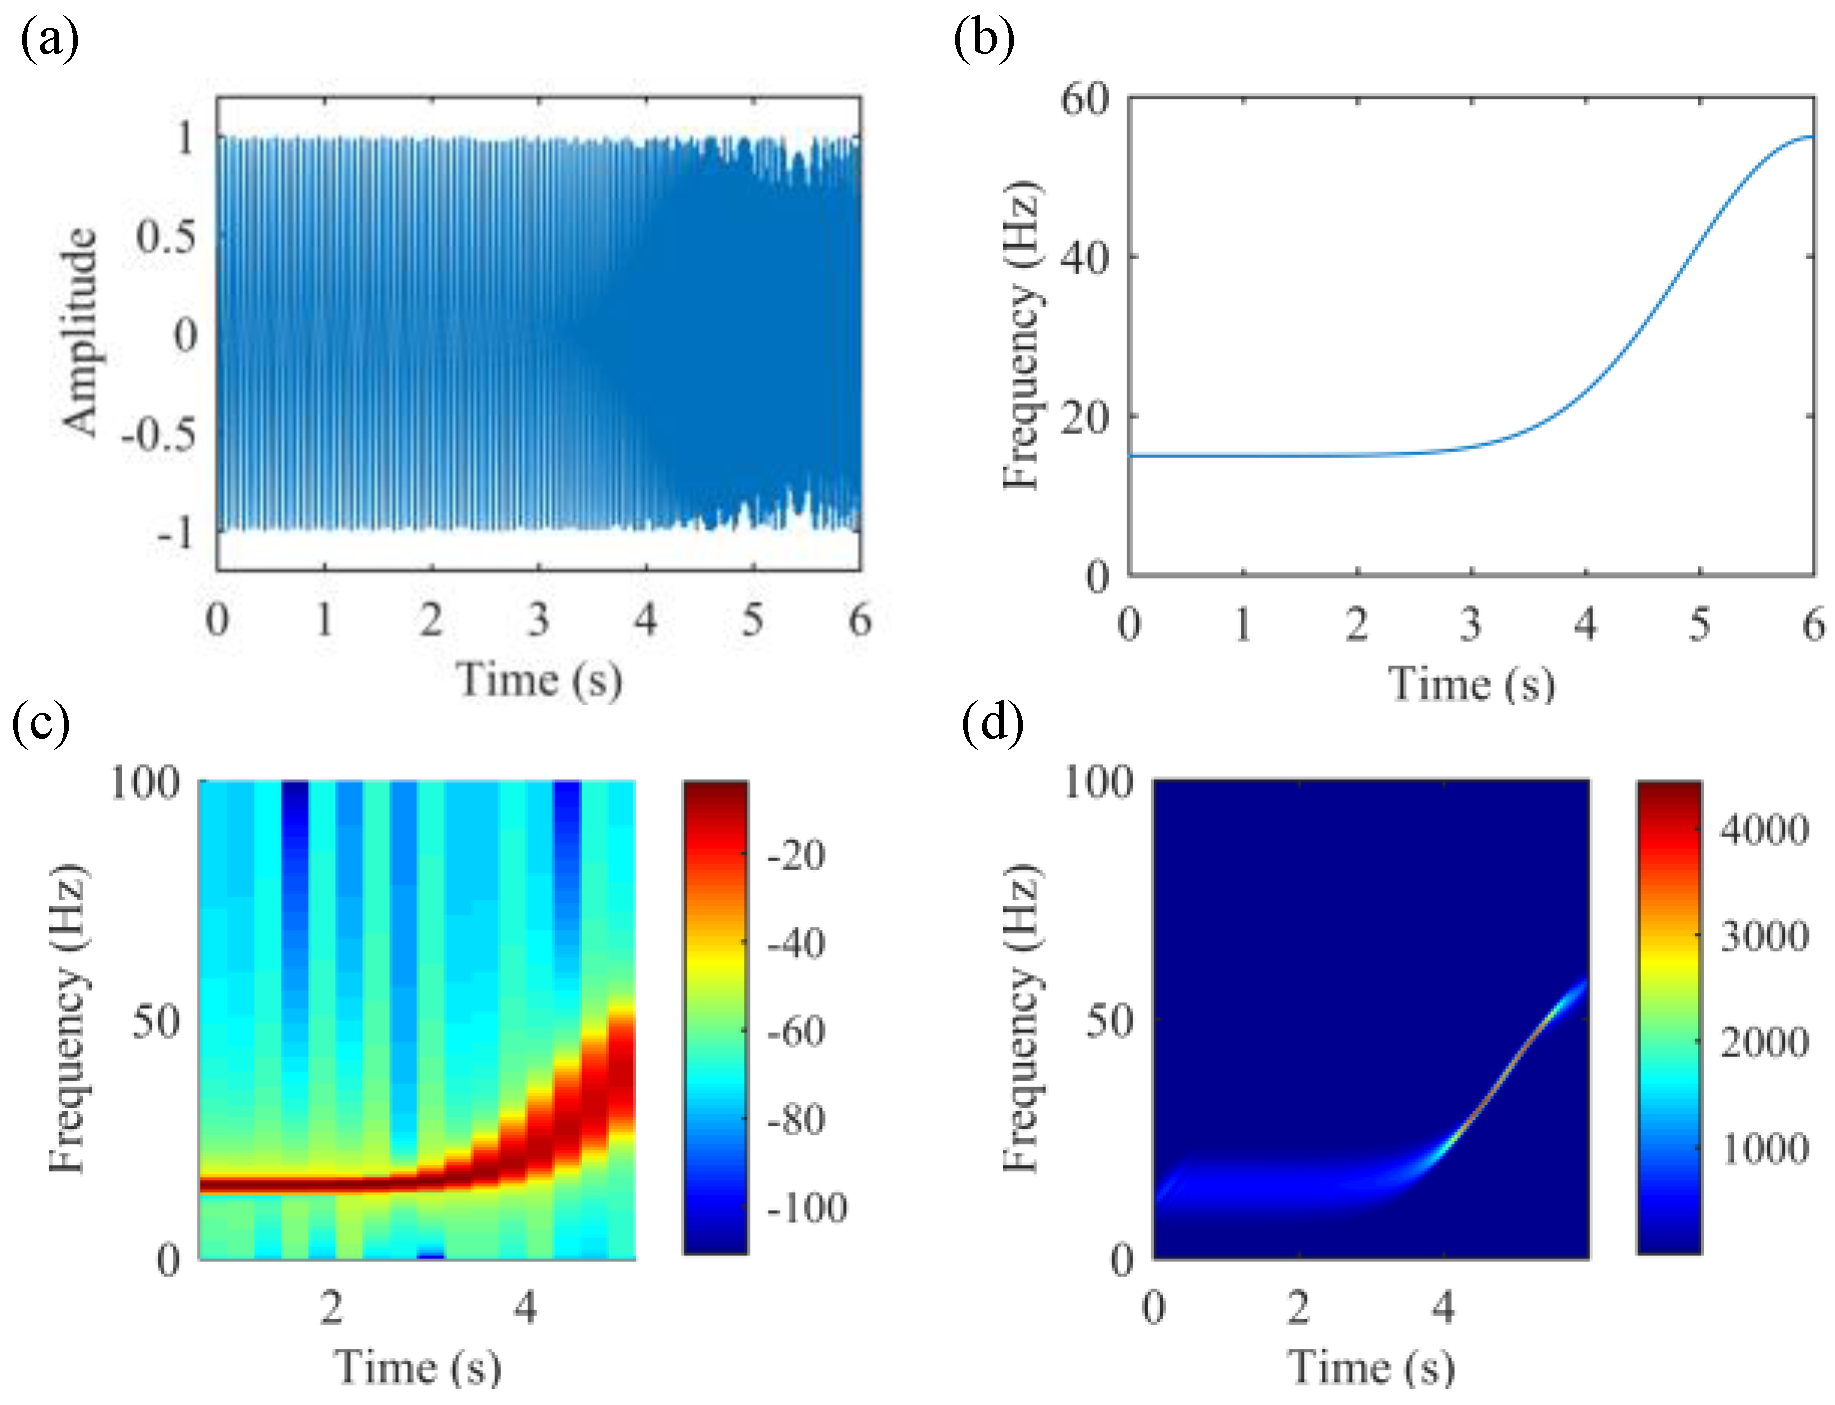
3. Experimental Verification

To validate the effectiveness of the proposed method, the experiments were performed on a MFK-PK5M SpectraQuest Machinery Fault Simulator (SpectraQuest, VA, USA), as shown in Figure 6. ER16K bearings (RBC bearings, California, USA) were used and parameters of the bearing are given in Table 1. Experimental data of the bearing outer race fault and inner race fault were collected.

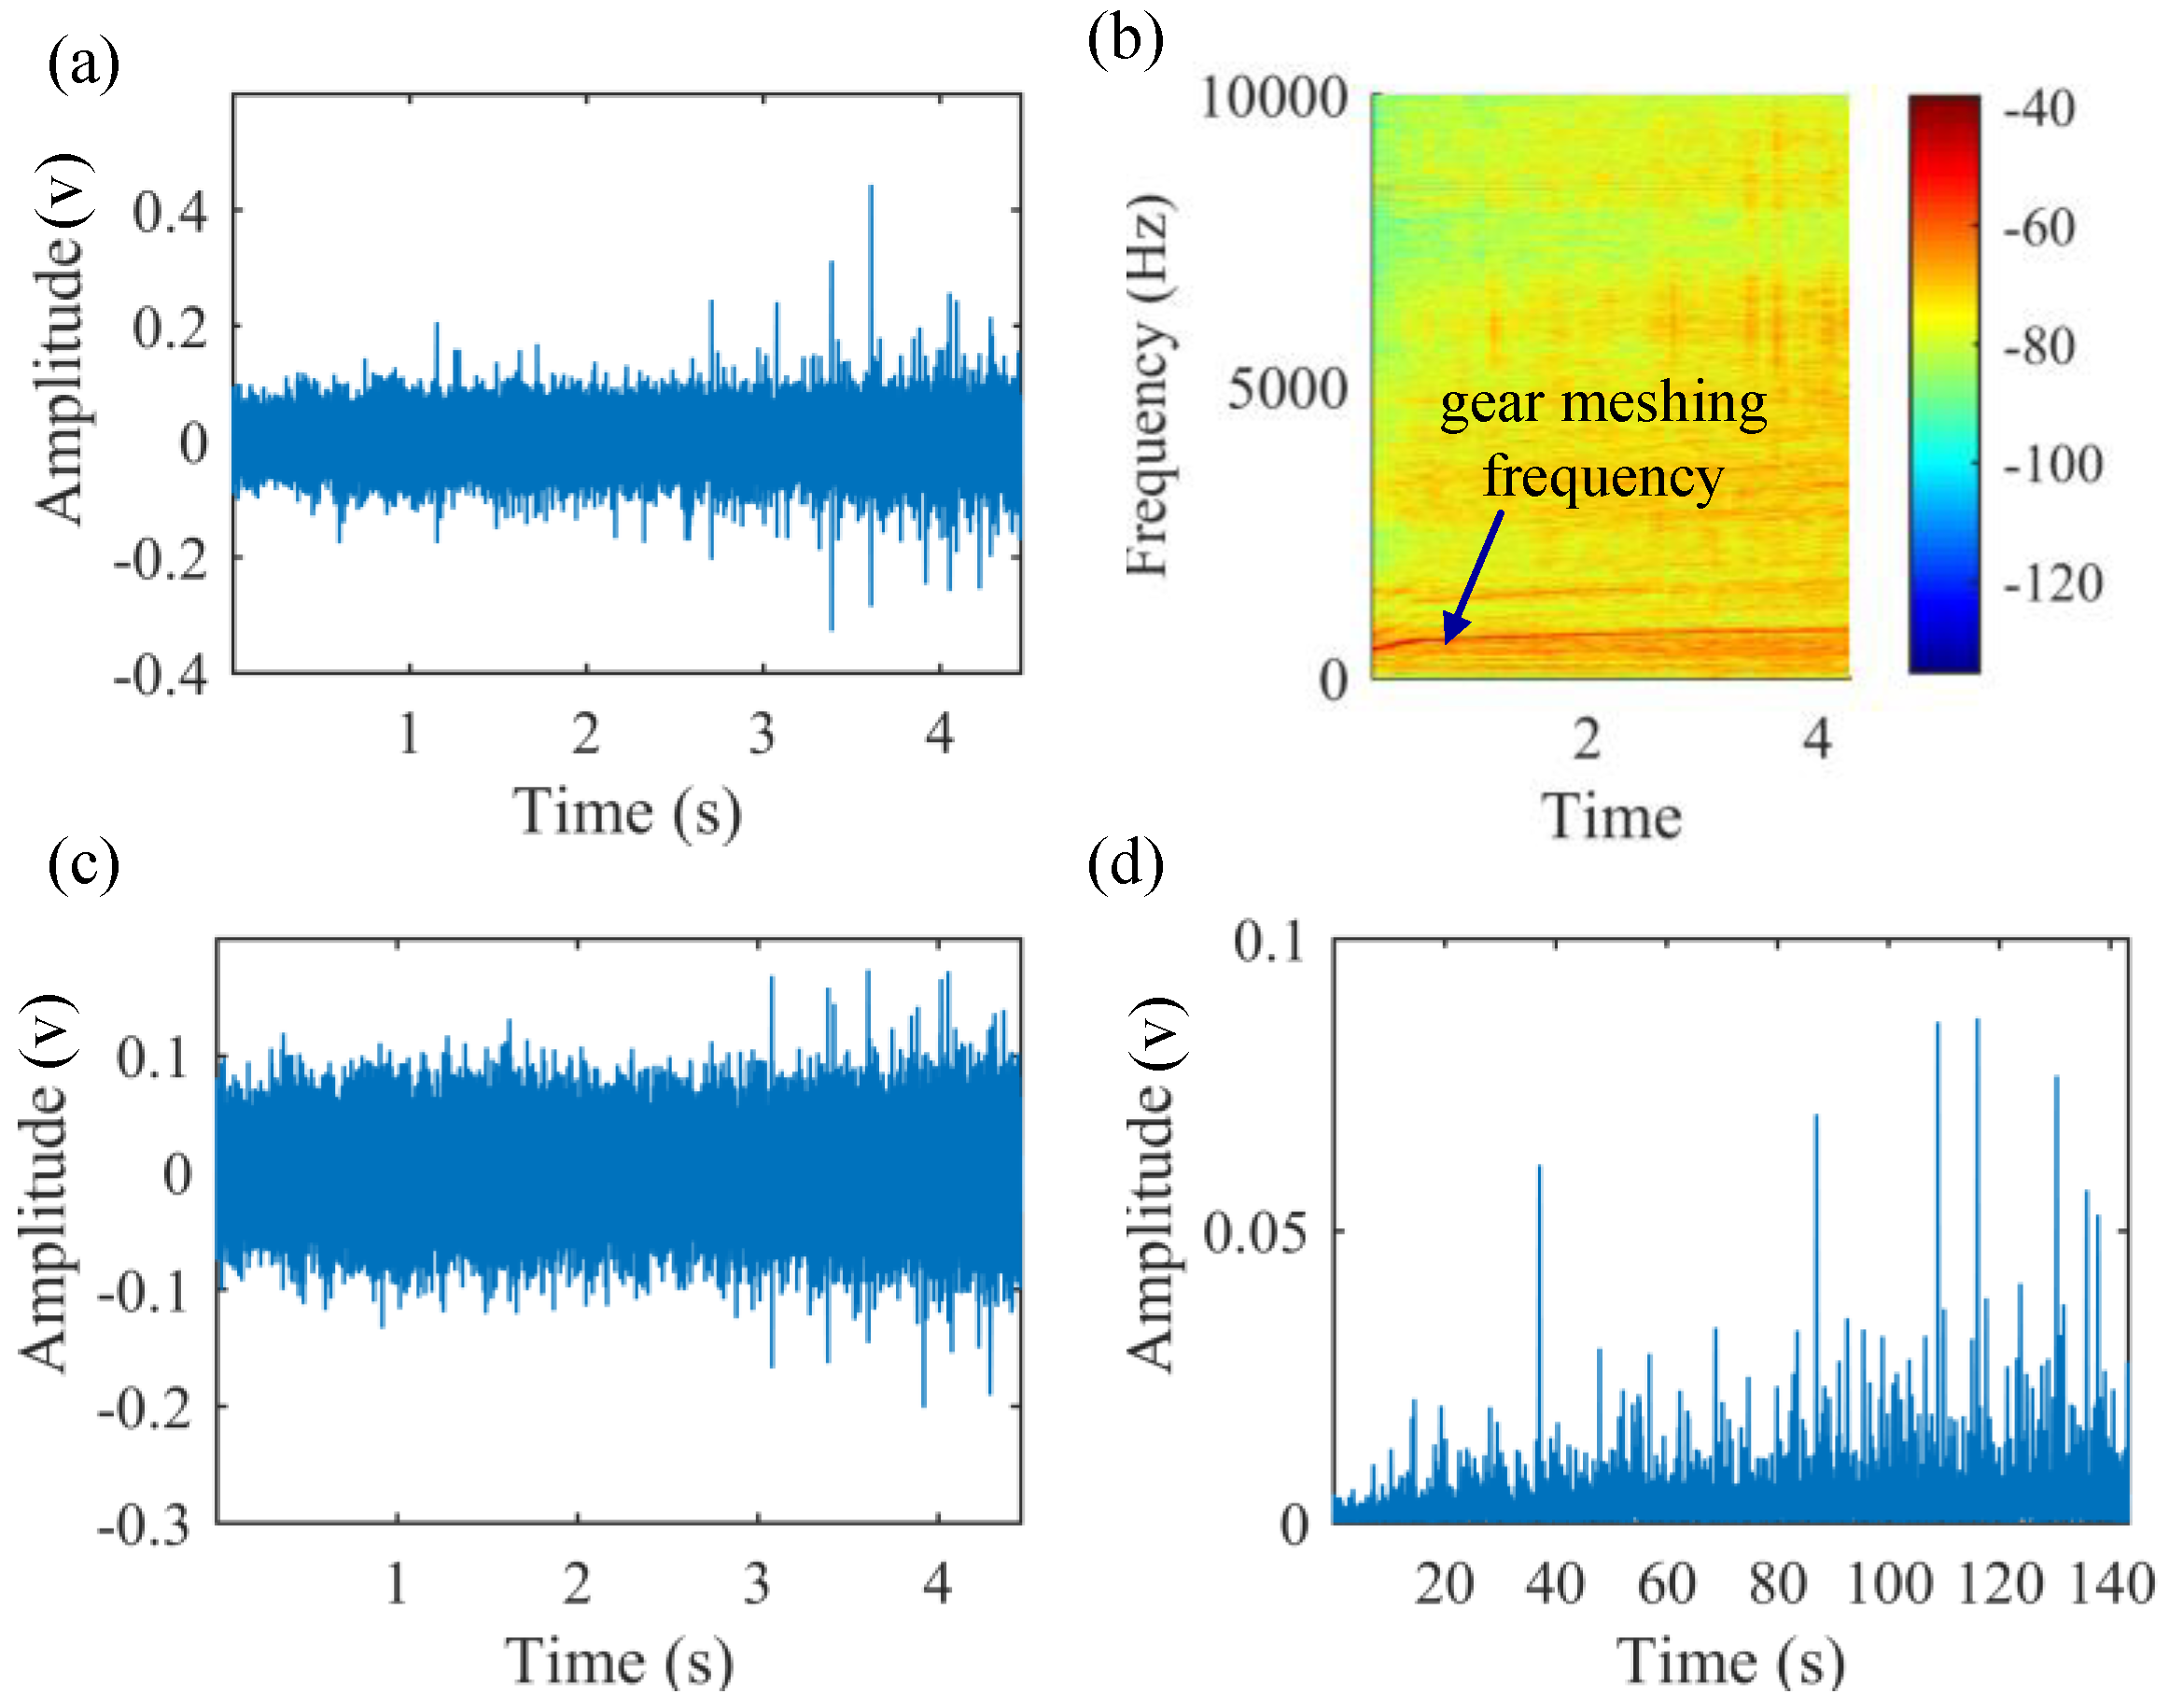
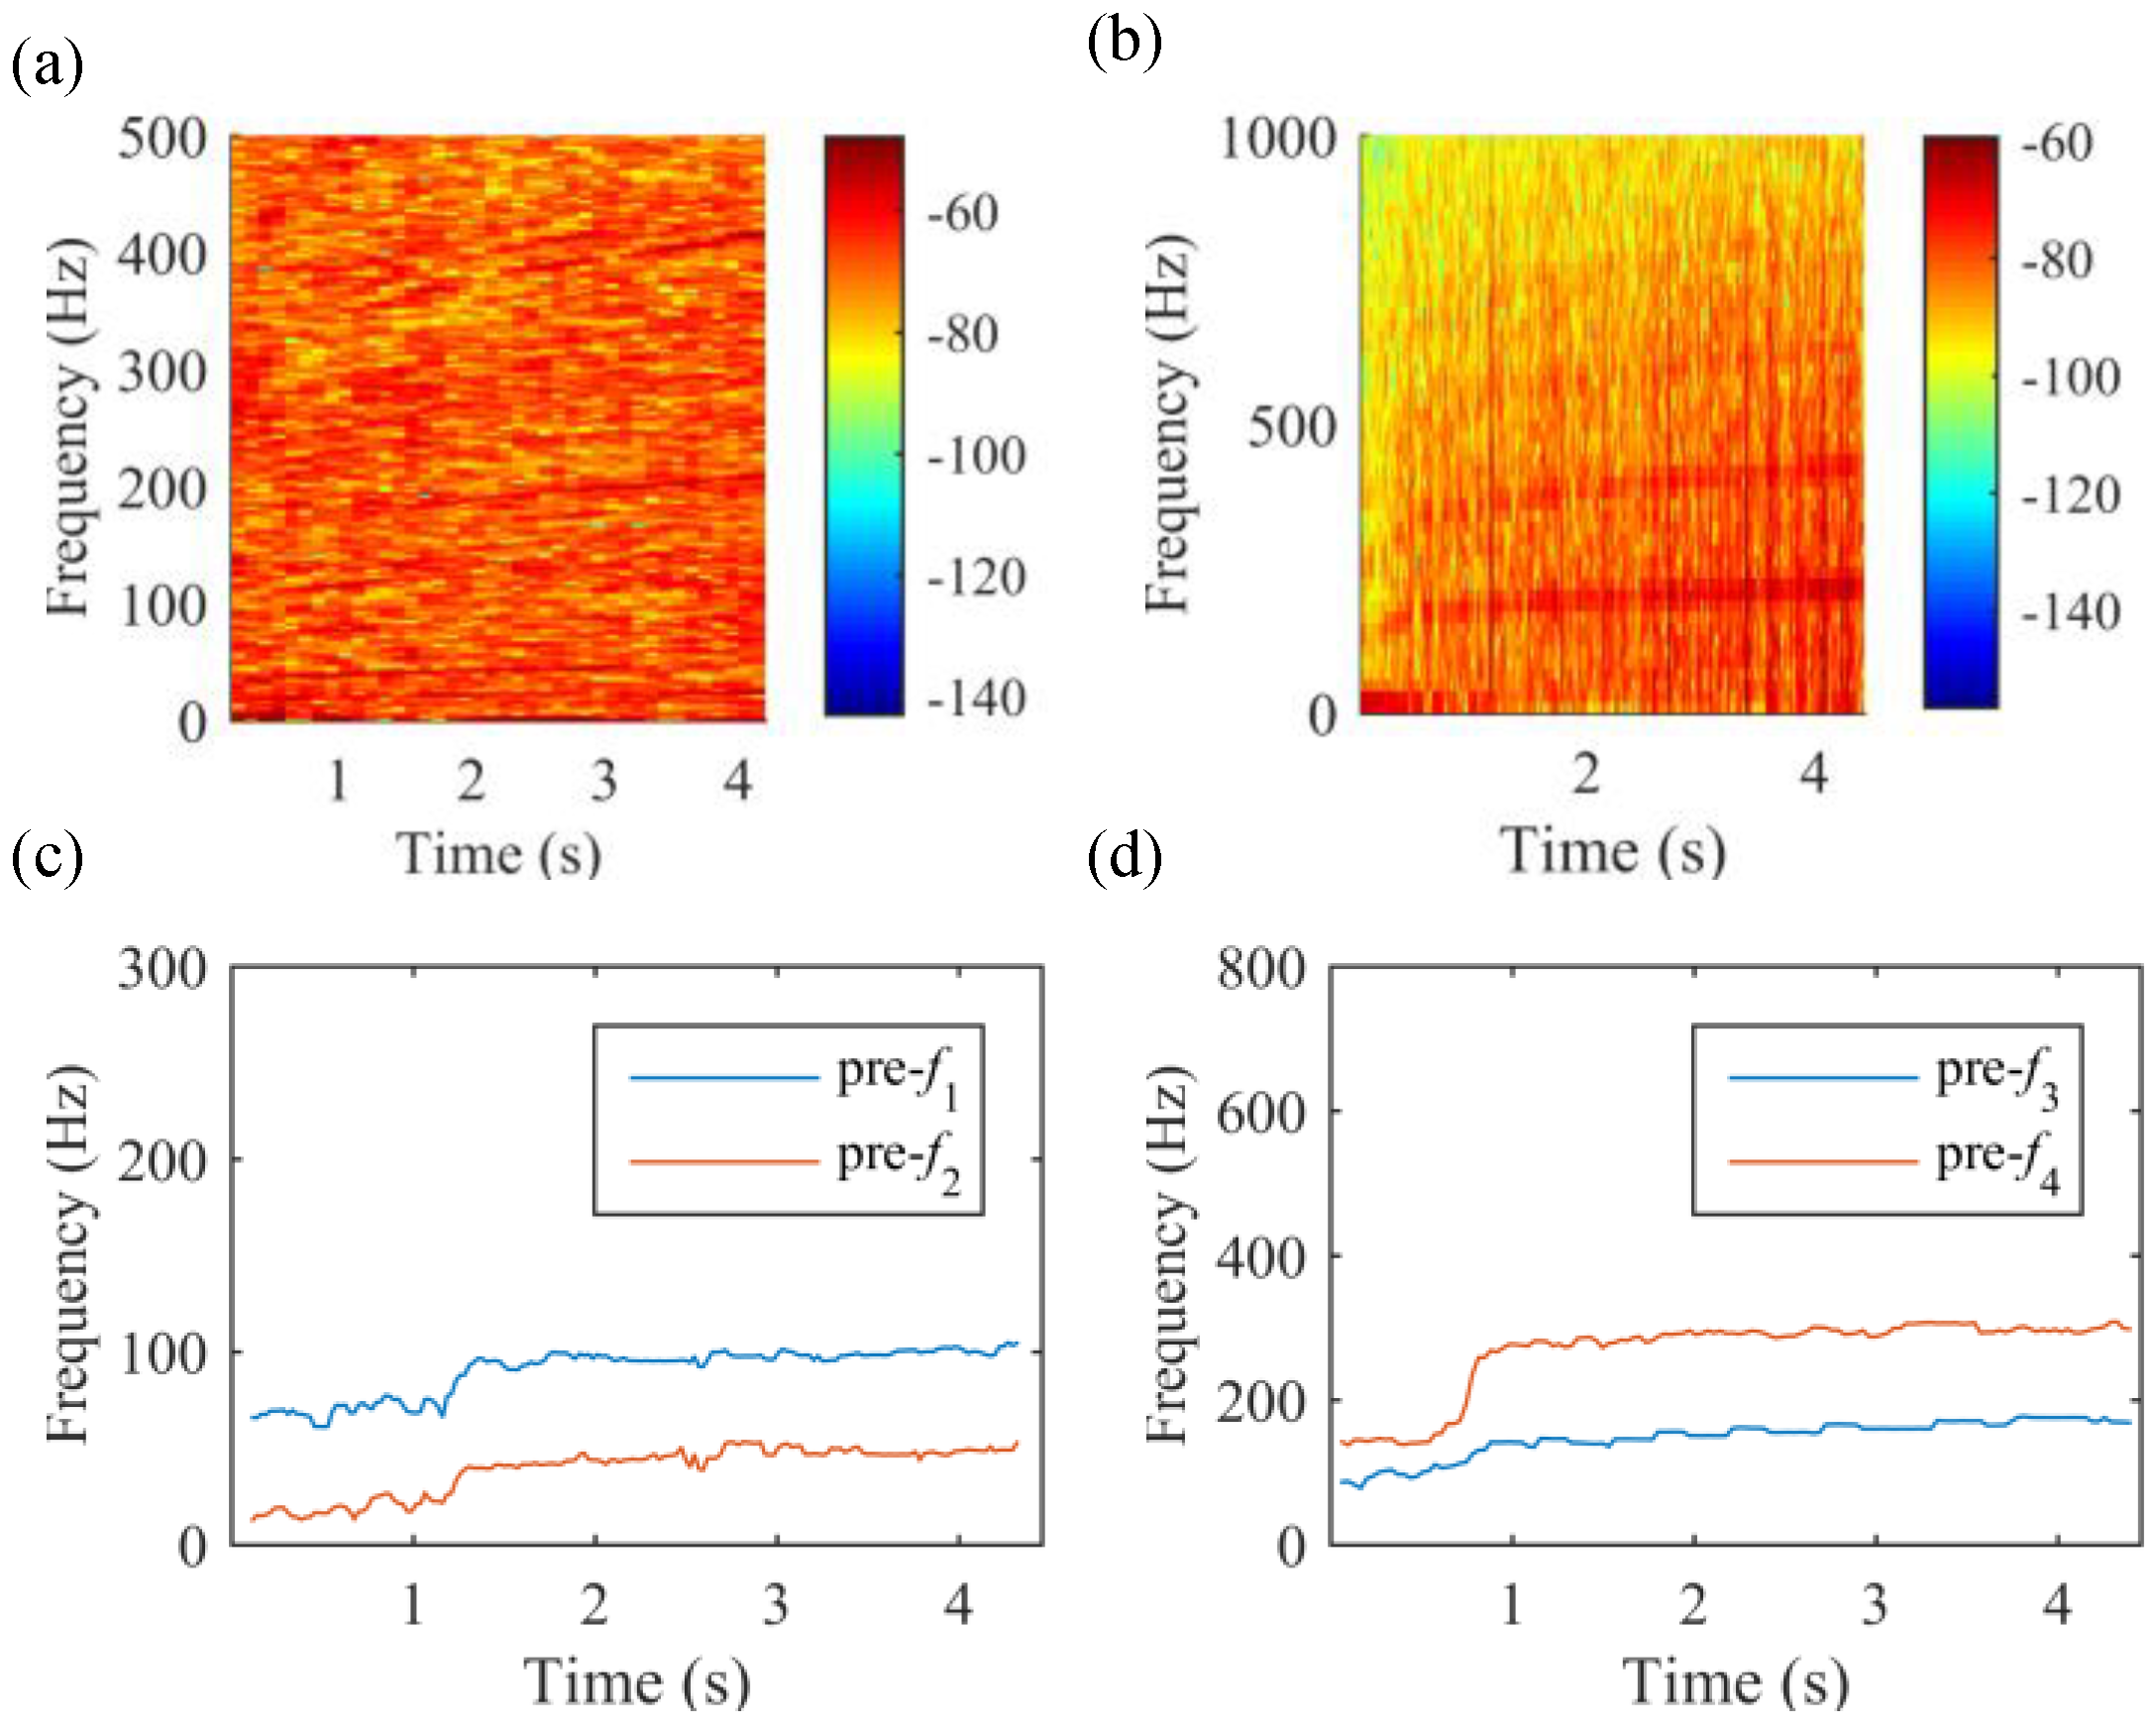
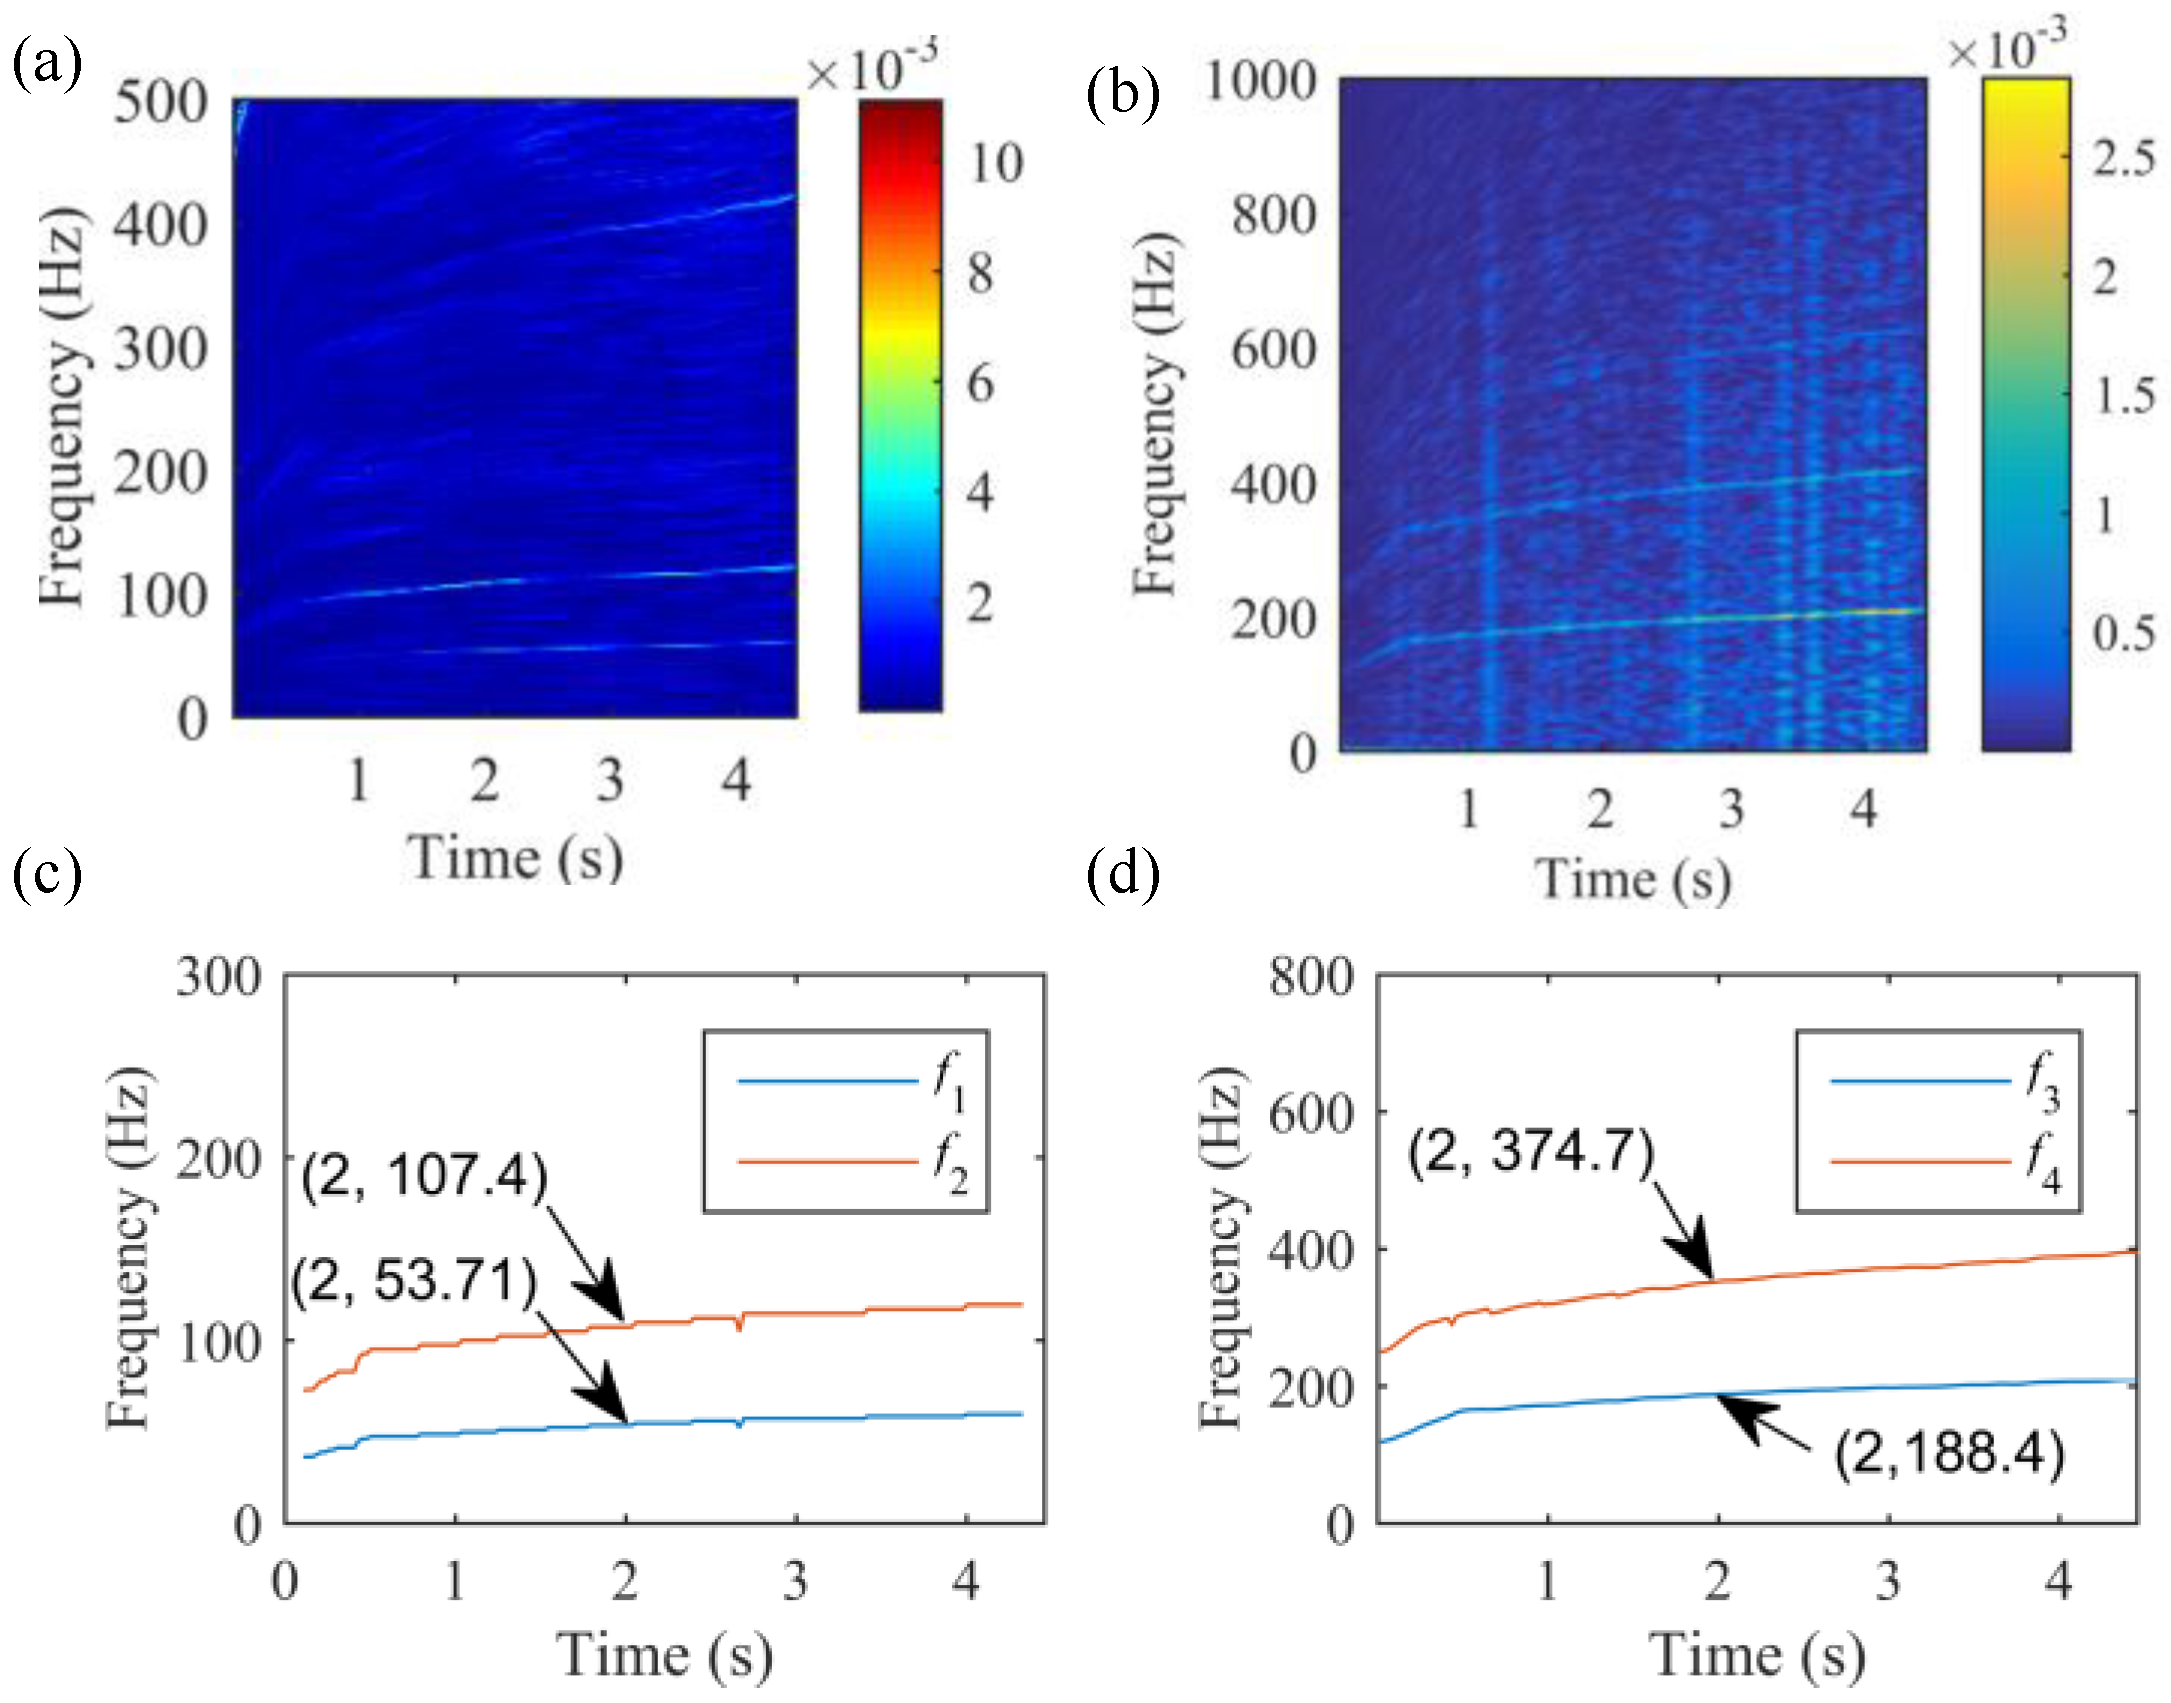
3.1. Bearing Outer Race Fault Diagnosis

Figure 6 shows the test rig for vibration signal collection from the bearing with a local outer race fault, which was a pre-seeded fault (it was created by the manufacturer and the dimensions of the fault are unknown). The shaft is driven by a motor controlled by an AC inverter. Two ER16K bearings are mounted to support the 1-inch steel shaft and the load. The faulty bearing is mounted on the left side. An 623C01 ICP accelerometer (PCB Piezotronics, NY, USA) is mounted on the platform of the test rig (far away from the faulty bearing) in order to challenge the effectiveness of the proposed method. The frequency range of the accelerometer is 0.5–10 kHz, with sensitivity of (± 10%) 100 mV/g. The data are transferred to an NI USB-6212 BNC data Acquisition Module (National Instruments, TX, USA) and recorded by a computer. The diameter ratio of the sheaves is 1:2.6 and the number of pinion teeth is 18. Then, the gear meshing frequency can be computed as the shaft IF divided by the diameter ratio of the sheaves and subsequently multiplied by the number of the pinion teeth. In addition, a tachometer was used to collect shaft IF for comparison purposes. The shaft IF increased from 30.25 Hz to 60.5 Hz. The sampling frequency in this experiment was 20 kHz.
The measured vibration signal and its TFR are presented in Figure 7a,b, respectively. From Figure 7b, it can be seen that the TFR of the signal is dominated by an interfering signal, i.e., the instantaneous gear meshing frequency (=6.92 fs). No clear IF ridges related to IFCF are observable. The lower frequency band signal, which is obtained via a low-pass filter with cut off frequency being set at 500 Hz, is shown in Figure 7c. The envelope of the resonant frequency band signal obtained by the SK method is shown in Figure 7d.
Then, STFT is used to get TFRs of the lower and resonant frequency band signals, as shown in Figure 8a,b. From Figure 8a, no clear shaft IF trajectories can be recognized. The IFCF of the outer race fault can be seen in Figure 8b; however, its second harmonic suffers from the smearing problem in the first second. Thus, IF ridges cannot be accurately extracted from such TFRs using the FPO algorithm. As can be seen in Figure 8c,d, the extracted IF ridges in the first second still suffer from slight jumps due to the smearing problem of TFRs. The extracted IF ridges from STFT-resulting TFRs using FPO are named pre-IFs, which are utilized to guide the base construction for FMLT.
The constructed base frequencies guided by the pre-f2 are illustrated in Figure 9. It can be seen that the base frequencies vary with the shaft IF and can match the frequencies of signal components from the bearing with a local outer race fault. With such bases, FMLT can be performed and the resulting TFRs are shown in Figure 10a,b, from which the shaft IF and IFCF related ridges can be easily recognized. Accordingly, the more accurate IF ridges can be extracted from the enhanced TFRs, as shown in Figure 10c,d. To quantitatively evaluate the enhancement, the mean relative error (MRE) is used. The MRE is computed by 1 / m i = 1 m | f i f r e a l i | / f r e a l i , where fi and f r e a l i are the extracted IF values at time τi and the true frequency value at τi, respectively, and m represents the number of time instants. Mean relative errors (MREs) of multiple IFs extracted by the FPO algorithm from traditional STFT-resulting TFRs, and the enhanced TFRs of both lower and resonant frequency band signals are listed in Table 2. It can be observed that the MREs of the IF ridges f1, f2, f3 and f4 extracted from the enhanced TFR are less than those of the IF ridges pre-f1, pre-f2, pre-f3 and pre-f4 extracted from the STFT-resulting TFR, indicating that the IF ridges from improved TFR are more accurate than the ones from STFT-resulting TFR.
The bearing fault diagnosis can then be performed based on these extracted IF ridges. Instead of resampling, arbitrary points at the same time instant are captured, as shown in Figure 10c,d. It can be calculated that a point on the topped IF ridge doubles the one on the bottomed IF ridge for both Figure 10c,d. The ratio of the point on the bottomed IF ridge in Figure 10d to the point of the bottomed IF ridge in Figure 10c equals 3.51 and the ratio of the point on the topped IF in Figure 10d to the one of the topped IF ridge in Figure 10c equals 3.49, which are approximately identical to the fault characteristic coefficient of the outer race fault 3.57 in Table 1. It then can be concluded that the bearing has a fault on the outer race.

3.2. Bearing Inner Race Fault Diagnosis

The experimental setup for inner race fault signal collection is shown in Figure 11. The gearbox on the platform of the test rig is dis-connected in the inner race test. The accelerometer is mounted the top of the faulty bearing. The accelerometer, tachometer and data acquisition module are the same as those used for the outer race fault test. The sampling rate is 12 kHz. The shaft IF speeds up from 17.3 Hz to 33 Hz and then drops to 24.4 Hz. The tachometer is also used for shaft IF collection for the comparison between real shaft IF and extracted IF.
The collected raw vibration signal and its corresponding TFR are plotted in Figure 12a,b, respectively, where no information related to inner race fault can be observed. To obtain IF ridges associated with both shaft IF and IFCF, the signal is also divided into the lower frequency band signal (by low-pass filtering) in Figure 12c and the resonance frequency band signal (by fast spectral kurtosis) in Figure 12d. With the traditional STFT, the TFRs of the lower and resonant frequency band signals can be obtained, as displayed in Figure 13a,b. Two pre-IF ridges extracted from the lower frequency band signal by iteratively using the FPO algorithm are presented in Figure 13c. The other two from the resonant frequency band signal are shown in Figure 13d. Due to the smearing effects of TFR, the extracted pre-IF ridges present frequency jumps in the first five seconds, which may influence bearing condition monitoring results. Thus, the proposed FMLT is applied to enhance the readability of the TFR with the assistance of the pre-IF from the lower frequency band signal.
The pre-IF is applied to build the bases of FMLT. The constructed bases are presented in Figure 14, from which it can be seen that frequencies of bases match the frequencies of signal components. The FMLT is then performed and the resulting enhanced TFRs are shown in Figure 15a,b. Then, the IF ridges extracted by an iterative FPO operation from the enhanced TFRs can be observed in Figure 15c,d. Similar to the outer race fault case, MREs of IF paths extracted by the FPO algorithm from traditional STFT-resulting TFRs and the FMLT-resulting TFRs are listed in Table 3. It can be observed that the MREs of the IF ridges extracted from the enhanced TFR are less than those of the IF ridges extracted from the STFT-resulting TFR, indicating that the IF ridges extracted from the improved TFR are more accurate than the ones from STFT-resulting TFR.
Then, according to the ratios of any two points at the same time instant from the lower frequency band and resonance frequency band in Figure 15c,d, respectively, the bearing fault type can be diagnosed. As shown in Figure 15c,d, the ratio of a point on IF ridge f3 to the one on pre-f1 equals 2.59 and the ratio of a data point on f4 to the one on pre-f2 is 2.61, which are almost identical to the half of the fault characteristic coefficient of the inner race fault. Thus, it can be concluded that the local bearing fault is positioned on the inner race of the bearing. It is worth mentioning that, according to the calculated ratio, the bottomed IF ridge in the TFR of lower frequency band signal is the second harmonic of shaft IF, rather than the shaft IF. The top IF ridge is the fourth harmonic of the shaft IF.

4. Discussion and Conclusions

This paper proposes an FPO-guided FMLT method to address the smearing problem of TFR arising because the base frequencies of LT do not match the frequencies of signals. The FPO algorithm is first adopted to extract the pre-IF paths of signals, facilitating the construction of bases of FMLT. With the FPO, the proposed method can deal with the signal corrupted with strong noise, where the kurtosis-guided IF estimation may be ineffective. The FMLT with the base frequencies matching with the frequencies of signal components can then be implemented to relieve the smearing problem of TFR and then enhance the readability of TFR. More accurate IF paths can be extracted from such enhanced TFR. The MREs of the extracted IF path before (i.e., pre-IF) and after the application of FMLT are calculated, showing that the accuracy of extracted IF paths is improved after the FMLT application. The bearing fault diagnosis can then be finished based on the ratios of arbitrary points on the IF ridges of the low frequency band signal to the ones on the IF ridges of the resonance frequency band signal at the same time instant. Analysis of the results of the experimental signal examines the effectiveness of the proposed method for TFR readability enhancement, accurate IF ridge extraction and bearing health condition monitoring under variable speeds. To summarize, the main advantage of the proposed method is that it solves the smearing problem of TFR by matching the frequencies of bases to the frequencies of signal components. The readability of TFR of signals with variable IF can be improved. As for applications, in addition to bearing fault diagnosis under time-varying speeds, the proposed method can also be applied to gear health monitoring under variable speed operations as well as the TFR enhancement of other signals.
It is worth mentioning that the potential limitation of the proposed method is that it may be ineffective in tackling signals with large fluctuations of the rotational speed. This is because the IF ridge in a windowed signal is assumed to be linear; however, if the shaft rotational speed varies with large fluctuations within a short time interval, this assumption may be not true. In this circumstance, a shorter window should be used, which will increase the computational complexity of the proposed method.

Author Contributions

Conceptualization, J.S. and G.D.; methodology, J.S.; software, R.D.; validation, J.S., G.D. and Z.Z.; writing—original draft preparation, R.D. and J.S.; writing—review and editing, J.S. and G.D.; supervision, G.D. and Z.Z.; funding acquisition, J.S.

Funding

This research was funded by National Natural Science Foundation of China (51605319), Natural Science Foundation of Jiangsu Province (Grant No. BK20160318), Postdoctoral Research Foundation of China (2017M611896) and Natural Science Foundation for Colleges and Universities in Jiangsu Province (Grant No. 16KJB460020).

Acknowledgments

Authors would like to thank the Lab E026 of University of Ottawa for the data collection and Ming Liang from University of Ottawa for the permission of using the vibration data. Authors would also like to thank the paper (Continuous wavelet transform ridge extraction for spectral interferometry imaging, Coherence Domain Optical Methods and Optical Coherence Tomography in Biomedicine IX. International Society for Optics and Photonics, 2005, Volume 5690) of Liebling M., Bernhard T. et al. for the permission of re-printing Figure 3.

Conflicts of Interest

The authors declare no conflict of interest.

Nomenclature

IFInstantaneous frequency
TFRTime frequency representation
LTLinear transform
STFTShort time Fourier transform
FMLTFrequency matching linear transform
FPOFast path optimization
TFATime frequency analysis
WTWavelet transform
PCTpolynomial chirplet transform
SSTsynchrosqueezing transform
SETSynchroextracting transform
IFCFInstantaneous fault characteristic frequency

References

  1. Cui, L.; Gong, X.; Zhang, J.; Wang, H. Double-dictionary matching pursuit for fault extent evaluation of rolling bearing based on the Lempel-Ziv complexity. J. Sound Vib. 2016, 385, 372–388. [Google Scholar] [CrossRef]
  2. Wang, D.; Peter, W.T.; Yiu, L.T. A morphogram with the optimal selection of parameters used in morphological analysis for enhancing the ability in bearing fault diagnosis. Meas. Sci. Technol. 2012, 23, 065001. [Google Scholar] [CrossRef]
  3. Glowacz, A.; Glowacz, W.; Glowacz, Z.; Kozik, J. Early fault diagnosis of bearing and stator faults of the single-phase induction motor using acoustic signals. Measurement 2018, 113, 1–9. [Google Scholar] [CrossRef]
  4. Islam, M.R.; Kim, Y.H.; Kim, J.Y.; Kim, J.M. Detecting and Learning Unknown Fault States by Automatically Finding the Optimal Number of Clusters for Online Bearing Fault Diagnosis. Appl. Sci. 2019, 9, 2326. [Google Scholar] [CrossRef]
  5. Had, A.; Sabri, K. A two-stage blind deconvolution strategy for bearing fault vibration signals. Mech. Syst. Signal Process. 2019, 134, 106307. [Google Scholar] [CrossRef]
  6. Urbanek, J.; Barszcz, T.; Sawalhi, N.; Randall, R. Comparison of amplitude-based and phase-based methods for speed tracking in application to wind turbines. Metrol. Meas. Syst. 2011, 18, 295–304. [Google Scholar] [CrossRef]
  7. Borghesani, P.; Ricci, R.; Chatterton, S.; Pennacchi, P. Diagnostic of rolling element bearings with envelope analysis in non-stationary conditions. In Advances in Condition Monitoring of Machinery in Non-Stationary Operations; Springer: Berlin/Heidelberg, Germany, 2014; pp. 127–135. [Google Scholar]
  8. Fyfe, K.; Munck, E. Analysis of computed order tracking. Mech. Syst. Signal Process. 1997, 11, 187–205. [Google Scholar] [CrossRef]
  9. Shi, J.; Liang, M.; Necsulescu, D.S.; Guan, Y. Generalized stepwise demodulation transform and synchrosqueezing for time–frequency analysis and bearing fault diagnosis. J. Sound Vib. 2016, 368, 202–222. [Google Scholar] [CrossRef]
  10. Ming, A.; Zhang, W.; Qin, Z.Y.; Chu, F.L. Fault feature extraction and enhancement of rolling element bearing in varying speed condition. Mech. Syst. Signal Process. 2016, 76, 367–379. [Google Scholar] [CrossRef]
  11. Saavedra, P.N.; Rodriguez, C.G. Accurate Assessment of Computed Order Tracking. Shock Vib. 2006, 13, 13–32. [Google Scholar] [CrossRef]
  12. Hasan, M.J.; Kim, J.-M. Bearing Fault Diagnosis under Variable Rotational Speeds Using Stockwell Transform-Based Vibration Imaging and Transfer Learning. Appl. Sci. 2018, 8, 2357. [Google Scholar] [CrossRef]
  13. Allen, J. Short term spectral analysis, synthesis, and modification by discrete Fourier transform. IEEE Trans. Acoust. Speech Signal Process. 1977, 25, 235–238. [Google Scholar] [CrossRef]
  14. Daubechies, I. The wavelet transform, time-frequency localization and signal analysis. IEEE Trans. Inf. Theory 1990, 36, 961–1005. [Google Scholar] [CrossRef]
  15. Mann, S.; Haykin, S. The chirplet transform: Physical considerations. IEEE Trans. Signal Process. 1995, 43, 2745–2761. [Google Scholar] [CrossRef]
  16. Peng, Z.; Meng, G.; Chu, F.L.; Lang, Z.Q.; Zhang, W.M.; Yang, Y. Polynomial chirplet transform with application to instantaneous frequency estimation. IEEE Trans. Instrum. Meas. 2011, 60, 3222–3229. [Google Scholar] [CrossRef]
  17. Yang, Y.; Zhang, W.; Peng, Z.; Meng, G. Multicomponent signal analysis based on polynomial chirplet transform. IEEE Trans. Ind. Electron. 2012, 60, 3948–3956. [Google Scholar] [CrossRef]
  18. Guan, Y.; Liang, M.; Necsulescu, D.S. Velocity Synchronous Linear Chirplet Transform. IEEE Trans. Ind. Electron. 2018, 66, 6270–6280. [Google Scholar] [CrossRef]
  19. Michel, C.; Guéguen, P. Time-frequency analysis of small frequency variations in civil engineering structures under weak and strong motions using a reassignment method. Struct. Health Monit. 2010, 9, 159–171. [Google Scholar] [CrossRef]
  20. Peng, Z.; Chu, F.; He, Y. Vibration signal analysis and feature extraction based on reassigned wavelet scalogram. J. Sound Vib. 2002, 253, 1087–1100. [Google Scholar] [CrossRef]
  21. Feng, Z.; Chen, X.; Liang, M. Iterative generalized synchrosqueezing transform for fault diagnosis of wind turbine planetary gearbox under nonstationary conditions. Mech. Syst. Signal Process. 2015, 52, 360–375. [Google Scholar] [CrossRef]
  22. Daubechies, I.; Lu, J.; Wu, H.T. Synchrosqueezed wavelet transforms: An empirical mode decomposition-like tool. Appl. Comput. Harmon. Anal. 2011, 30, 243–261. [Google Scholar] [CrossRef] [Green Version]
  23. Yu, G.; Yu, M.; Xu, C. Synchroextracting transform. IEEE Trans. Ind. Electron. 2017, 64, 8042–8054. [Google Scholar] [CrossRef]
  24. Huang, H.; Baddour, N.; Liang, M. Bearing fault diagnosis under unknown time-varying rotational speed conditions via multiple time-frequency curve extraction. J. Sound Vib. 2018, 414, 43–60. [Google Scholar] [CrossRef]
  25. Iatsenko, D.; McClintock, P.V.; Stefanovska, A. Extraction of instantaneous frequencies from ridges in time–frequency representations of signals. Signal Process. 2016, 125, 290–303. [Google Scholar] [CrossRef]
  26. Liebling, M.; Bernhard, T.F.; Bachmann, A.H.; Froehly, L.; Lasser, T.; Unser, M. Continuous Wavelet Transform Ridge Extraction for Spectral Interferometry Imaging; SPIE: Bellingham, WA, USA, 2005. [Google Scholar] [CrossRef]
  27. Antoni, J. The spectral kurtosis: A useful tool for characterising non-stationary signals. Mech. Syst. Signal Process. 2006, 20, 282–307. [Google Scholar] [CrossRef]
Figure 1. Illustration of fast path optimization (FPO): (a) amplitude peaks, (b) all possible paths, (c) the optimization path (reprinted from ref. [26]).
Applsci 09 03828 g001
Figure 2. Time frequency representation (TFR) of the simulated signal: (a) simulated signal, (b) Instantaneous frequency (IF) of the simulated signal, (c) short time Fourier transform (STFT)-resulting TFR and (d) chirplet transform (CT)-resulting TFR.
Applsci 09 03828 g002
Figure 3. Base frequencies of different linear transform (LT) methods: (a) base frequencies of STFT, (b) base frequencies of CT, (c) bases frequencies of the proposed frequency matching linear transform (FMLT), and (d) FMLT-resulting TFR.
Applsci 09 03828 g003
Figure 4. Time frequency analysis (TFA) for noisy multicomponent signal: (a) noisy signal, (b) real IF ridges of signal components, (c) TFR obtained using STFT, (d) TFR obtained using CT, and (e) TFR obtained using proposed FMLT.
Applsci 09 03828 g004
Figure 5. The flowchart of multiple IF ridge extraction.
Applsci 09 03828 g005
Figure 6. Experimental setup for outer race fault test.
Applsci 09 03828 g006
Figure 7. Outer race fault case: (a) Raw vibration signal, (b) TFR of the raw vibration signal, (c) lower frequency band signal, and (d) envelope of the resonant frequency band signal.
Applsci 09 03828 g007
Figure 8. Outer race fault case: (a) TFR of lower frequency band signal, (b) TFR of envelope of resonant frequency band signal, (c) extracted IF ridges from (a) using FPO, and (d) extracted IF ridges from (b) using FPO.
Applsci 09 03828 g008
Figure 9. Outer race fault case: illustration of the constructed frequencies of bases of FMLT.
Applsci 09 03828 g009
Figure 10. Processing results of the low and resonant frequency band signals of the outer race fault signal using the proposed FMLT: (a) FMLT-resulting TFR of the lower frequency band signal, (b) FMLT-resulting TFR of the resonant frequency band signal, (c) extracted IF ridges from (a) using FPO, and (d) extracted IF ridges from (b) using FPO.
Applsci 09 03828 g010
Figure 11. Experimental setup for inner race fault test.
Applsci 09 03828 g011
Figure 12. (a) Raw vibration signal from bearing with a local inner race fault, (b) TFR of the raw vibration signal, (c) lower frequency band signal, and (d) envelope of the resonant frequency band signal.
Applsci 09 03828 g012
Figure 13. Inner race fault case: (a) TFR of lower frequency band signal, (b) TFR of envelope of resonant frequency band signal, (c) extracted IF ridges from (a) using FPO, and (d) extracted IF ridges from (b) using FPO.
Applsci 09 03828 g013
Figure 14. Inner race fault case: illustration of the constructed frequencies of bases of FMLT.
Applsci 09 03828 g014
Figure 15. Processing results of the low and resonant frequency band signals of the inner race fault signal using the proposed FMLT: (a) FMLT-resulting TFR of the lower frequency band signal, (b) FMLT-resulting TFR of the resonant frequency band signal, (c) extracted IF ridges from (a) using the FPO, and (d) extracted IF ridges from (b) using the FPO.
Applsci 09 03828 g015
Table 1. Parameters of the bearings used in the test.
Bearing TypePitch Diameter (mm)Ball Diameter (mm)Number of BallsIFCF of Outer Race FaultIFCF of Inner Race Fault
ER16K38.527.9493.57 fr5.43 fr
Table 2. MREs of extracted IF ridges of outer race fault signal.
F RidgesPre-f1f1Pre-f2f2Pre-f3f3Pre-f4f4
MRE0.17170.11090.11490.06310.09820.08980.07780.0281
Table 3. MREs of extracted IF ridges of inner race fault signal.
IF RidgesPre-f1f1Pre-f2f2Pre-f3f3Pre-f4f4
MRE0.18390.00340.31260.29410.11460.11080.16320.0701

