Article

Evaluation of the Potential Toxicity of Effluents from the Textile Industry before and after Treatment

1
Department of Biology, Faculty of Science, University of Porto, Rua do Campo Alegre s/n, 4169-007 Porto, Portugal
2
Department of Biology and CIIMAR, Faculty of Science, University of Porto, Rua do Campo Alegre s/n, 4169-007 Porto, Portugal
3
Department of Biology and CESAM, University of Aveiro, Campus Universitário de Santiago, 3810-193 Aveiro, Portugal
4
Department of Chemistry and CESAM, University of Aveiro, Campus Universitário de Santiago, 3810-193 Aveiro, Portugal
5
Department of Biology and GreenUPorto, Faculty of Science, University of Porto, Rua do Campo Alegre s/n, 4169-007 Porto, Portugal
*
Author to whom correspondence should be addressed.
Appl. Sci. 2019, 9(18), 3804; https://doi.org/10.3390/app9183804
Submission received: 30 July 2019 / Revised: 6 September 2019 / Accepted: 7 September 2019 / Published: 11 September 2019

Abstract

:
The textile industry has an important role in the economic development of several countries; however, it consumes large amounts of water and generates huge quantities of wastewater. These effluents are of great environmental concern due to their complex chemical content, known by their toxicity and low biodegradability, which can cause harmful effects to the aquatic environment. In the present study, bioassays with aquatic species were employed to evaluate the toxicity of effluent samples collected before and after the treatments performed by the textile company. The toxic effects were investigated using four organisms, namely Aliivibrio fischeri, Raphidocelis subcapitata, Daphnia magna and Lemna minor, to represent different trophic levels. The ecotoxicological data confirmed that the raw textile effluent was very toxic, with A. fischeri being the most sensitive organism. While the toxicity of the effluent collected after the treatment performed by the textile company was clearly reduced, we still recorded sublethal toxicity to D. magna. These results highlight the importance of the bioassays for continuous monitoring of the toxicity of the treated effluents to prevent adverse effects on the environment. Further, results suggest that ecotoxicological data should be required in parallel with chemical data to better evaluate the safety of environmental discharges of wastewaters.

1. Introduction

The environmental impact of the textiles industries is associated with large quantities of water consumption and the variety and amount of chemicals used along all the steps of textile processing. The effluents from textile manufacturing, dyeing and finishing processes are highly variable in composition and contain a complex mixture of toxic substances such as dyes and pigments, salts, metals, biocides, surfactants and many other organic and inorganic components [1,2,3,4]. Along the textile processing process, there are extreme variations in different parameters such as chemical oxygen demand (COD), biochemical oxygen demand (BOD5), pH, colour and total dissolved solids (TDS). The primary concern about the release of coloured effluents into the environment is their negative aesthetic impact and eutrophication in the receiving waters; however, many of the dyes and degradation products used in the textile industry have been found to be toxic and genotoxic [4,5,6,7]. Another great concern regarding the textile industries from the environmental point of view is that in many regions, most of the water used during the textile processing is discharged in the aquatic ecosystems as waste and without adequate treatment, leading to contamination problems [8,9,10]. Due to the high complexity and variability of these effluents, there is no general procedure for the treatment of this waste and a simple treatment technology does not guarantee the satisfactory removal of all contaminants, especially in terms of toxicity [8]. The conventional methods used for the treatment of these effluents rely on biological and physico-chemical methods, including, in the last few years, the advanced oxidation processes [6,11]. Due to the complexity of these effluents, the wastewater treatment is inefficient in most cases, leading to negative environmental impacts [12]. Unfortunately, most of the evaluations of these effluents before discharge into freshwater ecosystems are made based on chemical methods that do not provide sufficient information about the potential adverse effects of contaminant mixtures on organisms [3,9,13]. However European legislation, namely the Water Framework Directive (WFD, Directive 2000/60/EC of 23 October 2000) and daughter directives, extended the analysis of water quality not only to physico-chemical and microbiological analysis, but also to the characterisation of the biological communities inhabiting the receiving ecosystems. Also, measures and targets were proposed to reduce and control the pollution caused by priority substances and to reduce or eliminate discharges of priority hazardous substances [14]. The decision n° 2455/2001/EC of the European Parliament and of the Council of 20 November 2001 established a first list of 33 priority substances including priority hazardous substances, which, according to existing information, pose a significant risk to the aquatic environment [15]. In order to regulate the discharge of these substances, the Directive 2008/105/EC of 16 of December 2008, established environmental quality standards (EQS) for the priority substances and other included pollutants [16].
However, the majority of chemical substances present in the textile effluents are not included in the previous list for which EQS were defined, but they can be detected, at least indirectly, if they harm the ecological communities of receptor systems. Also, it is important to note that although individual compounds may be present at concentrations below the established limit, the combined exposure to the complexity of an industrial effluent can be underestimated [17]. It is therefore of utmost importance to include a whole effluent toxicity for an effective assessment of the risk, hence the importance of this study, as this is not enforced by European and national regulations. Therefore, the toxicity bioassays continue to be a useful tool for evaluating the effect of these complex effluents on living organisms. Moreover, continuous monitoring of effluent toxicity, along with chemical parameters, prior to discharge into the environment is critical for assessing the effectiveness of wastewater treatment systems and to more effectively ensure the protection of the receiving media. However, bioassays are an unrealistic representation of an ecosystem across a single organism. Indeed, it is difficult to predict the impact on other species as they have different sensitivities to the same pollutant. Thus, it is recommended to apply a battery of tests with organisms belonging to different trophic levels and with a wide range of sensitivities [18]. Hence, the aim of the present study was to evaluate the toxicity of textile effluents (untreated and treated) by performing a battery of ecotoxicity tests with species from different trophic levels. The toxicity tests were performed with the bacteria Aliivibrio fischeri, the microalgae Raphidocelis subcapitata, the macrophyte Lemna minor and the cladoceran Daphnia magna. The parameters tested were bioluminescence (A. fischeri), survival (D. magna), feed rate (D. magna) and growth (R. subcapitata and L. minor).

2. Materials and Methods

2.1. General Characterisation of the Textile Effluent

The samples of textile effluent were supplied by a Portuguese textile manufacturer. The samples were taken at two different points in the wastewater treatment plant, before (RE) and after (TE1 and TE2) the application of a sequential treatment. The treated effluent was collected at two different moments, separated by a few days. The treated effluent was subjected to physical, biological and chemical treatments carried out in the company’s own wastewater treatment plant. The raw effluent (highly alkaline and coloured) first went through a physical process that removed the main solid residues present. Afterwards, the effluent passed to a homogenisation tank with a Venturi-type submerged aerator for a pre-oxidation of the organic matter. At this step, sulphuric acid was added to correct the pH (between 6 and 9) and make the effluent suitable for the biological treatment. The biological treatment was performed in aeration tanks where the organic matter resulting from the dyeing processes, both the cotton waste and the chemicals and dyes used, was decomposed by the action of bacteria through aerobic digestion. In this tank, flocculants were further added to allow the agglomeration of the suspended particles that were not biodegradable. Next, the effluent was sent to a decanter to separate the biological sludge from the treated effluent. The treated effluent was then discharged to a municipal collector, while part of the biological sludge was recirculated back to the biological tank, and the other part was sent to a tank where a flocculant was added so they could be removed through a filter press and sent to landfill. The samples of treated effluent (TE1 and TE2) were collected immediately before being discharged to the municipal collector at different times in a tank with a continuous mixture.
Before testing, all the samples were filtered with a glass fiber Whatman filter (Sigma-Aldrich Química, S.L., Sintra, Portugal) with a porosity of 1.2 μm. The colour of the samples was measured in a photometer C200 (Hanna Instruments, Póvoa de Varzim, Portugal) using the Platinum Cobalt from Standard Method for the Examination of Water and Wastewater (American Public Health Association, 1998). The values of pH, conductivity and total dissolved solids (TDS) were measured with a portable multiparameter (HI 991300, Hanna Instruments, Póvoa de Varzim, Portugal).

Gas Chromatography Coupled to Mass Spectrometry (GC-MS) Methodology

The samples of textile effluent (RE and TE1) were concentrated using solid-phase extraction (SPE). For the isolation and preconcentration of pollutants, two different sorbents were used: C18 (Sigma-Aldrich Química, S.L., Sintra, Portugal) (500 mg, 6 mL) and styrene divinylbenzene (Sigma-Aldrich Química, S.L., Sintra, Portugal) (200 mg, 6 mL). A loading volume of 50 mL of effluent sample was applied to the C18 cartridge and acidified to pH 3. After that, it was loaded on the styrene divinylbenzene cartridge at 15 mL/min and eluted with 10 mL of triethylamine (5 mM) and acetic acid/methanol (5 mM) (1:9, v/v) for the desorption of anionic substances. The eluents used for desorption were the following: 2 × 5 mL of hexane followed by 2 × 5 mL of dichloromethane/hexane (4:1, v/v) and 2 × 5 mL of methanol/dichloromethane (9:1, v/v). Finally, total evaporation of the extracts was carried out with a stream of nitrogen. The extracts were reconstituted to a final volume of 1 mL in methanol prior to analysis.
The GC-MS analyses were performed on a Shimadzu apparatus (Shimadzu Limited, Milton Keynes, UK) equipped with a capillary column (DB-17-HT; 30 m × 0.25 mm × 0.1 μM). The sample (0.2 mL) was injected at a pressure of 15 psi, where helium was used as a carrier gas at a rate of 35 mL/min. The temperature program started at 40 °C and then increased up to 350 °C at a rate of 8 °C/min. An electron impact ion source was used for all analyses. The electron impact ion conditions were as follows: ionisation energy 70 eV, source temperature set at 200 °C and interface temperature at 350 °C. A series of injections of the available standards in the same range of sample concentrations were used to obtain the calibration equations.

2.2. Microtox® Test with Aliivibrio fischeri

The ecotoxicity of the raw effluent (RE) and of the treated effluent 1 (TE1) was assessed following the 81.9% Basic Test protocol provided by the supplier, using a Microtox Model 500 Analyser (Modern Water, Guildford, UK) [19]. The endpoint measured in the Microtox assay was the decrease in the intensity of light emitted by the luminescent marine bacteria, A. fischeri, after 5, 15 and 30 min of exposure to several dilutions of the effluent (using a dilution factor of 2×), after a previous osmotic adjustment of the samples.

2.3. Growth Test with Raphidocelis subcapitata

The stock culture of R. subcapitata was maintained in Woods Hole MBL growth medium, at 20 ± 2 °C under continuous illumination (100 µE∙m−2∙s−1) The growth inhibition test was performed for the raw effluent (RE) and the treated effluent 1 and 2 (TE1 and TE2) according to the OECD guideline [20], with an adaptation to 24-well microplates [21]. For TE1 and TE2 samples, eight concentrations were tested, applying a dilution factor of 1.06 (100.00, 94.34, 89.00, 83.96, 79.21, 74.73, 70.50 and 66.51%), whereas a dilution factor of 1.1 (100.00, 90.91, 82.64, 75.13, 68.30, 62.09, 56.45 and 51.32%) was applied to the RE sample. The MBL medium was used as a control and dilution medium. Three replicates were established per dilution and the control and each well was filled with 900 µL of test solution plus 100 μL of microalgae inoculum (initial cell concentration of 104 cells/mL). The tests were carried out under the same conditions used for culturing and were re-suspended twice a day using repetitive pipetting to promote active gas exchange and prevent cell clumping. At the end of the 72-h exposure, the cell density was estimated by measuring the absorbance at 440 nm in a UV spectrophotometer (Du®720, Beckman Coulter, California, USA) and using a standard calibration curve.

2.4. Toxicity Test with Lemna minor

The cultures of L. minor were maintained in sterilised Steinberg medium [22], under a controlled temperature (22 ± 2 °C) and a light–dark photoperiod of 16 h:8 h. The growth tests with the aquatic plant L. minor were performed according to the OECD guideline [22]. The assay was performed in 150 mL Erlenmeyers, previously sterilised, and filled with 100 mL of medium. The macrophytes were exposed to five concentrations of RE (100.00, 71.43, 51.02, 36.44 and 26.03%) and six concentrations of TE2 (100.00, 90.91, 82.64, 75.13, 68.30 and 62.09%). Preliminary tests were performed to choose the range of concentrations, and for RE, the pH was adjusted since it had a pH value of 3.07, and without adjusting, a total inhibition of growth and development of L. minor was recorded. All treatments, including the control (Steinberg medium), were done in triplicate and conducted under the same conditions as the cultures. Twelve fronds (two to three fronds per colony) of similar size were randomly selected and placed into each replicate. The growth rate (day−1) was determined by measuring the dry weight at the beginning and after 7 days of exposure.

2.5. Toxicity Test with Daphnia magna

The cultures of D. magna were maintained in the laboratory under 20 ± 2 °C and a 16hL:8hD photoperiod in a synthetic ASTM hard water medium [23], supplied with an organic additive [24]. Cultures were renewed and fed with R. subcapitata (3 × 10⁵ cells/mL) every other day. Organisms used in all experiments were born between the 3rd and the 5th broods.

2.5.1. Acute Immobilisation Test

The assay with D. magna was performed following the standard protocol proposed by OECD 202 [25]. For each textile effluent (RE and TE1), five animals, less than 24 h old, were randomly assigned per vessel (25 mL) for a total of four replicates per concentration (100.00, 66.67, 44.44, 29.63, 19.75, 13.17 and 8.78%) and a control (ASTM medium). The test was run at a temperature of 20 °C without the addition of food or organic additives. After the exposure period (24 h and 48 h), each vessel was monitored for immobilised neonates.

2.5.2. Feeding Inhibition Assay

The feeding inhibition assay with D. magna was conducted for the RE and the TE1 and following the methodology described by McWilliam and Baird [26]. The concentrations tested were based on the median effective concentration (EC50) calculated from the immobilisation assay with D. magna after 24 h of exposure. The concentrations used were 36.50, 28.08, 21.60, 16.61, 12.78, 9.83, 7.56 and 5.82% for RE and 100.00, 83.33, 69.44, 57.87 and 48.23% for TE1. Neonates that were 4 days of age were exposed for 24 h to 12 mL of different dilutions of the effluent and a control in the presence of food. The microalgae R. subcapitata was added at a concentration of 5 × 10⁵ cells/mL in order to determine the effect of the effluent on the feeding rate of D. magna. The experimental setup included four replicates per concentration and control. The control was prepared with 12 mL ASTM culture medium with the same concentration of algal cells. The assay was performed in the dark to avoid algal growth. After 24 h, the cell density was estimated from absorbance measurements at 440 nm in a dual-beam spectrophotometer (Du®720, Beckman Coulter) using standard calibration curves. The absorbance values used for the calculation results were from the difference between the values registered after 24 h of exposure and the initial absorbance since the textile effluent presented some colour.

2.6. Statistical Analysis

For A. fischeri, the EC50 and their corresponding 95% confidence intervals were computed using the MicrotoxOmni® software version V1.18 (Modern Water, Guildford, UK) with a linear model [19]. The EC50 values with the 95% confidence limits for D. magna immobilisation test were calculated using a Probit analysis [27] using the IBM SPSS 21 software (NY, USA). For the growth inhibition test with R. subcapitata and L. minor, and for the chronic assay with D. magna, the effect concentrations (EC50 and EC20) and the 95% confidence limits were calculated for each effluent sample (RE, TE1 and TE2) using the nonlinear least squares regression procedure supplied by the software package Statistica 12.0 (StatSoft, Inc., Tulsa, OK, USA). One-way ANOVAs followed by a Dunnett test or Tukey’s test were also employed to find out potential significant differences in the endpoints assessed between the control and tested effluent dilutions, or between each other, using the software Sigmaplot version 11.0 (Systat Software, Inc., CA, USA, 2008; Zar, 1996). No observed effect concentration (NOEC) and low observed effect concentration (LOEC) values were taken from ANOVA significant results, reported for a significance level of 0.05. Toxicity was expressed as toxic units (TU), where TU = 100/EC50, to better compare the results.

3. Results and Discussion

3.1. Physico-Chemical Characterisation of Textile Effluent Samples

A textile company from the centre of Portugal provided the textile effluent used in the toxicity tests. One raw effluent sample (RE) and two treated effluents (TE1 and TE2) were analysed. According to the information given by the textile company, the TE2 effluent sample resulted from the dyeing process. This process can be divided into two steps, both giving rise to a wastewater. The first step was the bleaching process, which prepared the raw material for the next step, which was the dyeing process. The bleaching process was carried out with hydrogen peroxide at pH values between 10 and 11, and was used to remove unwanted natural colour from the fibres. The dyes used in the company were 98% vat dyes that dye in alkaline medium (pH 12–14) in the absence of oxygen. Afterwards, to fix the dye on the fibres, they must be oxidised with a diazo compound, followed by hydrogen peroxide. Thus, the resulting effluent was typically alkaline (pH 9–11), with high levels of nitrates resulting from the oxidation process and with colour as well. However, the RE sample had an acidic pH, greyish colour, fibres wastes, high conductivity and a foam characteristic with the presence of surfactants (Table 1). According to INETI [28], high conductivity, acidic pH, nitrates and colour are characteristics of an effluent resulting from dyeing with solubilised vat dyes, which was the case of the RE sample.
Table 1 shows the effluent samples used in the toxicity tests and the respective physical and chemical characteristics. Comparing the effluents treated (TE1 and TE2) with the raw effluent (RE), there was a clear improvement in terms of colour and pH, but the total dissolved solids (TDS) and conductivity increased after the treatment. The high levels of dissolved solids may indicate that there was inorganic salts (calcium, magnesium, potassium, sodium, bicarbonates, chlorides and sulfates) and small amounts of dissolved organic matter [29], which were not removed by the applied treatments. According to the Portuguese Law by Decree n° 236/98 of 1 August, the maximum allowable value (VMA) for TDS in water is 1500 mg L−1 [30]. The value of conductivity indicates the presence of dissolved and ionised salts and is proportionally related to the presence of total dissolved solids. These results suggest the ineffectiveness of the treatment applied in terms of these parameters. Another hypothesis is that this increase in TDS resulted from the treatment itself because flocculants and reagents were added for pH adjustment.
Table 2 shows the chemical composition of the two textile effluent samples used (RE and TE1). For all the components present in the effluent, higher concentrations were recorded for the RE when compared to the TE1, as expected. The percentage of removal after the treatment recorded for each component ranged from 20 to 32% (Table 2), indicating that the treatment applied by the textile company had a similar efficiency for all compounds assessed. The textile effluent used in this study consisted of a complex mixture of phenolic compounds, phthalates, aliphatic carboxylic acids, aromatic carboxylic acids, amines, alkanes and linear aliphatic alcohols (Table 2). As also reported by Pérez et al. [31], several of the compounds reported in Table 2 belong to the group of nonylphenols and their degradation products, which are often used as surfactant agents in the preparation of textile fibres. Nonylphenol is one of the substances identified as “priority hazardous substances” under the Directive 2008/105/EC of 16 December [16]; however, the values recorded in the effluent did not exceeded the values of the environmental quality standards (EQS) established for surface waters (maximum allowable concentration—2 μg L−1) (Table 2). From the group of phenolic compounds, derivatives from ionol (2,6-di-tert-butyl-4-methylphenol) and bisphenol A were detected; these compounds are used as additives in plastics and rubbers. Several derivatives from bisphenol compounds are endocrine disruptors because they are similar to estrogen, raising serious concerns about the effects on populations, since it is a compound widely used in industry [32,33]. Castillo and Barceló [34] suggest the compounds butyl-octyl-phtalate and diisooctylphtalate as being the most toxic compounds of the untreated textile effluent. The amines are used in the production of dyes and textile products, while the linear aliphatic alcohols are applied as solvents and antifoaming agents [34].
Phenol is usually used as a disinfectant and in the production of phenolic resins, like bisphenol A and caprolactam [35]. Tisler and Zagorc-Koncan [36] evaluated the toxicity of phenol to several aquatic organisms from different groups (a bacterial culture, the algae Scenedesmus quadricauda, the crustacean Daphnia pulex and the fish Oncorhynchus mykiss). They showed that phenol is more toxic to fish (EC50,48 h = 13.1 mg L−1), followed by the crustacean (EC50,48 h = 25.0 mg L−1), the green algae (EC50,24 h = 403.0 mg L−1) and finally the bacterial culture (EC50,120 h = 510.0 mg L−1). These authors also assessed the toxicity of formaldehyde, which was more toxic to the crustacean, followed by algae and the bacterial culture. These results, although dealing with individual substances and not with the real effluent itself, reinforces the importance of an ecotoxicological evaluation of different taxonomic groups since the sensitivity of each organism differs with the different components of the effluent [36]. The concentrations of phenol in the RE (0.0325 μg L−1) and in the TE1 (0.0250 μg L−1) were below the emission limit values (ELV) for wastewater and treated effluent discharged (0.5 mg L−1 C6H5OH), referred to, for example, in the Portuguese Law by Decree n° 236/98 of 1 August [30]. If we compare the concentration of phenol in our samples (Table 2) with the values of toxicity from the study of Tisler and Zagorc-Koncan [36], neither the raw effluent nor the treated effluent presented an ecotoxicological risk for the fish or crustacean.
Triclosan is used as antibacterial and antifungal agent. Orvos et al. [37] studied the toxicity of triclosan to activated-sludge microorganisms, algae and the aquatic plant L. gibba. Although this compound is used as an antibacterial, no toxic effects were recorded for the activated-sludge microorganisms. However, algae were the most susceptible organisms, recording a 96-h biomass EC50 of 0.70 μg L−1 for Scenedesmus subspicatus and 0.97 μg L−1 for Anabaena flos-aquae. The aquatic plant L. gibba was shown to be more resistant, recording an EC50 of 62.5 μg L−1 [37]. The values recorded for triclosan in the RE and TE1 samples (Table 2) were lower than the EC50 values reported by Orvos et al. [37].
However, most of the compounds present in the effluent samples studied are not included in the legislation, in particular the Directive 2008/105/EC of 16 December 2008 [16], nor the Law by Decree n° 236/98 of 1 August [30]. Nevertheless, the possible toxic effects and the potential risk of the effluent due to synergistic interactions between the different compounds cannot be ignored, even at low concentrations.

3.2. Toxicity Test with Aliivibrio fischeri (Microtox®)

The short-term toxicity of the textile effluent before (RE) and after the treatment (TE1) was assessed using the marine bacteria A. fischeri and the results are shown in Table 3. The RE sample was highly toxic, while TE1 sample presented a low toxicity. In the study of Tigini et al. [5], the artificially prepared textile effluents (W1 and W2) tested were less toxic to A. fischeri when compared to the RE (Table 3). However, an artificial effluent can never mimic the real effluent, since it is not possible to know all the compounds present in the effluent or even simulate the interaction between them; this is probably the reason of the lower toxicity recorded by Tigini et al. [5].

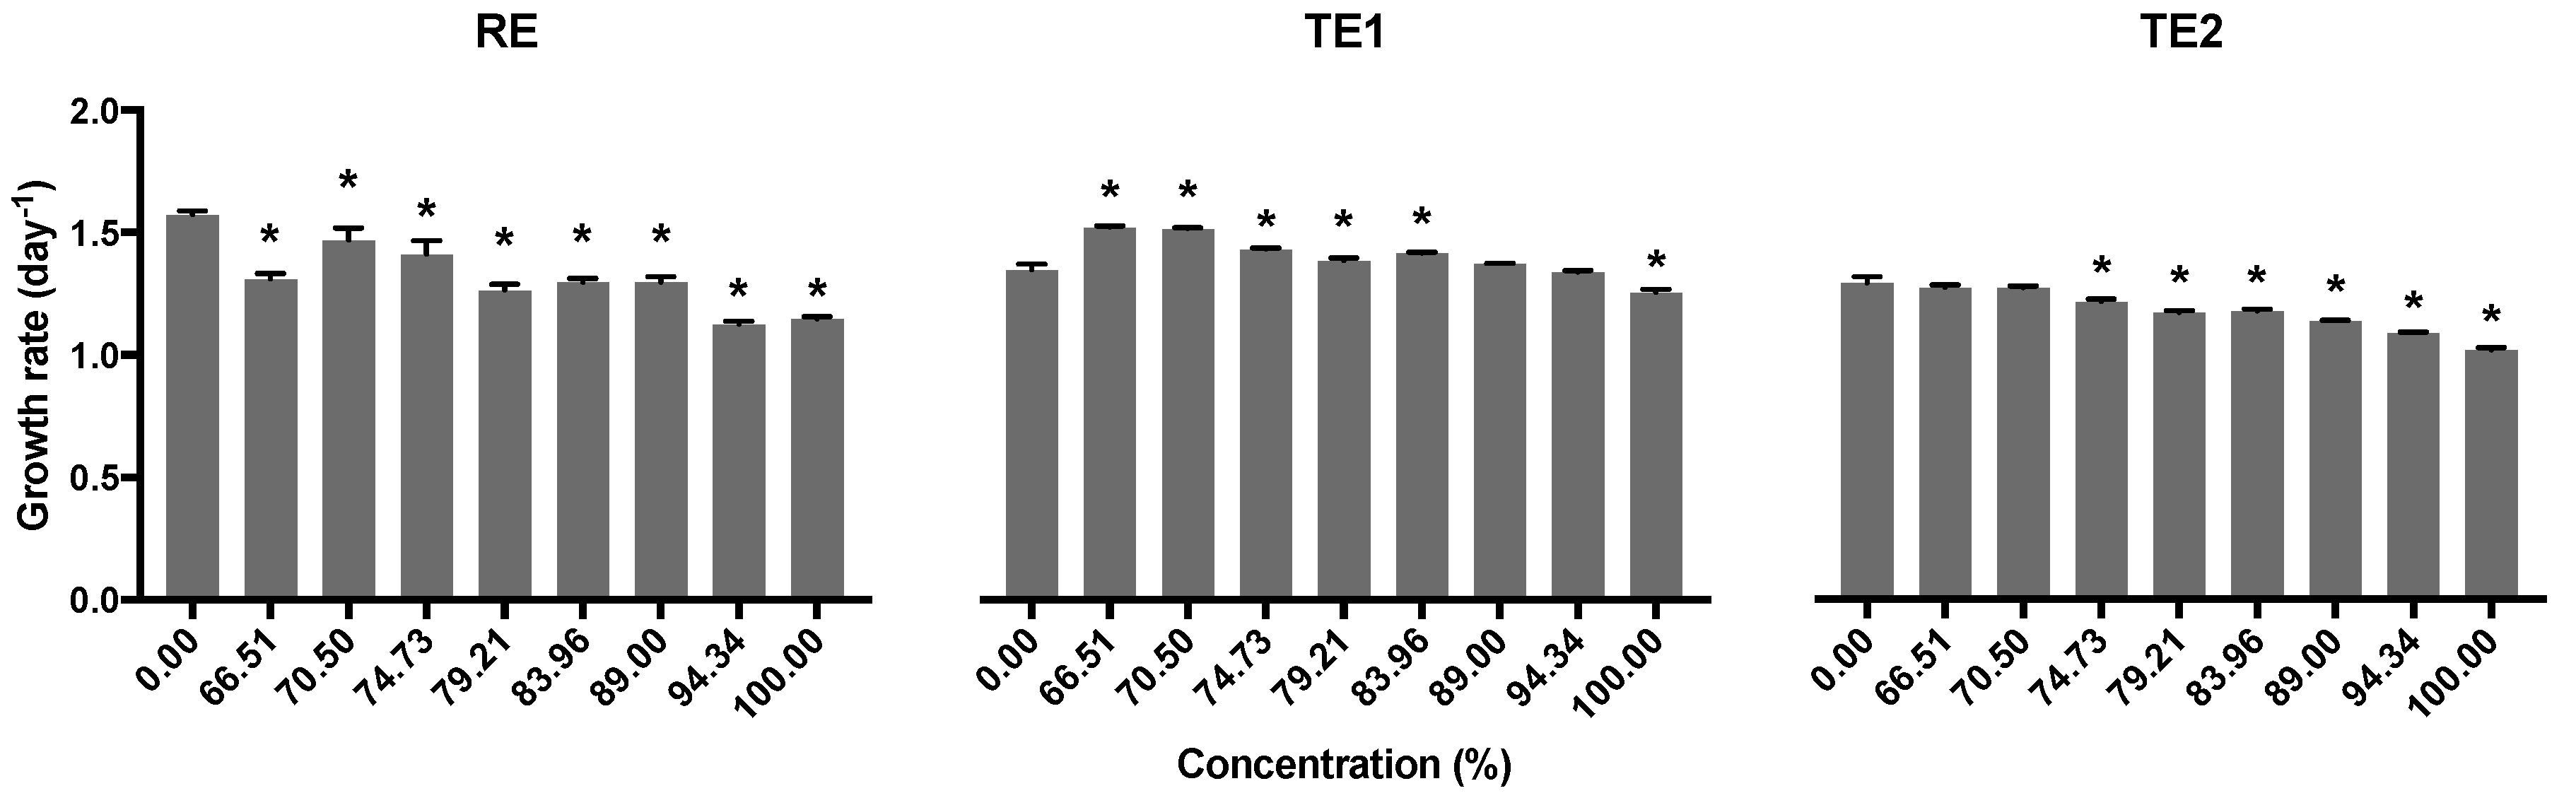
3.3. Growth Inhibition Assay with Raphidocelis subcapitata

The results obtained for the growth inhibition test with R. subcapitata (Figure 1) showed significant differences between the control and the effluent dilutions for the RE (F8,31 = 133.56, p < 0.05), recording an EC20 value of 79.5% (CI95 = 71.5–87.5). For the TE1, significant differences were also recorded (F8,31 = 135.84, p < 0.05); however, at the lowest concentration, a significant stimulation in the growth of the algae was observed (Figure 1), indicating the high potential of this effluent to cause eutrophication in the received medium, especially when diluted, since it minimised the toxic effect of the contaminants present but enhanced the positive role of available the nutrients. In fact, Calabrese [38] states that the stimulation of algal growth can predict the potential of the effluent to eutrophication and emphasises the importance of considering this phenomenon in an ecotoxicological evaluation, giving it the same importance as that given to the inhibitory effects. While the TE2 showed a significant inhibitory effect on the growth of R. subcapitata for concentrations above 74.73% (F8,31 = 156.00, p < 0.05) (Figure 1), with a NOEC, LOEC and EC20 of 70.50%, 74.73% and 98.5% (CI95 = 96.8–100.3), respectively. The inhibitory effects on the growth of R. subcapitata were more pronounced in the RE, followed by TE2, and at last, TE1, whose EC20 value recorded was greater than 100%, probably due to the pH of the RE. However, comparing the toxicity of the RE toward R. subcapitata with the artificially prepared textile effluents (W1, W2, W3 and W4) studied by Tigini et al. [5], the real effluent (RE) presented a much lower toxicity to the algae. For the artificial effluents, the values of EC50 were 18.8% (CI95 = 16.6–21.1), 17.7% (CI95 = 10.8–24.6), 2.2% (CI95 = 1.9–2.5) and 31.7% (CI95 = 23.6–39.7) for the samples W1 (acid bath for wool), W2 (acid bath for leather), W3 (reactive bath for cotton) and W4 (direct bath for cotton), respectively [5]. These artificial effluents, although advantageous at the laboratory level, are not representative of the actual toxicity of textile effluents, since the actual effluents are a complex mixture of chemical compounds that can promote additive, synergistic and antagonistic effects on the aquatic organisms. In addition, the quality of the textile effluent can be variable over time, which is not possible to simulate under laboratory conditions. In the study of Tigini et al. [5], the W3 sample was the most toxic to R. subcapitata, showing the toxicity of the reactive dyes and Na2SO4. Several authors have reported that the dyes are normally less toxic than other components of the textile effluents, such as the surfactants, metals, salts, acids and alkalis [3,39]. However, according to a model for predicting the toxicity of mixtures, the model of concentration addition, tested by Tigini et al. [5], found that in the toxicity test with R. subcapitata, the dyes alone were more toxic than the salt (Na2SO4) alone. Meanwhile, the two combined compounds showed a moderate antagonistic effect. On the contrary, in the other model tested by these authors, the independent action model showed a high synergistic effect between the dye and the salt. In this sense, the reduced toxicity recorded for our samples of treated effluent (TE1 and TE2) compared to RE can result exactly from the removal of several compounds, among which, were the organic dyes.

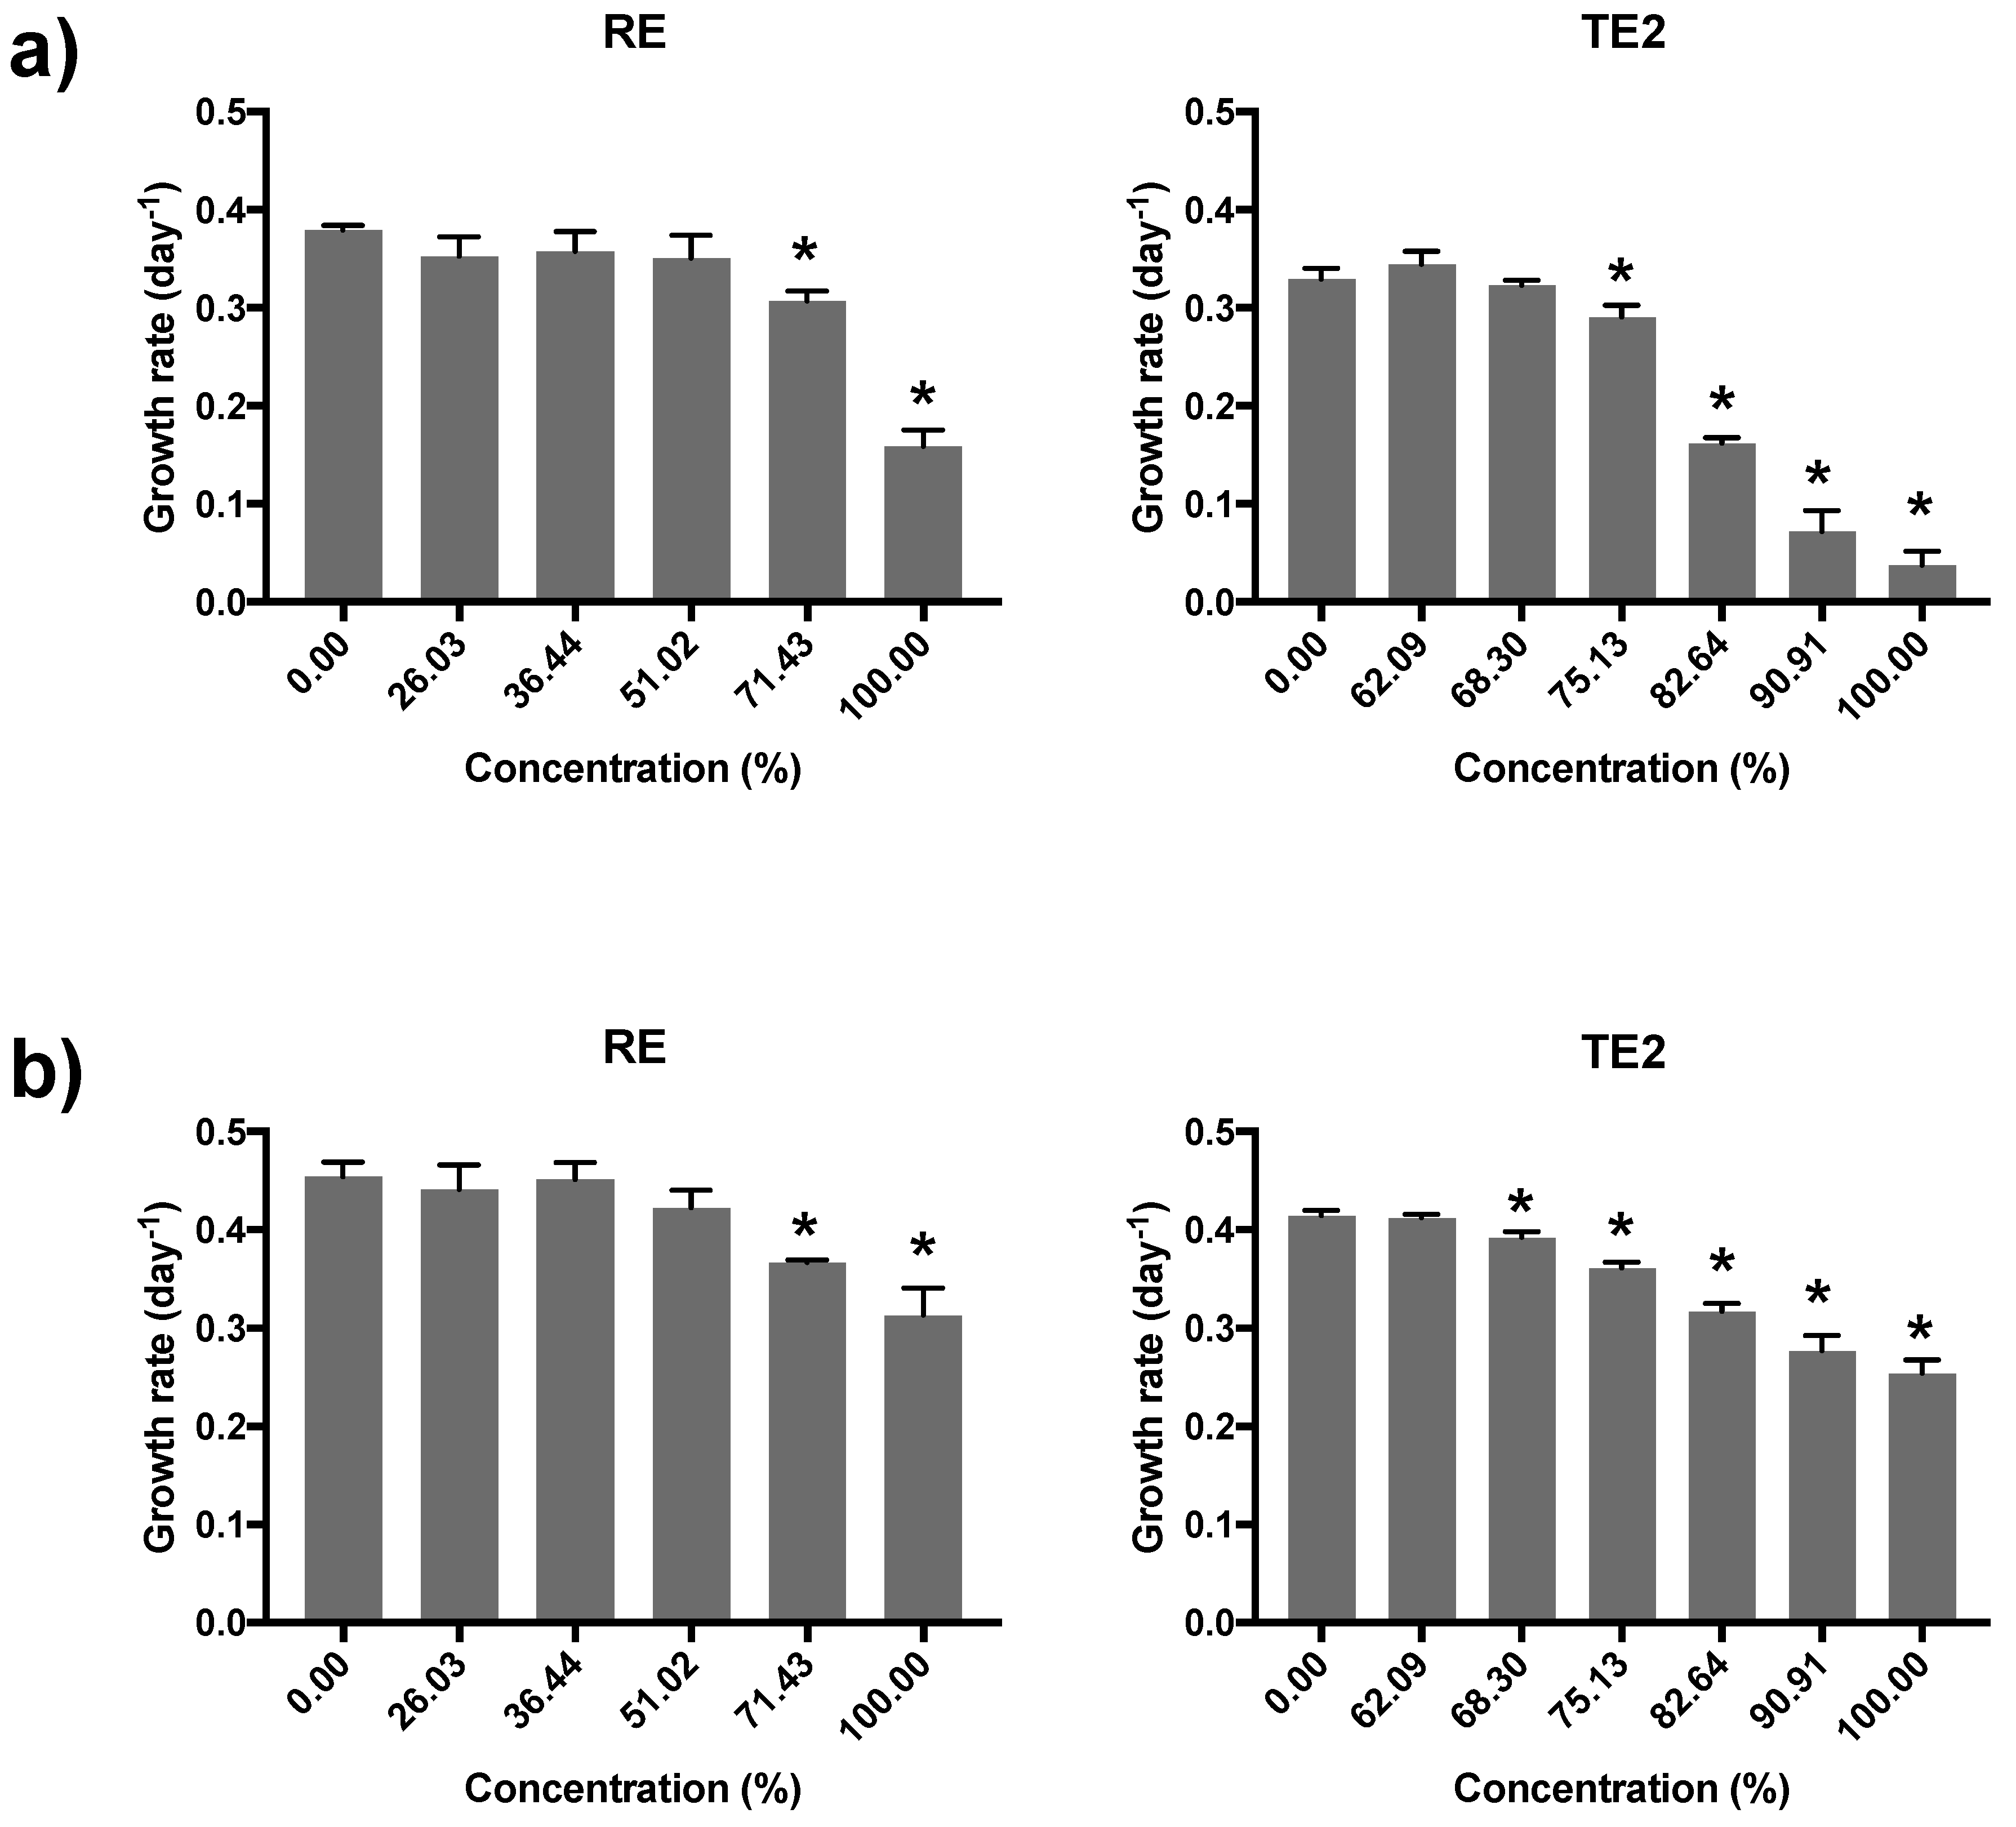
3.4. Growth Inhibition Assay with Lemna minor

The toxicity test with L. minor for the RE was carried out after a pH adjustment to between 6 and 7, since at pH values of 3.07 (initial pH of the effluent), there was a total inhibition of growth and development for all the concentrations tested.
For the RE sample and after the pH adjustment, significant differences in growth rate of L. minor were observed (Figure 2), both for the data based on frond number (F5,17 = 69.76, p < 0.05) and for the dry weight (F5,17 = 25.82, p < 0.05). NOEC and LOEC values of 51.0% and 71.4%, respectively, were recorded for the growth rate based on the frond number and dry weight. Regarding the samples with TE2, the growth rate based on the frond number was also significantly inhibited (F6,20 = 303.25, p < 0.05), with a NOEC and LOEC of 68.3% and 75.1%, respectively (Figure 2a). Regarding the growth rate based on the dry biomass, significant differences between the control and test dilutions were observed (F6,20 = 152.42, p < 0.05) with NOEC and LOEC values of 62.1% and 68.3%, respectively (Figure 2b). The EC50 value based on the number of fronds was higher for the RE (95.73%) than for the TE2 (82.92%), which indicates that the treated effluent was slightly more toxic than the raw effluent for L. minor. A similar result was reported by Sharma et al. [3] in textile effluents from different phases of the textile processing.
Comparing the values obtained in this study with those reported by Tigini et al. [5], it was verified that the real effluent tested in this study was more toxic to the aquatic plant L. minor than the artificial effluent, since the authors could not calculate an EC50 for the artificial effluent. The same was observed in the study of Sharma et al. [3]. The same study also revealed that the toxicity of textile effluents varied with the stage of the manufacturing process where it was generated, with the most hazardous steps being the fixation of dyes, the first wash and the bleaching process [3]. As observed in our study for the samples RE and TE2 (personal observation), the colonies of L. minor exposed to the effluents from the different stages in the study of Sharma et al. [3] showed, in the highest concentrations, fragmentation of the colonies, reduction in size and thickness of the fronds and loss of roots. Besides these effects, Sharma et al. [3] also reported chlorosis in the fronds exposed to the effluent from the sodium silicate process, and accumulation of dyes on the frond and roots.

3.5. Acute Immobilisation Test with Daphnia magna

For the RE samples, a pH adjustment (between 6 and 7) was made for the highest concentrations (66.7% and 100%), such that the effect was due to the effluent composition and not because of the acidity of the sample. The RE was acutely toxic to D. magna, with EC50 ranging from 24.18% (48 h) to 35.49% (24 h).
In contrast, for the TE1, no significant acute effects were observed for D. magna (F7,31 = 1.00, p = 0.455). Verma [4] evaluated the acute toxicity to D. magna for three different textile effluents. The effluent T1 came from an industry that used multiple dyes (disperse dye, acid and basic dyes, reactive dye and indigo dye), the effluent T2 contained reactive and vat dyes, and the effluent T3 contained reactive dyes only. Among the effluent samples studied by Verma [4], the effluent T2 was likely the most similar to our sample (TE1) since it came from a process that also used vat dyes in the dying process. However, no toxic effects to D. magna were recorded for the TE1 sample, while the sample T2 showed an EC50 of 62.97% after 48 h of exposure. The TE1 sample was not toxic, while the RE registered a low EC50; this suggests that the treatment performed by the wastewater treatment plant of the industry was at least efficient in removing the acute toxicity to D. magna. Villegas-Navarro et al. [40] also tested the toxicity to D. magna of treated and untreated textile effluents from different industries, and although they recorded toxicity in all the samples, the treatment plant of the corresponding industries was able to improve the quality of the effluents, reducing their toxicity.

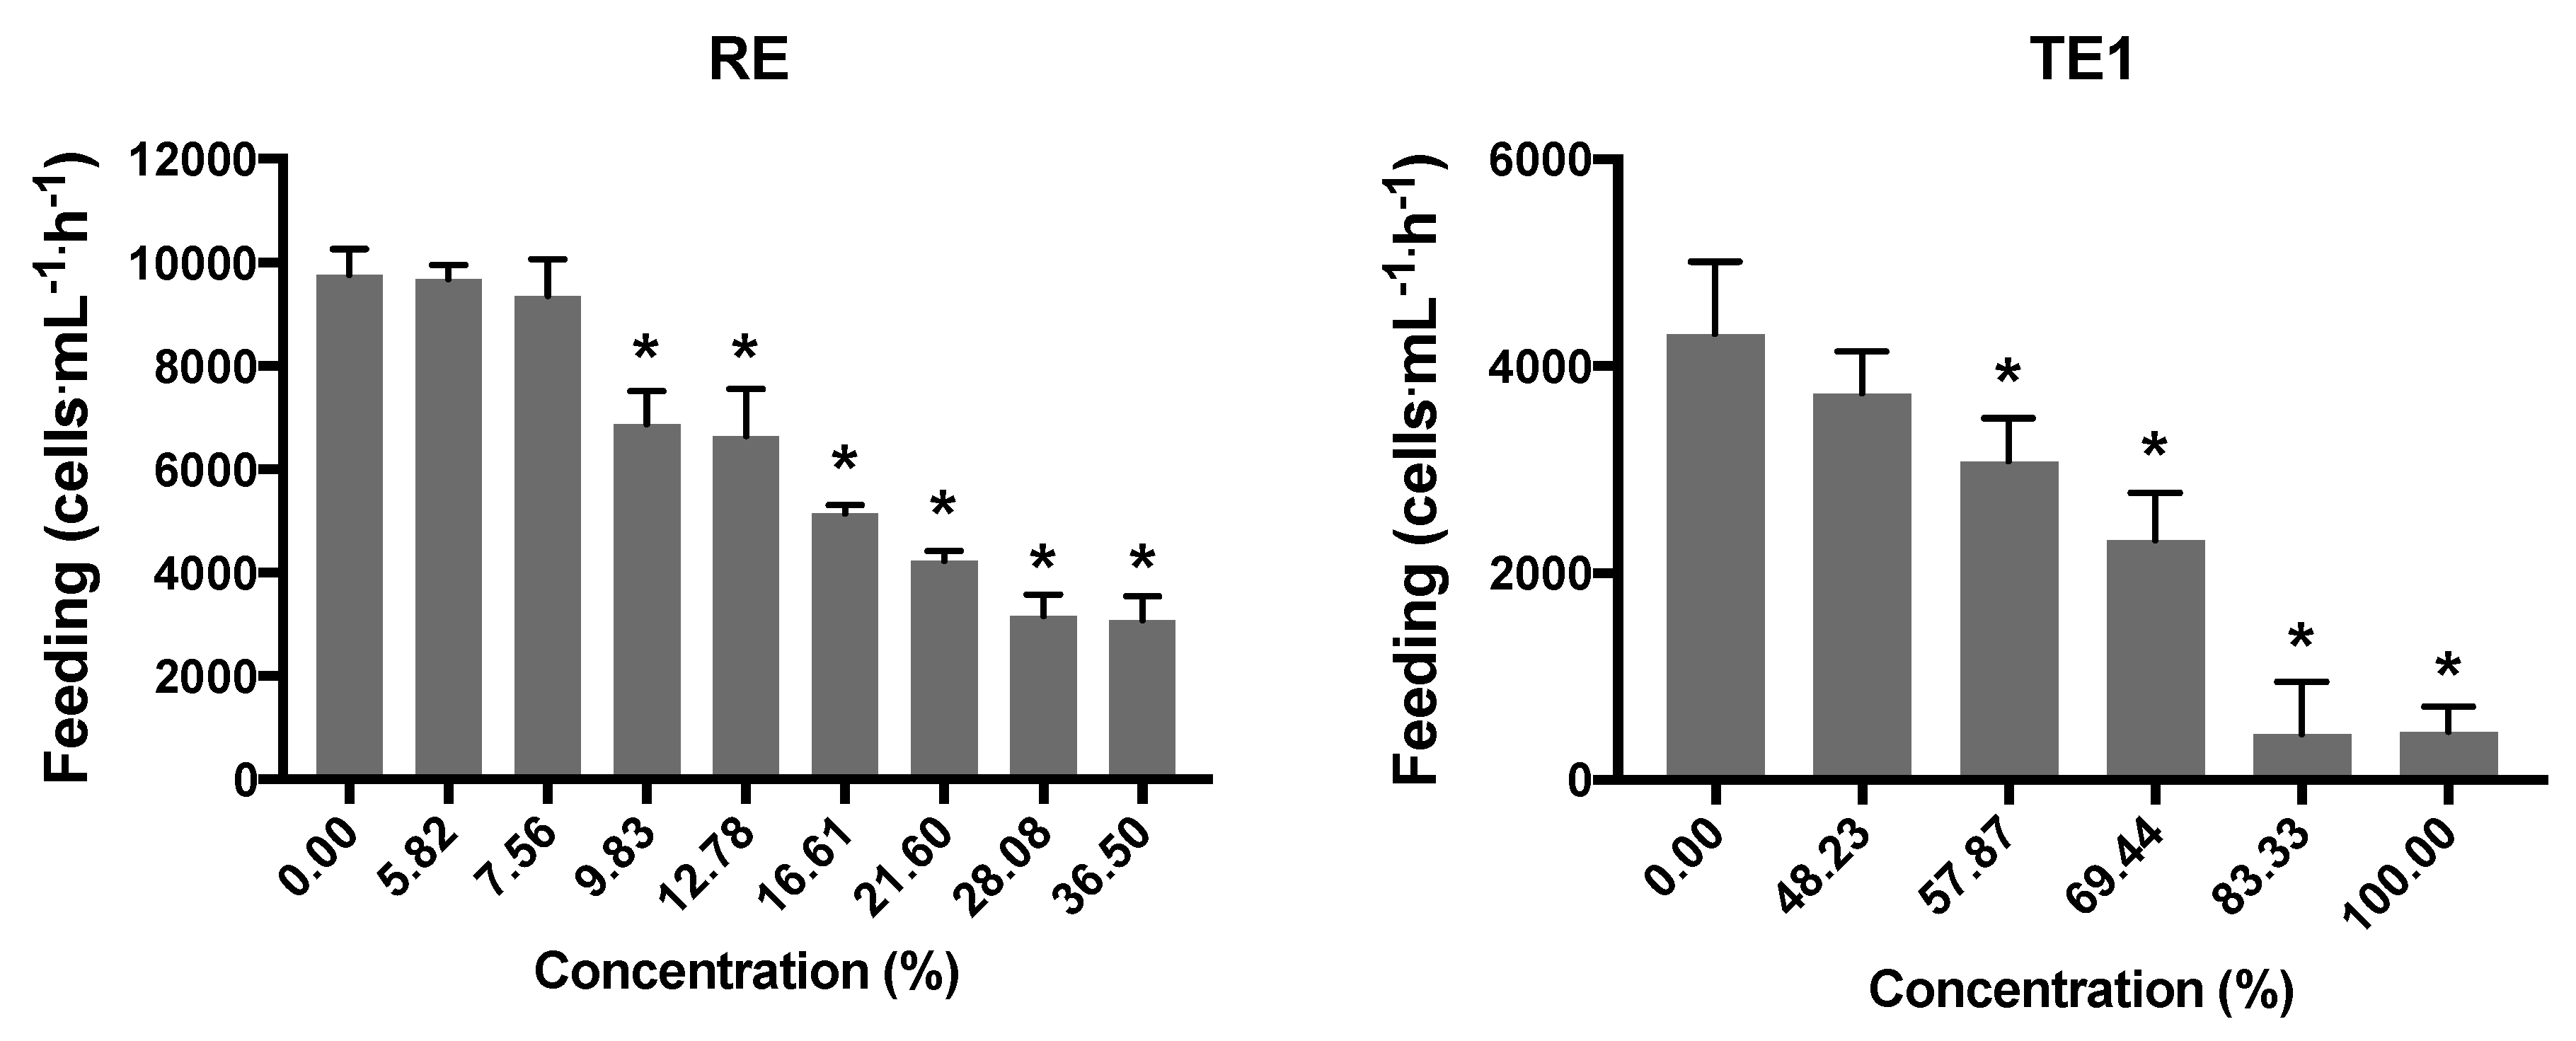
3.6. Feeding Inhibition Assay with D. magna

Regarding the postexposure feeding test, it is possible to observe in Figure 3 that there was a significant reduction in the feeding rate of D. magna with the increase of concentration of RE (F8,35 = 105.65, p < 0.05), with EC50, NOEC and LOEC values of 18.25%, 7.56% and 9.83%, respectively. Significant differences were also recorded for the TE1 sample (F5,23 = 48.05, p < 0.05), recording an EC50 of 68.38%, a NOEC of 48.23% and a LOEC of 57.87%. Once more, the RE sample was more toxic than TE1, indicating that the treatment performed by the company reduced the sublethal toxicity of the effluent but did not eliminate it completely. This test in particular demonstrated that both samples, the raw and the treated effluent, pose serious risks to the receiving medium since they can induce sublethal effects, even at low concentrations, which may have long term effects on the aquatic populations.

3.7. Comparison between the Ecotoxicological Assays

Table 4 present the toxicity results (EC50, EC20 and TU) of all tests performed. Comparing the raw effluent (RE) with the treated effluents (TE1 and TE2), it seems that the treated effluents presented a lower toxicity for all the species and for almost all the parameters assessed, showing some effectiveness of the treatment system of the textile industry. The feeding rate of D. magna was the most sensitive parameter to the textile effluent. Barata et al. [41] also found that this sublethal parameter was the most sensitive compared with the existing standardised acute tests (studying bacteria bioluminescence, algae growth and D. magna) when assessing the toxicity of industrial effluents. However, some authors underlined the importance of considering the colour of the effluent as a inhibiting factor on the growth of algae due to physical shading, which can be reduced via dilution but not completely eliminated [5,42,43]. In this context, it may be useful to express the toxicity not only in effluent dilutions, but also in colour units, and also the use of different organisms to correctly assess the toxicity of coloured wastewaters.
Although the ecotoxicological assessment of the textile effluent samples is an important tool toward understanding the main effects of these types of effluents in the aquatic compartment, it is not possible to identify which specific chemical compounds cause the toxicity due to the complex mixture of the sample. Galassi and Benfenati [39] evaluated the acute toxicity of a whole sample of textile effluent and their fractions on D. magna, trying to understand which compounds are toxic. For that purpose, these authors used the solid-phase extraction method (SPE) to extract the organic chemicals from the sample, followed by preparative high performance liquid chromatography (HPLC) to fractionate them according to their hydrophobicity. The textile effluent was fractionated using HPLC into five fractions and the authors found that the higher percentage of immobilisation of D magna after 48 h (100%) was for fraction 5, which was the most hydrophobic fraction. Meanwhile, for the fractions 1, 2, 3 and 4, they recorded values of 0, 10, 10 and 30%, respectively, after 48 h. The compounds of the fraction 5 responsible for the toxicity were bis(2-ethylhexyl) phthalate, 4-nonylphenol, dibutyl phthalate and diethyl phthalate [39]. In fact, the compounds diethyl phthalate and 4-nonylphenol, were also present in our textile samples (the raw and the treated effluent) and were probably the main compounds responsible for the toxicity recorded. For the other two compounds, the bis(2-ethylhexyl) phthalate and dibutyl phthalate, although they were not present in our samples, there were other compounds from the class of phthalates which could also be responsible for toxic effects. Regarding the toxicity of the fraction 5 alone and the reconstructed mixture (with all the fractions) tested by Galassi and Benfenati [39], the difference between them was not significant.

4. Conclusions

The results of the ecotoxicological tests confirmed that the raw effluent (RE) was extremely toxic; however, the treatment implemented by the textile industry clearly reduced the toxicity of the samples, although there was still a level of sublethal toxicity to D. magna. In addition to the sublethal toxicity, it can also maintain the eutrophication potential, as observed for the TE1 sample at the lowest concentrations. This motivate the need for an “effectiveness of the treatment” variable, which requires a more detailed assessment to understand which compounds cause the toxicity.
The present results also emphasised the importance of the chemistry evaluation and the compliance with environmental protection laws and legal limits for wastewater discharges. However, this assessment alone is not enough because it does not provide enough information about the effects of pollutants on organisms in the ecosystem. Thus, the importance of including regulations regarding a battery of bioassays with different organisms is of the utmost importance since these effluents are complex mixtures and only biological species can allow the complete evaluation of their actual hazard to the aquatic systems. Presently, many kits are available for these assays, which makes these evaluations possible on a routine basis.

Author Contributions

Conceptualisation, I.L. and R.P.; methodology, V.N. and I.L.; formal analysis, A.M.C.; effluent chemical analysis, T.R.-S.; writing original draft preparation, A.M.C. and V.N.; review and editing, V.N., I.L., T.R.-S. and R.P.; supervision, I.L. and R.P.; funding acquisition, R.P.

Funding

This research was partially supported by the Strategic Funding of CIIMAR-UP (UID/Multi/04423/2013) through national funds provided by the Foundation for Science and Technology (FCT) and the European Regional Development Fund (ERDF), in the framework of the program PT2020. Financial support to CESAM (Centre for Environmental and Marine Studies) (UID/AMB/50017), from FCT/MEC (Ministry of Education and Science) through national funds (IF/00407/2013/CP1162/CT0023), and co-funding by the FEDER (European Regional Development Fund), within the PT2020 Partnership Agreement and Compete 2020 is acknowledged.

Conflicts of Interest

The authors declare no conflict of interest.

References

  1. Ellouze, E.; Tahri, N.; Amar, R. Ben Enhancement of textile wastewater treatment process using Nanofiltration. Desalination 2012, 286, 16–23. [Google Scholar] [CrossRef]
  2. Eremektar, G.; Selcuk, H.; Meric, S. Investigation of the relation between COD fractions and the toxicity in a textile finishing industry wastewater: Effect of preozonation. Desalination 2007, 211, 314–320. [Google Scholar] [CrossRef]
  3. Sharma, K.P.; Sharma, S.; Sharma, S.; Singh, P.K.; Kumar, S.; Grover, R.; Sharma, P.K. A comparative study on characterization of textile wastewaters (untreated and treated) toxicity by chemical and biological tests. Chemosphere 2007, 69, 48–54. [Google Scholar] [CrossRef]
  4. Verma, Y. Acute toxicity assessment of textile dyes and textile and dye industrial effluents using Daphnia magna bioassay. Toxicol. Ind. Health 2008, 24, 491–500. [Google Scholar] [CrossRef]
  5. Tigini, V.; Giansanti, P.; Mangiavillano, A.; Pannocchia, A.; Varese, G.C. Evaluation of toxicity, genotoxicity and environmental risk of simulated textile and tannery wastewaters with a battery of biotests. Ecotoxicol. Environ. Saf. 2011, 74, 866–873. [Google Scholar] [CrossRef]
  6. Chhabra, M.; Mishra, S.; Sreekrishnan, T.R. Combination of chemical and enzymatic treatment for efficient decolorization/degradation of textile effluent: High operational stability of the continuous process. Biochem. Eng. J. 2015, 93, 17–24. [Google Scholar] [CrossRef]
  7. Mountassir, Y.; Benyaich, A.; Rezrazi, M.; Berçot, P.; Gebrati, L. Wastewater effluent characteristics from Moroccan textile industry. Water Sci. Technol. 2013, 67, 2791–2799. [Google Scholar] [CrossRef]
  8. Hussein, F.H. Photochemical treatments of textile industries wastewater. Asian J. Chem. 2012, 24, 5427–5434. [Google Scholar] [CrossRef]
  9. Zhang, W.; Liu, W.; Zhang, J.; Zhao, H.; Zhang, Y.; Quan, X.; Jin, Y. Characterisation of acute toxicity, genotoxicity and oxidative stress posed by textile effluent on zebrafish. J. Environ. Sci. China 2012, 24, 2019–2027. [Google Scholar] [CrossRef]
  10. Yoo, J.; Ahn, B.; Oh, J.J.; Han, T.; Kim, W.K.; Kim, S.; Jung, J. Identification of toxicity variations in a stream affected by industrial effluents using Daphnia magna and Ulva pertusa. J. Hazard. Mater. 2013, 260, 1042–1049. [Google Scholar] [CrossRef]
  11. Tehrani-Bagha, A.R.; Mahmoodi, N.M.; Menger, F.M. Degradation of a persistent organic dye from colored textile wastewater by ozonation. Desalination 2010, 260, 34–38. [Google Scholar] [CrossRef]
  12. Ghaly, A.E.; Ananthashankar, R.; Alhattab, M.; Ramakrishnan, V. V Production, Characterization and Treatment of Textile Effluents: A Critical Review. J. Chem. Eng. Process Technol. 2014, 5, 1–18. [Google Scholar] [CrossRef]
  13. Sponza, D.T. Toxicity studies in a chemical dye production industry in Turkey. J. Hazard. Mater. 2006, 138, 438–447. [Google Scholar] [CrossRef]
  14. EC Directive 2000/60/EC of the European Parliament and of the Council establishing a framework for Community action in the field of water policy. Off. J. Eur. Communities 2000, L327, 1–73.
  15. EC Decision no 2455/2001/EC of the European Parliament and of the Council of 20 November of 2001 establishing the list of priority substances in the field of water policy and amending Directive 2000/60/EC. Off. J. Eur. Communities 2001, L331, 1–5.
  16. EC Directive 2008/105/EC of the European Parliament and of the Council of 16 December of 2008 on environmental quality standards in the field of water policy, amending and subsequently repealing Council Directives 82/176/EEC, 83/513/EEC, 84/156/EEC, 84/491/E. Off. J. Eur. Communities 2008, L348, 84–97.
  17. Diamond, J.; Altenburger, R.; Coors, A.; Dyer, S.D.; Focazio, M.; Kidd, K.; Koelmans, A.A.; Leung, K.M.Y.; Servos, M.R.; Snape, J.; et al. Use of prospective and retrospective risk assessment methods that simplify chemical mixtures associated with treated domestic wastewater discharges. Environ. Toxicol. Chem. 2018, 37, 690–702. [Google Scholar] [CrossRef] [Green Version]
  18. Maselli, B.D.S.; Luna, L.A.V.; Palmeira, J.D.O.; Tavares, K.P.; Barbosa, S.; Beijo, L.A.; Umbuzeiro, G.A.; Kummrow, F. Ecotoxicity of raw and treated effluents generated by a veterinary pharmaceutical company: A comparison of the sensitivities of different standardized tests. Ecotoxicology 2015, 24, 795–804. [Google Scholar] [CrossRef]
  19. Azur Environmental. Microtox Omnio Manual; Azur Environmental: Carlsbad, CA, USA, 1998. [Google Scholar]
  20. OECD. No. 201, Freshwater alga and cyanobacteria, growth inhibition test. In OECD Guidelines for the Testing of Chemicals; Organization for Economic Cooperation and Development: Paris, France, 2006. [Google Scholar]
  21. Geis, S.; Fleming, K.; Korthals, E.; Searle, G.; Reynolds, L.; Karner, D. Modifications to the algal growth inhibition test for use as a regulatory assay. Environ. Toxicol. Chem. 2000, 19, 36–41. [Google Scholar] [CrossRef]
  22. OECD. No. 221, Lemna sp. Growth inhibition test. In OECD Guidelines for the Testing of Chemicals; Organization for Economic Cooperation and Development: Paris, France, 2006. [Google Scholar]
  23. ASTM. Standard Pratice for Conducting Acute Toxicity Tests with Fishes, Macroinvertebrates and Amphibians; ASTM (American Society for Testing and Materials): Philadelphia, PA, USA, 1980. [Google Scholar]
  24. Baird, D.; Soares, A.; Girling, A.; Barber, I. The long-term maintenance of Daphnia magna Straus for use in ecotoxicity tests: Problems and prospects. In Proceedings of the first European Conference on Ecotoxicology, Lyngby, Denmark, 17–19 October 1988; pp. 144–148. [Google Scholar]
  25. OECD. No. 202, Daphnia sp., acute immobilization test. In OECD Guidelines for the Testing of Chemicals; Organization for Economic Cooperation and Development: Paris, France, 2004. [Google Scholar]
  26. McWilliam, R.; Baird, D.J. Postexposure feeding depression: A new toxicity endpoint for use in laboratory studies with Daphnia magna. Environ. Toxicol. Chem. 2002, 21, 1198–1205. [Google Scholar] [CrossRef]
  27. Finney, D.J. Probit Analysis, 3rd ed.; Cambridge University Press: Cambridge, UK, 1971. [Google Scholar]
  28. INETI. Guia Técnico do Sector téXtil; INETI: Lisboa, Portugal, 2000. [Google Scholar]
  29. WHO. Guidelines for Drinking-Water Quality, 4th ed.; World Health Organization: Geneva, Switzerland, 2011; pp. 1–554. [Google Scholar]
  30. ME Decree-Law 236/98 Portuguese Legislation on Water Quality from the MInistry of Environment. D. Repúb. 1998, 176, 3676–3722.
  31. Pérez, M.; Torrades, F.; Domènech, X.; Peral, J. Fenton and photo-Fenton oxidation of textile effluents. Water Res. 2002, 36, 2703–2710. [Google Scholar] [CrossRef]
  32. Perez, P.; Pulgar, R.; Olea-Serrano, F.; Villalobos, M.; Rivas, A.; Metzler, M.; Pedraza, V.; Olea, N. The estrogenicity of bisphenol A-related diphenylalkanes with various substituents at the central carbon and the hydroxy groups. Environ. Health Perspect. 1998, 106, 167–174. [Google Scholar] [CrossRef] [PubMed]
  33. Castillo, M.; Barceló, D. Analysis of industrial effluents to determine endocrine-disrupting chemicals. TrAC Trends Anal. Chem. 1997, 16, 574–583. [Google Scholar] [CrossRef]
  34. Castillo, M.; Barceló, D. Characterisation of organic pollutants in textile wastewaters and landfill leachate by using toxicity-based fractionation methods followed by liquid and gas chromatography coupled to mass spectrometric detection. Anal. Chim. Acta 2001, 426, 253–264. [Google Scholar] [CrossRef]
  35. Sharma, H.A.; Barber, J.T.; Ensley, H.E.; Polito, M.A. A comparison of the toxicity and metabolism of phenol and chlorinated phenols by Lemna gibba, with special reference to 2,4,5-trichlorophenol. Environ. Toxicol. Chem. 1997, 16, 346–350. [Google Scholar] [CrossRef]
  36. Tišler, T.; Zagorc-Končan, J. Comparative assessment of toxicity of phenol, formaldehyde, and industrial wastewater to aquatic organisms. Water. Air Soil Pollut. 1997, 97, 315–322. [Google Scholar] [CrossRef]
  37. Orvos, D.R.; Versteeg, D.J.; Inauen, J.; Capdevielle, M.; Rothenstein, A.; Cunningham, V. Aquatic toxicity of triclosan. Environ. Toxicol. Chem. 2002, 21, 1338–1349. [Google Scholar] [CrossRef]
  38. Calabrese, E.J. Hormesis: Why it is important to toxicology and toxicologists. Environ. Toxicol. Chem. 2008, 27, 1451–1474. [Google Scholar] [CrossRef]
  39. Galassi, S.; Benfenati, E. Fractionation and toxicity evaluation of waste waters. J. Chromatogr. A 2000, 889, 149–154. [Google Scholar] [CrossRef]
  40. Villegas-Navarro, A.; Romero González, M.C.; Rosas López, E.; Domínguez Aguilar, R.; Sachetin Marçal, W. Evaluation of Daphnia magna as an indicator of toxicity and treatment efficacy of textile wastewaters. Environ. Int. 1999, 25, 619–624. [Google Scholar] [CrossRef]
  41. Barata, C.; Alañon, P.; Gutierrez-Alonso, S.; Riva, M.C.; Fernández, C.; Tarazona, J.V. A Daphnia magna feeding bioassay as a cost effective and ecological relevant sublethal toxicity test for Environmental Risk Assessment of toxic effluents. Sci. Total Environ. 2008, 405, 78–86. [Google Scholar] [CrossRef] [PubMed]
  42. Cleuvers, M.; Ratte, H.T. The importance of light intensity in algal tests with coloured substances. Water Res. 2002, 36, 2173–2178. [Google Scholar] [CrossRef]
  43. Blinova, I. Use of freshwater algae and duckweeds for phytotoxicity testing. Environ. Toxicol. 2004, 19, 425–428. [Google Scholar] [CrossRef] [PubMed]
Figure 1. Average growth rate (day−1) of R. subcapitata exposed to different dilutions of the effluent. Error bars represent the standard deviation of the mean (n = 3); asterisks indicate statistically significant differences from the control (Dunnett’s test p < 0.05).
Applsci 09 03804 g001
Figure 2. Average growth rate (day−1) of L. minor based on the frond number (a) and the dry biomass (b) exposed to different dilutions of the effluent. Error bars represent the standard deviation of the mean (n = 3); asterisks indicate statistically significant differences from the control (Dunnett’s test p < 0.05).
Applsci 09 03804 g002
Figure 3. Average feeding rate (cells∙mL−1∙h−1) of D. magna after exposure to different concentrations of raw effluent (RE) or treated effluent 1 (TE1) compared to the control. Error bars represent the standard deviation of the mean (n = 4); asterisks indicate statistically significant differences from the control (Dunnett´s test p < 0.05).
Applsci 09 03804 g003
Table 1. Characterisation of the effluent used in the toxicity tests.
Raw Effluent (RE)Treated Effluent 1 (TE1)Treated Effluent 2 (TE2)
Apparent ColourGreyGreenGreen
Colour (PtCo)560156198
pH3.337.366.76
TDS (ppm)121515392322
Conductivity (μS cm−1)234330854270
Table 2. Chemical composition found using GC-MS in the textile effluent RE and TE1 samples.
CompoundRaw Effluent (RE) (μg L−1)Treated Effluent 1 (TE1) (μg L−1)Removal Percentage (%)
Phenol0.030.0323.08
Hexamine0.040.0324.49
Ethyl-tetramethyl-heptane0.020.0129.29
2,6-Tert-butyl-quinone1.621.2025.64
Tetramethyl-dodecane0.020.0129.27
Ionol (2,6-di-tert-butyl-4 methyl-phenol)0.020.0128.21
Diethylphtalate0.090.0721.67
Nonylphenol0.360.2726.95
3,5-Di-tert-butyl-4-hydroxi-benzoic acid0.030.0230.65
2,6-Di-tert-butyl-4-ethyl-phenol1.691.2326.89
2,6-Di-tert-butyl-4-methoxymethyl-phenol0.020.0125.64
Dimethyl-carboxymethylexyl-phtalate0.260.2024.35
Octadecane0.110.0829.40
Butyl-2-ethylhexyl-phtalate0.160.1128.29
Benzoic acid phenyl ester0.310.2521.62
2,2-dimethyl-2-phenyl-acetophenone0.020.0127.04
Butyl-octyl-phtalate0.210.1530.79
4,4′-Methylenebis-phenol0.020.0226.83
Benzil-quinoline0.020.0125.64
Docosane0.020.0126.70
Tributyl-O-acetylcitrate0.080.0624.43
Tricosane0.030.0227.98
7-(Diethylamino)-4-methyl-2H-1-benzopyran-2-one0.130.0931.92
Benzyl-butyl-phtalate0.030.0223.08
Triphenyl-phosphonic acid0.250.1924.31
Diisooctylphtalate0.210.1529.58
Hexacosane0.260.1925.85
Triacontane0.660.4729.41
Dotriacontane0.390.2828.31
Table 3. Values of EC50 and EC20 for bioluminescence inhibition of A. fischeri, expressed in effluent percentage, and the corresponding 95% confidence intervals (CI95) for the treated effluent 1 (TE1) and the raw effluent (RE).
EC50EC20Reference
RE7.18% (0.42–100)2.92% (0.152–56)Present study
TE1HE < 20% (NT)HE < 20% (NT)
W136.40% (29.4–45.5)-[5]
W2HE < 50% (NT)-
W1—artificial effluent produced during a wool dyeing process; W2—artificial effluent produced during a leather dyeing process; HE—aighest effect (percentage of bioluminescence inhibition); NT—not toxic.
Table 4. Values of TU (toxic units), EC50 and EC20, with 95% confidence limits inside brackets, for all tests performed with the treated effluent samples (TE1 and TE2) and the raw effluent sample (RE).
RETE1TE2
EC50 (%)EC20 (%)TUEC50 (%)EC20 (%)TUEC50 (%)EC20 (%)TU
A. fischeri7.2 (0.4–100.0)2.92 (0.152–56)13.9NTNT<1---
R. subcapitataNT79.5 (71.5–87.5)<1NTNT<1NT98.5 (96.8–100.3)<1
L. minor (n° of fronds)95.7 (91.8–99.6)74.9 (69.2–80.7)1.04---82.9 (81.7–84.1)75.5 (73.6–77.4)1.22
L. minor (dry biomass)NT76.8 (65.8–87.8)<1---NT80.4 (76.3–84.6)<1
D. magna (immobilisation)24.2 (22.2–26.4)-4.14NT-<1---
D. magna (feeding)18.2 (16.0–20.5)8.3 (6.4–10.2)5.4868.4 (63.8–73.0)56.1 (49.6–62.6)1.46---

