The Role of Advanced Manufacturing Technologies in Production Process Performance: A Causal Model

 , , ,
, , , 
Abstract
:Featured Application
Abstract

1. Introduction
2. Literature Review and Hypotheses
3. Materials and Methods
3.1. Questionnaire Development
3.2. Questionnaire Application
3.3. Database Registation and Debugging
- The standard deviation for each of the questionnaires was estimated; therefore, if it was under 0.50, that questionnaire was not considered, because there was minimal commitment from the respondent.
- The lost values for each of the questionnaires were identified; those that have more than 10% of lost values were not considered, otherwise, they were replaced by the median.
- Extreme values were identified and replaced by the median.
3.4. Questionnaire Validation
3.5. Structural Equation Model
- Average path coefficient (APC) acceptable if p < 0.05
- Average R-squared (ARS) acceptable if p < 0.05
- Average adjusted R-squared (AARS) acceptable if p < 0.05
- Average block VIF (AVIF) acceptable if ≤5, ideally ≤3.3
- Average full collinearity VIF (AFVIF) acceptable if ≤5, ideally ≤3.3
- Tenenhaus Goodness of Fit (GoF) small ≥ 0.1, medium ≥ 0.25, large ≥ 0.36
3.6. Direct Effects, Indirect Effects, Total Effects, and Size Effects
3.7. Sensitivity Analysis
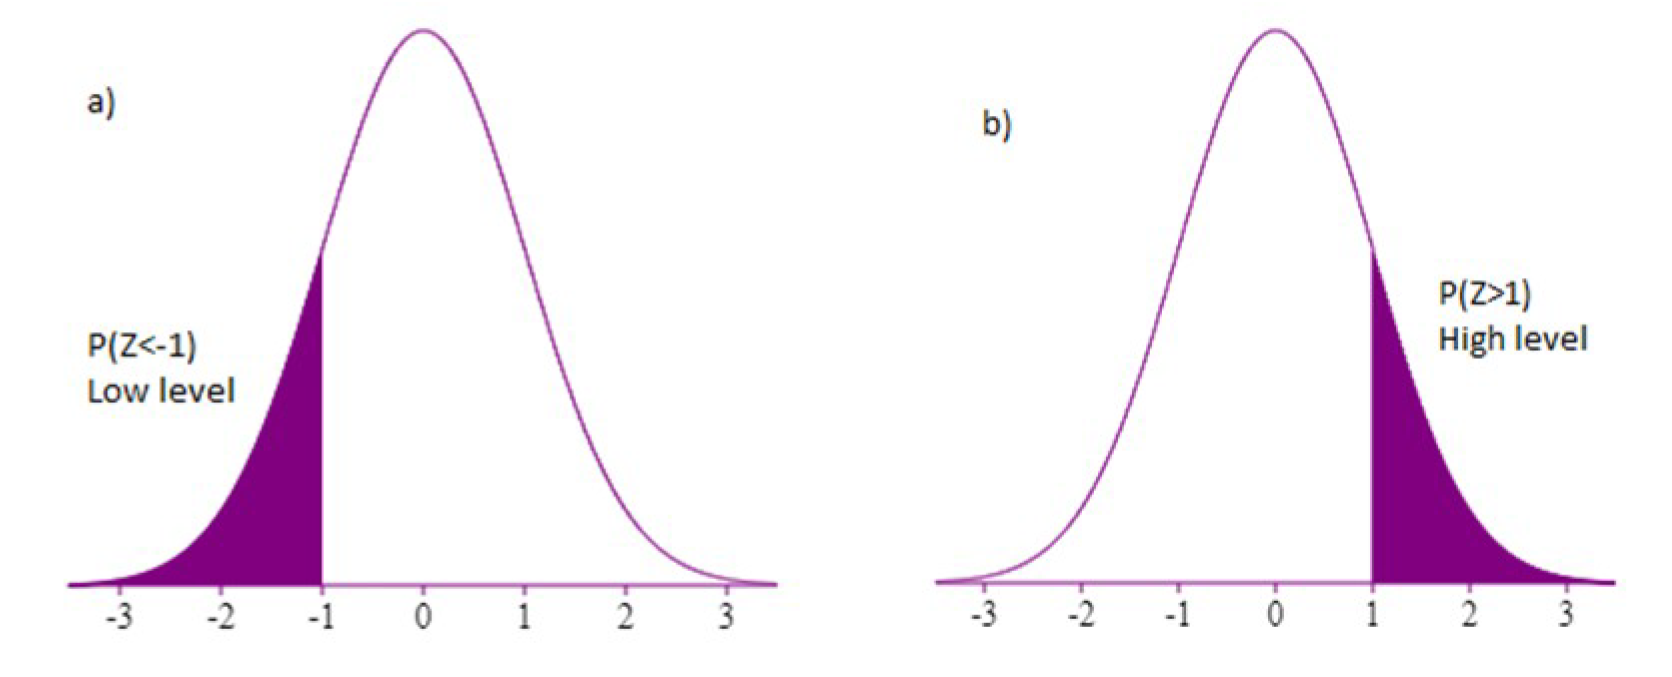
- The probability of finding independently the latent variables at their high (Z > 1) and low (Z < −1) levels without any interaction among them.
- The probability of finding the two variables (independent and dependent) of a hypothesis in the following stages, either jointly (represented by “&”) or conditionally (represented by “If”). The combinations are:
- For joint (&) P (Zi > 1) and P (Zd > 1), and for conditional probability (if) P (Zi > 1)|P (Zd > 1)
- For joint (&) P (Zi > 1) and P (Zd < −1), and for conditional probability (if) P (Zi > 1)|P (Zd < −1)
- For joint (&) P (Zi < −1) and P (Zd > 1), and for conditional probability (if) P (Zi < −1)|P (Zd > 1)
- For joint (&) P (Zi < −1) and P (Zd < −1), and for conditional probability (if) P (Zi < −1)|P (Zd < −1)
4. Results
4.1. Analysis of the Sample
4.2. Questionnaire Validation
4.3. Structural Equation Model
4.3.1. Direct Effects
4.3.2. Indirect Effects
4.3.3. Total Effects
4.3.4. Sensitivity Analysis
5. Discussion, Conclusions and Industrial Implications
5.1. The Most Important Effects and Their Industrial Implications
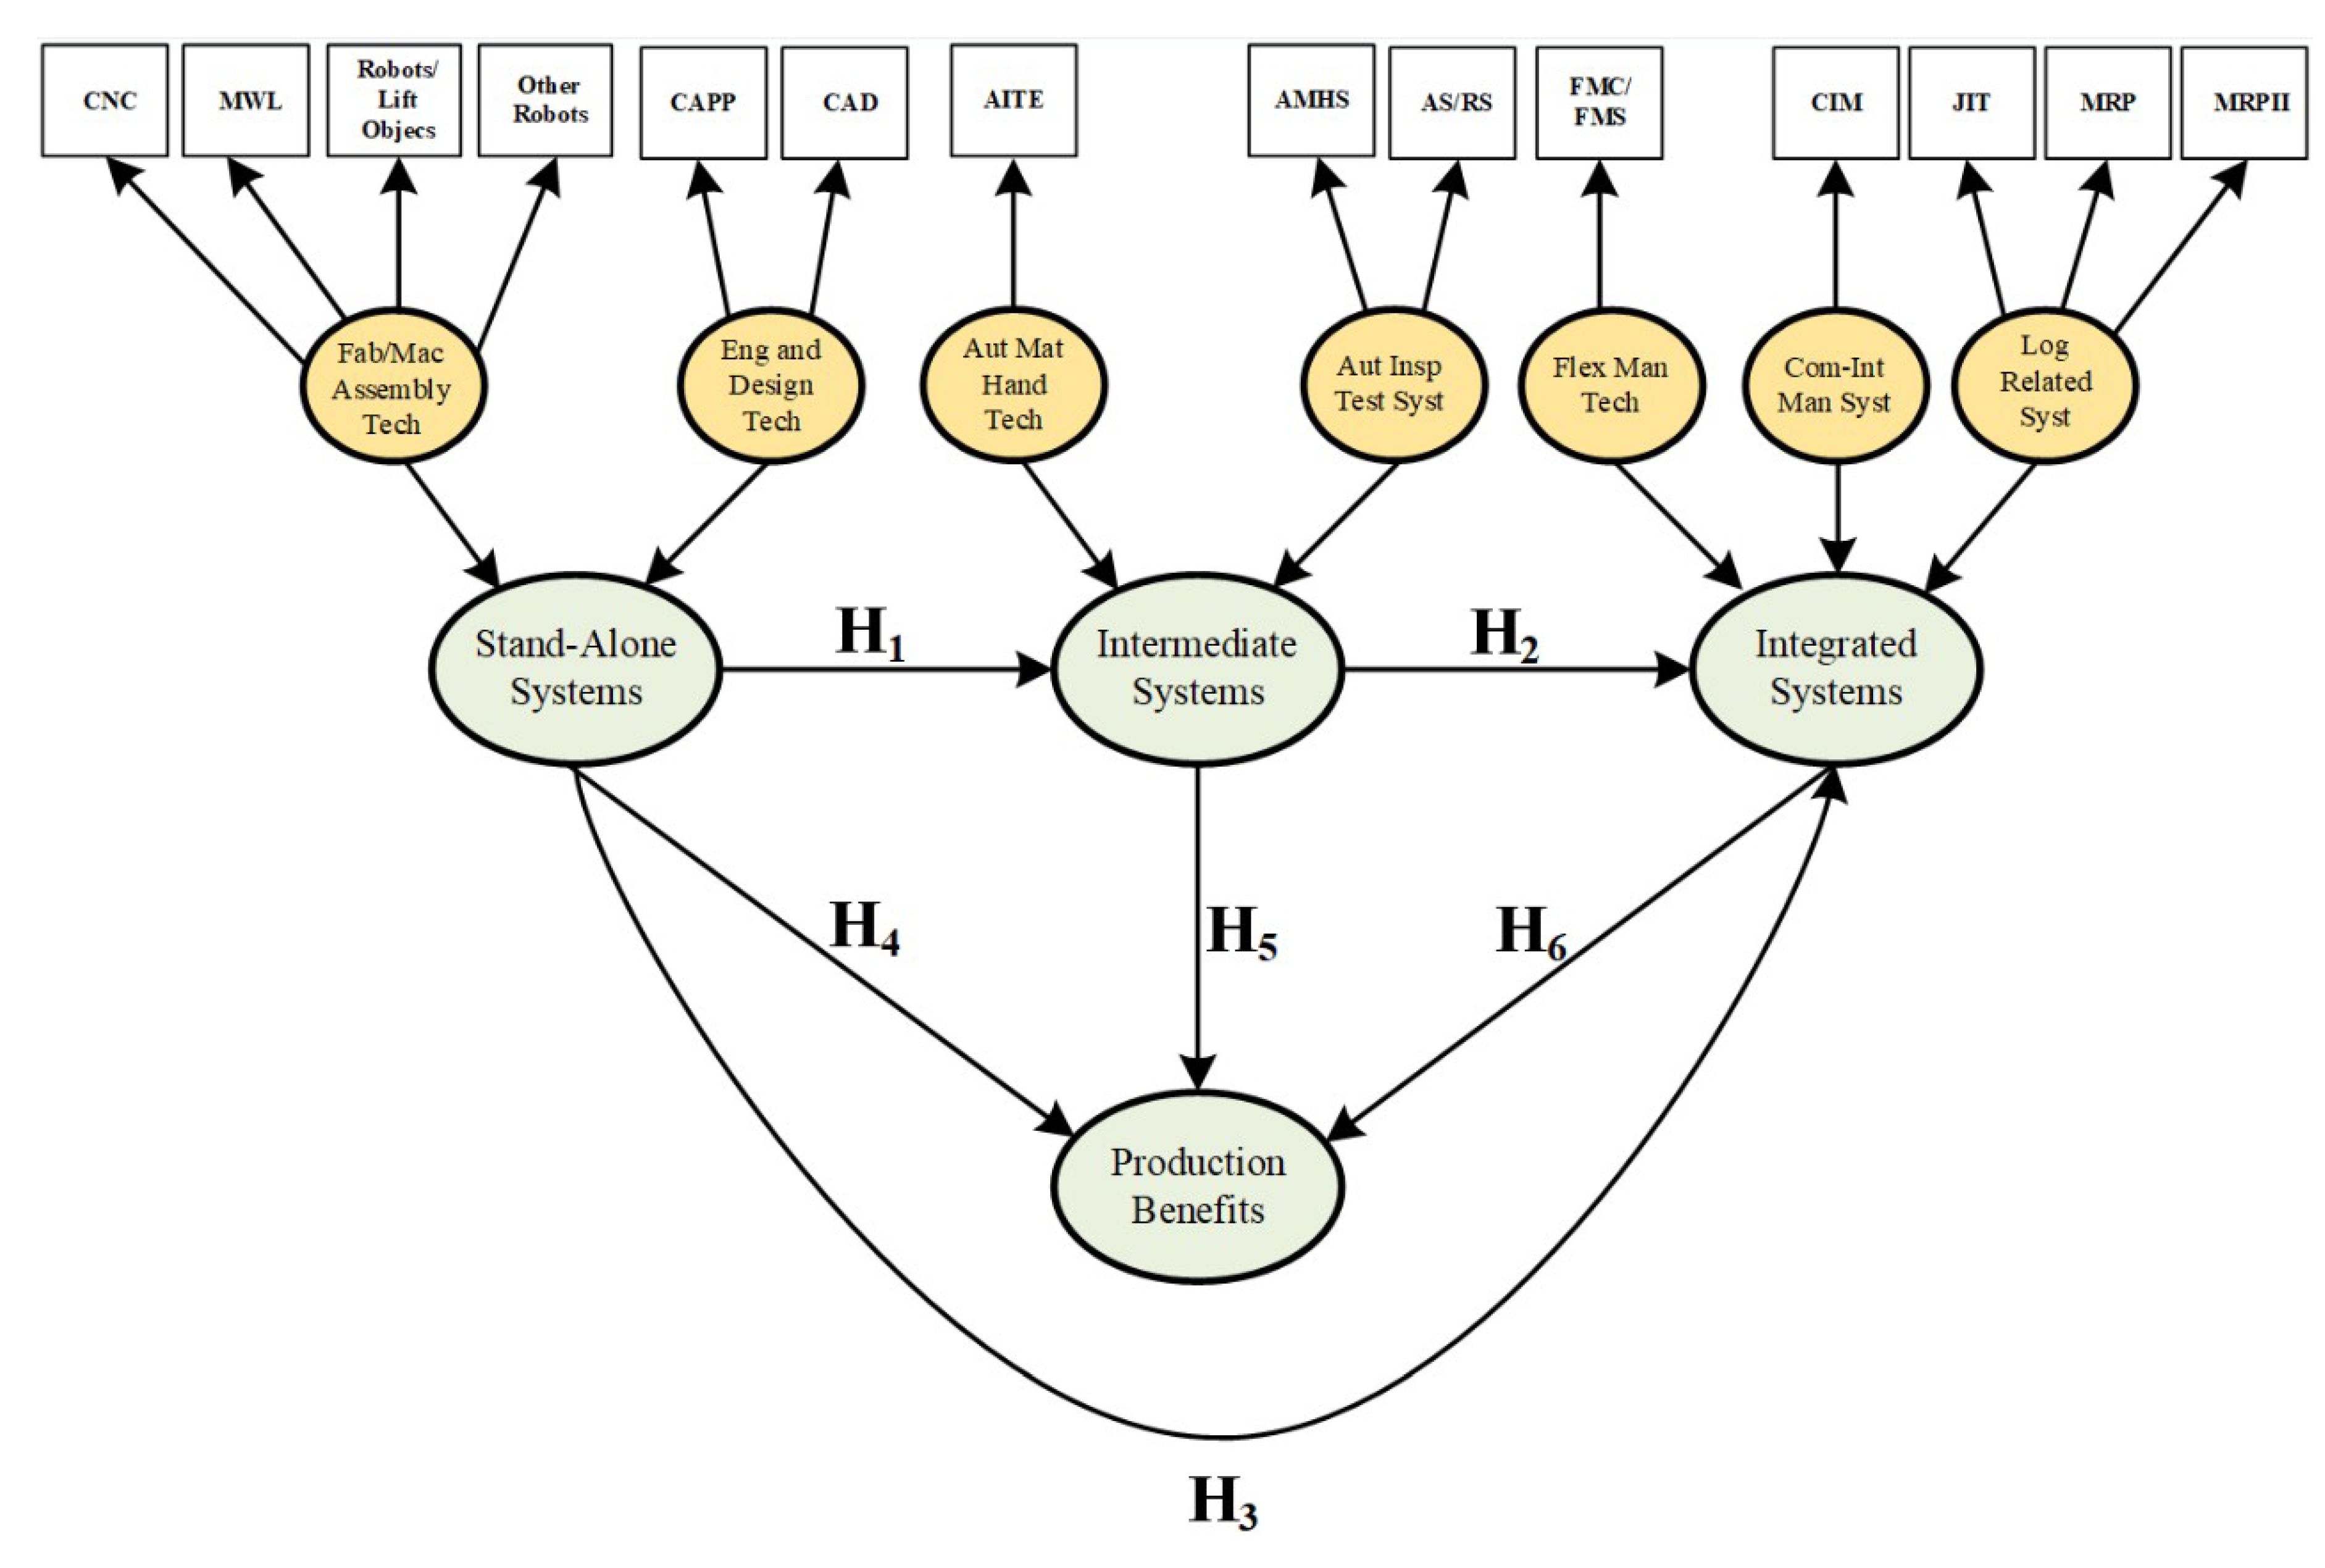
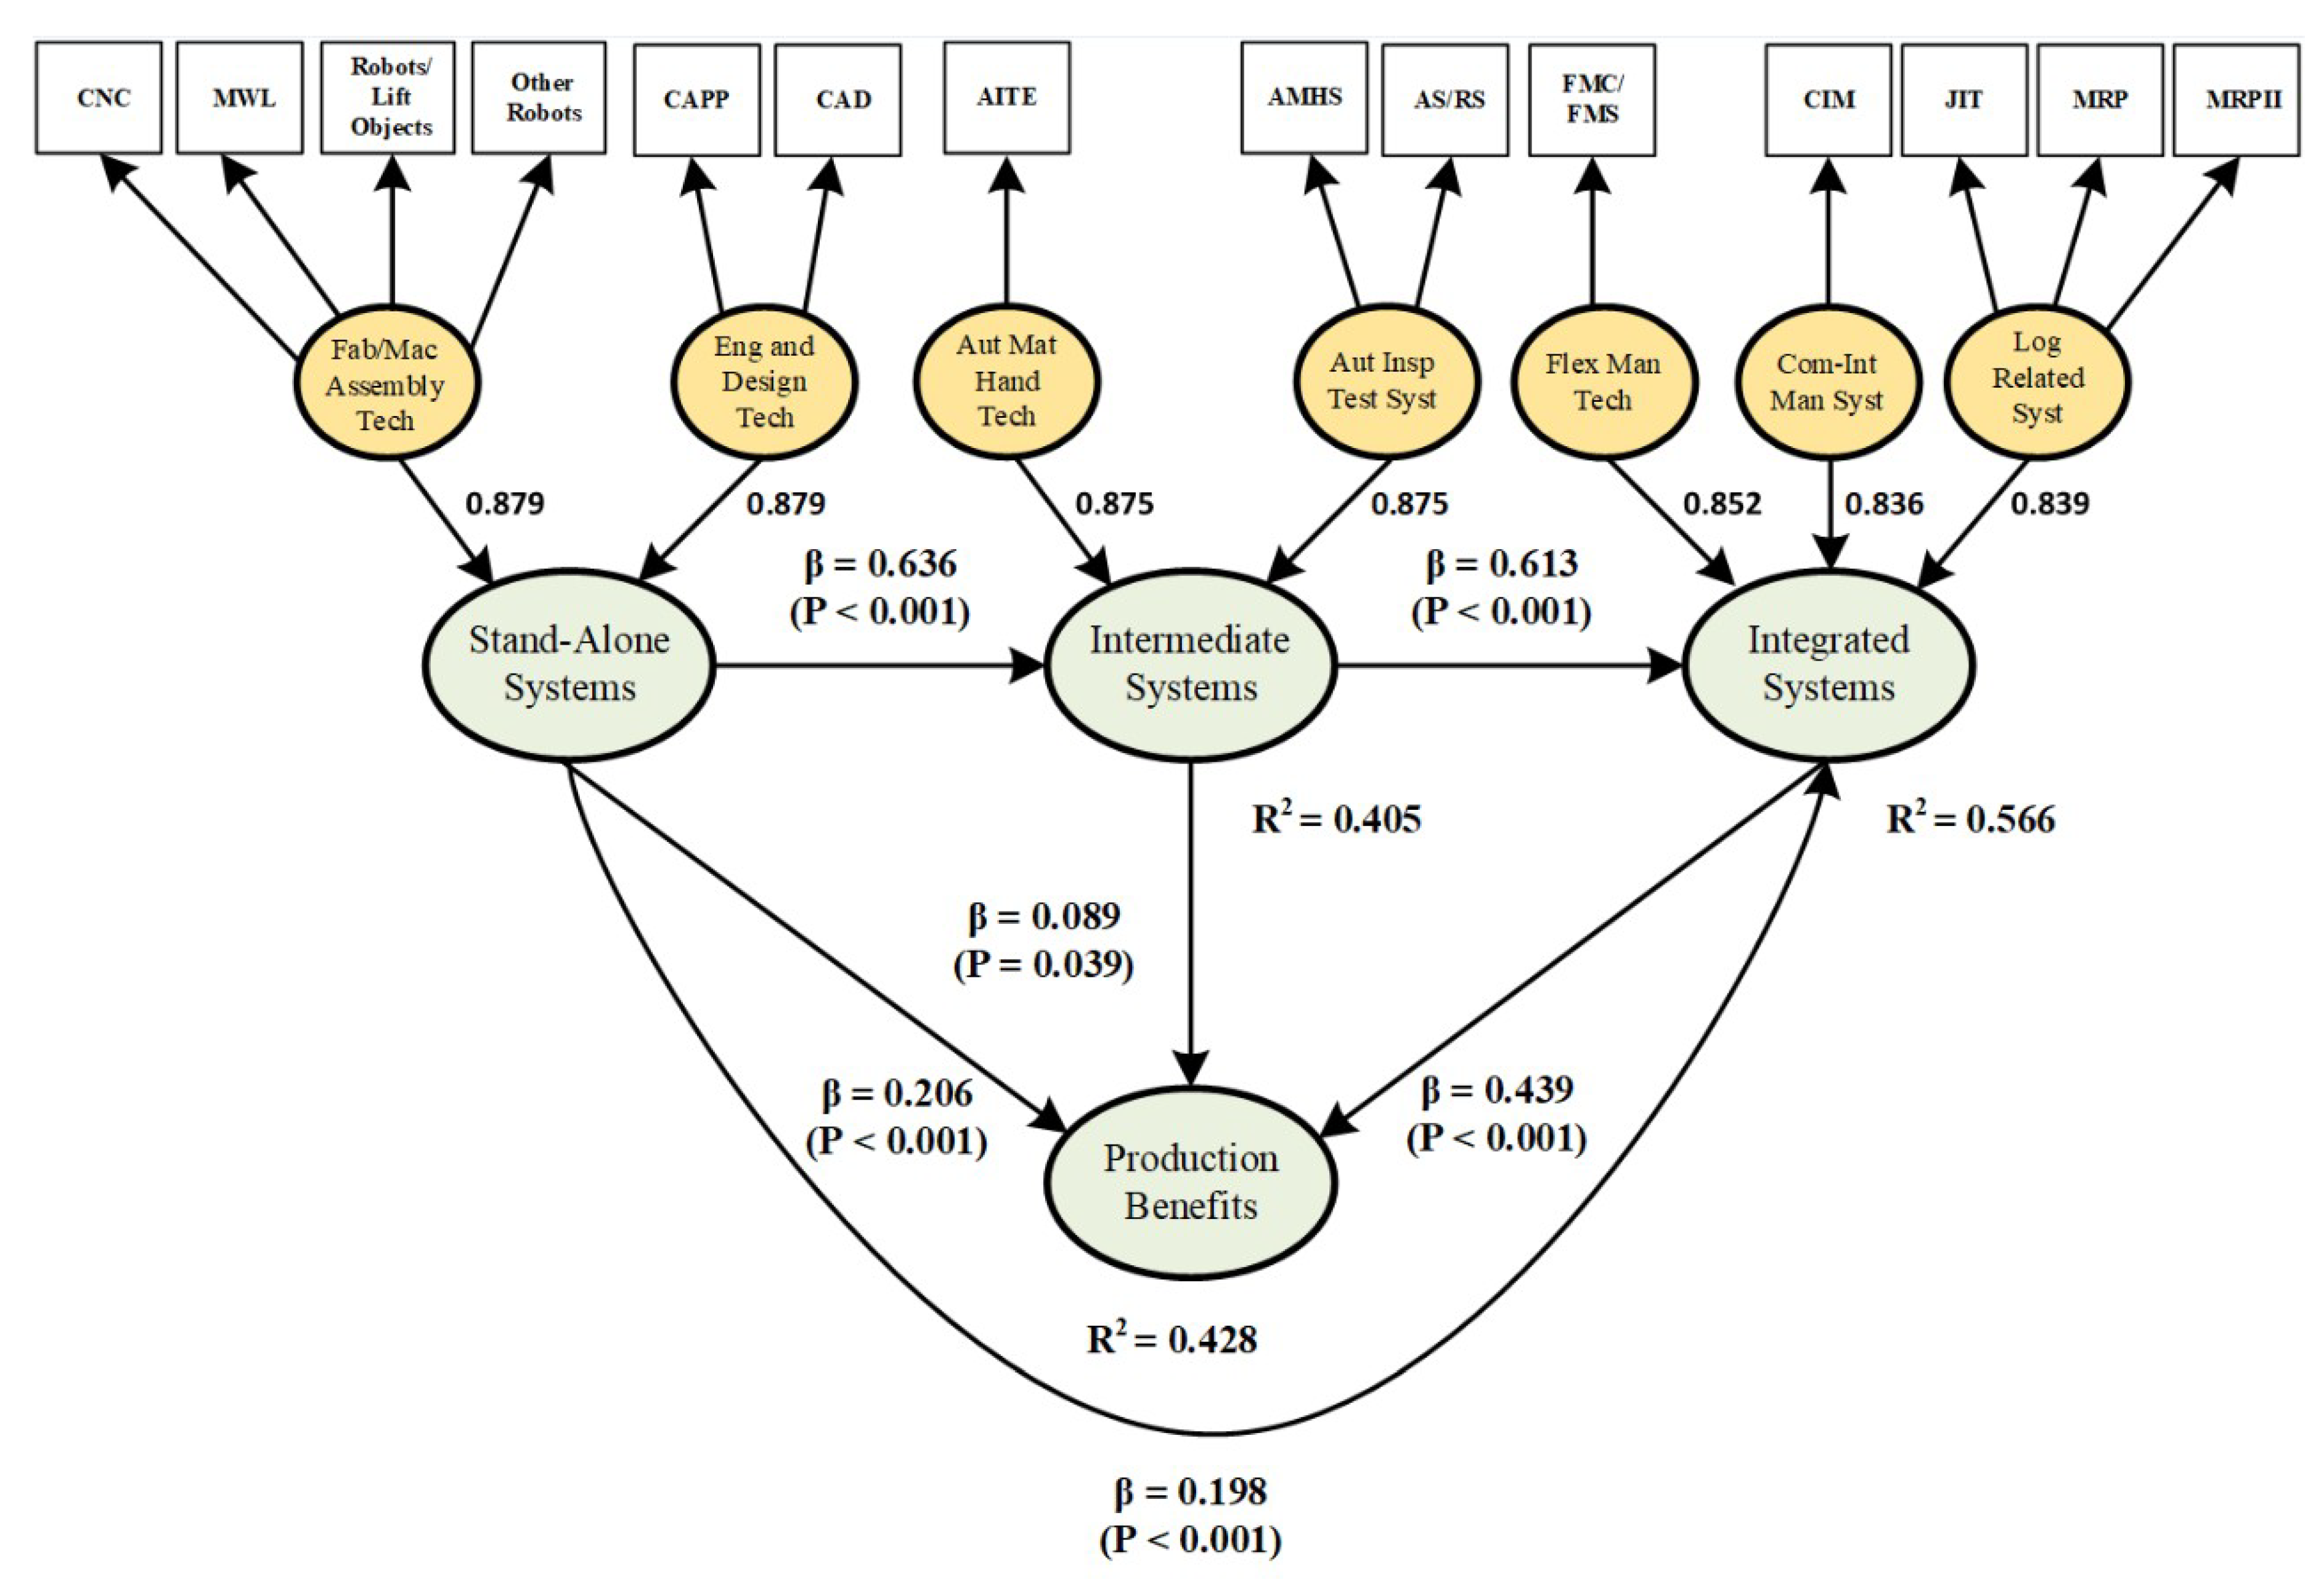
- The largest direct effect between the latent variables is from Stand-Alone Systems on Intermediate Systems with a value of 0.636, which indicates that having an appropriate implementation of technologies, such as CAD, CAPP, CNC, and MWL will ease the implementation of automated material handling and inspection, as well as testing systems, consequently. This finding is essential for managers, because it indicates that Stand-Alone Systems support the Intermediate Systems implementation that have a higher automation and integration level, taking advantage of the experience obtained by operators, as is indicated by Alimohammadlou and Eslamloo [73].
- The second biggest direct effect is between Intermediate Systems and Integrated Systems with β = 0.613, which indicates that technologies as AS/RS, AMHS, and AITE will support the FMC/FMS, CIM, JIT, MRP, and MRP II. This finding is common sense because they are related to material flow or production organization. For instance, it is reported that AS/RS and AMHS facilitate JIT, because they support the material flow [62,74].
- In the same way, Stand-Alone Systems are those that have the greatest total effect on the Production Benefits (0.521); as a result, their appropriate implementation will improve productivity indexes such as low cost production and processing time. However, with Stand Alone Systems managers can also obtain better quality, plant capacity, and distribution. Also, this relationship has the greatest indirect effect with a value of 0.390 through Intermediate Systems, and it suggests that Stand-Alone Systems are the most relevant AMT in the maquiladora industry, because it is a result of the support of other more integrated technologies.
- Finally, the direct effect from Integrated Systems on Production Benefits have a value of 0.439, which indicates an AMT integration flow, because taking care of the biggest direct effects, the following route seems to be crucial among variables, indicating that the AMT implementation process is gradual:
5.2. Sensitivity Analysis and Industrial Implications
- There is a 0.459 probability of having a high level of implementation from Intermediate Systems, because there has is a high level in Stand-Alone Systems, that is, the correct implementation of technology systems, such as CAD, CAPP, CNC, and MWL, which allow a great implementation of systems for AS/RS, AMHS, and AITE.
- The probability of having a high implementation of Intermediate Systems if there is a low implementation of Stand-Alone Systems is 0.000, which indicates that the implementation process of AMT is gradual and it is not possible for a company to have an adequate implementation of the Intermediate Systems if the implementation of Stand-Alone Systems is at a low level, which may be due to the fact that there must be a learning and evolution system in AMT. Therefore, an incorrect or null implementation of Stand-Alone Systems will end in poor material handling systems and inspection, as well as testing in an automated management way. Also, the probability of having a low implementation level in Intermediate Systems if there is a high implementation of Stand-Alone Systems is 0.027, which indicates that a high level of Stand-Alone Systems is not associated with low implementation levels in Intermediate Systems, confirming the last conclusion.
- Finally, if a company has a low implementation level in Stand-Alone Systems, then it has a risk of 0.446 to have a low level in the Intermediate Systems; therefore, managers must make a huge effort to implement Stand-Alone Systems properly to guarantee successful investment in more expensive technologies.
- If Intermediate Systems have a high implementation level, then there is a probability of 0.534 that Integrated Systems will also have a high level, which means that the correct implementation of AS/RS, AMHS, and AITE systems will guarantee, at a certain level, the appropriate implementation of manufacturing cells, JIT, and that material management may be performed through systems, such as MRP and MRP II.
- The probability of having a high implementation of Integrated Systems if there is a low implementation of Intermediate Systems is 0.018, which is a risk for managers and they must focus their effort to solve that problem to guarantee benefits. Also, it is almost impossible to have a low implementation on Integrated Systems if there is a high implementation on Intermediate Systems, because the conditional probability is 0.017. This result allows to conclude again that incremental AMT is required.
- Finally, a low implementation level of Intermediate Systems is highly associated with low implementation on Integrated Systems, because the conditional probability is 0.702. In other words, as result of low implementation in AS/RS, AMHS, and AITE, then the technologies such as FMC, FMS, CIM, JIT, MRP, and MRP II systems will also have low levels and the managers must focus on guaranteeing an incremental AMT implementation.
- If there are high implementation levels on Stand-Alone Systems, then there is a probability of 0.500 of obtaining Integrated Systems with high levels as well, which indicates that the appropriate implementation of technologies systems, such as CAD, CAPP, CNC, and MWL will allow the correct usage of automated material handling technologies such as FMC/FMS, CIM, JIT, MRP, and MRP II.
- The probability of having a high level of implementation on Integrated Systems because the Stand-Alone Systems have not been implemented, is 0.000; it sounds somewhat logical since if a type of isolated AMT has not been implemented before, it is impossible to integrate them into a system and there is a lack of experience in this kind of technologies. Also, the probability for obtaining high implementation on Integrated Systems if Stand-Alone Systems are low, is 0.027, and it means that companies cannot integrate their production systems if they do not have control on their isolated technologies. Therefore, managers must focus on an incremental implementation.
- Finally, in the scenario where the implementation of the Integrated Systems is low if the Stand-Alone Systems are low as well, the probability is 0.482, which means that if Stand-Alone Systems have not been implemented correctly, as a consequence, the Integrated Systems will not be implemented correctly as well.
- There is a probability of 0.338 of obtaining high levels on Production Benefits, such as the reduction of the production cost, time of process, and an increment in product quality, if the Stand-Alone Systems such as CAD, CAPP, CNC, and MWL, as well as robots are implemented correctly.
- Those Stand-Alone Systems with low levels cannot generate Production Benefits in high levels, because the conditional probability is only 0.054, where managers must pay attention in order to have an adequate technology implementation. Also, to confirm the last conclusion, Stand-Alone Systems in high levels do not generate Production Benefits in low levels, because the conditional probability is 0.027.
- Finally, the worst situation for a manager is to have a low implementation level in Stand-Alone Systems, because there is a risk of 0.411 of generating a low level in Production Benefits. In other words, managers must focus on obtaining an adequate implementation in CAD, CAPP, NC/CNC, DNC, and MWL, as well as robots, to guarantee low production costs and processing time, a better quality, and capacity.
- There is a probability of 0.345 of obtaining a high level on Production Benefits if Intermediate Systems also have a high level, which indicates that a low production cost and production time are depending on the technology level for AS/RS, AMHS, and AITE. This is relevant, because those technologies are focused on material handling—an important component in a production system that never adds value to the product. This findings are similar to those reported by Danese [75], where AS/RS is highly related with processing time in manufacturing industries.
- However, if Intermediated Systems have a low implementation level, then there is a probability of 0.035 for having Production Benefits, which indicates the importance of guaranteeing an appropriate implementation process. Also, if there are Intermediated Systems at a high level, then Product Benefits will almost never have low levels, because the conditional probability is only 0.052. In other words, Intermediated Systems in low levels never generate Production Benefits, and that is why managers must focus their efforts on guaranteeing an adequate implementation process.
- Finally, there is a probability or risk of 0.333 of having low levels in Production Benefits if Intermediated Systems have low levels as well. In fact, it means that if technology is used in material handling, then it is difficult to obtain benefits associated with the improvement in layout, better production organization, low set-up time, and space usage.
- If Integrated Systems have a high implementation level, then there is a conditional probability of 0.491 to have Production Benefits at high levels as well. This means that if FMC/FMS, CIM, JIT, MRP, and MRP II are properly implemented, then companies will acquire low production cost and processing time, better quality, plant capacity, production organization, and reliability. These findings are similar to García-Alcaraz, Macías, Luevano, Fernández, López and Macías [58] that have indicated the relationship between JIT and the benefits acquired, or that associated the SMED with benefits obtained by the maquiladoras.
- However, if Integrated Systems have a low implementation level in production lines, then is almost impossible to obtain high levels in Production Benefits, because the conditional probability is only 0.030; and vice versa, if Integrated Systems have high implementation level, then is almost impossible to obtain low levels in Production Benefits, because the conditional probability is 0.018. This finding guarantees managers that investing in this type of technology always generates benefits.
- Finally, if Integrated Systems have a low implementation level, then there is a probability of 0.394 of obtaining low levels in Production Benefits, which is mainly due to the high cost of this technology. For example, Wang, Gong and Wang [62] indicated that if MRP has a low implementation, then the cost for material handling is high, while Kenneth W. Green, et al. [76] indicated that a low level in JIT may affect the quality in products and delivery time.
Author Contributions
Funding
Conflicts of Interest
References
- Goyal, S.; Grover, S. Advanced manufacturing technology effectiveness: A review of literature and some issues. Front. Mech. Eng. 2012, 7, 256–267. [Google Scholar] [CrossRef]
- Ordoobadi, S.M. Application of AHP and Taguchi loss functions in evaluation of advanced manufacturing technologies. Int. J. Adv. Manuf. Technol. 2013, 67, 2593–2605. [Google Scholar] [CrossRef]
- Krot, K.; Mazgajczyk, E.; Rusińska, M.; Woźna, A. Strategy of improving skills of innovation managers in the area of advanced manufacturing technologies. In Proceedings of the Intelligent Systems in Production Engineering and Maintenance, Wrocław, Poland, 17–18 September 2019; Springer: Cham, Switzerland, 2019; pp. 296–305. [Google Scholar]
- Percival, J.C.; Cozzarin, B.P. Complementarities in the implementation of advanced manufacturing technologies. J. High Technol. Manag. Res. 2010, 21, 122–135. [Google Scholar] [CrossRef] [Green Version]
- Small, M.H.; Chen, I.J. Economic and strategic justification of AMT inferences from industrial practices. Int. J. Prod. Econ. 1997, 49, 65–75. [Google Scholar] [CrossRef]
- Small, M.H.; Chen, I.J. Investment justification of advanced manufacturing technology: An empirical analysis. J. Eng. Technol. Manag. 1995, 12, 27–55. [Google Scholar] [CrossRef]
- Kotha, S.; Swamidass, P.M. Strategy, advanced manufacturing technology and performance: Empirical evidence from US manufacturing firms. J. Oper. Manag. 2000, 18, 257–277. [Google Scholar] [CrossRef]
- Sohal, A.S.; Singh, M. Implementing Advanced Manufacturing Technology: Factors Critical to Success. Logist. Inf. Manag. 1992, 5, 39–46. [Google Scholar] [CrossRef]
- Beaumont, N.; Schroder, R.; Sohal, A. Do foreign-owned firms manage advanced manufacturing technology better? Int. J. Oper. Prod. Manag. 2002, 22, 759–771. [Google Scholar] [CrossRef]
- Aravindan, P.; Punniyamoorthy, M. Justification of Advanced Manufacturing Technologies (AMT). Int. J. Adv. Manuf. Technol. 2002, 19, 151–156. [Google Scholar] [CrossRef]
- Meredith, J.; Suresh, N. Justification techniques for advanced manufacturing technologies. Int. J. Prod. Res. 1986, 24, 1043–1057. [Google Scholar] [CrossRef]
- Lee, Y.-Q.; Shin, H.-J. CIM implementation through at and MRP integration. Comput. Ind. Eng. 1996, 31, 609–612. [Google Scholar] [CrossRef]
- Kuts, V.; Modoni, G.E.; Terkaj, W.; Tähemaa, T.; Sacco, M.; Otto, T. Exploiting factory telemetry to support virtual reality simulation in robotics cell. In Proceedings of the Augmented Reality, Virtual Reality, and Computer Graphics, Ugento, Italy, 12–15 June 2017; Springer: Cham, Switzerland, 2017; pp. 212–221. [Google Scholar]
- Jing, H.; Haihong, E.; Guan, L.; Jian, D. Survey on NoSQL database. In Proceedings of the 6th International Conference on Pervasive Computing and Applications, Port Elizabeth, South Africa, 26–28 October 2011; pp. 363–366. [Google Scholar]
- Ghani, K.A.; Jayabalan, V.; Sugumar, M. Impact of advanced manufacturing technology on organizational structure. J. High Technol. Manag. Res. 2002, 13, 157–175. [Google Scholar] [CrossRef]
- Ordoobadi, S. Evaluation of advanced manufacturing technologies using Taguchi’s loss functions. J. Manuf. Technol. Manag. 2009, 20, 367–384. [Google Scholar] [CrossRef]
- Singh, H.; Kumar, R. Measuring the utilization index of advanced manufacturing technologies: A case study. IFAC Proc. Vol. 2013, 46, 899–904. [Google Scholar] [CrossRef]
- Garcia-Alcaraz, J.L.; Iniesta, A.; Juárez, M.C. Benefits of advanced manufacturing technologies. Afr. J. Bus. Manag. 2012, 6, 5524–5532. [Google Scholar] [CrossRef]
- Kreng, V.B.; Wu, C.-Y.; Wang, I.C. Strategic justification of advanced manufacturing technology using an extended AHP model. Int. J. Adv. Manuf. Technol. 2011, 52, 1103–1113. [Google Scholar] [CrossRef]
- Choe, J.-M. Impact of management accounting information and AMT on organizational performance. J. Inf. Technol. 2004, 19, 203–214. [Google Scholar] [CrossRef]
- Gothwal, S.; Raj, T. Analyzing the factors affecting the flexibility in FMS using weighted interpretive structural modeling (WISM) approach. Int. J. Syst. Assur. Eng. Manag. 2017, 8, 408–422. [Google Scholar] [CrossRef]
- García-Alcaraz, J.L.; Maldonado, A.A.; Iniesta, A.A.; Robles, G.C.; Hernández, G.A. A systematic review/survey for JIT implementation: Mexican maquiladoras as case study. Comput. Ind. 2014, 65, 761–773. [Google Scholar] [CrossRef]
- Braglia, M.; Gabbrielli, R. Dimensional analysis for investment selection in industrial robots. Int. J. Prod. Res. 2000, 38, 4843–4848. [Google Scholar] [CrossRef]
- Jones, T.C.; Lee, B. Accounting, strategy and AMT investment. Omega 1998, 26, 769–783. [Google Scholar] [CrossRef]
- Koc, T.; Bozdag, E. The impact of AMT practices on firm performance in manufacturing SMEs. Robot. Comput. Integr. Manuf. 2009, 25, 303–313. [Google Scholar] [CrossRef]
- Chan, F.T.S.; Chan, M.H.; Lau, H.; Ip, R.W.L. Investment appraisal techniques for advanced manufacturing technology (AMT): A literature review. Integr. Manuf. Syst. 2001, 12, 35–47. [Google Scholar] [CrossRef]
- INEGI. Monthly Survey of Manufacturing (EMIM). Available online: http://www.inegi.org.mx/sistemas/bie/default.aspx?idserPadre=10400100 (accessed on 13 June 2016). (In Spanish).
- García-Alcaraz, J.L.; Martínez-Loya, V.; Díaz-Reza, J.R.; Blanco-Fernández, J.; Jiménez-Macías, E.; López, A.J.G. Effect of ICT integration on SC flexibility, agility and company’ performance: The Mexican maquiladora experience. Wirel. Netw. 2019. [Google Scholar] [CrossRef]
- Boer, H. Advanced manufacturing technologies and strategically flexible production. A review and outlook. In A Journey through Manufacturing and Supply Chain Strategy Research: A Tribute to Professor Gianluca Spina; Bartezzaghi, E., Cagliano, R., Caniato, F., Ronchi, S., Eds.; Springer International Publishing: Cham, Switzerland, 2016; pp. 71–110. [Google Scholar]
- Bülbül, H.; Ömürbek, N.; Paksoy, T.; Bektaş, T. An empirical investigation of advanced manufacturing technology investment patterns: Evidence from a developing country. J. Eng. Technol. Manag. 2013, 30, 136–156. [Google Scholar] [CrossRef]
- Cardoso, R.D.R.; Pinheiro de Lima, E.; Gouvea da Costa, S.E. Identifying organizational requirements for the implementation of Advanced Manufacturing Technologies (AMT). J. Manuf. Syst. 2012, 31, 367–378. [Google Scholar] [CrossRef]
- Boyer, K.K.; Leong, G.K.; Ward, P.T.; Krajewski, L.J. Unlocking the potential of advanced manufacturing technologies. J. Oper. Manag. 1997, 15, 331–347. [Google Scholar] [CrossRef]
- Ghobakhloo, M.; Azar, A. Business excellence via advanced manufacturing technology and lean-agile manufacturing. J. Manuf. Technol. Manag. 2017, 29, 2–24. [Google Scholar] [CrossRef]
- Kumar, R.; Singh, H.; Chandel, R. Exploring the key success factors of advanced manufacturing technology implementation in Indian manufacturing industry. J. Manuf. Technol. Manag. 2017, 29, 25–40. [Google Scholar] [CrossRef]
- Altuntas, S.; Cinar, O.; Kaynak, S. Relationships among advanced manufacturing technology, innovation, export, and firm performance: Empirical evidence from Turkish manufacturing companies. Kybernetes 2018, 47, 1836–1856. [Google Scholar] [CrossRef]
- Cheng, Y.; Matthiesen, R.; Farooq, S.; Johansen, J.; Hu, H.; Ma, L. The evolution of investment patterns on advanced manufacturing technology (AMT) in manufacturing operations: A longitudinal analysis. Int. J. Prod. Econ. 2018, 203, 239–253. [Google Scholar] [CrossRef]
- Sacristán Díaz, M.; Machuca, J.A.D.; Álvarez-Gil, M.A.J. A view of developing patterns of investment in AMT through empirical taxonomies: New evidence. J. Oper. Manag. 2003, 21, 577–606. [Google Scholar] [CrossRef]
- Bourke, J.; Roper, S. AMT adoption and innovation: An investigation of dynamic and complementary effects. Technovation 2016, 55–56, 42–55. [Google Scholar] [CrossRef]
- Green, K.W.; Inman, R.A.; Birou, L.M.; Whitten, D. Total JIT (T-JIT) and its impact on supply chain competency and organizational performance. Int. J. Prod. Econ. 2014, 147, 125–135. [Google Scholar] [CrossRef]
- Ang, J.S.K.; Sum, C.-C.; Chung, W.-F. Critical success factors in implementing MRP and government assistance: A Singapore context. Inf. Manag. 1995, 29, 63–70. [Google Scholar] [CrossRef]
- Modoni, G.E.; Sacco, M.; Terkaj, W. A survey of RDF store solutions. In Proceedings of the International Conference on Engineering, Technology and Innovation (ICE), Bergamo, Italy, 23–25 June 2014; pp. 1–7. [Google Scholar]
- Gupta, Y.P.; Yakimchuk, M.D. Impact of Advanced Manufacturing Technology on Industrial Relations: A Comparative Study. Int. J. Oper. Prod. Manag. 1989, 9, 5–14. [Google Scholar] [CrossRef]
- Dhamija, D.; Koonce, D.A.; Judd, R.P. Development of a unified data meta-model for CAD-CAPP-MRP-NC verification integration. Comput. Ind. Eng. 1997, 33, 19–22. [Google Scholar] [CrossRef]
- Campos, J.G.; Miguez, L.R. Standard process monitoring and traceability programming in collaborative CAD/CAM/CNC manufacturing scenarios. Comput. Ind. 2011, 62, 311–322. [Google Scholar] [CrossRef]
- Fulton, M.; Hon, B. Managing advanced manufacturing technology (AMT) implementation in manufacturing SMEs. Int. J. Product. Perform. Manag. 2010, 59, 351–371. [Google Scholar] [CrossRef]
- Zhou, X.; Qiu, Y.; Hua, G.; Wang, H.; Ruan, X. A feasible approach to the integration of CAD and CAPP. Comput. Aided Des. 2007, 39, 324–338. [Google Scholar] [CrossRef]
- Milosevic, M.; Lukic, D.; Antic, A.; Lalic, B.; Ficko, M.; Simunovic, G. e-CAPP: A distributed collaborative system for internet-based process planning. J. Manuf. Syst. 2017, 42, 210–223. [Google Scholar] [CrossRef]
- Brecher, C.; Wellmann, F.; Epple, A. Quality-predictive CAM Simulation for NC Milling. Procedia Manuf. 2017, 11, 1519–1527. [Google Scholar] [CrossRef]
- Brecher, C.; Lohse, W. Evaluation of toolpath quality: User-assisted CAM for complex milling processes. CIRP J. Manuf. Sci. Technol. 2013, 6, 233–245. [Google Scholar] [CrossRef]
- Utstumo, T.; Urdal, F.; Brevik, A.; Dørum, J.; Netland, J.; Overskeid, Ø.; Berge, T.W.; Gravdahl, J.T. Robotic in-row weed control in vegetables. Comput. Electron. Agric. 2018, 154, 36–45. [Google Scholar] [CrossRef]
- Zhang, Q.; Vonderembse, M.A.; Cao, M. Achieving flexible manufacturing competence: The roles of advanced manufacturing technology and operations improvement practices. Int. J. Oper. Prod. Manag. 2006, 26, 580–599. [Google Scholar] [CrossRef]
- Lin, J.T.; Wu, C.-H.; Huang, C.-W. Dynamic vehicle allocation control for automated material handling system in semiconductor manufacturing. Comput. Oper. Res. 2013, 40, 2329–2339. [Google Scholar] [CrossRef]
- Glüer, D.; Sturm, R. Integration of Real Factory Variability in AMHS Simulations for Wafer Fabs. IFAC Proc. Vol. 2006, 39, 679–684. [Google Scholar] [CrossRef]
- Lemos, M.A.; Liberado, E.V.; Marques, M.A.; Junior, G.B. Towards Intelligent Manufacturing. IFAC Proc. Vol. 2007, 40, 73–78. [Google Scholar] [CrossRef]
- Baena, F.; Guarin, A.; Mora, J.; Sauza, J.; Retat, S. Learning Factory: The Path to Industry 4.0. Procedia Manuf. 2017, 9, 73–80. [Google Scholar] [CrossRef]
- Fullerton, R.R.; McWatters, C.S. The production performance benefits from JIT implementation. J. Oper. Manag. 2001, 19, 81–96. [Google Scholar] [CrossRef]
- Maiga, A.S.; Jacobs, F.A. JIT performance effects: A research note. Adv. Account. 2009, 25, 183–189. [Google Scholar] [CrossRef]
- García-Alcaraz, J.L.; Macías, A.A.M.; Luevano, D.J.P.; Fernández, J.B.; López, A.D.J.G.; Macías, E.J. Main benefits obtained from a successful JIT implementation. Int. J. Adv. Manuf. Technol. 2016, 86, 2711–2722. [Google Scholar] [CrossRef]
- Singh, S.; Garg, D. JIT System: Concepts, Benefits and Motivation in Indian Industries. Int. J. Manag. Bus. Stud. 2011, 1, 26–30. [Google Scholar]
- Schroeder, R.G.; Anderson, J.C.; Tupy, S.E.; White, E.M. A study of MRP benefits and costs. J. Oper. Manag. 1981, 2, 1–9. [Google Scholar] [CrossRef]
- Sum, C.-C.; Yang, K.-K.; Ang, J.S.K.; Quek, S.-A. An analysis of Material Requirements Planning (MRP) benefits using Alternating Conditional Expectation (ACE). J. Oper. Manag. 1995, 13, 35–58. [Google Scholar] [CrossRef]
- Wang, H.; Gong, Q.; Wang, S. Information processing structures and decision making delays in MRP and JIT. Int. J. Prod. Econ. 2017, 188, 41–49. [Google Scholar] [CrossRef]
- Vonglao, P. Application of fuzzy logic to improve the Likert scale to measure latent variables. Kasetsart J. Soc. Sci. 2017, 38, 337–344. [Google Scholar] [CrossRef]
- Galván, O.; García, J. Analysis of the Historical Development of the Maquiladora Export Industry in Mexico. Rev. Doxa 2018, 8, 135–152. (In Spanish) [Google Scholar]
- Kline, R.B. Principles and Practice of Structural Equation Modeling; Guilford Publications: New York, NY, USA, 2015. [Google Scholar]
- Ajayi, S.O.; Oyedele, L.O. Critical design factors for minimising waste in construction projects: A structural equation modelling approach. Resour. Conserv. Recycl. 2018, 137, 302–313. [Google Scholar] [CrossRef] [Green Version]
- Kock, N. Using WarpPLS in e-collaboration studies: Mediating effects, control and second order variables, and algorithm choices. Int. J. E Collab. 2011, 7, 1–13. [Google Scholar] [CrossRef]
- Hair, J.F.; Ringle, C.M.; Sarstedt, M. Editorial-partial least squares structural equation modeling: Rigorous applications, better results and higher acceptance. Long Range Plan. 2013, 46, 1–12. [Google Scholar] [CrossRef]
- Kock, N. Advanced mediating effects tests, multi-group analyses, and measurement model assessments in PLS-based SEM. Int. J. E Collab. 2014, 10, 1–13. [Google Scholar] [CrossRef]
- Moqbel, M.; Kock, N.; Nevo, S. Organizational members’ use of social networking sites and job performance: An exploratory study. Inf. Technol. People 2013, 26, 240–264. [Google Scholar] [CrossRef]
- Kock, N. WarpPLS User Manual: Version 6.0; ScriptWarp Systems: Laredo, TX, USA, 2017. [Google Scholar]
- Ross, S.M. 3—Conditional probability and conditional expectation. In Introduction to Probability Models, 12th ed.; Ross, S.M., Ed.; Academic Press: Cambridge, MA, USA, 2019; pp. 101–191. [Google Scholar]
- Alimohammadlou, M.; Eslamloo, F. Relationship between Total Quality Management, Knowledge Transfer and Knowledge Diffusion in the Academic Settings. Procedia Soc. Behav. Sci. 2016, 230, 104–111. [Google Scholar] [CrossRef] [Green Version]
- Miclo, R.; Fontanili, F.; Lauras, M.; Lamothe, J.; Milian, B. An empirical comparison of MRPII and Demand-Driven MRP. IFAC Pap. 2016, 49, 1725–1730. [Google Scholar] [CrossRef]
- Danese, P. JIT production, JIT supply and performance: Investigating the moderating effects. Ind. Manag. Data Syst. 2012, 112, 441–465. [Google Scholar] [CrossRef]
- Green, K.W.; Inman, R.A.; Sower, V.E.; Zelbst, P.J. Impact of JIT, TQM and green supply chain practices on environmental sustainability. J. Manuf. Technol. Manag. 2019. [Google Scholar] [CrossRef]


| Category | Items |
|---|---|
| Stand-Alone Systems [4,6,7,8,9] | Engineering and design technologies Computer aided design (CAD) Computer-aided planning process (CAPP) Fabricating/Machining and Assembly Technologies NC/CNC or DNC machines Materials that work with laser (MWL) Robots for lifting objects Other type of robots |
| Intermediate Systems [4,6,9] | Automated Material Handling Technologies Automatic storage systems (AS/RS) Automatic material handling systems (AMHS) Automated Inspection and Testing Systems Automated inspection test equipment (AITE) |
| Integrated Systems [4,6,7,8,9] | Flexible Manufacturing Technologies Flexible manufacturing (Cells or Systems) (FMC/FMS) Computer-integrated manufacturing systems Computer integrated manufacturing by (CIM) Logistic Related Systems Just in Time (JIT) Materials requirement planification (MRP) Manufacturing resources planification (MRP II) |
| Production Benefits [8,10] | Reduction in the production cost Reduction in the processing time Increasement in product quality Increasement in plant capacity Improvement of the plant distribution Better production organization Reduction of set-up time Increasement in reliability Better usage of the available space |
| Indexes | Measurement | Suggested Value |
|---|---|---|
| R2 | Predictive parametric validation | ≥0.20 |
| Adjusted R2 | ≥0.20 | |
| Composite Reliability | Internal consistency | ≥0.70 |
| Cronbach’s Alpha | Internal consistency | ≥0.70 |
| Average Variance Extracted | Discriminant validity | ≥0.50 |
| Full Collin. VIF | Collinearity | ≤3.30 |
| Q2 | Predictive non-parametric validity | >0.00 and similar to R2 |
| Industrial Sector | Frequency | Percent |
|---|---|---|
| Automotive | 187 | 48.8 |
| Machinery | 96 | 25 |
| Electronics | 44 | 11.5 |
| Electric | 32 | 8.4 |
| Not Answer | 10 | 2.6 |
| Logistics | 9 | 2.3 |
| Aeronautics | 5 | 1.3 |
| Total | 383 | 100 |
| Job | Frequency | Percent |
|---|---|---|
| Supervisor | 318 | 83.02 |
| Technician | 21 | 5.5 |
| Not answer | 19 | 5 |
| Manager | 14 | 3.7 |
| Other | 9 | 2.3 |
| Engineer | 2 | 0.5 |
| Total | 383 | 100 |
| Index | Stand-Alone Systems | Integrated Systems | Intermediate Systems | Production Benefits |
|---|---|---|---|---|
| R2 | 0.566 | 0.405 | 0.428 | |
| Adjusted R2 | 0.564 | 0.404 | 0.424 | |
| Composite Reliability | 0.871 | 0.880 | 0.867 | 0.950 |
| Cronbach’s Alpha | 0.705 | 0.796 | 0.693 | 0.941 |
| Avg. Var. Extrac. | 0.772 | 0.710 | 0.765 | 0.679 |
| Full Collin. VIF | 1.847 | 2.641 | 2.536 | 1.730 |
| Q2 | 0.567 | 0.404 | 0.430 |
| Index | Value | p-Value |
|---|---|---|
| Average path coefficient (APC) | 0.364 | p < 0.001 |
| Average R-squared (ARS) | 0.467 | p < 0.001 |
| Average adjusted R-squared (AARS) | 0.464 | p < 0.001 |
| Average block VIF (AVIF) acceptable if ≤5, ideally ≤3.3 | 1.946 | |
| Average full collinearity VIF (AFVIF) acceptable if ≤5, ideally ≤3.3 | 2.188 | |
| Tenenhaus GoF (GoF) small ≥ 0.1, medium ≥ 0.25, large ≥ 0.36 | 0.584 |
| Hi | Independent Variable | Dependent Variable | Β | p-Value | Conclusion |
|---|---|---|---|---|---|
| H1 | Stand-Alone Systems | Intermediate Systems | 0.636 | <0.001 | Accepted |
| H2 | Intermediate Systems | Integrated Systems | 0.613 | <0.001 | Accepted |
| H3 | Stand-Alone Systems | Integrated Systems | 0.198 | <0.001 | Accepted |
| H4 | Stand-Alone Systems | Production Benefits | 0.206 | <0.001 | Accepted |
| H5 | Intermediate Systems | Production Benefits | 0.089 | =0.039 | Accepted |
| H5 | Integrated Systems | Production Benefits | 0.439 | <0.001 | Accepted |
| Dependent Variable | Independent Variable | Total R2 | ||
|---|---|---|---|---|
| Stand-Alone Systems | Integrated Systems | Intermediate Systems | ||
| Integrated Systems | 0.115 | 0.451 | 0.566 | |
| Intermediate Systems | 0.405 | 0.405 | ||
| Production Benefits | 0.106 | 0.274 | 0.048 | 0.428 |
| Dependent Variables | Independent Variables | |
|---|---|---|
| Stand-Alone Systems | Intermediate Systems | |
| Integrated Systems | 0.390 p ˂ 0.001 ES = 0.227 | |
| Production Benefits | 0.315 p ˂ 0.001 ES = 0.162 | 0.269 p ˂ 0.001 ES = 0.144 |
| Dependent Variable | Independent Variable | ||
|---|---|---|---|
| Stand-Alone Systems | Intermediate Systems | Integrated Systems | |
| Integrated Systems | 0.588 p ˂ 0.001 ES = 0.342 | 0.613 p ˂ 0.001 ES = 0.451 | |
| Intermediate Systems | 0.636 p ˂ 0.001 ES = 0.405 | ||
| Production Benefits | 0.521 p ˂ 0.001 ES = 0.269 | 0.358 p ˂ 0.001 ES = 0.192 | 0.439 p ˂ 0.001 ES = 0.274 |
| Stand-Alone Systems | Integrated Systems | Intermediate Systems | Production Benefits | ||||||
|---|---|---|---|---|---|---|---|---|---|
| Probability | + | − | + | − | + | − | + | − | |
| 0.193 | 0.146 | 0.149 | 0.172 | 0.151 | 0.149 | 0.159 | 0.131 | ||
| Stand-Alone Systems | + | 0.097 | 0.005 | 0.089 | 0.005 | 0.065 | 0.005 | ||
| − | 0.000 | 0.070 | 0.000 | 0.065 | 0.008 | 0.060 | |||
| Integrated Systems | + | 0.081 | 0.003 | 0.073 | 0.003 | ||||
| − | 0.003 | 0.104 | 0.030 | 0.068 | |||||
| Intermediate Systems | + | 0.052 | 0.008 | ||||||
| − | 0.005 | 0.050 | |||||||
| Hi | Level | Dependent Variable | Condition | Independent Variable | Level | Probability |
|---|---|---|---|---|---|---|
| H1 | + | Intermediate Systems | If | Stand-Alone Systems | + | 0.459 |
| + | Intermediate Systems | If | Stand-Alone Systems | − | 0.000 | |
| − | Intermediate Systems | If | Stand-Alone Systems | + | 0.027 | |
| − | Intermediate Systems | If | Stand-Alone Systems | − | 0.446 | |
| H2 | + | Integrated Systems | If | Intermediate Systems | + | 0.534 |
| + | Integrated Systems | If | Intermediate Systems | − | 0.018 | |
| − | Integrated Systems | If | Intermediate Systems | + | 0.017 | |
| − | Integrated Systems | If | Intermediate Systems | − | 0.702 | |
| H3 | + | Integrated Systems | If | Stand-Alone Systems | + | 0.500 |
| + | Integrated Systems | If | Stand-Alone Systems | − | 0.000 | |
| − | Integrated Systems | If | Stand-Alone Systems | + | 0.027 | |
| − | Integrated Systems | If | Stand-Alone Systems | − | 0.482 | |
| H4 | + | Production Benefits | If | Stand-alone Systems | + | 0.338 |
| + | Production Benefits | If | Stand-alone Systems | − | 0.054 | |
| − | Production Benefits | If | Stand-alone Systems | + | 0.027 | |
| − | Production Benefits | If | Stand-alone Systems | − | 0.411 | |
| H5 | + | Production Benefits | If | Intermediate Systems | + | 0.345 |
| + | Production Benefits | If | Intermediate Systems | − | 0.035 | |
| − | Production Benefits | If | Intermediate Systems | + | 0.052 | |
| − | Production Benefits | If | Intermediate Systems | − | 0.333 | |
| H6 | + | Production Benefits | If | Integrated Systems | + | 0.491 |
| + | Production Benefits | If | Integrated Systems | − | 0.030 | |
| − | Production Benefits | If | Integrated Systems | + | 0.018 | |
| − | Production Benefits | If | Integrated Systems | − | 0.394 |
© 2019 by the authors. Licensee MDPI, Basel, Switzerland. This article is an open access article distributed under the terms and conditions of the Creative Commons Attribution (CC BY) license (http://creativecommons.org/licenses/by/4.0/).
Share and Cite
Díaz-Reza, J.R.; Mendoza-Fong, J.R.; Blanco-Fernández, J.; Marmolejo-Saucedo, J.A.; García-Alcaraz, J.L. The Role of Advanced Manufacturing Technologies in Production Process Performance: A Causal Model. Appl. Sci. 2019, 9, 3741. https://doi.org/10.3390/app9183741
Díaz-Reza JR, Mendoza-Fong JR, Blanco-Fernández J, Marmolejo-Saucedo JA, García-Alcaraz JL. The Role of Advanced Manufacturing Technologies in Production Process Performance: A Causal Model. Applied Sciences. 2019; 9(18):3741. https://doi.org/10.3390/app9183741
Chicago/Turabian StyleDíaz-Reza, José Roberto, José Roberto Mendoza-Fong, Julio Blanco-Fernández, José Antonio Marmolejo-Saucedo, and Jorge Luis García-Alcaraz. 2019. "The Role of Advanced Manufacturing Technologies in Production Process Performance: A Causal Model" Applied Sciences 9, no. 18: 3741. https://doi.org/10.3390/app9183741