1. Introduction
Due to the environmental issues posed by fossil energy sources, reducing the effects of these sources is one of the main priorities in energy planning today. In this context, in addition to striving for maximum energy savings, the most important concern is to replace these energy sources with renewable energies [
1]. Consequently, the use of these resources such as fuel cell, wave [
2,
3], wind [
4], solar, and hydrothermal energies attained substantial attention [
5,
6,
7]. Fuel cells, especially PEM fuel cells with high power density, high efficiency, and short startup time are recognized as one of the most encouraging technologies for achieving these goals that can be employed in various applications [
8,
9,
10].
Numerous research has been done recently for optimization of the PEM fuel cells performance considering various parameters that can be effective on its proficiency [
11,
12,
13,
14,
15]. The operating temperature in determining the type of PEM fuel cells is an important parameter. In addition to operating temperature, the main difference between normal PEM fuel cell and high temperature is the membrane of the fuel cell. The normal polymer membrane is a Nafion
® type that is made from perfluoro-carbon-sulfonic acid ionomer. The fuel entering the cell should be saturated with steam so that the membrane does not dry because the transfer mechanism uses the water as a proton carrier from the membrane. The function of the fuel cell at the desired temperature can lead to a blockage problem, which causes the membrane to flood and reduce the ionization of the membrane. Therefore, research was directed into the development of a new membrane so that it can function well above 100 °C and have a high conductivity in low moisture [
16].
Improved membranes should have low material costs and high durability. Acid-based polymer membranes have been developed to achieve high proton conductivity, and one of the most favorite acid-base polymer membranes is polybenzimidazole (PBI) doped with phosphoric acid to increase the protonic conductivity. Phosphoric acid has more stability than other acids. In the context of the development of HT-PEMFCs, Authayanun et al. performed extensive studies and evaluated the results of one, two, and three-dimensional simulations in this area [
16]. Studies have shown that most research has been done to examine the materials and processes for improving fuel cell performance, including optimizing and simplifying fuel cell components and simulation of fuel cell systems to diminish their cost and enhance the efficiency, stability and durability compared to combustion engines; these should be considered in the studies.
Rosly et al. [
17] reviewed the research on various HT-PEMFCs and parameters affecting their performance. Based on their investigations, it is possible to find suitable solutions for increasing the stability and durability of the fuel cell and create proper conditions for better fuel cell performance. For this purpose, firstly, the components and performance of low-temperature fuel cell have been explored, and the need to go towards the design and development of high-temperature fuel cell components has been expressed in order to be able to achieve key factors in optimum fuel cell performance. Also, the effect of various parameters on the performance of PEMFC such as different working temperatures, working pressures, and combinations of these parameters was evaluated experimentally by Wang et al. [
18]. Voltage-current diagrams obtained from experimental results have shown the effect of these variables on fuel cell performance. Graphs have revealed that fuel cell performance has improved with increasing fuel cell pressure and temperature due to increased fuel reaction rate. Furthermore, the simulation of a three-dimensional fuel cell model was implemented, and the results were compared with experimental work, which showed an acceptable match between experimental and numerical data. Subsequently, Cheddie and Munroe presented a one-dimensional mathematical model for predicting the performance of HT-PEMFC with PBI membrane [
19]. Their attention was on MEA and evaluated the energy and mass transfer in the gas diffusion layer (GDL) and the electrochemical model. The most significant loss in the PBI fuel cell is the activation over-potential. The second-largest was Ohmic over-potential. The performance of this type of fuel cell has also been improved by increasing the membrane conductivity and enhancing catalyst performance.
Scott et al. [
20] improved a high-temperature fuel cell with PBI membrane condensed by phosphoric acid in a one-dimensional and steady-state. In this research, the effect of operating pressure and cell temperature on the open circuit potential, and the effect of diffusion coefficients, exchange current density, and water transport across the membrane on the conductivity of the PBI membrane were examined. Their results are consistent with experimental data. Olapade et al. [
21] studied the morphological properties of HT-PEMFC components by one-dimensional modeling, in steady-state and non-isothermal conditions, so that by achieving an optimal state, the catalyst layer can hold the steam generated from electrochemical reactions brought on by the feed gases. Their simulation was carried out at the temperature of 190 °C and operating pressure of 2 bars. The results showed that the porosity reduction of the GDL leads to retaining more water in the catalyst layer. Also, they stated that the use of micro-porous layer also helps to keep water generated in the catalyst layer by reducing the pore size and porosity of the layer. It should be noted, however, that the pore size and porosity of the fuel cell components should not be too small to prevent the increasing of over-potential of oxygen concentration. Besides, the porosity reduction of the GDL causes the steam to rise in the catalyst layer. The optimal values of the GDL porosity and the micro- porous layer depend on factors such as cell voltage, operating pressure and relative humidity, which have been investigated and calculated in this paper.
Shamardina et al. [
22] simulated two-dimensional HT-PEMFC and investigated the role of transport in the cathode catalyst layer. Their calculations showed that close to the oxygen channel inlet, the cathode catalyst layer works in the regime limited by poor proton transport, while close to the outlet, the cathode catalyst layer operation is specified by poor oxygen transport. Sue et al. [
23] examined numerically and experimentally the performance of high-temperature fuel cell. In their numerical simulation, they used a two-dimensional model and observed the effect of PBI loading on the fuel cell. In their research, PBI value in the catalyst layer is considered between 5 to 30 wt%, and cell temperature is considered in the range of 160–200 °C. Sun et al. [
24] numerically surveyed the effect of temperature and mass transfer in an HT-PEMFC. Their models were simulated in two-dimensional and single-phase models, and the effect of the porosity of the GDL and its thickness on the fuel cell performance were evaluated. The results show that increasing the cell temperature and the porosity of the GDL and reducing the thickness of the GDL will improve the performance of high-temperature fuel cells.
Using the PEM fuel cell simulation, Al-Baghdadi and Al-Janabi [
25] studied and optimized the parameters affecting the performance of the fuel cell. Their models have a direct gas flow channel and are simulated three-dimensional, single-phase, and non-isothermal. They studied the effect of temperature, pressure, flow stoichiometry, gas channel width, thickness of the GDL, membrane thickness, porosity of the GDL and thermal conductivity of the GDL on the fuel cell performance. Zhang et al. [
26] investigated the effect of relative humidity on the performance of single-cell PEM fuel cell at temperature of 120 °C and pressure of 1 atmosphere. Their experimental results showed that with relative humidity decreasing from 100 to 25 percent, the voltage reached from 0.675 V to 0.358 V and the performance and production capacity of the fuel cell decreased, since, with decreasing of humidity, the electrode reaction and mass penetration rate were slower and membrane resistance increases. They indicated that by enhancing the relative humidity from 25 to 100 percent, the pressure drop in the anode and the cathode increases, and the partial pressure of oxygen and hydrogen decreases, which are a function of the input relative humidity at temperature of 120 °C and pressure of 1 atmosphere. Ubong et al. [
27] experimentally and numerically studied the performance of HT-PEMFCs. Their model is a single cell with a serpentine channel, and their simulation were implemented in steady-state, three-dimensional, and isothermal.
Su et al. [
28] addressed the three-dimensional and isothermal simulation of an HT-PEMFC with PTFE membrane. They examined the parameters such as the distribution of saturated water, membrane conductivity, temperature, flow density, etc. on the performance of the fuel cell. Wang et al. [
29] investigated the start-up process modeling of an HT-PEMFC using Comsol software. Starting HT-PEM fuel cells from room temperature to a proper operating temperature is a challenge. In this study, the preheated air was used to increase the temperature of the cooling channel or gas channel, and the optimum state was selected by checking the start-up time and temperature behavior of the fuel cell. Liu and Chang [
30] experimentally investigated the effects of the micro-porous layer on the performance of an HT-PEMFC based on PBI. Using PBI electrolyte, they expressed the effect of MPL compounds, including PTFE and carbon and extracted an optimal state. The results showed that the micro-porous layer with a content of 40 wt% of PTEF and loading of 1 mg/cm
2 carbon yielded the optimum performance of the cell. Lonescu [
31] performed a three-dimensional simulation of a single-channel HT-PEMFC in a steady state. In this research, the Comsol software was used for simulation, and the concentration of species, namely, hydrogen and oxygen, and water concentration in the cathode and anode gas channels were investigated.
Liu et al. [
32] examined the effect of gas flow channel dimensions and operating conditions such as pressure and temperature on the efficiency of HT-PEMFCs. They used a developed mathematical model in their research. They also calculated the concentration of gas species in the electrodes through mass transfer analysis. Since their model required less computer computing, it has been used to analyze many samples with different gas flow channels and different operating conditions, and its optimal mode has been selected. Caglayan et al. [
33] investigated developed a three-dimensional and isothermal modeling for an HT-PEMFC. Triple mixed serpentine flow channel single-cell with PBI membrane was applied for the model. The model was defined in steady-state, isothermal and single-phase, and simulated for different operating temperatures in the range of 100 to 180 °C. The results show that the increase in temperature has improved the performance of the fuel cell. Also, the distribution of current density at different voltages was investigated, and it was deduced that at higher operating voltages, local flow density is more uniform. Pressure drop contours and distribution of oxygen concentration along the gas flow channel were also evaluated.
Moreover, in another study [
34], they improved a mathematical non-isothermal and 3D model of HT-PEMFC. The distribution of temperature and pressure along the channels and the membrane current density distribution over the entire membrane electrode active area were shown. Results were obtained for two operating voltages of 0.45, and 0.6 volts and the results of this model were compared with the results of the isothermal model in the previous study.
In the present study, a single-channel high-temperature PEM fuel cell, condensed with PBI, is simulated in 3D. This simulation has been carried out in steady-state, isothermal and single phase.
In the current paper, the IV curve of the simulation was validated according to an experimental work. Also, a comprehensive study of the effects of essential parameters on the PEMFC performance such as operating pressure, species concentration, ionic conductivity, electrical conductivity and current density were performed, some of which such as ionic conductivity and electrical conductivity are rarely investigated in other researches. This study was generated by an interest in obtaining a general understanding of the effect of material properties on the fuel cell efficiency. The results presented are used to define the most effective material properties that should be considered in the improvement of PEMFC degradation models.
2. Model Details and Validation
In this study, a single-channel HT-PEMFC with a PBI membrane is modeled in three dimensions and isothermal. The schematic of the computational region, including the PBI membrane, the catalyst layers, the gas diffusion layers (GDL) and the gas flow channel, is shown in
Figure 1. In this figure, the upper part of the geometry is the cathode and the lower part is the anode.
Also, the geometric and physical properties of the fuel cell for modeling and validation are summarized in
Table 1. This specification is derived from the experimental study by Ubong et al. [
27].
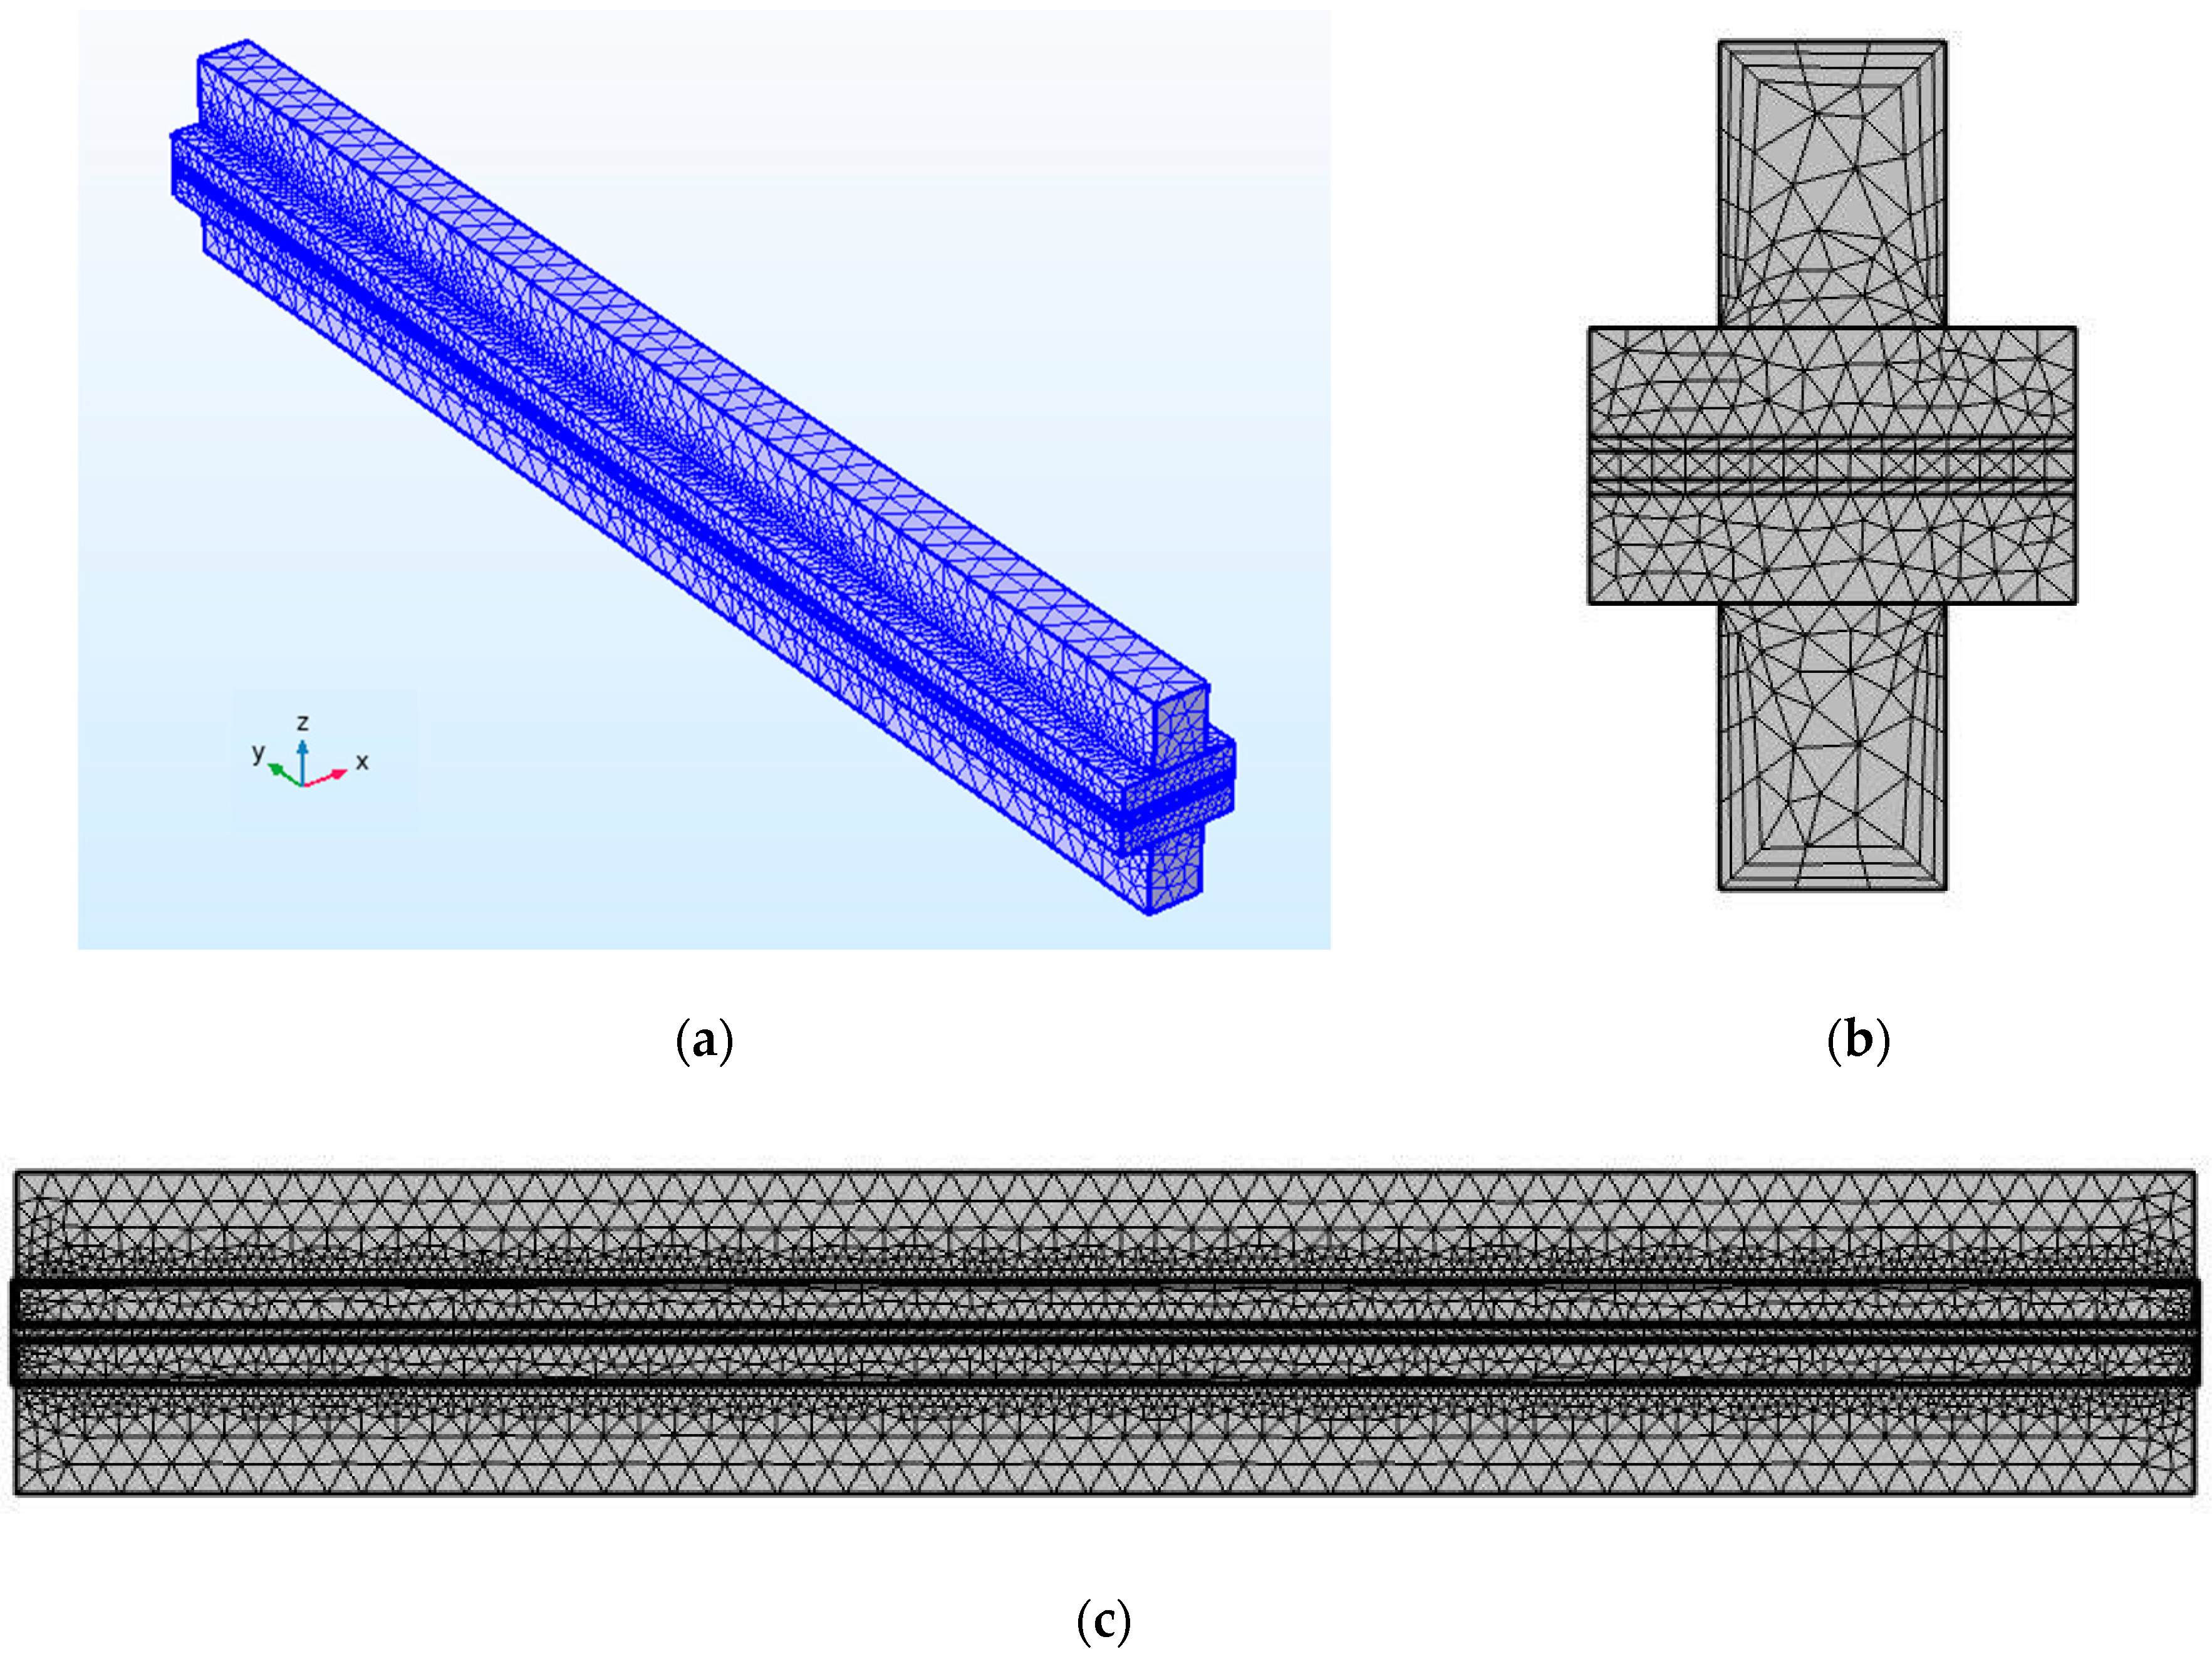
To test the results’ independency of the mesh, nine different meshes of a structured type have been produced and the results are compared with each other.
Table 2 shows the results from different meshes. To check the precision of different meshes, polarization curve is obtained for each mesh; the relative error shown in
Table 2 presents the average difference of voltages achieved from numerical simulation of a sample mesh and voltages from an experimental study by Ubong et al. [
27].
As shown in
Table 2, the results are close to each other for the 1,288,763 and 31,624,896 meshes, and finally, to reduce the computational time, the mesh number has been selected 1,288,763. It is important to note that in order to get the best response, it is crucial to consider the number of meshes suitable for the GDL, the catalyst layer, and the membrane along Y. To increase the accuracy of simulation, given that the reaction occurs in the catalyst layers, the mesh of this section is finer, and a multi-grid method is used for meshing (
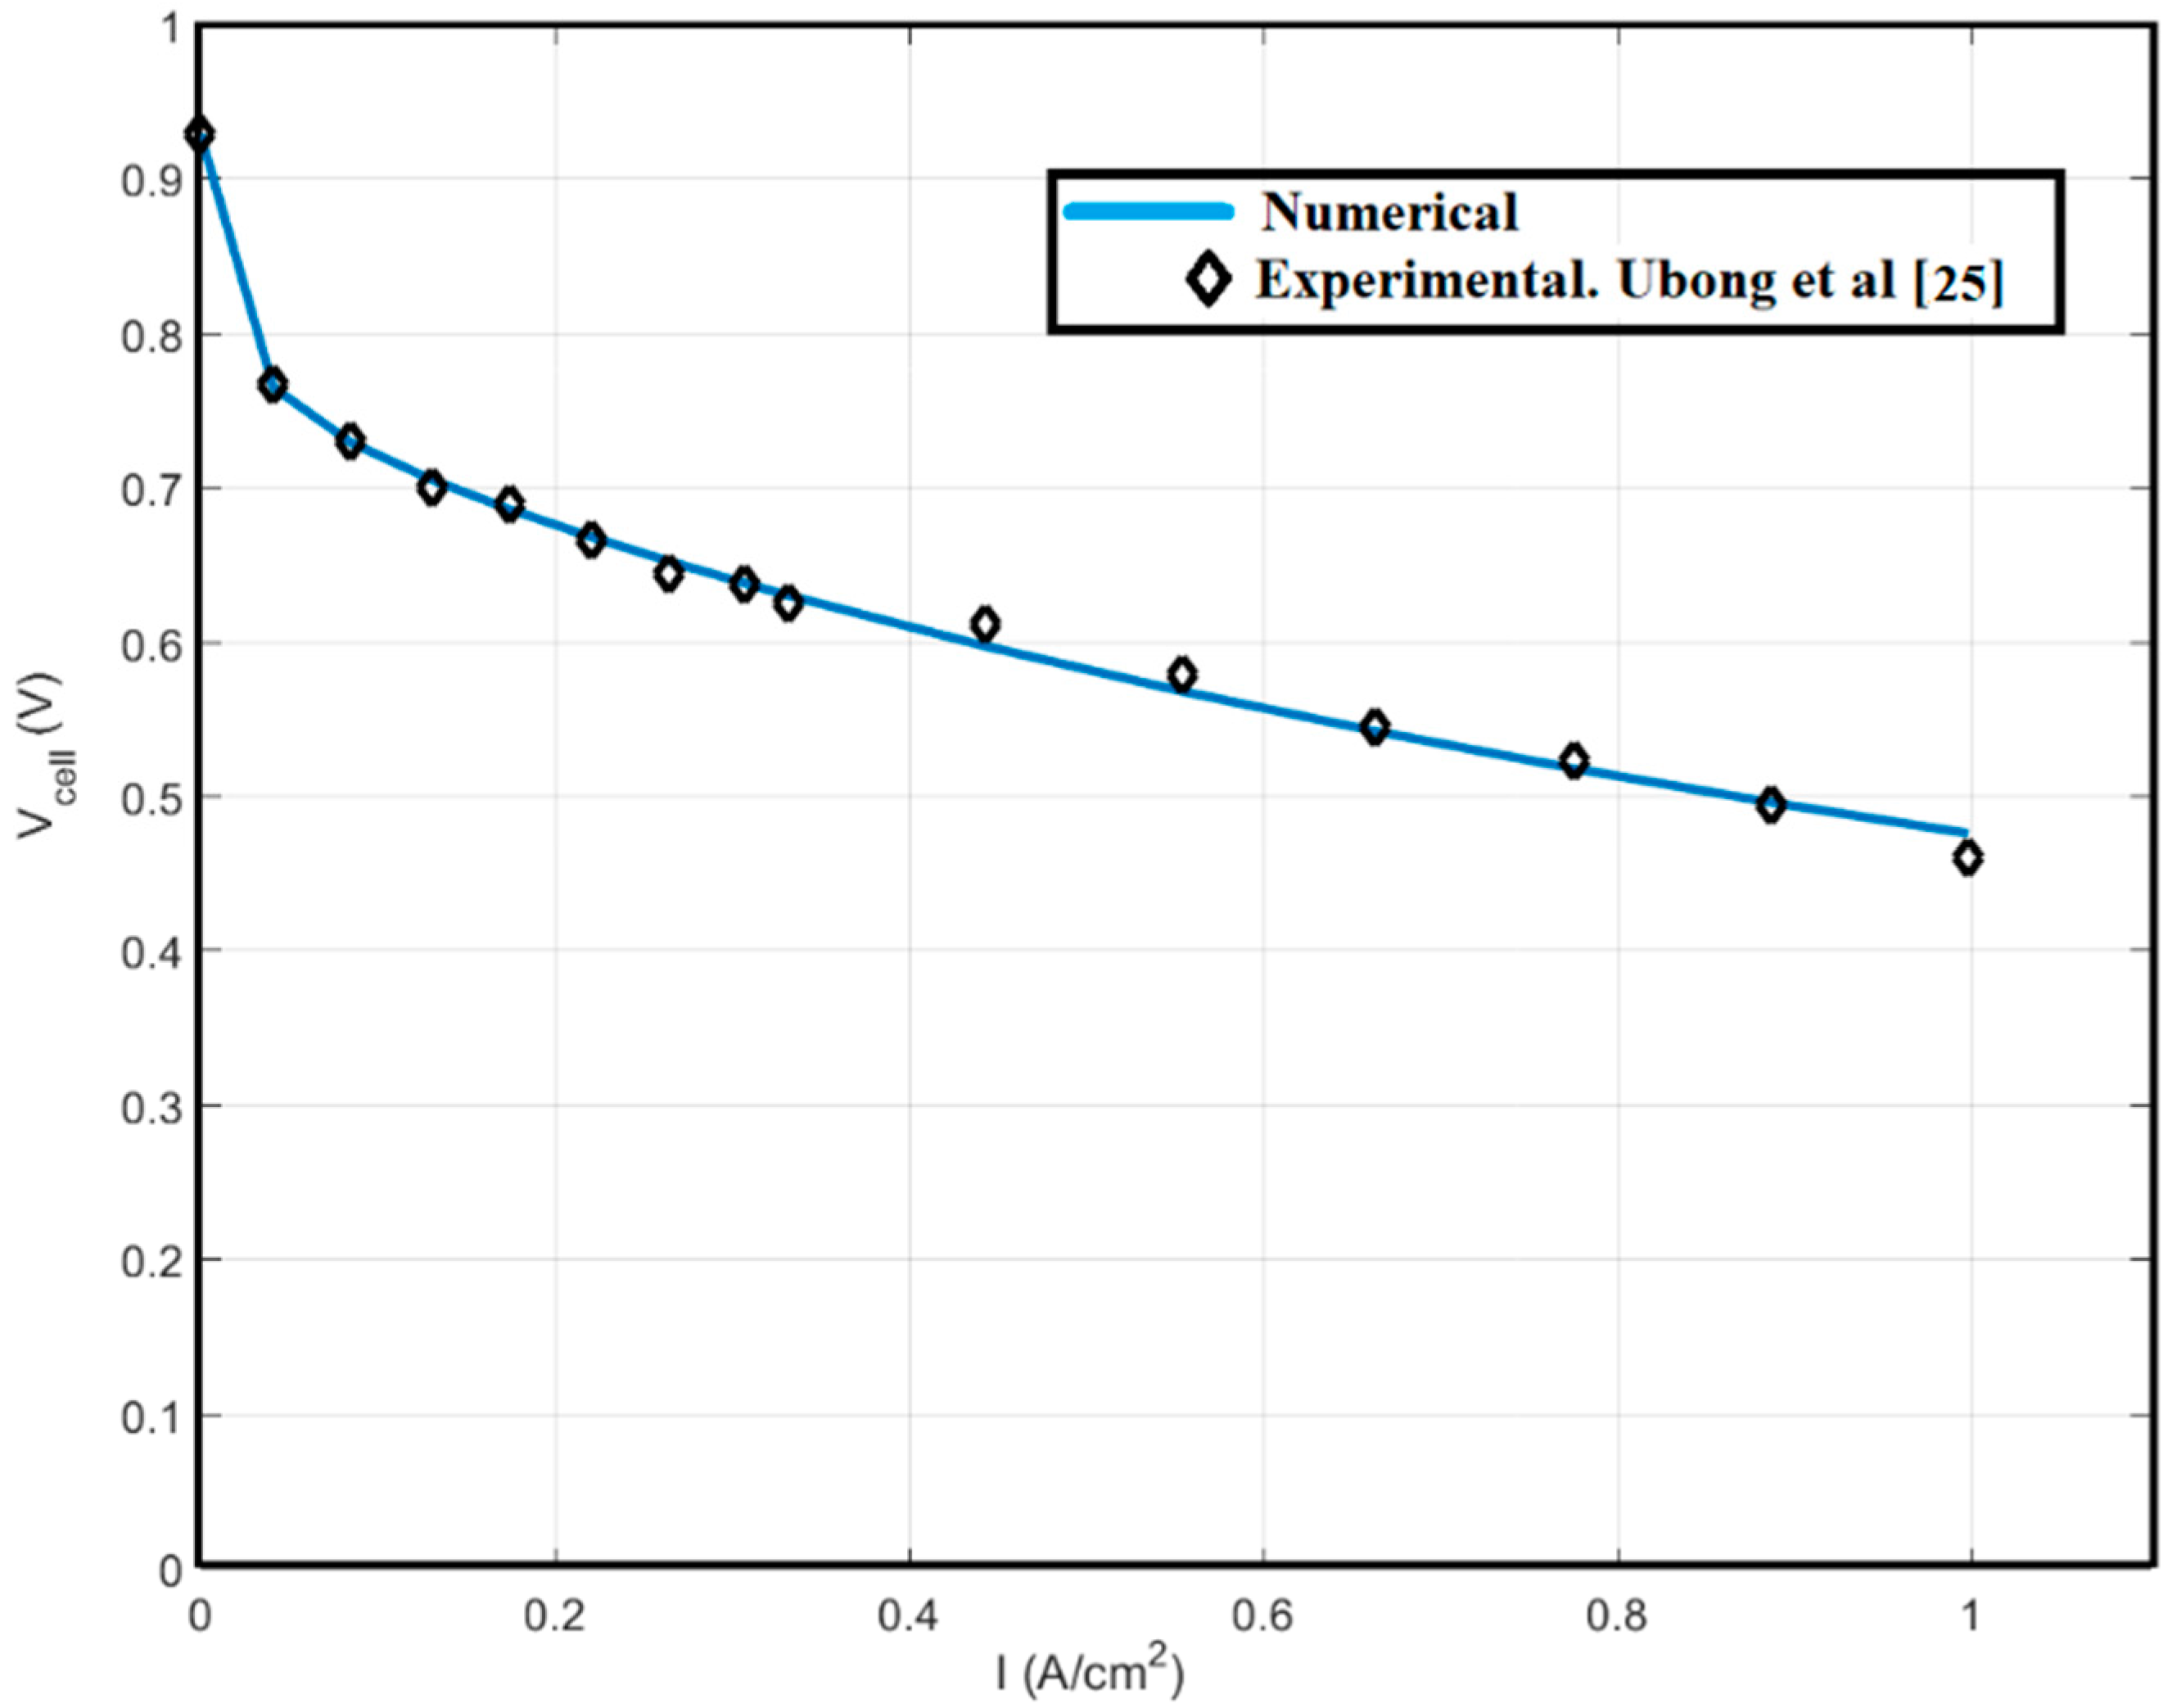
Figure 2). The number of meshes in percent used for gas channels, GDL, catalyst layer, and the membrane are 15, 35, 45, and 5, respectively. For validation, a numerical study has been used from the experimental work of Ubong et al. [
27], which is shown in
Figure 3. As can be seen, there is an acceptable agreement between empirical work and numerical simulation.
The flow in the gas channels is laminar, and because the fuel cell works at a temperature above 100 °C, water will only exist in the steam state. Also, due to the properties of PBI membrane, the water drag coefficient from anode to cathode is considered to be zero, in contrast to low-temperature PEM fuel cell with a Nafion
® membrane [
27]. The operating temperature of the fuel cell is 180 °C and pressure 1 bar, and stoichiometry 1.2 and 2 are considered for the anode and cathode, respectively, with a saturated inlet gas (100% humidity). The governing equations are solved in a steady-state, and the Simple Algorithm is used to adjust the partial derivative equations. Also, the second-order upwind has been used to discrete momentum, species, and energy equations, and the first-order upwind for the discretization of charge, liquid water, and membrane water content equations.
3. Governing Equations
Fluid flow, heat and mass transfer, electrochemical reactions and charge transfer processes in a PEM fuel cell are described by solving the conservation equations of mass, momentum, energy, chemical species, and charge as follows.
3.1. Mass and Momentum Conservation
The equations of mass and momentum conservation for the PEM fuel cell are defined as follows:
Source term of mass conservation equation,
Smass, is only non-zero for the catalyst layers of anode and cathode in which the mass production and consumption and the transfer of chemical species are occurred, and in the rest of the areas, it is zero. In the channels, the second term and in the porous regions where viscous forces overcome the displacement forces, the first term will be applied to the right-hand side of the momentum conservation equation. In the porous regions, the momentum equation of the Navier-Stokes equation is corrected to the Brinkman equation. In Equation (2),
μ (pa·s) is dynamic viscosity and,
k (m
2) is permeability;
is total stress tensor that is determined as follows:
3.2. Energy Equation
The Energy equation reads as
where
CP is the specific heat capacity of the mixture of gases,
keff is effective thermal conductivity, and
T is temperature in Kelvin. To determine the value of the parameters in porous media, the effective characteristics are determined as follow:
In all equations, ε is the porosity coefficient, which is equal to one in the gas flow channels and in the porous regions, its value ranges from zero to one. Stemp is the source term, which includes the heat generated by the electrochemical reactions (that only exists in the catalyst layers), the Ohmic heat due to the thermal resistance of the solid areas and the heat generated by the phase change process if any.
3.3. Equations of Species
In chemical species equations, the consumed reactants and the products produced from the reactions are considered as gas mixtures, so they are all in the gas phase.
The source term in the transfer equation of chemical species,
Si, is zero, except for the catalyst layers where species are produced or consumed in electrochemical reactions. The source term used for the cathode and anode catalyst layers is different and depends on the exchange current density produced by the electrochemical reactions.
is the mass flux of the type
i defined as follow:
3.4. Potential Equation of Membrane and Solid
Transmission of electrons through the solid phase and the transport of protons through the membrane phase are expressed in terms of charge conservation equations. The transfer of protons through the membrane causes ionic flow, and transfer of electrons from the solid parts of the electrodes leads to electrical current. These equations are obtained by Ohm’s law:
where
σs and
σm, respectively, are the electrical conductivity coefficient in the solid phase and the ionic conductivity coefficient in the polymer membrane.
φs and
φm also indicate the potential of the solid phase and the potential of the polymer membrane phase. The source term
Spot is defined as:
In theory, the activation losses, η, which are the difference between the potentials of the solid phase and membrane, are the driving force of the volumetric exchange current density. The source terms for the solid phase and membrane phase represent the production of electrons and protons, which are calculated by the Butler-Volmer equations.
The source terms of the conservation of electrical load are named as the transitional electrical current density. and , respectively, are the exchange current density in in the anode and cathode at reference conditions. F is Faraday’s constant, and Ci and , are the concentration of chemical species and the concentration of chemical species at reference conditions, respectively. is a factor dependent on the concentration and α is the transfer coefficient.
The activation losses,
η, in the anode and cathode are calculated as follows:
Voc is open circuit voltage on the cathode side. Based on the charge conservation, the total electrons flowing out of the anode catalyst layer should be equivalent to the total current entered into the cathode catalyst layer, and also for the protons.
3.5. Boundary Conditions
The input velocities, temperature, and mass fraction of chemical species are determined as fuel cell performance parameters. Before solving the governing equations, the average electric current density, stoichiometric ratio, temperature, pressure and other parameters, the mass flow rate of the flow channels and the mass fraction of the chemical species are calculated.
For the anode and cathode gas channel, the output boundary condition is as follows.
All outer plates of the PEM fuel cell, except terminals, are defined as the outer boundaries of the fuel cell. The terminals are the upper and lower plates of the fuel cell that the electric current enters and exits. The flow conditions of zero flow are considered for external boundaries.
If the voltage is considered constant for calculating the electrical current, the following applies:
Boundary conditions for anode terminal:
And boundary conditions for the cathode terminal:
4. Results and Discussion
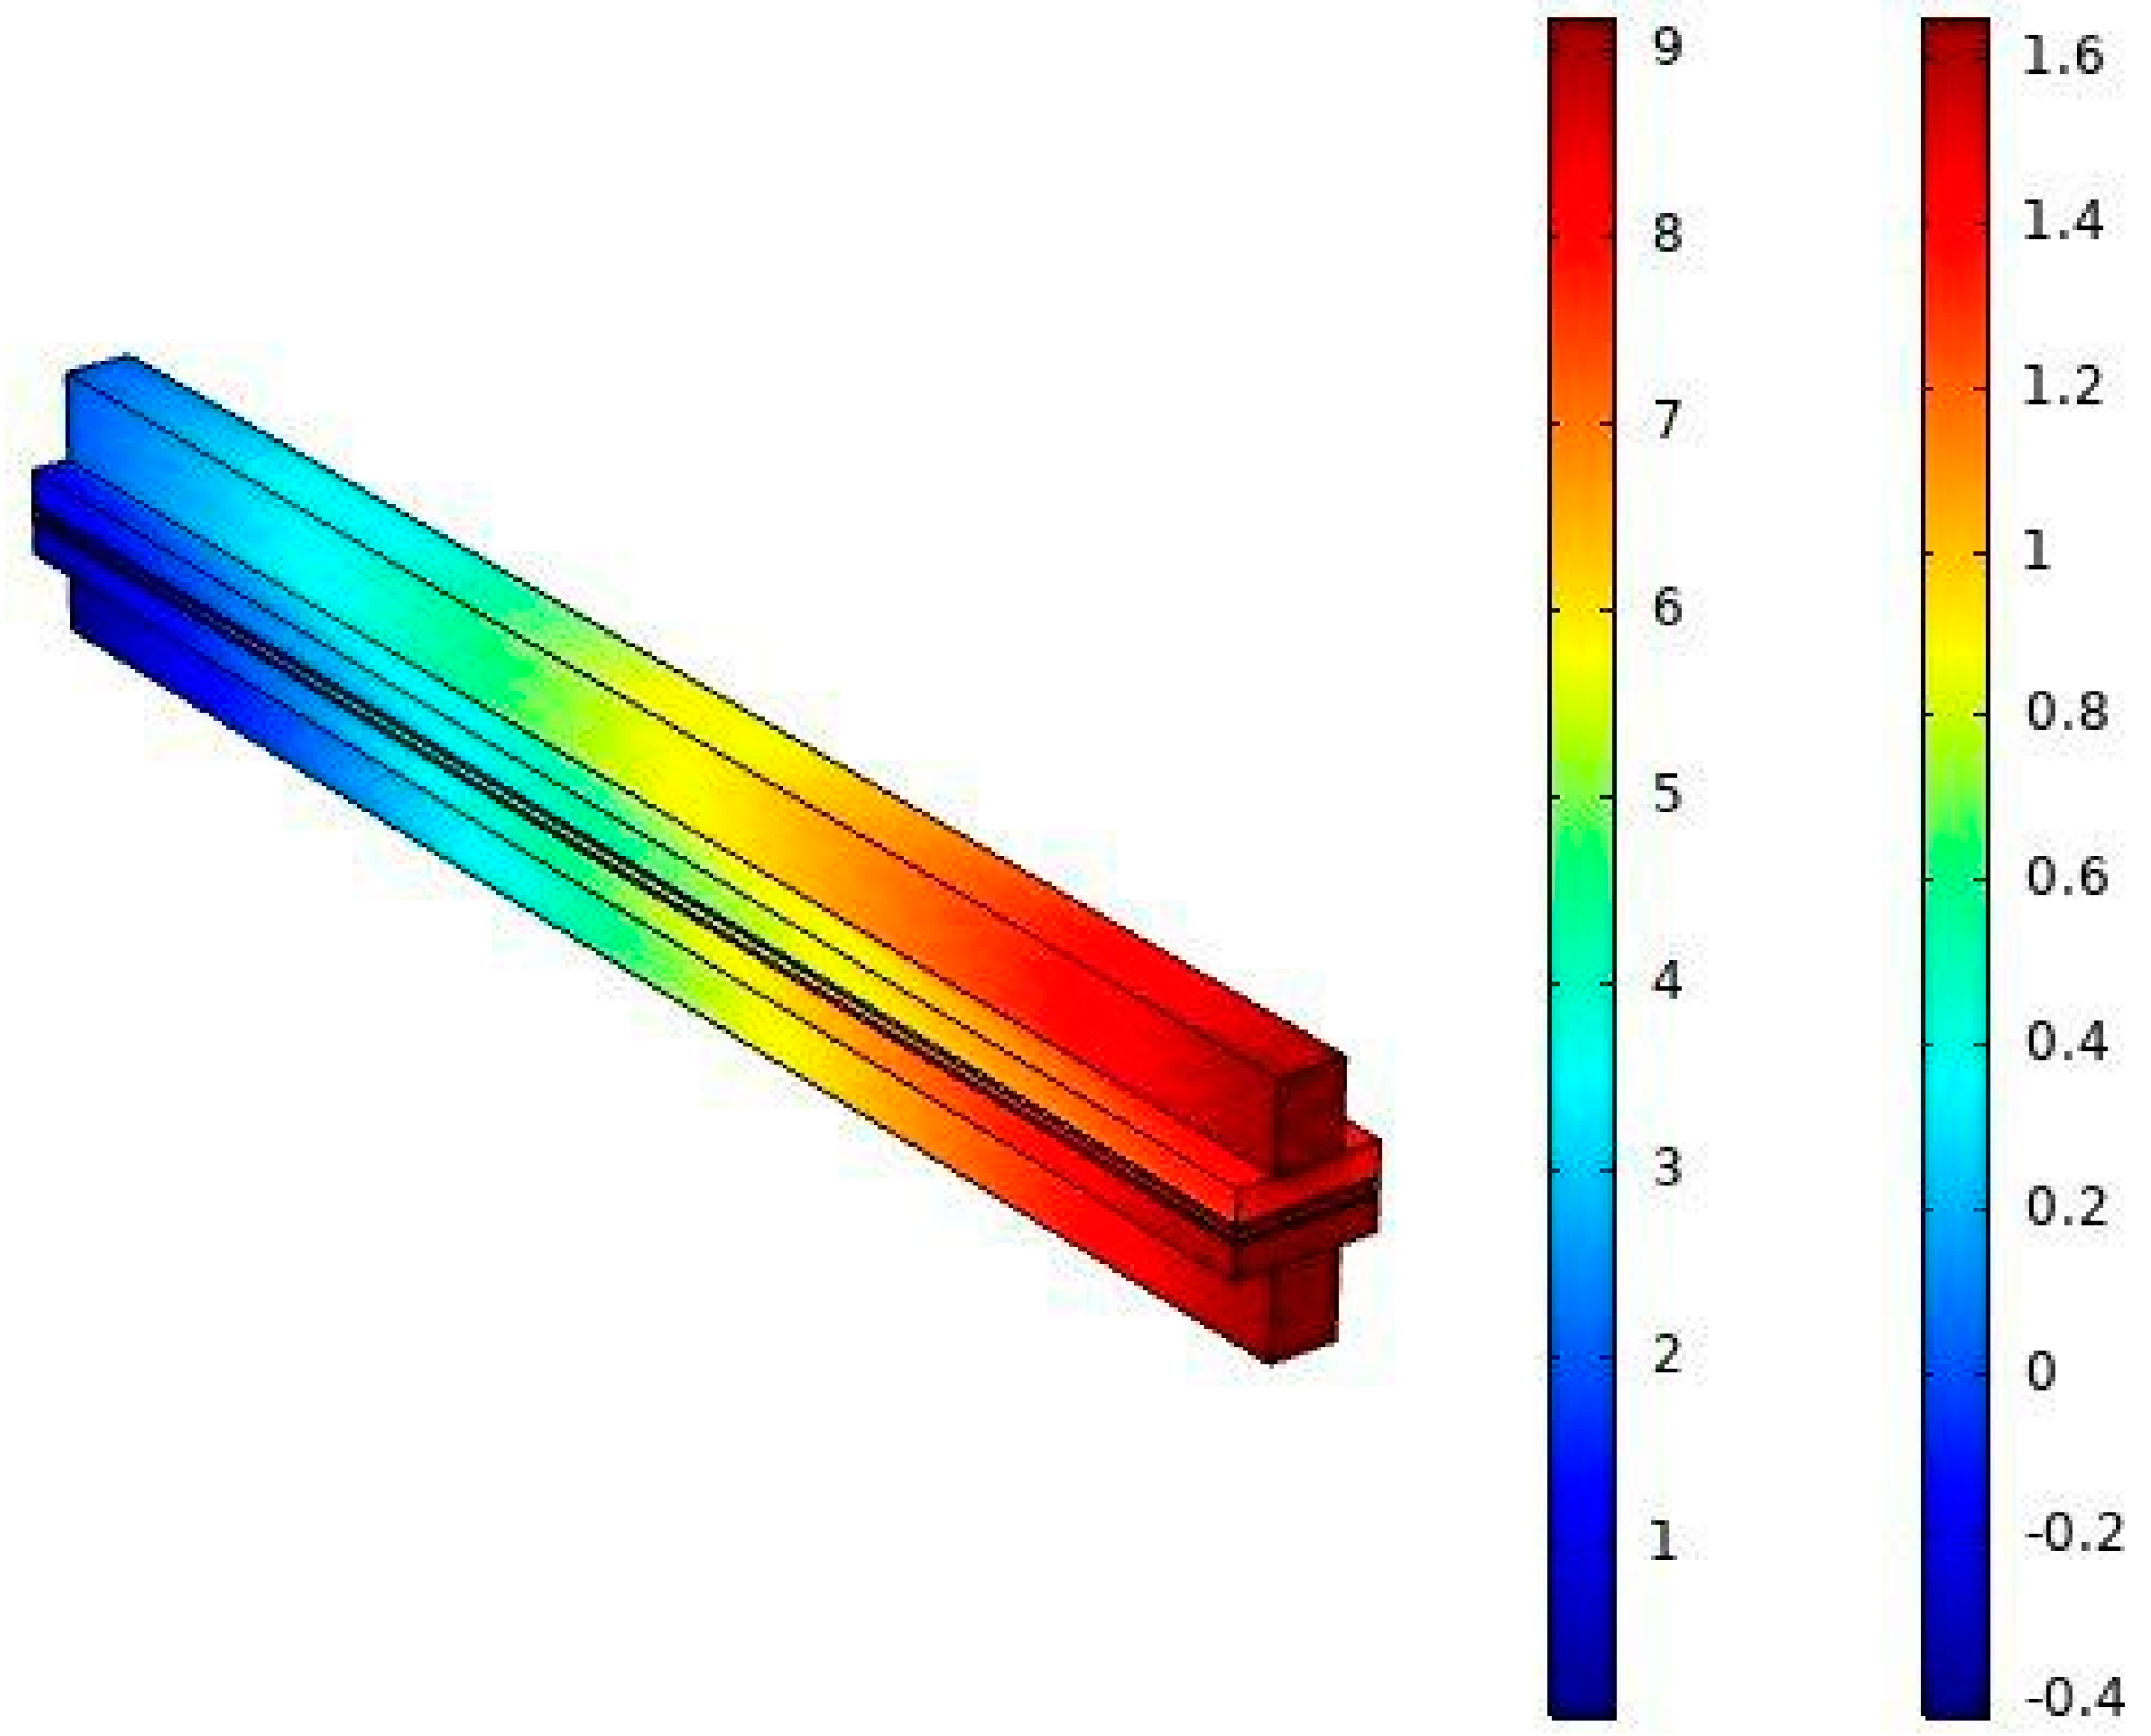
In
Figure 4, the pressure variation in the anode and cathode sides of the fuel cell is displayed. The pressure drop across the anode channel is 2 bars, and throughout the cathode channel is higher than 9 bars. Although the pressure has decreased both in the cathode and anode, the pressure drop in the cathode is larger than the anode. Since the oxygen velocity in the inlet of the cathode channel is 2.5 times the speed of the hydrogen velocity in the input of the anode channel, a higher pressure drop in the cathode is obtained.
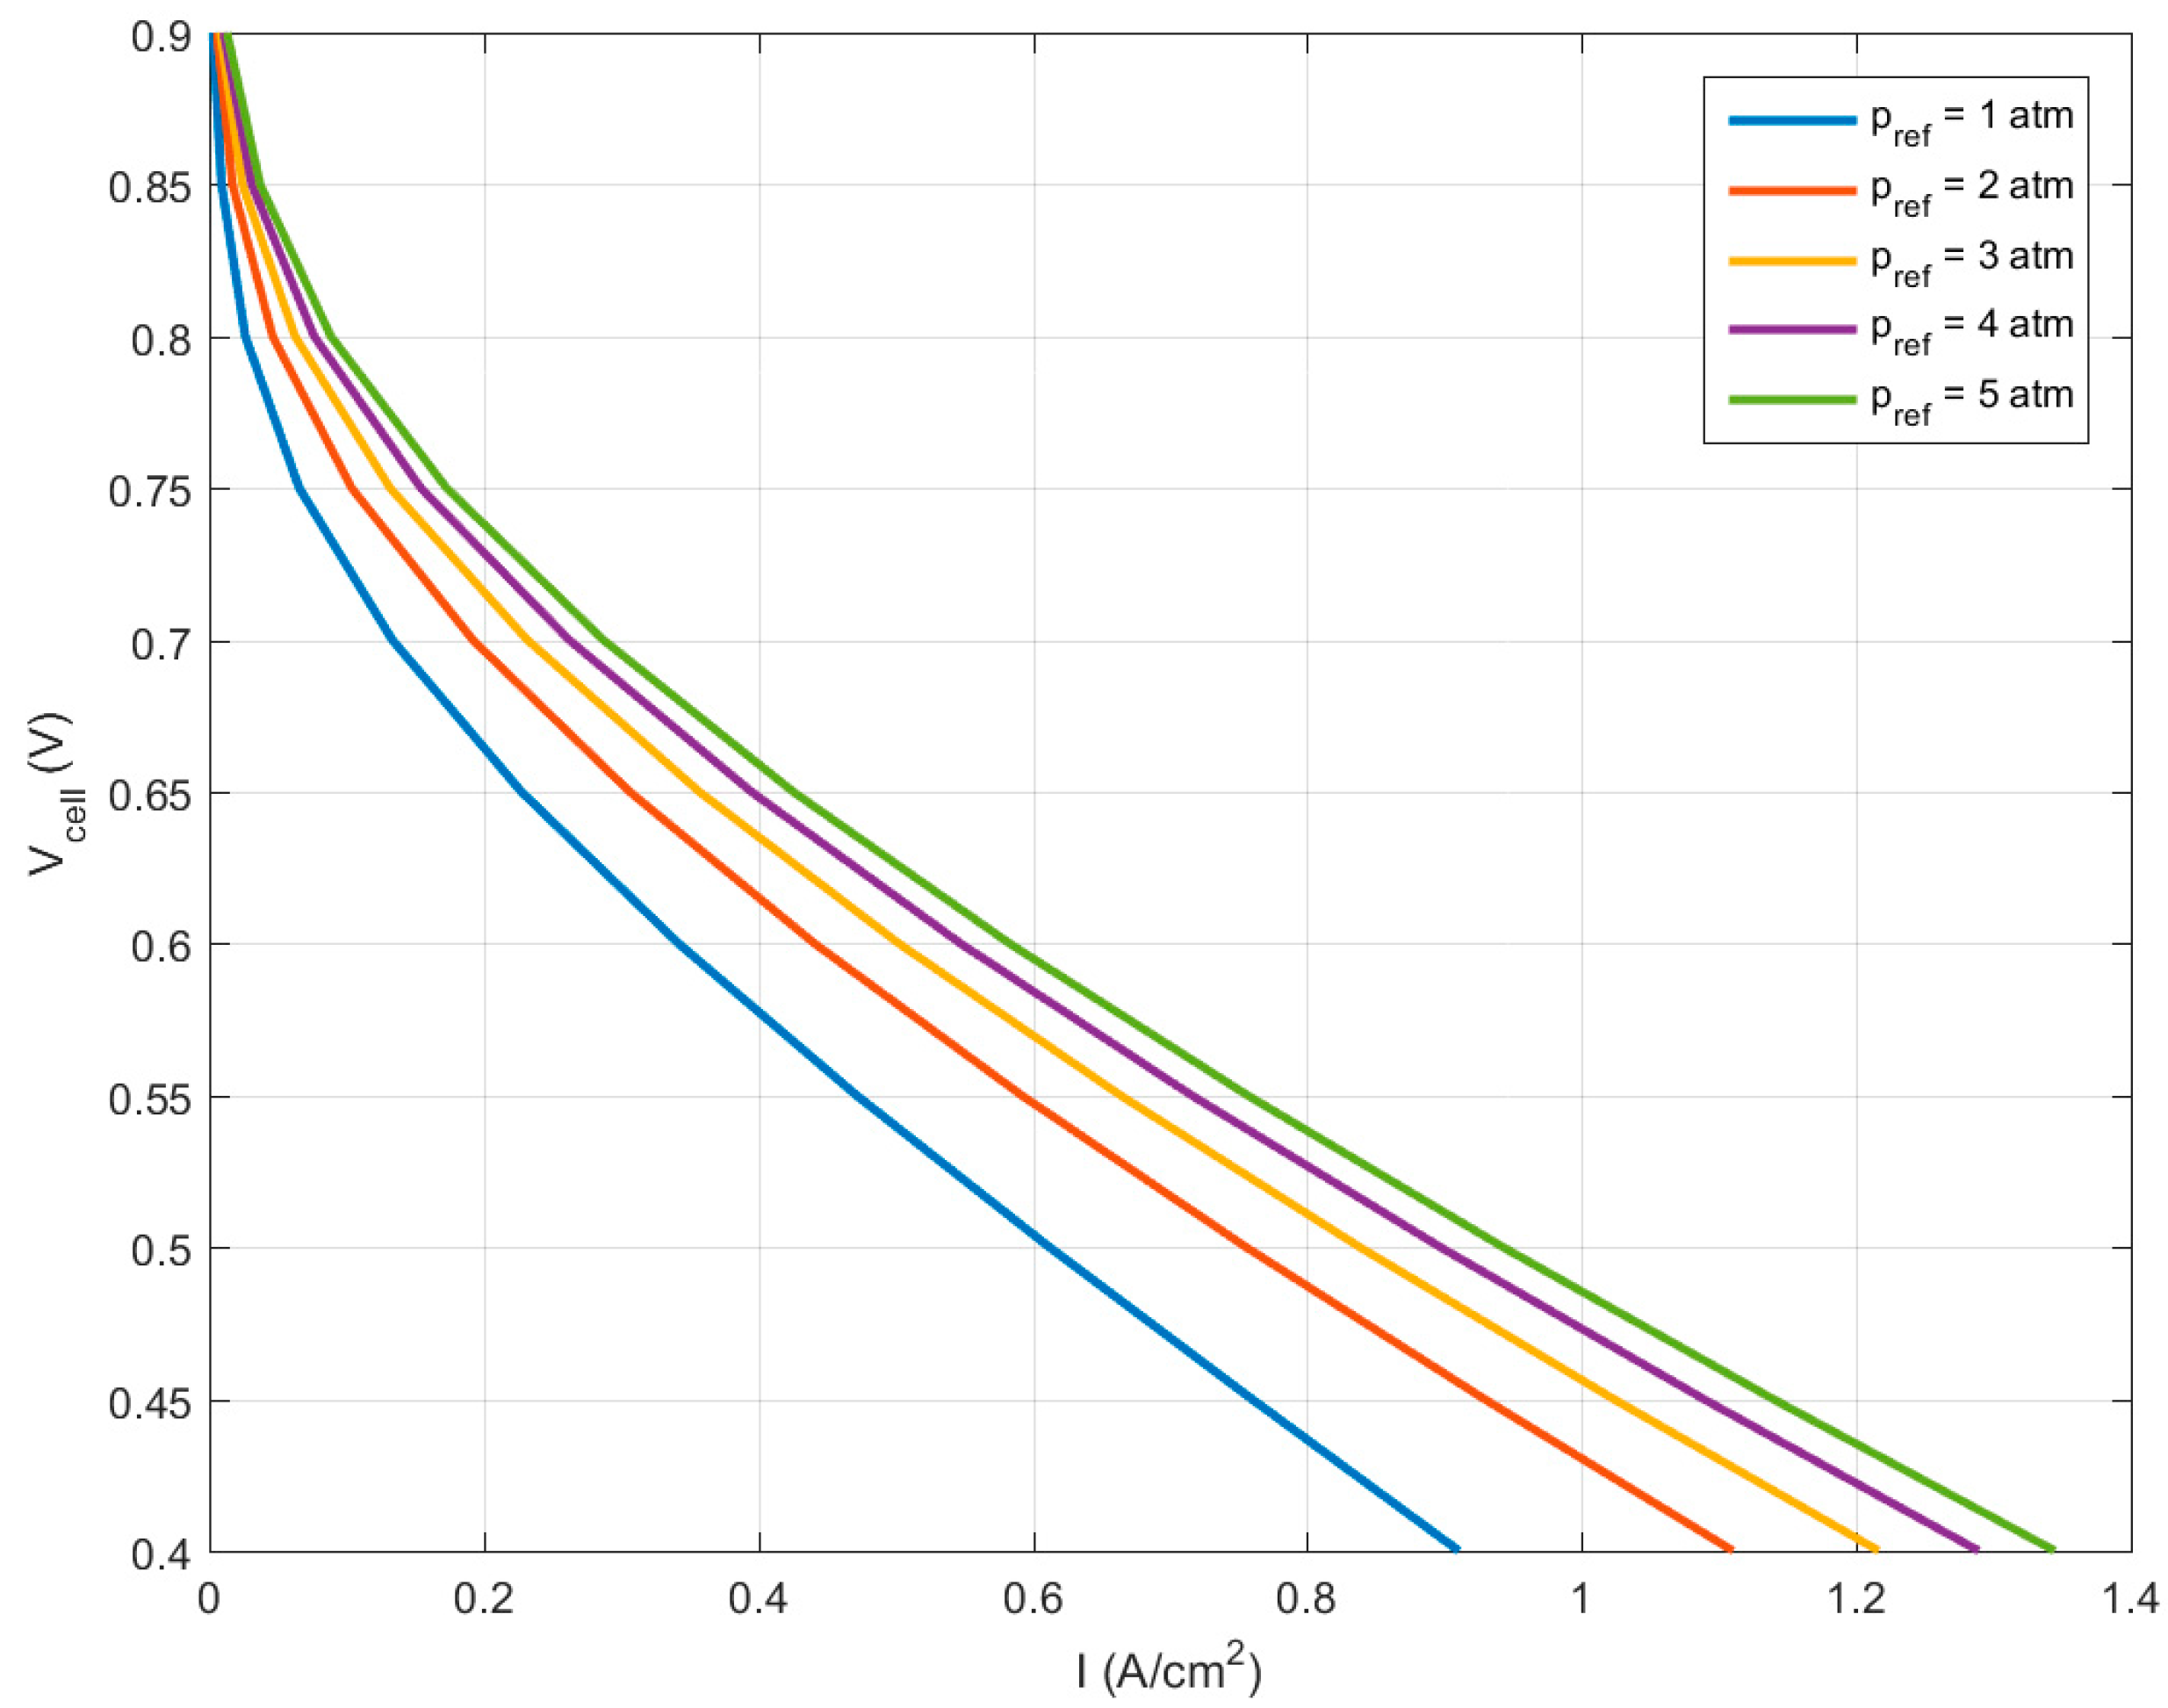
Figure 5 shows the effect of pressure changes on the performance of the fuel cell. In this graph, 5 different operating pressures were investigated. According to the figure, with increasing pressure, the performance of the fuel cell is improved and the fuel cell generated power is increased; at different pressures and at a constant voltage, an increase in the fuel cell generated current can be detected, as the pressure increases, penetration of the reactive gases in the catalyst layer is augmented, which leads to an increment in the flow density.
The concentration of reactive species, namely, hydrogen (
Figure 6a) and oxygen (
Figure 6b), are shown in
Figure 6 at 180 °C and at a voltage of 0.4 V. As can be seen, the highest concentration is at the channel entrance, and the concentration of species decreases towards the channel outlet, as the species entering the anode and cathode channel, the reaction is started and species are consumed to generate current density According to figure, the oxygen concentration along the cathode channel reached from 1.26 to 5.43 mol/m
3 and the hydrogen concentration along the anode channel reached from 25.8 to 25.2 mol/m
3 that indicating a higher concentration of oxygen comparing to hydrogen.
In
Figure 7, the distribution of water concentration in the anode (
Figure 7a) and cathode (
Figure 7b) is shown at 180 °C and at a voltage of 0.4 V. Regarding the figure, it can be seen that the behavior of water dispersion in the cathode and anode channels is different from the dispersion behavior of the species concentration according to
Figure 6. In contrast to species concentration, the lowest concentration of water is observed at the entrance of the channels, and the highest concentration of water is observed in the channel outputs. Because with moving of reactants from the entrance to the outlet, the species is consumed and more water will be generated by the reactions. Water management in fuel cell is critical, so that a substantial decrease in humidity content of the inlet gas causes the membrane to dry and its ionic conduction decreases and, as a result, decreases its performance; in contrast with an excessive increase of the water level in the fuel cell, water droplets create a critical condition that blocks the pores of the porous layers and subsequently prevents the transfer of reactive gases.
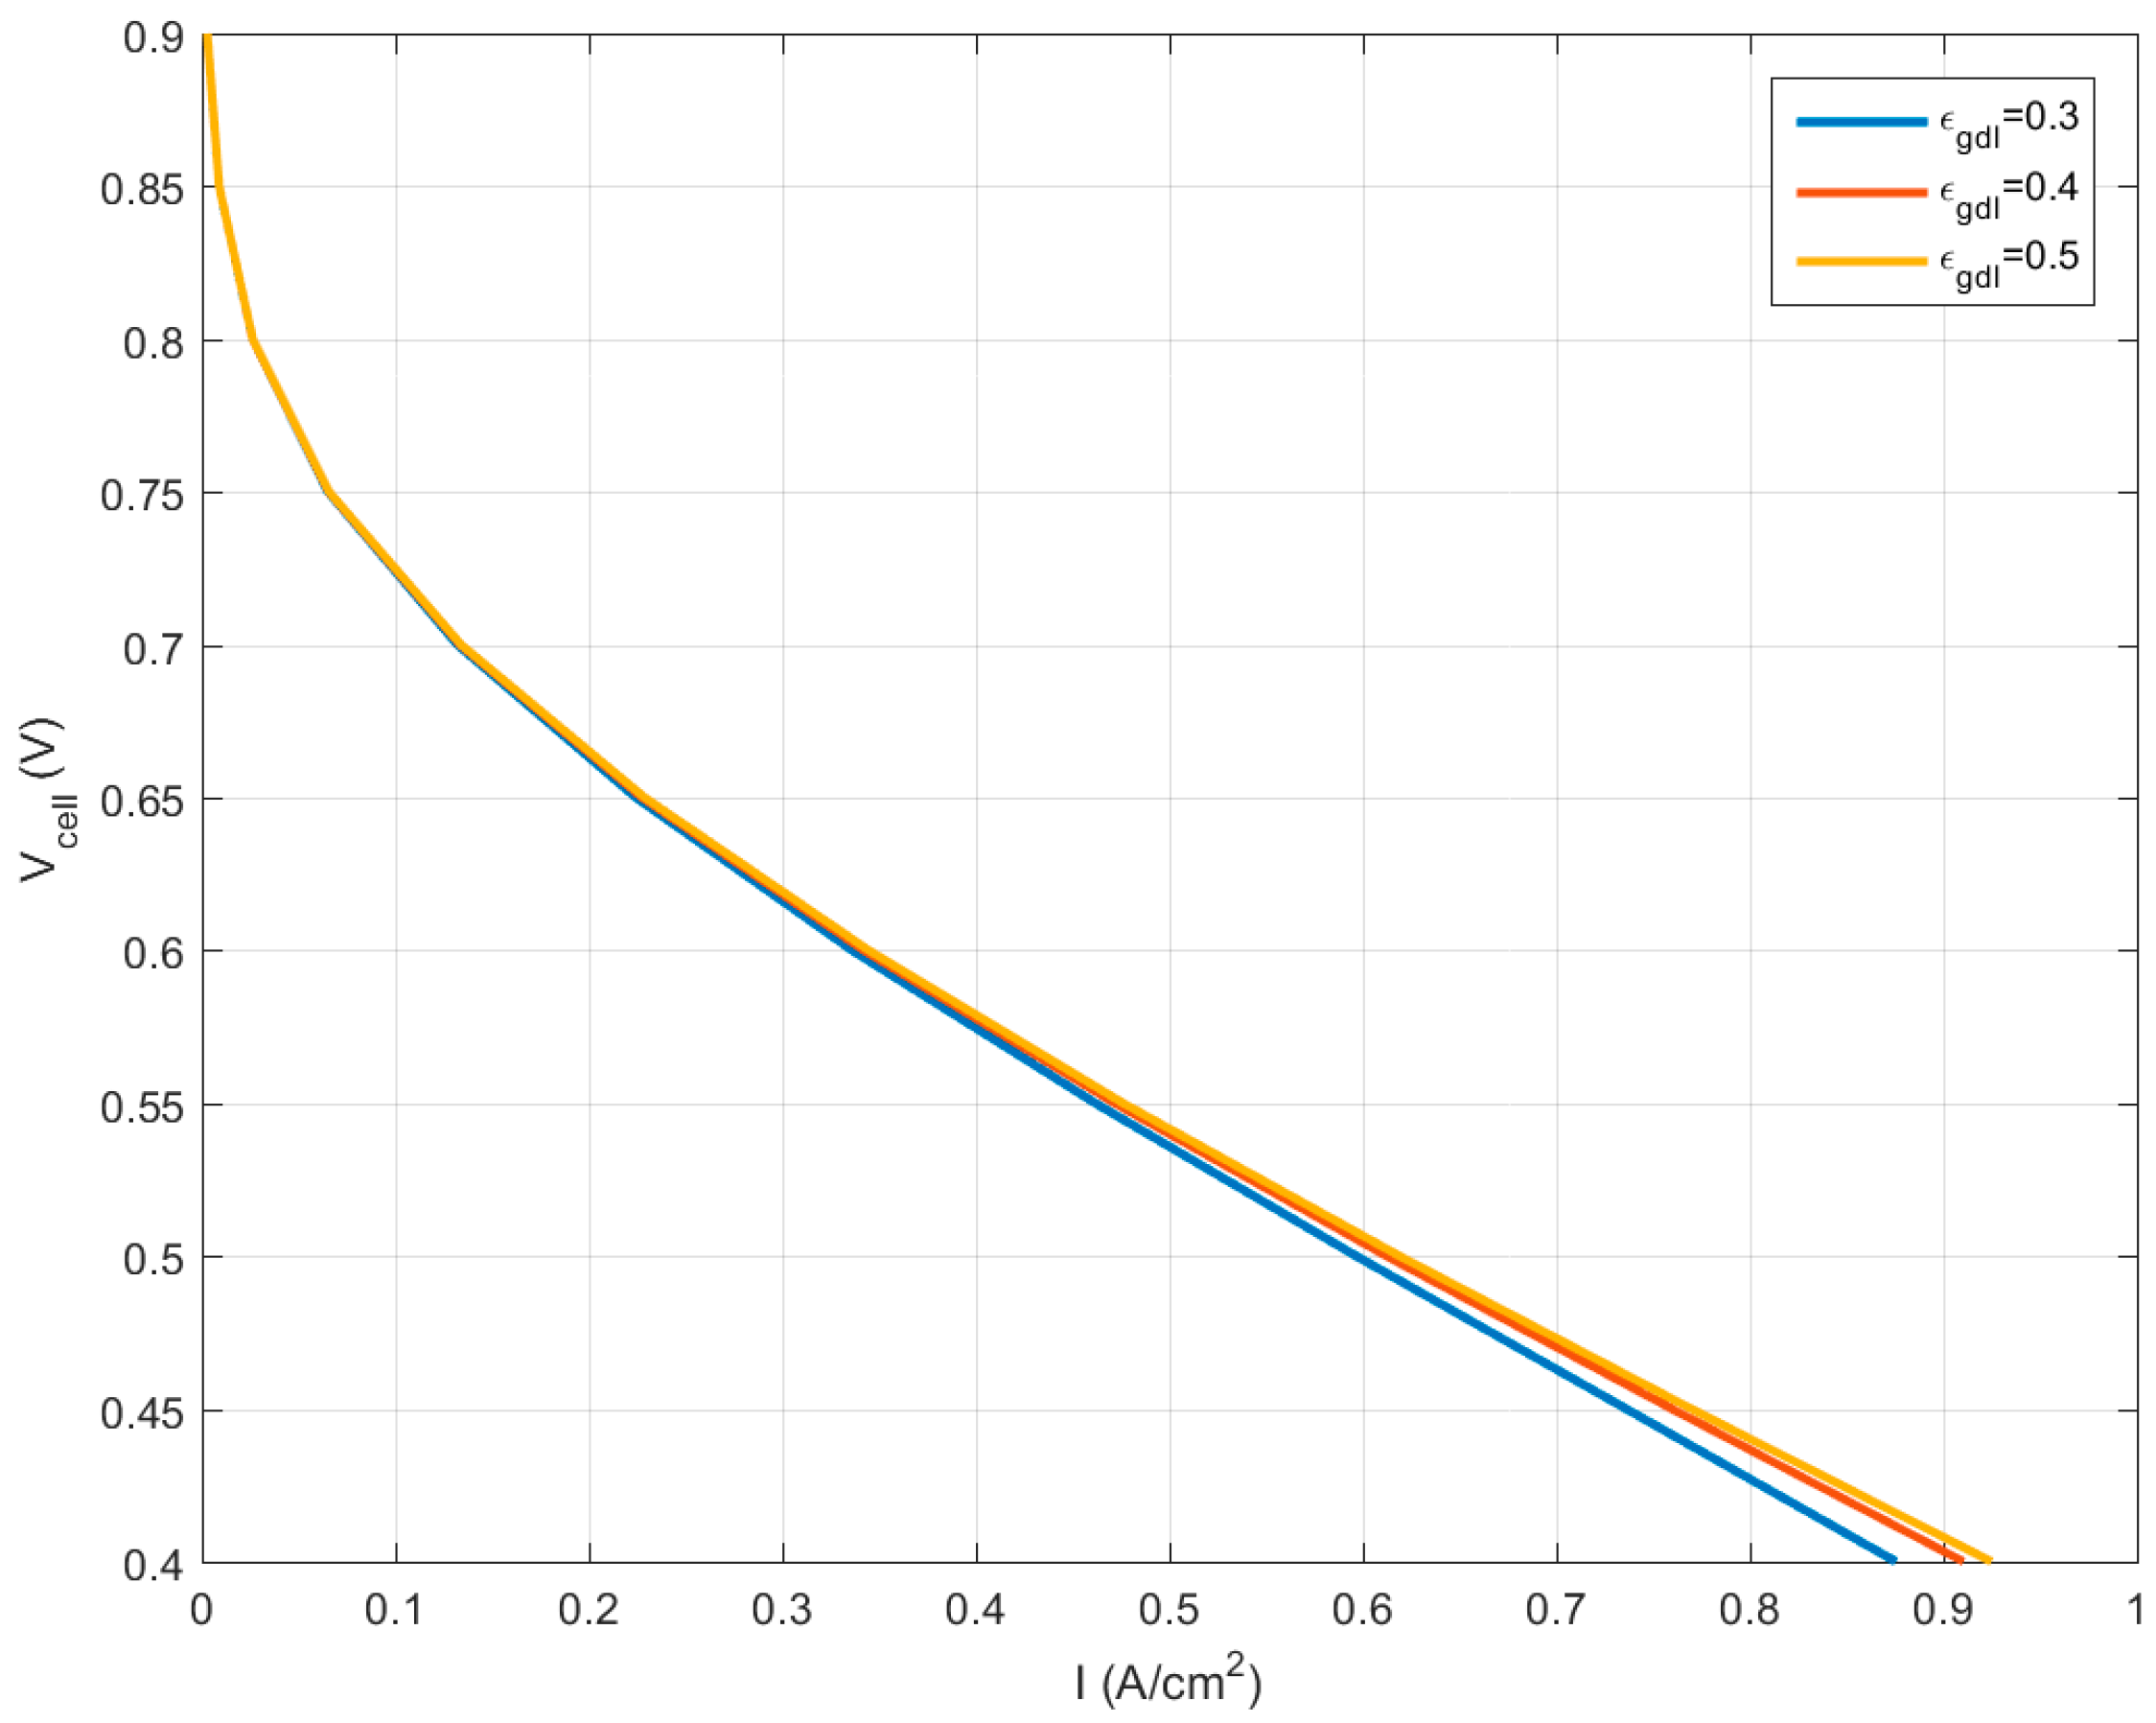
The effect of porosity coefficient of the GDL at 180 °C is shown in
Figure 8. This graph is depicted for three porosity coefficients of 0.3, 0.4, and 0.5. According to this figure, the porosity coefficient has its most impact on the performance of the fuel cell at low voltages, which, with its increase, the fuel cell generated power will be enhanced. But at high voltages, there is no noticeable change, as the species consumption rate is lower at high voltages.
Figure 9 shows the effect of the GDL electrical conductivity coefficient and the membrane ionic conductivity coefficient at 180 °C. According to the figure, with the increase of these two coefficients, the fuel cell performance is significantly improved. As the electrical conductivity coefficient increases, the quantity of electrons transfer is increased through the solid parts of fuel cell and increasing the ionic conductivity coefficient of the membrane will increase the amount of proton transfer by the membrane from the anode side to the cathode side. As can be seen in the figure, the more significant effect of ionic conductivity coefficient is evident compared to the electrical conductivity coefficient.
In
Figure 10, the effect of channel width increment on fuel cell performance is shown. Based on this figure, with increasing channel width, the fuel cell generated power is reduced; as the channel width increases, the inlet velocity of the species decreases, and as a result, the diffusion rate of species will also decrease. The result will be a lower current density generation in the fuel cell.
Figure 11 shows the dispersion of the current density generated by the fuel cell at 180 °C and 0.3, 0.6, and 0.9 V at the membrane surface. As can be seen, at low voltages of 0.3 and 0.6 V, due to the higher input inflow of the species, they penetrate into the reaction spot more and also more species participate in the reaction so that according to the figure, the difference in the amount of current density produced at high and low voltages is quite evident. Therefore, at the channel inlet, the produced current density is lower and this value increases towards the channel output as more and more reactants are consumed (
Figure 11a,b). On the contrary, as the voltage increased to 0.9 V, the produced current density decreased, because at higher voltages, due to the lower input flow rate, the species flowed with less velocity and penetration and almost uniformly along the channel and followed by less reaction, the current density is reduced and the distribution of the current density is almost uniform from the inlet to the outlet (
Figure 11c).

 ,
, 


