1. Introduction
The construction of roads, railways, and municipalities has led to the presence of many exposed slopes. This caused the destruction of ecological diversity, which needs to be restored. The ecological restoration of slopes refers to the process of planting plants to restore the vegetation on those exposed slopes after the treatment of slope reinforcement [
1,
2]. The most effective method of ecological rock slope restoration is soil spraying technology. However, determining which soil spraying technology is the most effective for the ecological restoration of rock slopes has been a difficult problem in slope restoration [
3,
4,
5]. In areas where rainfall is concentrated and intense, the soil mass sprayed onto the slope is often eroded by rain because of its low slip resistance, leading to a poor ecological restoration effect [
6,
7,
8]. To address this problem, many scholars have improved the slip resistance of soil by adding functional materials. We propose that the permeability and shear strength are important indexes for characterizing the slip resistance of borrowed soil [
9,
10,
11,
12,
13].
Research on soil improvement materials has mainly focused on inorganic and organic materials. Common inorganic materials are lime, fly ash, cement, and slag silicate [
14,
15,
16,
17]. These materials improve the soil’s slip resistance by absorbing the water in the soil to form cementitious substances. Thus, the slip resistance of the soil is improved. However, the added inorganic materials affect the growth of plants, which is not conducive to ecological restoration [
18,
19]. In reference to the organic materials, scholars have used modified carboxymethyl cellulose (M-CMC) for the stability treatment of silt. When the content of M-CMC was within the range of 0–1.3%, the shear strength of silt increased as the content increased, but its permeability decreased [
20]. Scholars used xanthan gum biopolymers to treat soil samples, and found that the strength of the soil samples increased, as did their permeability [
21]. Scholars have used the chemical stabilizer RBI-81 to strengthen clay and sand soil, thereby effectively improving the mechanical strength of the soil [
22]. Other scholars have treated soil samples with polyacrylamide (PAM) polymers, and found that the dry density, plasticity index, unconfined compressive strength, and disintegration resistance of the soil samples were improved [
23,
24,
25]. Scholars have also used vinyl acetate polymer to treat soil samples, and found that it enhanced the water-retaining properties, anti-erosion resistance, strength, and durability of soil, and also had a promoting effect on vegetation growth [
26]. Moreover, a styrene-acrylic emulsion was used in physical engineering, and the results indicated that the polymer was beneficial in improving the water-damage resistance so that plants could grow for a long time [
27]. In addition, polymeric materials form thin films in soil. Some scholars have studied the influence of those films on the soil structure. They found that the thin films increased the elastic stiffness of the material, and they established descriptive formulas [
28,
29,
30,
31]. However, these studies were mainly based on experience and lack evidence of the quantitative characterization of the soil mass improvement. Thus, it has remained difficult to conduct quantitative analyses on the improvement effects of restoration efforts in practical engineering applications.
In light of the above deficiencies, we used an aqua-dispersing nano-binder (ADNB) to modify the slip resistance of clay in our laboratory research. Through the research results, quantitative characterization models were established. The improvement mechanism was revealed, and accordingly, the optimal addition amount interval was determined. We then verified the modified models’ rationality and reliability via an engineering application to solve the problem of determining the addition amount through repeated tests due to the lack of a quantitative characterization model in soil improvement. This will promote the popularization and application of this restoration method.
2. Tests on the Effects of ADNB on the Slip Resistance of Borrowed Soil of Rock Slopes
2.1. Test Objective
The purpose of this test was to obtain the change trend of the modified clay’s parameters, including the grain composition, permeability, and shear strength. We examined the influence of ADNB on the slip resistance, and then revealed the mechanism of the interaction between ADNB and soil.
2.2. Test Principle
ADNB is an organic polymer. By spreading and cementation in soil, ADNB covers the soil particles. Thus, it affects the soil grain size composition and structure. This changes the permeability and strength. It is worth noting that different contents and application processes will influence the interactions between ADNB and soil. Therefore, in this paper, ADNB was added to the clay at contents of 0%, 0.05%, 0.1%, 0.25%, 0.5%, 1%, 2.5%, and 5% of the soil mass, given the two application processes of mixing and spraying. Then, particle analysis, permeability, and direct shear tests were carried out to examine the change trend of the related soil parameters.
2.3. Test Materials
2.3.1. Aqua-Dispersing Nano-Binder
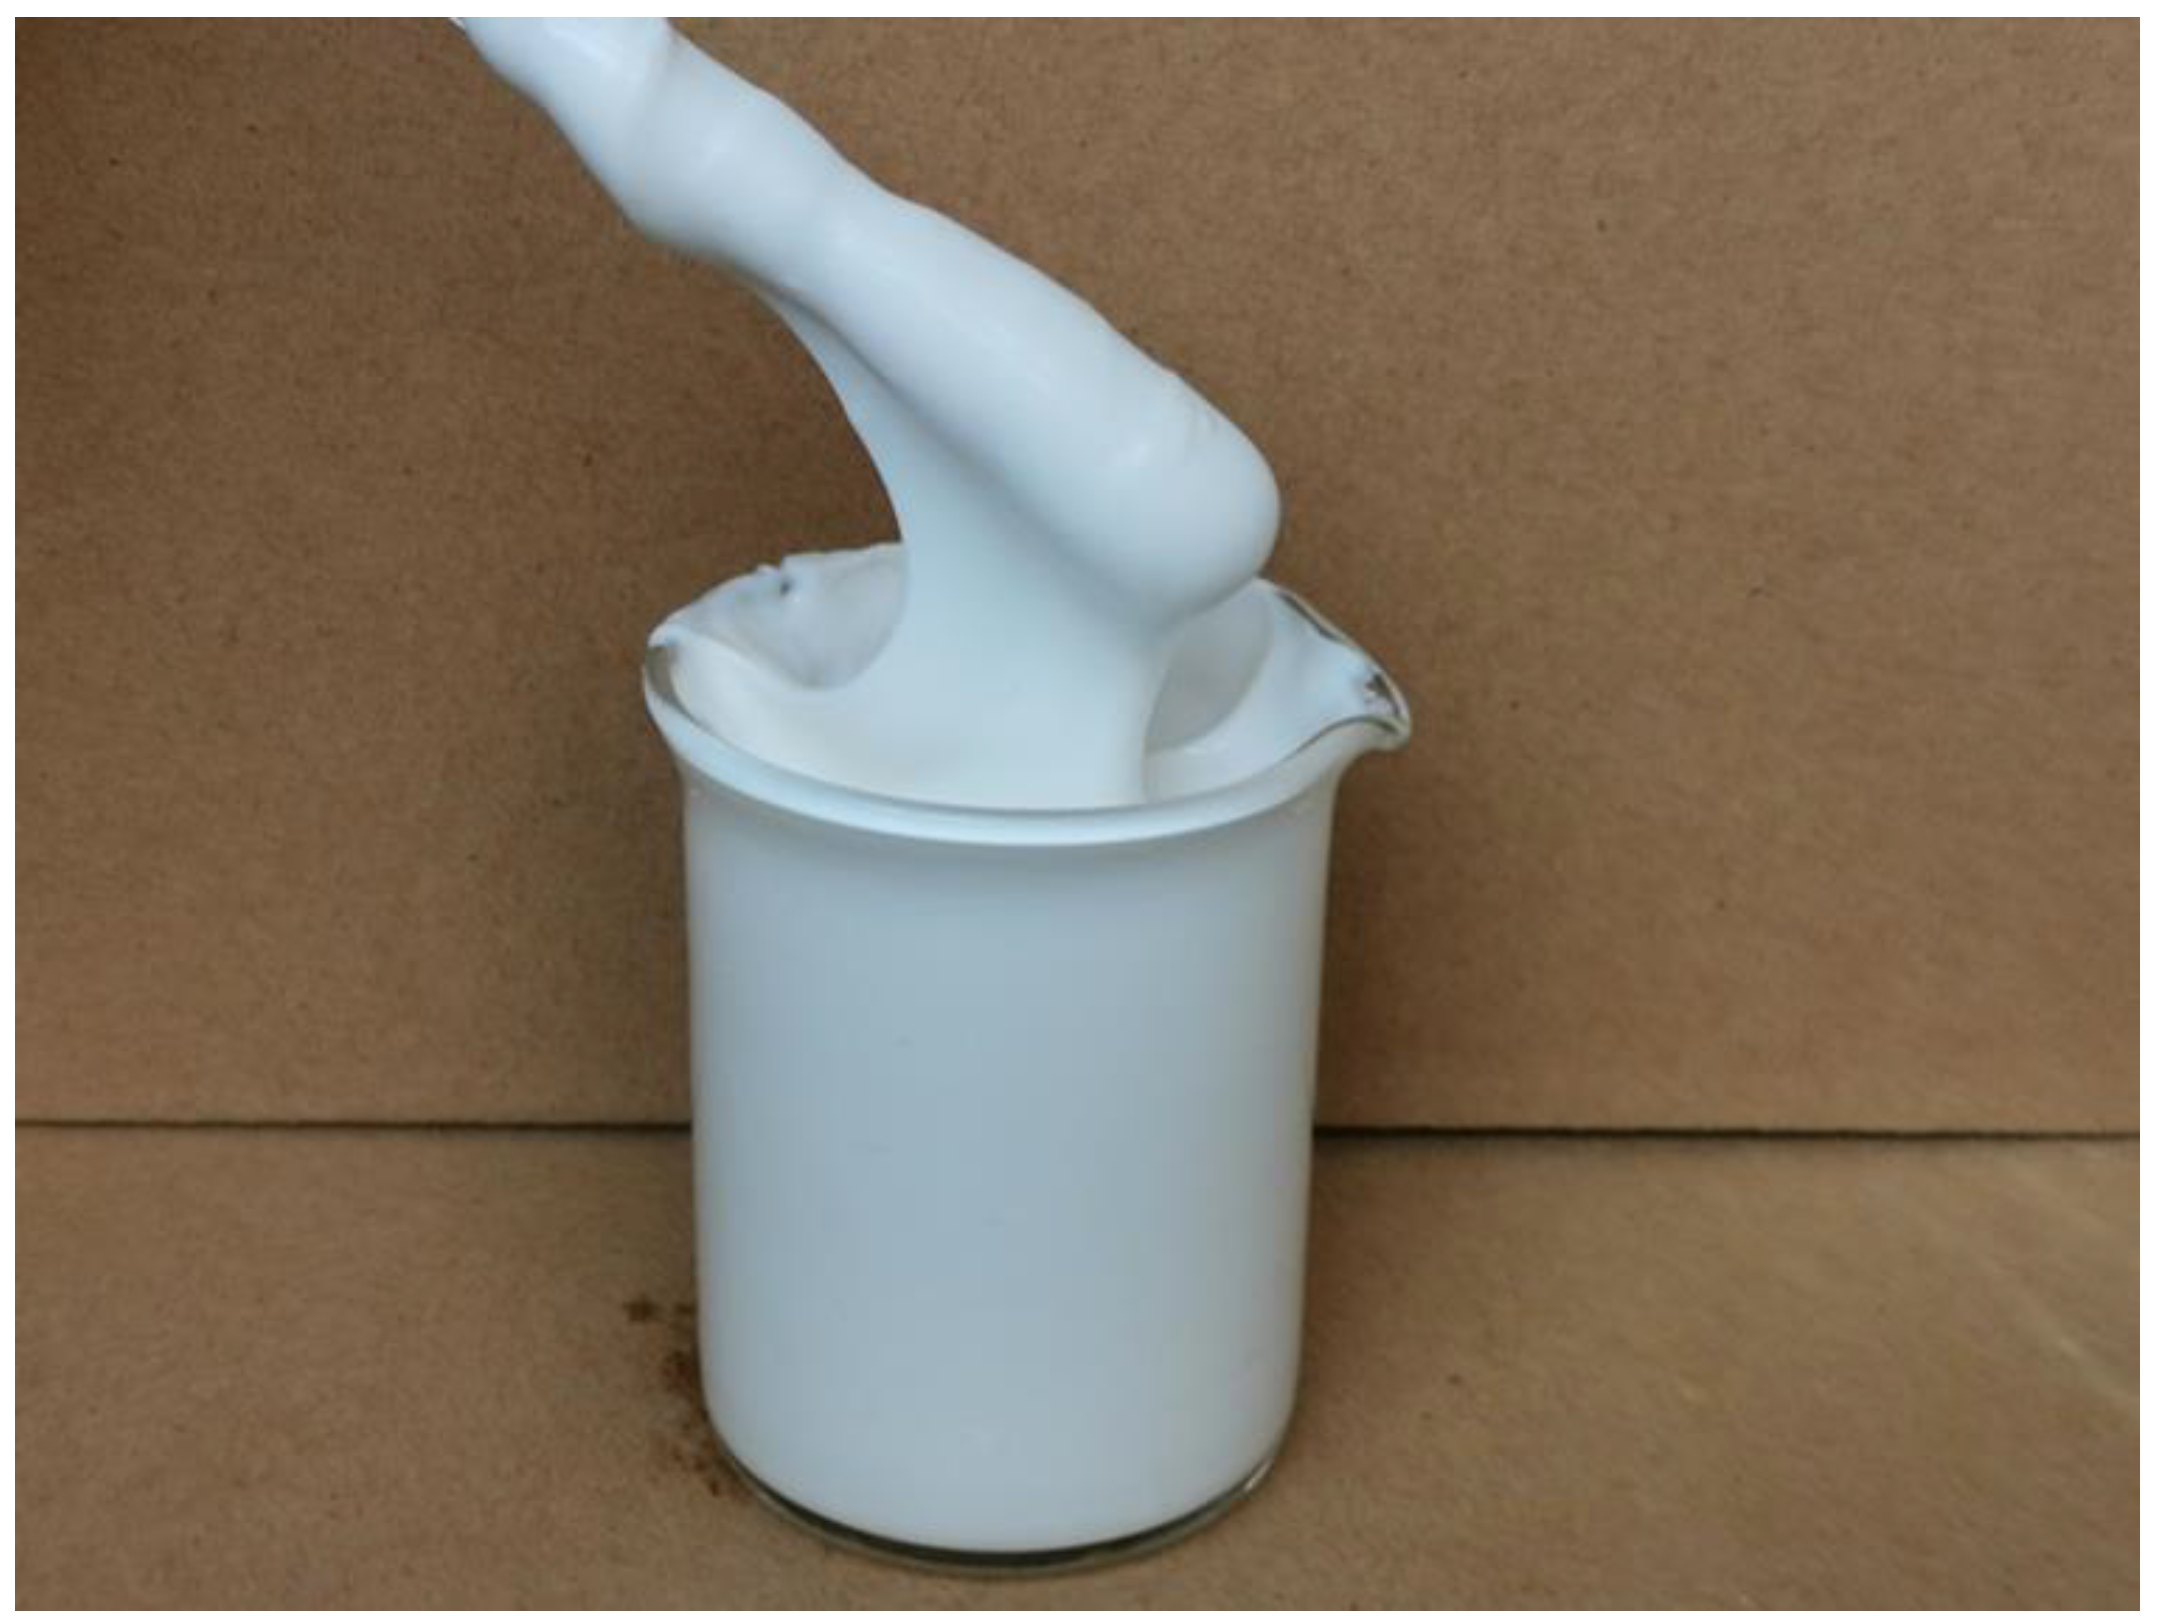
The organic polymer emulsion named ADNB is widely used in the lumber, construction, papermaking, and other industries due to its high bonding strength, high cementing speed, low price, and resistance to ageing. ADNB is a milky colloidal substance at room temperature (
Figure 1), and it occurs in the form of dispersed latex particles in water. The main component of ADNB is modified polyvinyl acetate. In our previous studies, we proved that the degradation time of ADNB was about 24 months. It could continue to act on 2 growth cycles of vegetation, and its final degradation products were CO
2 and H
2O. Therefore, ADNB is harmless to the environment. It can promote the growth and development of vegetation, and has a good effect on the ecological restoration of slopes [
32,
33]. However, it still has shortcomings. Therefore, we carried out a quantitative characterization study on the influence of ADNB on the slip resistance of rock slopes.
The basic parameters of ADNB are shown in
Table 1.
2.3.2. Clay
The soil used in the tests was Quaternary Holocene residual clay with a yellow-brown color (
Figure 2). It was taken from a construction site in Southern China. Its basic physical parameters are shown in
Table 2. To ensure uniformity, the soil was dried to a constant weight at 105 °C and then screened with a sieve with a diameter of 5 mm.
2.3.3. Sample Preparation
The samples used in the particle analysis experiments were prepared by two processes and were divided into two groups—the mixing group and spraying group—with eight samples in each group. For each sample, 500 g of soil sample was collected. Then, ADNB with a mass percentage of 0%, 0.05%, 0.1%, 0.25%, 0.5%, 1%, 2.5%, and 5% relative to the soil sample was used. The amount of water required was weighed according to the designed moisture content, and the ADNB and water were mixed evenly to make a dispersed liquid. In the mixing group, the dispersed liquid and soil samples were mixed evenly. In the spraying group, the dispersed liquid was sprayed on the sample surface.
In the permeability tests, ring cutters with inner diameters of 61.8 mm and heights of 40 mm were used to prepare the samples. There were 16 test groups and three samples in each group. Ring cutters with inner diameter of 61.8 mm and height of 20 mm were used in the direct shear tests. There were 16 test groups and four samples in each group. The samples of the two tests were also divided into a mixing group and a spraying group. According to the natural density and natural moisture content of soil mass, combined with the volume of ring cutter, we calculated the mass of dry soil needed for each ring cutter and weighed them one-by-one. When the soil was compacted into the ring cutter, the density was consistent with the natural density of the soil mass. Then, ADNB with a mass percentage of 0%, 0.05%, 0.1%, 0.25%, 0.5%, 1%, 2.5%, and 5% relative to the soil sample was used. In the same way, the amount of water required was weighed according to the designed moisture content. The two fluids were mixed evenly to obtain a dispersed liquid. For the mixing group, the dispersed liquid was mixed with the soil samples thoroughly. Then, the wet soil was filled into the ring cutter in five layers, and each layer was compacted evenly. For the spraying group, first, the dry soil was loaded into the ring cutter in five layers and each layer was compacted evenly, and then the dispersed liquid was sprayed onto the surface of the sample.
After sample preparation was finished, the samples were placed in a humidifier and allowed to stand for 24 h, allowing the material to fully interact with the soil. The designed moisture content of all tests was 25.26%. This value was consistent with the natural moisture content.
2.4. Particle Analysis Tests
In this section, particle analysis tests were conducted to study the gradation of the particles after adding ADNB to the soil mass. The screens used in the experiments were 5, 2, 1, 0.5, 0.25, and 0.075 mm in diameter. The soil samples were put into the oven and dried to a constant weight at 105 °C. After grinding, the samples were screened. The soil mass on each sieve was measured.
Grading curves of the particles were drawn according to the test results (
Figure 3). The uniformity and sorting degrees of the soil can be judged by the particle grading curves—the higher the slope of the curve, the higher the mass percentage of the soil particles in a certain group.
In the two application processes, the slope of the grading curve of the particles increased successively with increasing ADNB content, as shown in
Figure 3a,b. This indicated that the proportion of large-diameter particles in the sample was increasing. In general, as shown in
Figure 3c, the curves of both the mixing and spraying groups increased with increasing ADNB content. Moreover, the slope of the mixing group was higher than that of the spraying group. From these results, it can be seen that the soil particles were effectively bonded in both processes. The mixing process had a stronger cohesion effect.
2.5. Permeability Tests
The effect of ADNB on the soil permeability was studied by using a falling head permeameter. Before starting the tests, the samples were loaded into a vacuum cylinder and the air was pumped out for 24 h before saturation. After the tests were completed, the permeability coefficients of the samples were calculated according to Equation (1):
where
KT is the permeability coefficient (cm/s);
a is the cross-sectional area of the variable head pipe (cm
2);
L is the length of the seepage path (cm);
A is the cross-sectional area (cm
2) of the sample (cm
2);
t is the time interval between the beginning and the end of the measurement (s);
H1 is the water head at the beginning of the measurement (cm); and
H2 is the water head at the end of the measurement (cm).
According to the test results, curves of the relationship between the permeability coefficient and the ADNB content were plotted (
Figure 4).
In the different application processes, the influence of ADNB on the soil permeability coefficient was significantly different, as shown in
Figure 4. The permeability coefficient in the mixing group increased continuously with increasing material content. However, the permeability coefficient in the spraying group first increased, then decreased, and finally levelled off. Overall, within a narrow content range, the application of ADNB in the two processes could improve the soil permeability.
2.6. Shear Strength Tests
The influence of ADNB on the soil shear strength was studied by direct shear tests. The test instrument was a four-connected direct shear instrument, able to shear four samples at the same time. The vertical pressures applied to the samples were 50, 100, 200, and 400 kPa. The shear velocity was set at 0.8 mm/min, and dynamometer and displacement readings were recorded when 0.2 mm shear displacement was generated.
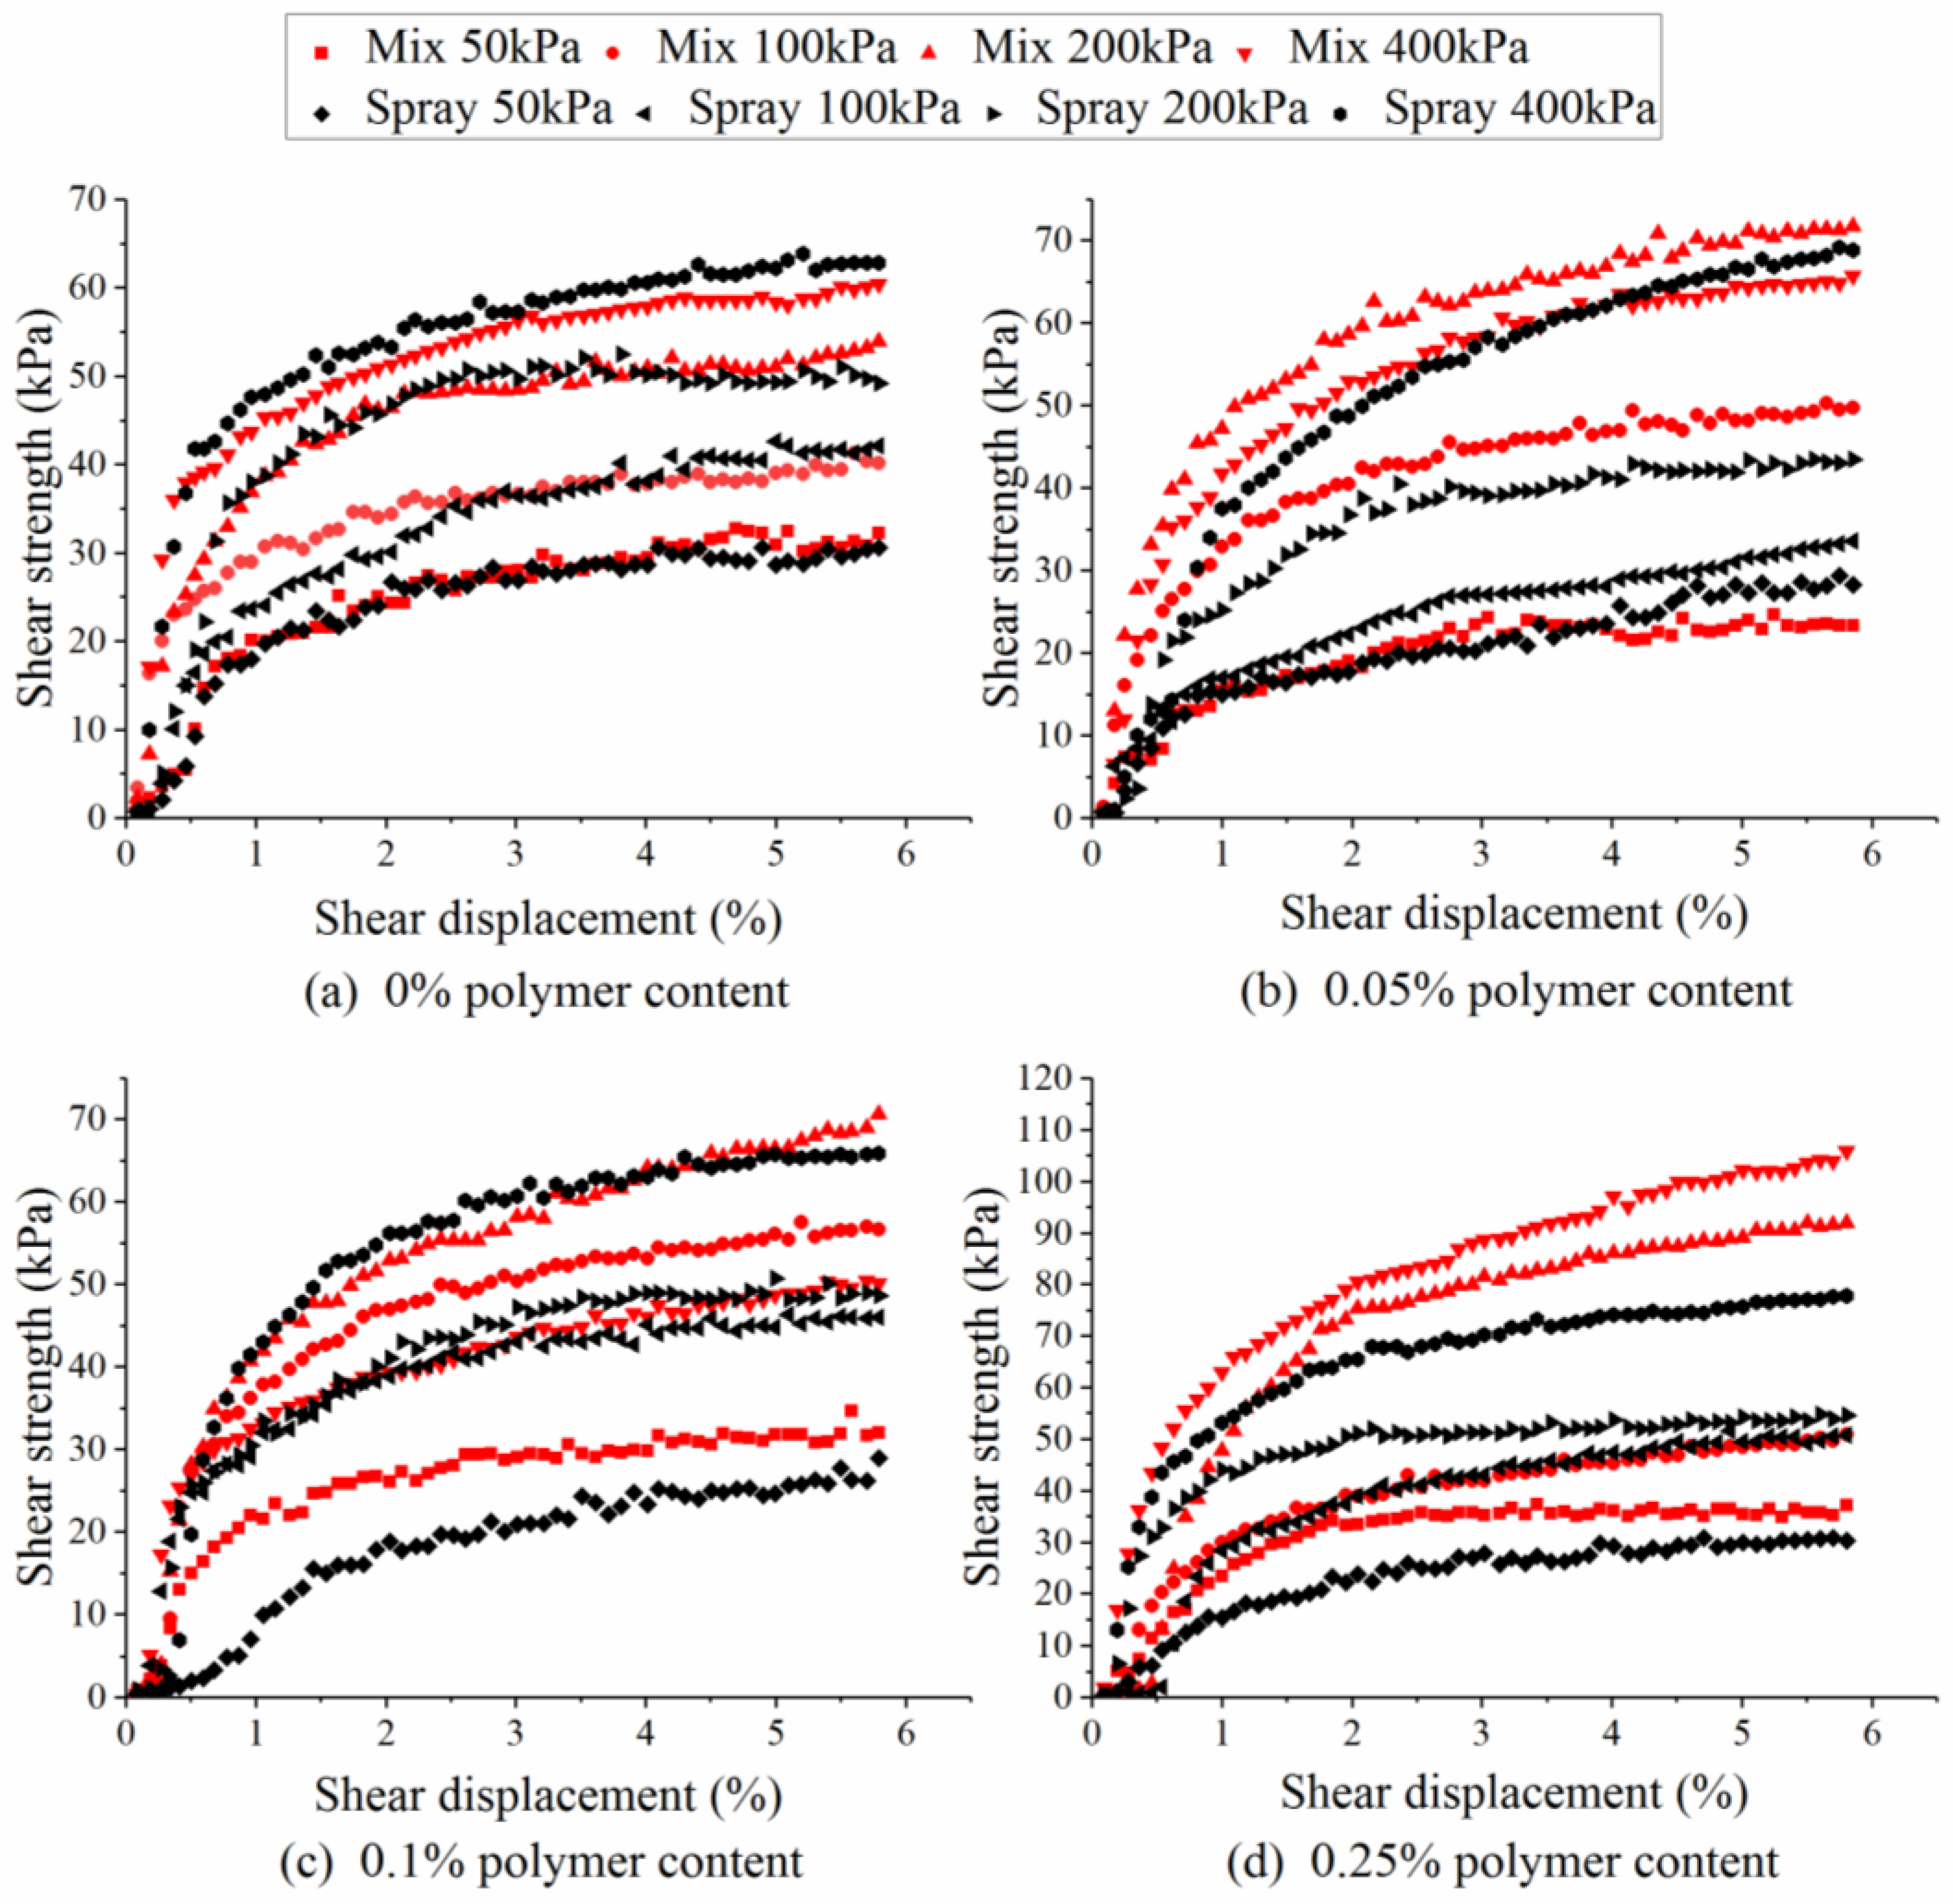
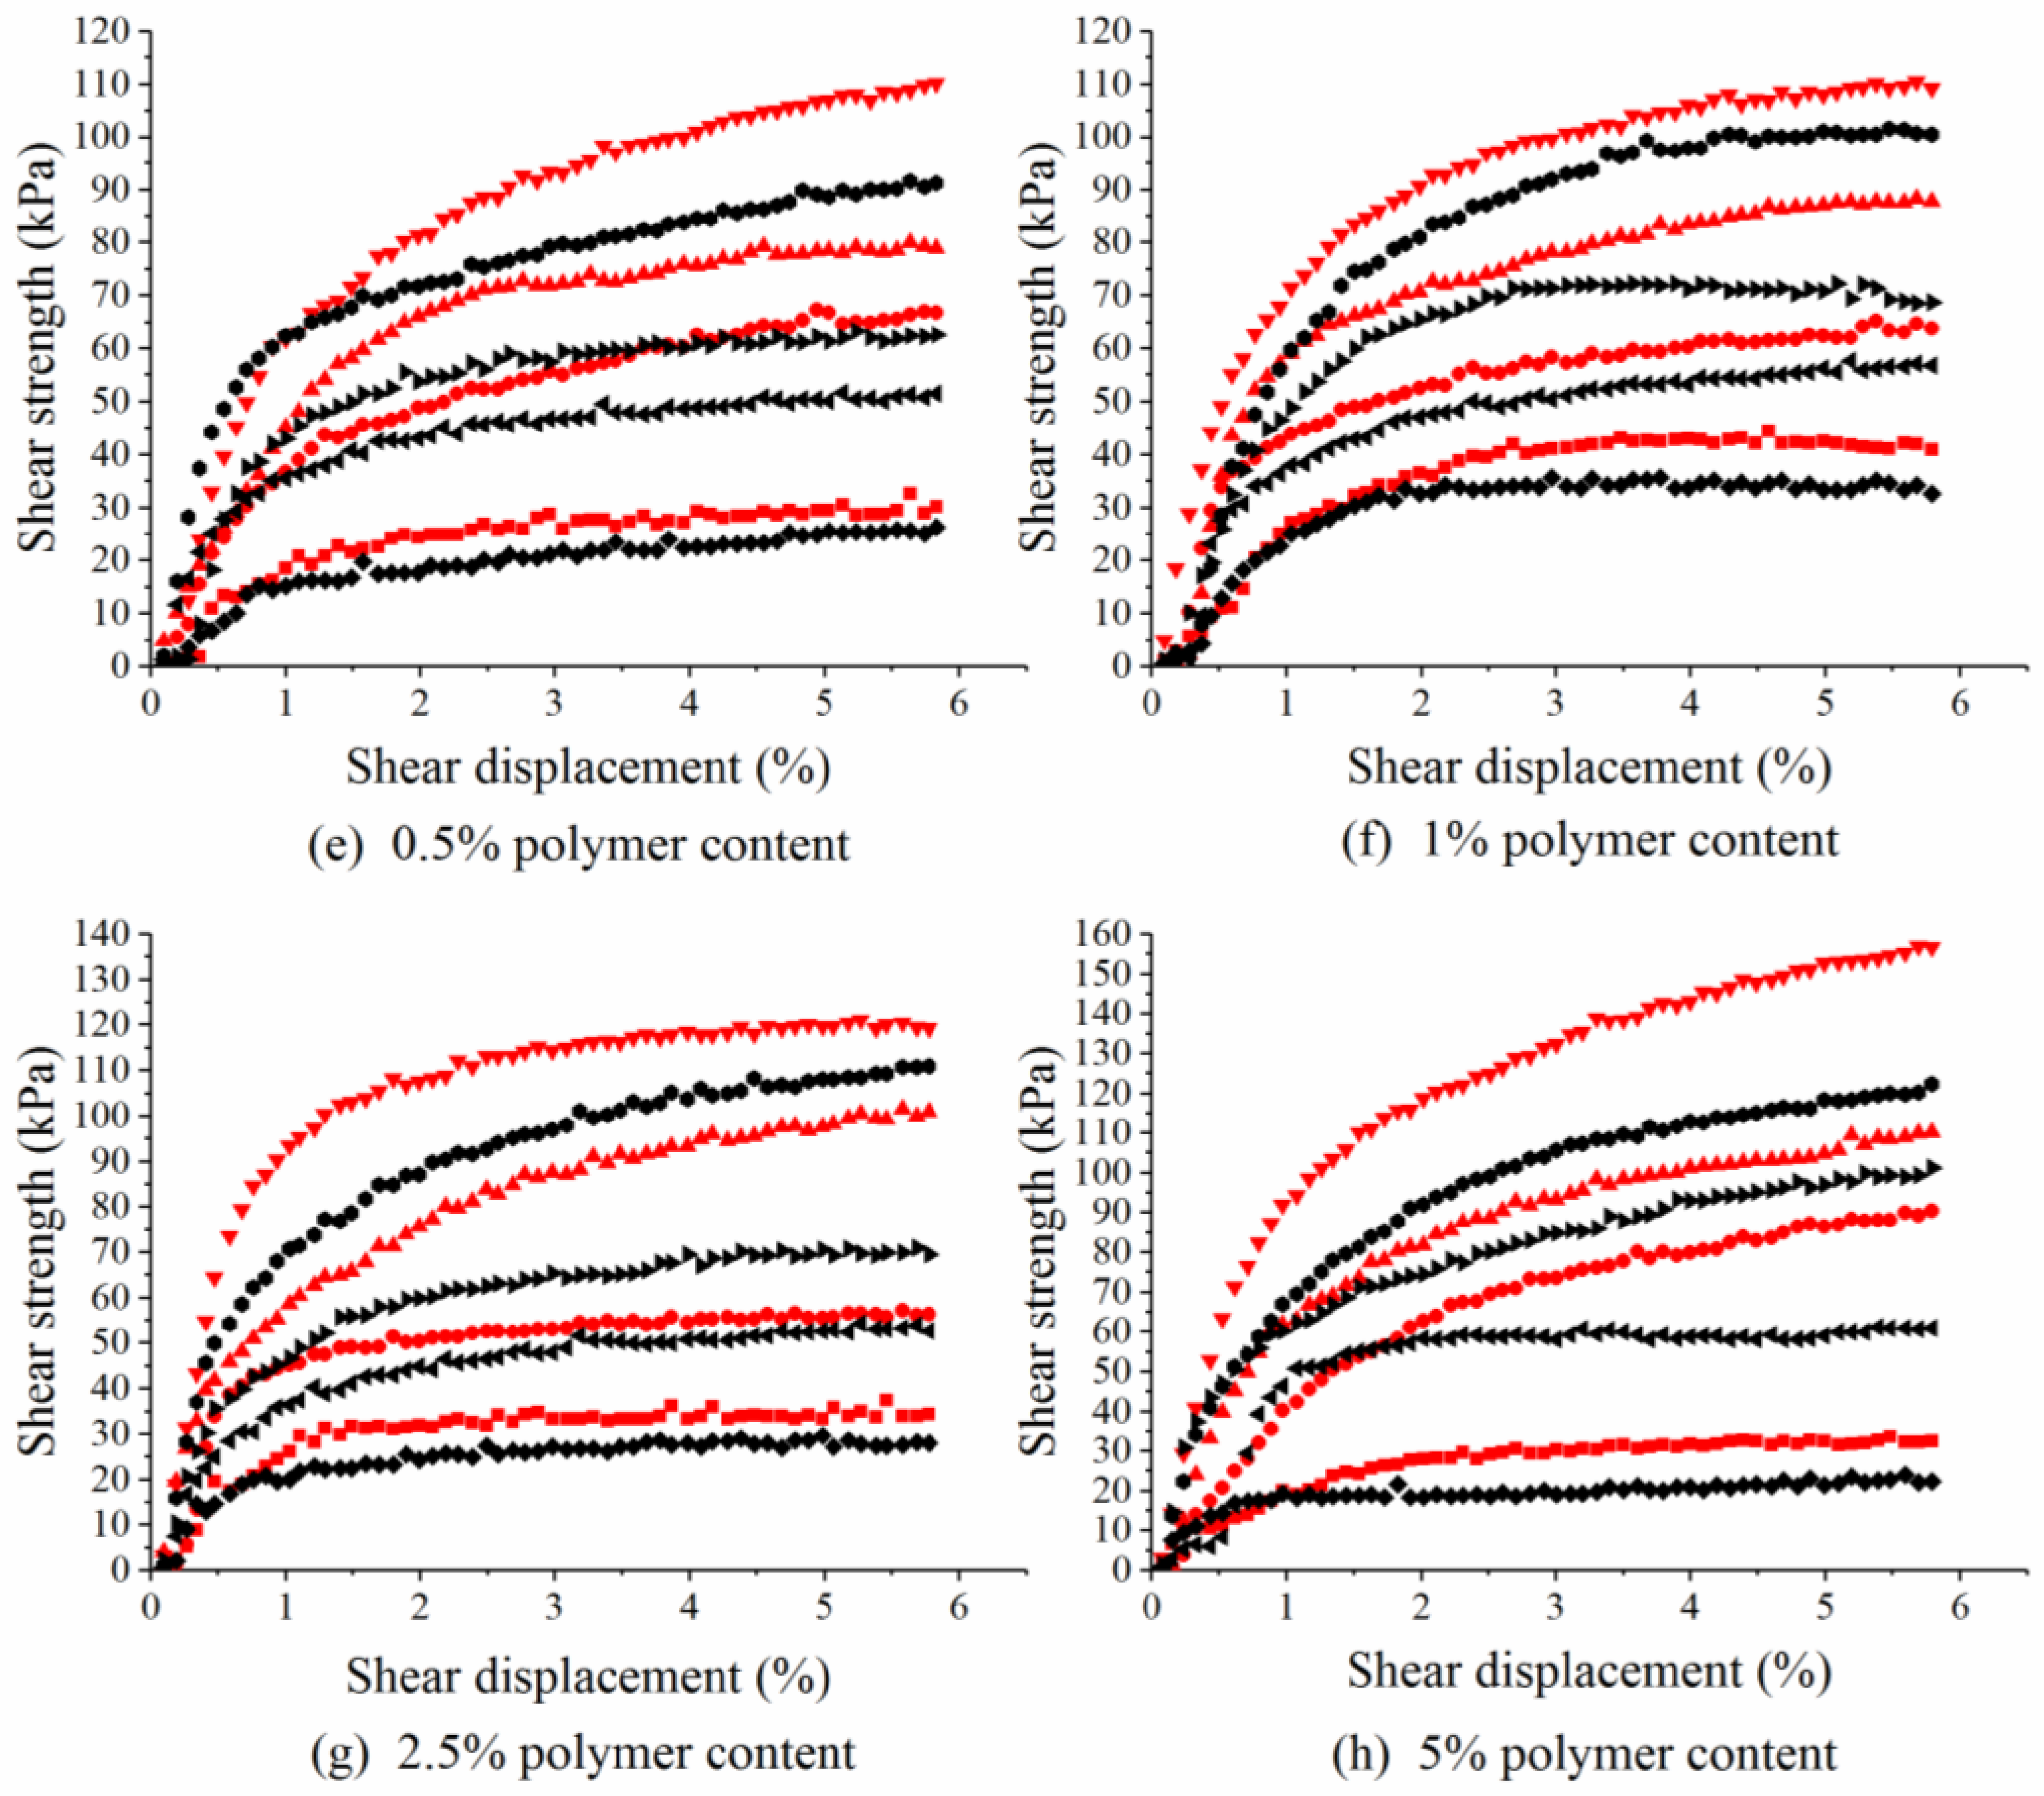
The influence of ADNB on the shear strength of clay is shown in
Figure 5.
The shear stress–shear displacement curves of the two groups of soil samples with a polymer content of 0% were basically identical, as shown in
Figure 5a. This indicated that their shear strength was basically the same. Therefore, the sample preparation method had little influence on the soil shear strength. However, as shown in
Figure 5b–h, the shear strength of the samples increased with increasing ADNB content in the two application processes. This indicated that the shear strength of the soil was improved after the treatment. It also indicated that the shear strength of the soil samples could be improved by the two application processes. However, for the same content and vertical pressure, the shear stress–shear displacement curves of the mixing group were always above those of the spraying group; that is, the improvement effect of the mixing process was better than that of the spraying process.
According to the shear stress–shear displacement curves, Mohr stress circles were plotted (
Figure 6). The values of cohesive force
c and internal friction angle
φ of the soil samples were obtained by the tangent line of the Mohr circles.
2.7. Analysis of the Test Results
Through the above three tests, the influence law of ADNB on the slip resistance of soil was obtained.
Table 3 lists the values of the average particle diameter, permeability coefficient, cohesive force, and internal friction angle of the soil samples for the different contents and application processes.
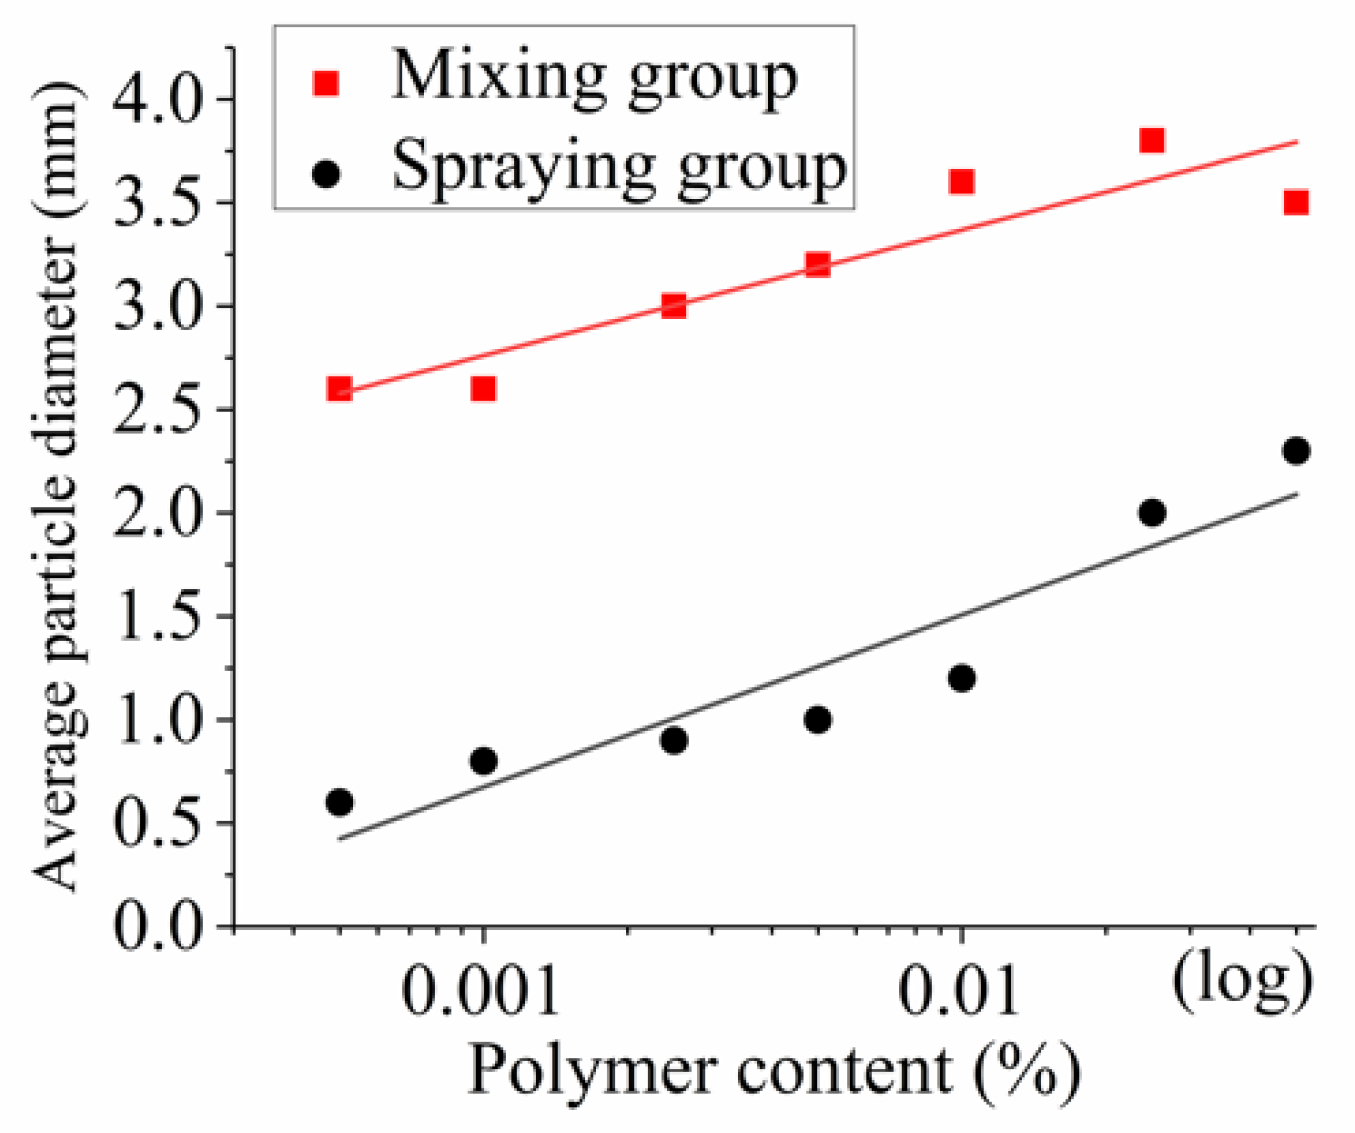
The average particle diameter d50 is the value at which the content of particles larger or smaller than this diameter in the soil sample accounts for 50%. The d50 can be used to measure the soil thickness. ADNB agglomerated the very small particles into large aggregate structure units. Therefore, the average particle diameter of the soil samples increased. The mass ratio of the large-diameter particle group in the soil samples was improved. Compared with the blank group (i.e., the 0% polymer content group), the average particle diameter of the soil samples in both groups increased. The average particle diameter of the mixing group increased by 2.3–3.2 mm, and that of the spraying group increased by 0.2–1.9 mm.
In regard to the permeability, the permeability coefficient of the 5% mixing group increased by 2147% compared with the 0% mixing group. This was the largest increase. The permeability coefficient of the spraying group first increased and then decreased. When the content was 0.1%, the permeability coefficient reached a peak. Compared with the 0% spraying group, the increase was 243%. After the content became higher than 0.1%, the permeability coefficient presented a downward trend and then tended to be stable. When the content was 5%, the permeability coefficient was the lowest. Its value was 97% lower than that of the 0% spraying group.
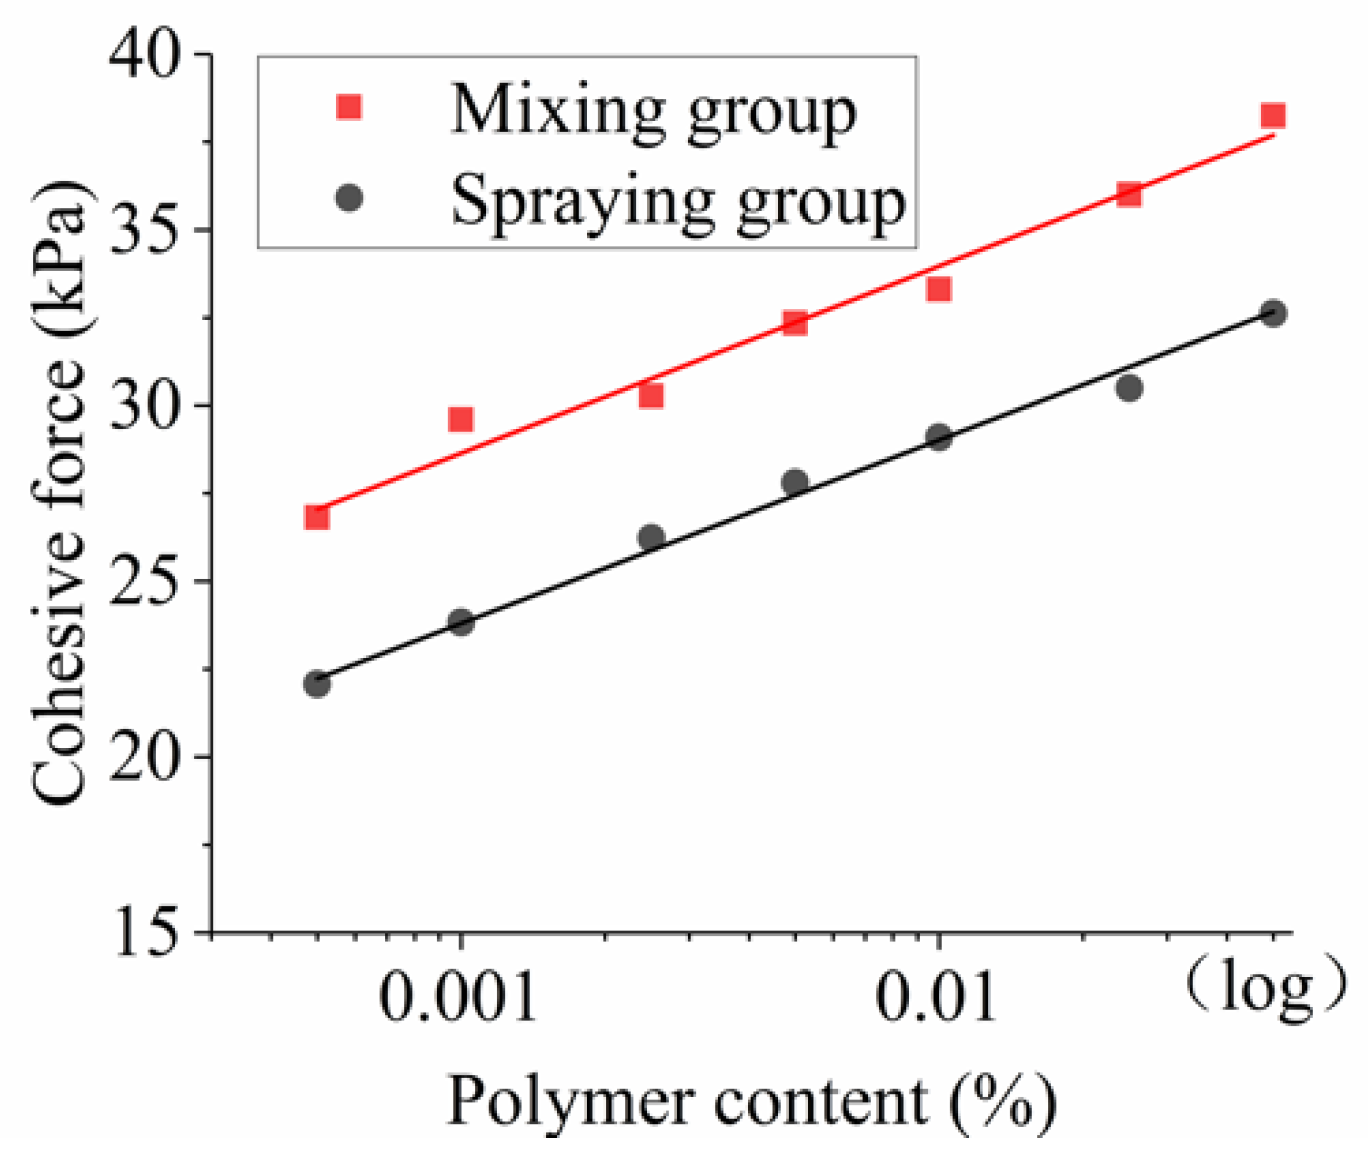
In terms of the cohesive force, the c value of the 0% mixing group was only 19.0 kPa, and the c value of the 5% mixing group was 38.2 kPa. It was 101% higher than that of the 0% mixing group. The c value of the 0% spraying group was only 19.1 kPa, but that of the 5% spraying group was 32.6 kPa. It was 71% higher than that of the 0% spaying group. With regards to the internal friction angle, that of the 5% mixing group increased the most (i.e., an increase of 79% compared to the 0% mixing group). The increase in the internal friction angle of the spraying group was small. The 5% ADNB content resulted in the largest increase—only 21% higher than that of the 0% group.
Overall, the average particle diameter, permeability coefficient, cohesive force, and internal friction angle of the clay increased significantly after the soil was treated. These effects enhanced the slip resistance of the soil. In addition, both application processes were effective for soil improvement. The improvement of the mixing process was better.
3. Quantitative Characterization of the ADNB Effects on the Slip Resistance of Borrowed Soil of Rock Slopes
Based on the test results, quantitative characterization models were established to describe the influence of ADNB on the slip resistance of the borrowed soil of rock slopes.
Relationship diagrams of the average particle diameter, cohesive force, internal friction angle, and ADNB content were plotted in the single-logarithmic coordinate system (
Figure 7,
Figure 8 and
Figure 9, respectively). A relationship diagram of the permeability coefficient and the content of ADNB was plotted in the Cartesian coordinate system (
Figure 10). Through data fitting, the quantitative characterization models were obtained as follows:
where
and
are the average particle diameters of the mixing and spraying groups, respectively (mm);
and
are the cohesive forces of the mixing and spraying groups, respectively (kPa);
and
are the internal friction angles of the mixing and spraying groups, respectively (°);
and
are the permeability coefficients of the mixing and spraying groups, respectively (cm/s);
is the content of ADNB (%); and
R is the correlation coefficient. Finally, the value corresponding to the 0% group is represented by superscript symbols in the equations.
Equations (2)–(5) describe the change trends of the average particle diameter, permeability coefficient, cohesive force, and internal friction angle after soil improvement. Most of the R values were close to 1, and thus the correlation as a result of data fitting is reliable.
According to the Mohr–Coulomb principle, as shown in Equation (6), the shear strength of soil was determined by the cohesive force and internal friction angle. By substituting Equations (3) and (4) into Equation (6), the shear strength growth model of the soil mass after improvement could be obtained, as shown in Equation (7).
where
is the shear strength (kPa) and
is the normal stress (kPa).
After the borrowed soil was improved, the average particle diameter, permeability coefficient, and shear strength of the soil could be quantitatively analyzed according to the above quantitative characterization models. Thus, we avoided a large number of repeated experiments to determine the amount of material as well as the improvement effect.
According to our construction experience, the ADNB content should not be higher than 5% when applied in the mixing process. When the content of ADNB was higher than 5%, an excessive soil viscosity was observed. This phenomenon would result in blockage of the pipelines that were used to transport the borrowed soil. Even though the slip resistance of borrowed soil improved when the content of ADNB was high, construction progress would be delayed. Increased material consumption and longer construction periods would lead to high costs. Therefore, in the mixing process, the material content should not be higher than 5%, and we thus determined the optimal addition amount range to be 0–5%. In the permeability tests, when the content of ADNB was higher than 0.1%, the permeability of the soil decreased. Therefore, in the spraying process, the optimal addition amount range was 0–0.1%.
Based on the above analysis, Equation (7) should be limited to:
During construction design, the construction process should be selected based on the site construction, geological, and climatic conditions. For example, in a slope with a certain thickness of soil attached, it would no longer be necessary to supplement with borrowed soil. However, spraying ADNB could indeed improve the slip resistance of the existing soil. This approach would reduce erosion damage. On the other hand, in a sand slope subject to heavy rainfall, it is necessary to mix ADNB in the borrowed soil, which could improve the slip resistance and reduce soil loss.
4. Mechanism of the ADNB Effects on the Slip Resistance of Borrowed Soil of Rock Slopes
The above tests indicated that ADNB improved the slip resistance of the soil.
Figure 11 shows the relationship between the parameters that represent the soil slip resistance. In short, the cohesive force, internal friction angle, and permeability coefficient of the soil all increased with increasing average particle diameter. The reasons were analyzed as presented in the following.
In the particle analysis results, the particle grading curves of the 0% samples in both the mixing and spraying groups were relatively gentle. This indicated that particles of each diameter were distributed in the soil. As shown in the schematic diagram in
Figure 12a, small particles were packed tightly into the voids surrounding the large particles. Thus, a dense soil structure was formed. Therefore, the porosity of the 0% samples was low, and they had lower permeability coefficients.
The small particles in the mixing group adhered to the surface of the large particles because of the ADNB. This resulted in large aggregate structures of the soil. When the soil samples were compacted and formed as shown in the schematic diagram in
Figure 12b, the large aggregates overlapped and cemented each other. The voids between the aggregates were less filled by small particles. As a result, the porosity and permeability of the soil samples increased. The increased of porosity and permeability was beneficial to the growth of plant root. It was good for plants to absorb water and nutrients, thus, promoting the growth of plants. At the same time, ADNB permeated and diffused into the soil samples, which enhanced the integrity of the soil sample. Moreover, during the direct shear tests, the test instrument not only had to overcome the friction between the aggregates, but also needed to destroy the bonds between the aggregates. This was reflected by the macroscopic improvement of the cohesive force. After the soil particles were consolidated, the particle distribution and particle shape of the soil were changed. Therefore, the internal friction angle of the soil mass increased. Then, the increased permeability coefficient, cohesive force, and internal friction angle improved the slip resistance of soil.
In the soil samples of the spraying group, the material sprayed on the surface would permeate and diffuse into the soil samples. However, the diffusion range was limited [
32]. Therefore, the contact between the material and the soil particles was not sufficient compared with that obtained in the mixing process. A schematic diagram is shown in
Figure 12c. The effect of agglomeration of the small particles on the surface of the large particles was weak. Therefore, the particle grading curves of the soil samples in the spraying group were gentler than those in the mixing group. That is, the proportion of large-diameter particles in the sprayed samples was lower. This is why the permeability coefficient and shear strength of the soil samples in the spraying group had a smaller increase compared to the mixing group. Therefore, the improvement of the slip resistance of the spraying group was also relatively small. The latter finding was also the reason why the spraying group had a relatively small increase in slip resistance.
When the content was high, as shown in
Figure 12d, the ADNB solution dried on the sample surface after the water evaporated. Then, the ADNB solution became a hard film, as shown in
Figure 13. The permeability coefficient of the soil decreased greatly when the infiltration channels were blocked.
Based on the above analysis, it is clear that the ADNB applied in both the mixing and spraying processes cemented the soil particles into large aggregates through interaction with the soil. On the one hand, this cementation enhanced the cohesive force between the soil particles (i.e., increased the cohesive force and internal friction angle), while on the other hand, it changed the soil structure and improved the soil porosity, and thus enhanced the permeability.
5. Engineering Application
5.1. Engineering Introduction
The constructed slope was located in Southern China, which has a subtropical monsoon climate. In summer, it is hot and there is abundant rainfall with typhoon and rainstorm activities. The annual average temperature is 22.3 °C. The annual average rainfall is 2392.3 mm. The constructed slope had a dip angle of 40–50°. The lithology of the slope was mainly mudstone with strong–medium weathering and some sandstone. The slope was mainly reinforced by lattice beams and anchor rods (or cables) (
Figure 14a,b). This area has slopes that have been ecologically restored. However, because of the heavy rainfall, serious soil erosion occurred. After repeated maintenance, the ecological restoration effect deteriorated. Therefore, it was necessary to improve the slip resistance of borrowed soil.
5.2. Construction and Effect of Ecological Restoration
To test the suitability of the spraying process, ADNB was applied by the spraying process at a content of 0.1%. According to the quantitative characterization mechanical models, the average particle diameter of the improved soil was calculated to be 0.68 mm, with a
c value of 23.9 kPa, a
φ value of 16.7°, and a permeability coefficient of 3.28 × 10
-4 cm/s. The calculation steps are shown in Equation (9). Based on these calculation results, as shown in Equation (10), the improved shear strength equation of the soil mass was obtained.
During construction, planting soil, super-absorbent resin, organic fertilizer, and water were placed into a hydraulic jet according to the design ratio, as shown in
Table 4. Then, the mixture was sprayed onto the slope (
Figure 15). After spraying, seeds were sown. Finally, portable agricultural sprayers were used to spray the ADNB solution onto the surface of the soil. After construction was completed, the soil was firmly attached to the slope (
Figure 16). The soil thickness reached the design requirement, and the construction effect was good.
Four months after construction completion, the slope experienced two heavy rains and several consecutive rains. The borrowed soil remained stable, and the amount of slump was very small. At the time of writing, plants were growing well, and the ecological restoration effect was good (
Figure 17a,b).
The application of ADNB in the ecological restoration of rock slopes showed that ADNB could effectively improve the slip resistance of borrowed soil of rock slopes, and plants grew well after the material was applied. This helps to avoid repeated restoration and improve the economic and environmental benefits. At the same time, the rationality and reliability of the quantitative characterization models were verified. Moreover, this study provides theoretical support for the popularization and application of ADNB.
6. Conclusions
(1) In this paper, ADNB was used to modify clay. Considering different dosages and application processes, we performed particle analysis as well as permeability and direct shear experiments, based on which, the variation rules of the soil particles, permeability, and shear strength after soil improvement were clarified. We then constructed mechanical models for the quantitative characterization of the relationships between the average particle diameter, permeability coefficient, cohesive force, internal friction angle, and ADNB content. The optimal content range of ADNB in the different application processes was determined, and the problem of the repeated tests needed during implementation caused by the lack of a quantitative characterization model was solved.
(2) This study further revealed the clay improvement mechanism of ADNB. As an organic polymer, ADNB bonds to the small particles in soil to the surface of the large particles. As a result, large aggregates are formed in the soil. Accordingly, the permeability and shear strength of the soil are improved. The present study provides theoretical guidance for the popularization and application of ADNB in the ecological restoration of slopes under different conditions.
(3) The reliability of the models was verified through an engineering application. At the same time, it was proven that the ADNB addition amount based on the experimentally determined optimal range enhanced the slip resistance of borrowed soil. Thus, the ecological slope restoration effect was proven. This paper provides theoretical guidance for the ecological restoration of rock slopes using ADNB as an ameliorant.
Author Contributions
Conceptualization, C.Z. and Z.L.; methodology, C.Z. and Z.L.; software, D.L.; validation, C.Z., Z.L. and D.L.; formal analysis, D.L. and Z.L.; investigation, D.L. and Z.L.; resources, C.Z. and Z.L.; data curation, C.Z., D.L. and Z.L.; writing—original draft preparation, C.Z., D.L. and Z.L.; writing—review and editing, C.Z., D.L. and Z.L.; visualization, Z.L.; supervision, C.Z. and Z.L.; project administration, C.Z. and Z.L.; funding acquisition, C.Z and Z.L.
Funding
This research is supported by Major Programs Special Funds of Applied Science and Technology Research and Development of Guangdong Province (No.2015B090925016); The National Key Research and Development Project of China (No.2017YFC1501201); The National Key Research and Development Project of China (No.2017YFC0804605).
Conflicts of Interest
The authors declare no conflict of interest.
References
- Jackson, L.L.; Lopoukhine, N.; Hillyard, D. Ecological Restoration: A Definition and Comments. Restor. Ecol. 2010, 3, 71–75. [Google Scholar] [CrossRef]
- Mcbride, M.F.; Wilson, K.A.; Burger, J.; Fang, Y.C.; Lulow, M.; Olson, D.; O’Connell, M.; Possingham, H.P. Mathematical problem definition for ecological restoration planning. Ecol. Model. 2010, 221, 2243–2250. [Google Scholar] [CrossRef]
- Li, R.R.; Zhang, W.J.; Yang, S.Q.; Zhu, M.K.; Kan, S.S.; Chen, J.; Ai, X.Y.; Ai, Y.W. Topographic aspect affects the vegetation restoration and artificial soil quality of rock-cut slopes restored by external-soil spray seeding. Sci. Rep. 2018, 8, 13. [Google Scholar] [CrossRef] [PubMed]
- Wu, C.Q.; Zhang, H.; Huang, D.G.; Xu, J.X.; Lei, J.L.; Xu, Y.Y. Study on Screening Suitable Ecological Protection Woody Plants of Highway Slopes. In Proceedings of the XXVIII International Horticultural Congress on Science and Horticulture for People (IHC2010), Lisbon, Portugal, 22–27 August 2010; Groening, G., Ed.; International Society for Horticultural Science: Leuven, Belgium, 2012; Volume 937, pp. 1193–1200. [Google Scholar]
- Qin, X. Research on Fast Ecological Restoration Technology of High and Steep Rocky Slope of Highway. In Proceedings of the International Conference on Green Energy and Sustainable Development (GESD 2017), Chongqing, China, 27–28 May 2017; Liu, L., Xiao, J., Ke, J., Eds.; American Institute of Physics Publishing: College Park, MD, USA, 2017; Volume 1864. [Google Scholar]
- Mavimbela, S.S.W.; Dlamini, P.; van Rensburg, L.D. Infiltration-excess runoff properties of dryland floodplain soil types under simulated rainfall conditions. Arid Land Res. Manag. 2019, 33, 235–254. [Google Scholar] [CrossRef]
- Wei, Y.J.; Wu, X.L.; Xia, J.W.; Zeng, R.B.; Cai, C.F.; Wang, T.W. Dynamic study of infiltration rate for soils with varying degrees of degradation by water erosion. Int. Soil Water Conserv. Res. 2019, 7, 167–175. [Google Scholar] [CrossRef]
- Liu, Y.X.; Xin, Y.; Xie, Y.; Wang, W.T. Effects of slope and rainfall intensity on runoff and soil erosion from furrow diking under simulated rainfall. Catena 2019, 177, 92–100. [Google Scholar] [CrossRef]
- Liu, J.; Shi, B.; Gu, K.; Jiang, H.; Inyang, H.I.; Environment, T. Effect of polyurethane on the stability of sand–clay mixtures. Bull. Eng. Geol. 2012, 71, 537–544. [Google Scholar] [CrossRef]
- Léonard, J.; Richard, G. Estimation of runoff critical shear stress for soil erosion from soil shear strength. Catena 2004, 57, 233–249. [Google Scholar] [CrossRef]
- Barry, P.V.; Turco, R.F.; Stott, D.E.; Bradford, J.M. Organic Polymers’ Effect on Soil Shear Strength and Detachment by Single Raindrops. Soil Sci. Soc. Am. J. 1991, 55, 799–804. [Google Scholar] [CrossRef]
- Mohammadi, S.D.; Naseri, F.; Abri, R. Simulating soil loss rate in Ekbatan Dam watershed using experimental and statistical approaches. Int. J. Sediment Res. 2019, 34, 226–239. [Google Scholar] [CrossRef]
- Su, T. Mechanism on Scourresistance Stability of EN-1 Solidified Slope in Pisha Sandstone Region. Ph.D. Thesis, Northwest A&F University, Xianyang, China, 2011. [Google Scholar]
- Zhu, F.; Li, Z.C.; Dong, W.Z.; Ou, Y.Y. Geotechnical properties and microstructure of lime-stabilized silt clay. Bull. Eng. Geol. Environ. 2019, 78, 2345–2354. [Google Scholar] [CrossRef]
- Thiha, S.; Lertsuriyakul, C.; Phueakphum, D. Shear strength enhancement of compacted soils using high-calcium fly ash-based geopolymer. Int. J. Geomate 2018, 15, 1–9. [Google Scholar] [CrossRef]
- Abdullah, H.H.; Shahin, M.A.; Sarker, P. Use of Fly-Ash Geopolymer Incorporating Ground Granulated Slag for Stabilisation of Kaolin Clay Cured at Ambient Temperature. Geotech. Geol. Eng. 2018, 37, 721–740. [Google Scholar] [CrossRef]
- Estabragh, A.R.; Kouchakzadeh, M.; Javadi, A.A. Treatment of a clay soil deposited in saline water by cement. Eur. J. Environ. Civ. Eng. 2018. [Google Scholar] [CrossRef]
- Bian, P.; Zhang, J.; Zhang, C.; Huang, H.; Rong, Q.; Wu, H.; Li, X.; Xu, M.; Liu, Y.; Ren, S. Effects of Silk-wormExcrement Biochar Combined with Different Iron-Based Materials on the Speciation of Cadmium and Leadin Soil. Appl. Sci. 2018, 8, 1999. [Google Scholar] [CrossRef]
- Zhou, Y.; Watts, D. Current development of slope eco-engineering principle and application in Europe andAmerica. J. Soil Eros. Soil Water Conserv. 1999, 5, 80–86. [Google Scholar]
- Yang, Q.W.; Pei, X.J.; Huang, R.Q. Impact of polymer mixtures on the stabilization and erosion control of silty sand slope. J. Mt. Sci. Engl. 2019, 16, 470–485. [Google Scholar] [CrossRef]
- Cabalar, A.F.; Awraheem, M.H.; Khalaf, M.M. Geotechnical Properties of a Low-Plasticity Clay with Biopolymer. J. Mater. Civ. Eng. 2018, 30, 10. [Google Scholar] [CrossRef]
- Gupta, G.; Sood, H.; Gupta, P.K. Geotechnical and Geo-environmental Properties of Discrete Polyester Fibre-reinforced and RBI Grade-81-stabilized Clay and Sand. IOP Conf. Ser. Earth Environ. Sci. (UK) 2019, 219, 012019. [Google Scholar] [CrossRef]
- Soltani-Jigheh, H.; Bagheri, M.; Amani-Ghadim, A.R. Use of hydrophilic polymeric stabilizer to improve strength and durability of fine-grained soils. Cold Reg. Sci. Technol. 2019, 157, 187–195. [Google Scholar] [CrossRef]
- Georgees, R.N.; Hassan, R.A.; Evans, R.P.; Jegatheesan, P. Effect of the Use of a Polymeric Stabilizing Additive on Unconfined Compressive Strength of Soils. Transp. Res. Rec. 2015, 2473, 200–208. [Google Scholar] [CrossRef]
- Green, V.S.; Stott, D.E.; Graveel, J.G.; Norton, L.D. Stability analysis of soil aggregates treated with anionic polyacrylamides of different molecular formulations. Soil Sci. 2004, 169, 573–581. [Google Scholar] [CrossRef]
- Song, Z.; Liu, J.; Bai, Y.; Wei, J.; Li, D.; Wang, Q.; Chen, Z.; Kanungo, D.P.; Qian, W. Laboratory and Field Experiments on the Effect of Vinyl Acetate Polymer-Reinforced Soil. Appl. Sci. 2019, 9, 208. [Google Scholar] [CrossRef]
- Yao, D.; Qian, G.; Liu, J.; Yao, J. Application of Polymer Curing Agent in Ecological Protection Engineering of Weak Rock Slopes. Appl. Sci. 2019, 9, 1585. [Google Scholar] [CrossRef]
- Ahmadi, S.F.; Samea, P.; Eskandari, M. Axisymmetric response of a bi-material full-space reinforced by an interfacial thin film. Int. J. Solids Struct. 2016, 90, 251–260. [Google Scholar] [CrossRef]
- Shodja, H.M.; Ahmadi, S.F.; Eskandari, M. Boussinesq indentation of a transversely isotropic half-space reinforced by a buried inextensible membrane. Appl. Math. Model. 2014, 38, 2163–2172. [Google Scholar] [CrossRef]
- Ahmadi, S.F.; Eskandari, M. Axisymmetric circular indentation of a half-space reinforced by a buried elastic thin film. Math. Mech. Solids 2014, 19, 703–712. [Google Scholar] [CrossRef]
- Selvadurai, A.P.S. Boussinesq indentation of an isotropic elastic halfspace reinforced with an inextensible membrane. Int. J. Eng. Sci. 2009, 47, 1339–1345. [Google Scholar] [CrossRef]
- Zhou, C.Y.; Zhao, S.S.; Huang, W.; Li, D.X.; Liu, Z. Study on the Stabilization Mechanisms of Clayey Slope Surfaces Treated by Spraying with a New Soil Additive. Appl. Sci. Basel 2019, 9, 1245. [Google Scholar] [CrossRef]
- Cuiying, Z.; Shanshan, Z.; Xu, Y.; Zhen, L. Improvement of eco-ester materials on sandy soils and engineering slope protection. Rock Soil Mech. 2019, 1–10. [Google Scholar]
Figure 1.
Aqua-dispersing nano-binder (ADNB).
Figure 1.
Aqua-dispersing nano-binder (ADNB).
Figure 2.
The soil used in the tests.
Figure 2.
The soil used in the tests.
Figure 3.
Particle grading curves.
Figure 3.
Particle grading curves.
Figure 4.
Permeability coefficient of each group of samples.
Figure 4.
Permeability coefficient of each group of samples.
Figure 5.
Shear stress–shear displacement curves.
Figure 5.
Shear stress–shear displacement curves.
Figure 6.
Mohr stress circles.
Figure 6.
Mohr stress circles.
Figure 7.
The relationship between the average particle diameter and polymer content.
Figure 7.
The relationship between the average particle diameter and polymer content.
Figure 8.
The relationship between the cohesive force and polymer content.
Figure 8.
The relationship between the cohesive force and polymer content.
Figure 9.
The relationship between the internal friction angle and polymer content.
Figure 9.
The relationship between the internal friction angle and polymer content.
Figure 10.
The relationship between the permeability coefficient and polymer content.
Figure 10.
The relationship between the permeability coefficient and polymer content.
Figure 11.
The relationship between the parameters.
Figure 11.
The relationship between the parameters.
Figure 12.
Schematic diagram of the sample structure in different processes.
Figure 12.
Schematic diagram of the sample structure in different processes.
Figure 13.
The hard film on the surface of a soil sample.
Figure 13.
The hard film on the surface of a soil sample.
Figure 14.
Before construction.
Figure 14.
Before construction.
Figure 15.
During construction.
Figure 15.
During construction.
Figure 16.
The borrowed soil.
Figure 16.
The borrowed soil.
Figure 17.
Four months after construction.
Figure 17.
Four months after construction.
Table 1.
Basic parameters of ADNB [
32].
Table 1.
Basic parameters of ADNB [
32].
| Parameter | Value |
|---|
| Solids content (%) | 41 |
| pH | 6–7 |
Density (g/cm2)
Water solubility | 1.2
Insoluble |
Table 2.
Basic parameters of the clay.
Table 2.
Basic parameters of the clay.
| Parameter | Value |
|---|
| Natural water content ω (%) | 25.26 |
| Air-dried water content ωh (%) | 3.59 |
| Natural density γ (g·cm−3) | 1.52 |
| Liquid limit ωL (%) | 54.1 |
| Plastic limit ωP (%) | 36.1 |
| Plasticity index Ip | 18.0 |
| Liquidity index IL | −0.6 |
Table 3.
Parameter changes after soil sample treatment.
Table 3.
Parameter changes after soil sample treatment.
| Parameter | Group | Polymer Content |
|---|
| 0% | 0.05% | 0.1% | 0.25% | 0.5% | 1% | 2.5% | 5% |
|---|
| d50 | Mixing (mm) | 0.3 | 2.6 | 2.6 | 3.0 | 3.2 | 3.6 | 3.8 | 3.5 |
| Spraying (mm) | 0.4 | 0.6 | 0.8 | 0.9 | 1.0 | 1.2 | 2.0 | 2.3 |
| KT | Mixing (×10−4 mm) | 0.97 | 4.88 | 5.58 | 6.66 | 8.19 | 9.98 | 15.90 | 21.80 |
| Spraying (×10−4 mm) | 0.95 | 2.17 | 3.26 | 3.02 | 0.09 | 0.06 | 0.04 | 0.03 |
| c | Mixing (mm) | 19.0 | 26.8 | 29.6 | 30.3 | 32.3 | 33.3 | 36.0 | 38.2 |
| Spraying (mm) | 19.1 | 22.1 | 23.5 | 26.2 | 27.8 | 29.1 | 30.8 | 32.6 |
| φ | Mixing (°) | 11.9 | 13.8 | 15.1 | 16.6 | 16.8 | 19.4 | 21.0 | 21.3 |
| Spraying (°) | 11.9 | 12.5 | 12.6 | 13.0 | 13.3 | 13.6 | 14.2 | 14.4 |
Table 4.
Composition and content.
Table 4.
Composition and content.
| Material Composition | Clay | Water | Organic Fertilizer | Super-Absorbent Polymer | ADNB |
|---|
| Percentage of the total mass (%) | 65–70 | 20–25 | 8–10 | 0.45 | 0.1 |
© 2019 by the authors. Licensee MDPI, Basel, Switzerland. This article is an open access article distributed under the terms and conditions of the Creative Commons Attribution (CC BY) license (http://creativecommons.org/licenses/by/4.0/).


