Article

Technical Performance of an Inflatable Solar Dryer for Drying Amaranth Leaves in Kenya

1
Institute of Agricultural Engineering, Tropics and Subtropics Group, University of Hohenheim, 70599 Stuttgart, Germany
2
Agricultural Research and Development Program, Central State University, Wilberforce, OH 45384, USA
3
Regional Office for Africa, International Center for Tropical Agriculture (CIAT), P.O. Box 823-00621 Nairobi, Kenya
*
Author to whom correspondence should be addressed.
Appl. Sci. 2019, 9(16), 3431; https://doi.org/10.3390/app9163431
Submission received: 16 July 2019 / Revised: 4 August 2019 / Accepted: 16 August 2019 / Published: 20 August 2019
(This article belongs to the Special Issue Renewable Energy in Agriculture)

Abstract

:
The technical performance of an inflatable solar dryer (ISD) to dry amaranth leaves (Amaranthus spp.) was investigated. To handle the drying of lightweight materials, modification was made by adding an air deflector and trays inside the ISD. Computational performance of the ISD solar energy system was evaluated using MATLAB Simulink. The estimated air mass flow in the inlet of the ISD was 0.75 kg/s. Using computational fluid dynamics (CFD), the uniformity of air distribution in the ISD was evaluated. The solar radiation reported during good drying performance ranged between 510 and 950 W/m2. In a controlled charging system, a 100 Wp PV module typically generated voltage between 10.22 and 18.75 V. Drying conditions at temperatures of 40 °C or above were typically achieved in the ISD from 12:00 to 16:00. Temperature inside the ISD could reach up to 69.4 °C during the day and 13.4 °C during the night. The highest relative humidity of 97.4% was recorded during the night. Opening the ISD while mixing the product could lead to considerable heat loss. Fluctuation of solar radiation and shaded areas in the ISD appeared to be the major factors affecting the drying performance.

Graphical Abstract

1. Introduction

In most developing countries, the long drying times for agricultural commodities have been a major issue, especially for small- and medium-scale food processors [1]. Drying is an energy-intensive process, and solar drying is therefore a preferred method in developing countries with limited resources [2,3,4]. Cabinet dryers are well known to dry small quantities of vegetables, including amaranth leaves [2,5]. The use of a solar dryer has been found to accelerate drying by 30% to 40% compared to conventional sun drying depending on the crop [6,7]. In convection dryers, airflow distribution is one of the crucial factors due to its strong impact on the drying temperature [8,9,10]. An energy-efficient dryer that produces a high-quality product is still not easily accessible among farmers and processors in most developing countries [3]. Recent studies have focused on the development of solar collector and concentrators in a solar dryer [7,9,11]. Therefore, a solar tunnel dryer was developed and continuously improved at the University of Hohenheim [6,12]. In this study, the latest version, which is an inflatable solar dryer (ISD), was used. The performance of the ISD has been investigated in a previous work for drying of paddy rice in the Philippines [13]. Due to the positive results, the ISD should now also be applied for high-value crops, such as amaranth leaves (Amaranthus spp.) Amaranth leaves are considered as one of the most nutritive leafy vegetables in Kenya, and the crop is commonly cultivated in an intercropping system [14]. The crop grows under semiarid conditions, and high temperatures are necessary to ensure a normal growth of the crop [15]. In Kenya, it has been recognized as a drought-tolerant crop with high nutritional values, which can grow rapidly in tropical areas [16]. As a pretreatment to dry leafy vegetables, blanching is commonly conducted to preserve the texture and color and to inactivate particular enzymes [17], such as peroxidase [18,19].
The objective of this research was to investigate the performance of the ISD for drying amaranth leaves in comparison to conventional sun drying.

2. Materials and Methods

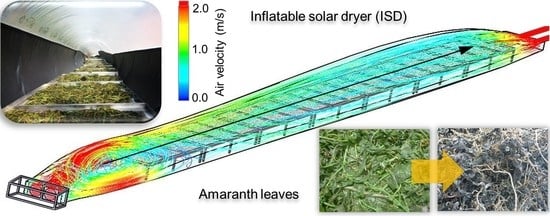
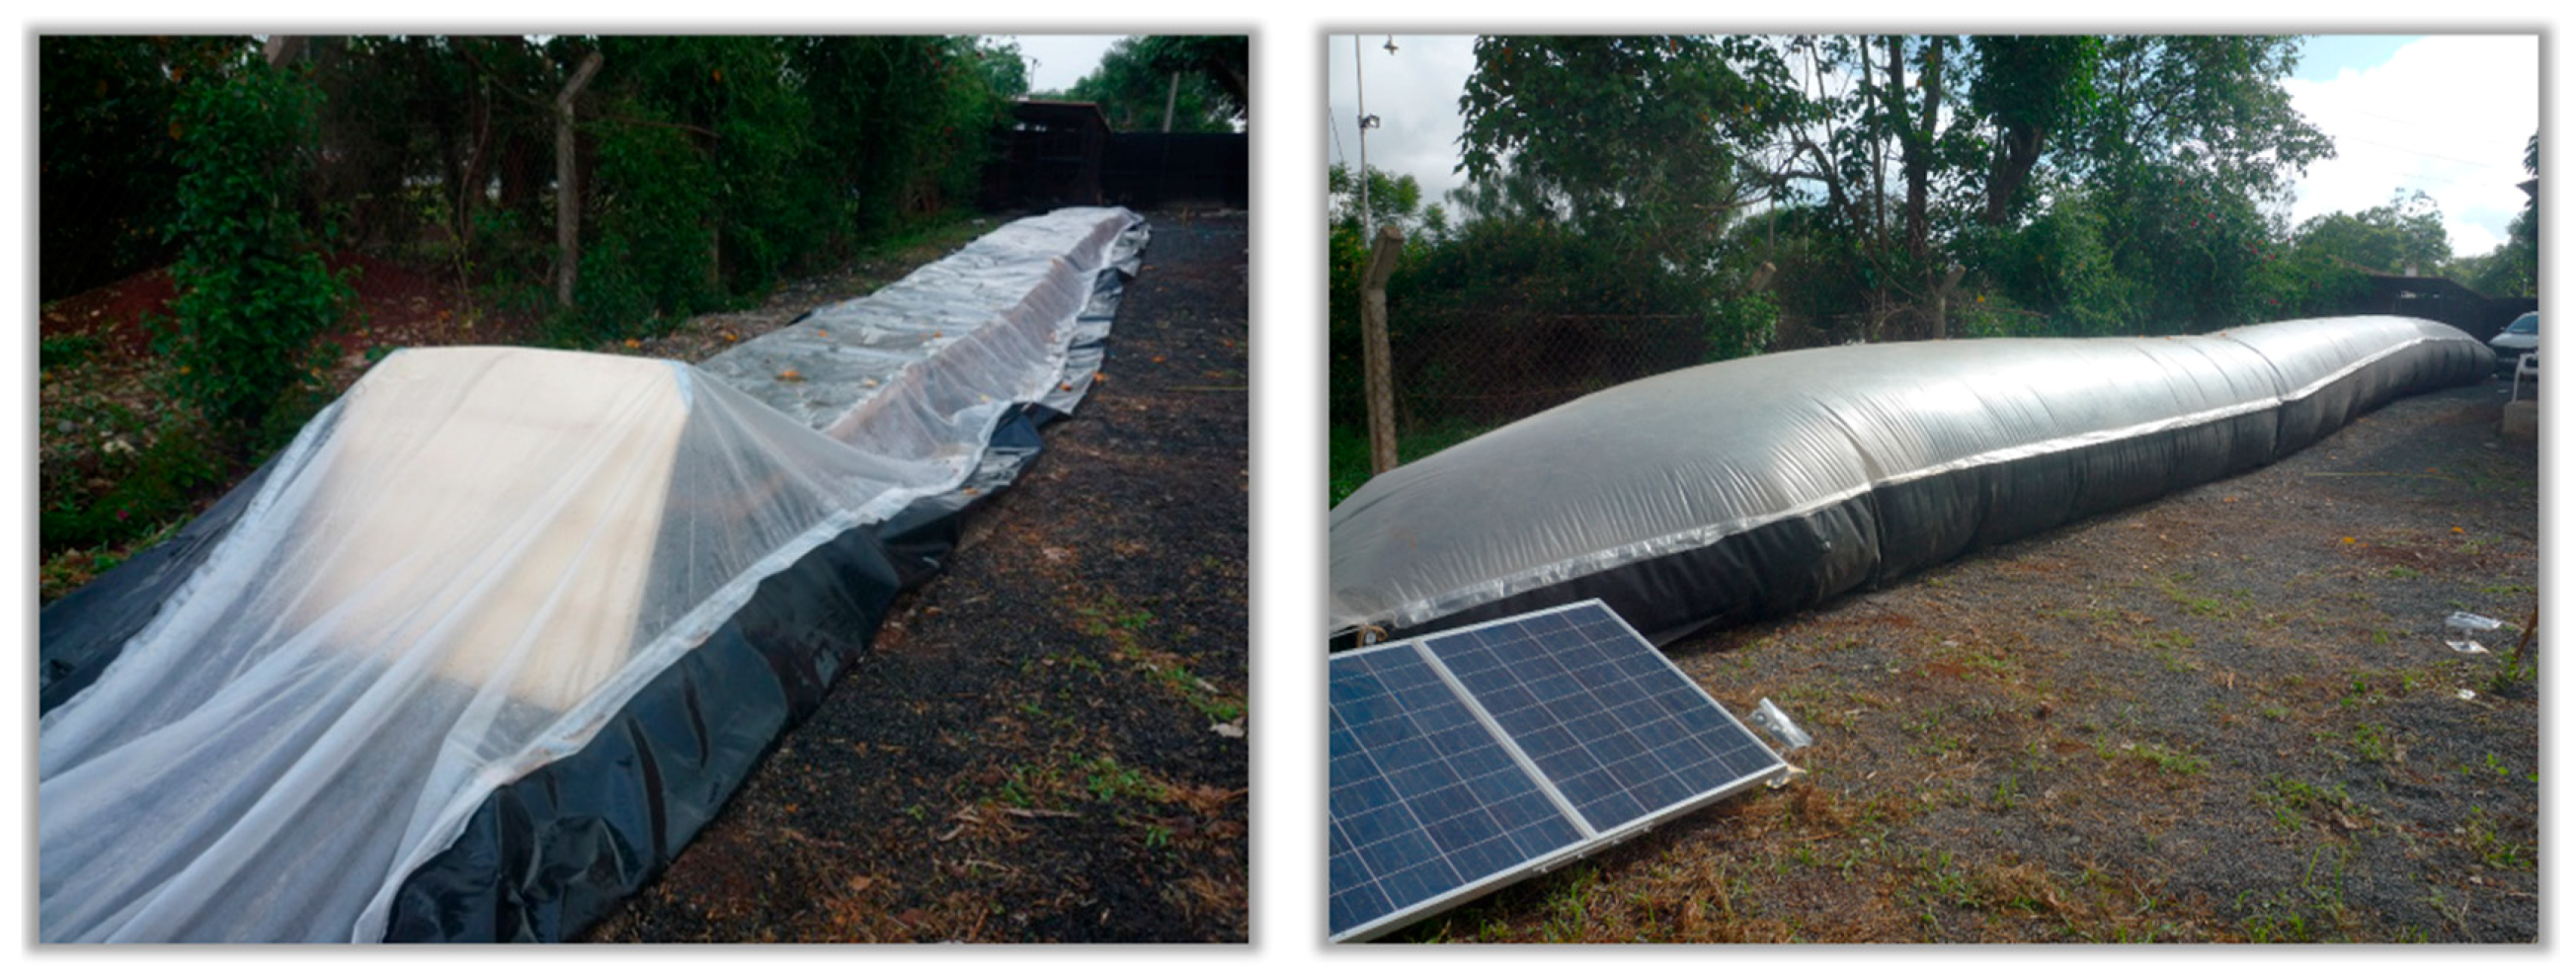
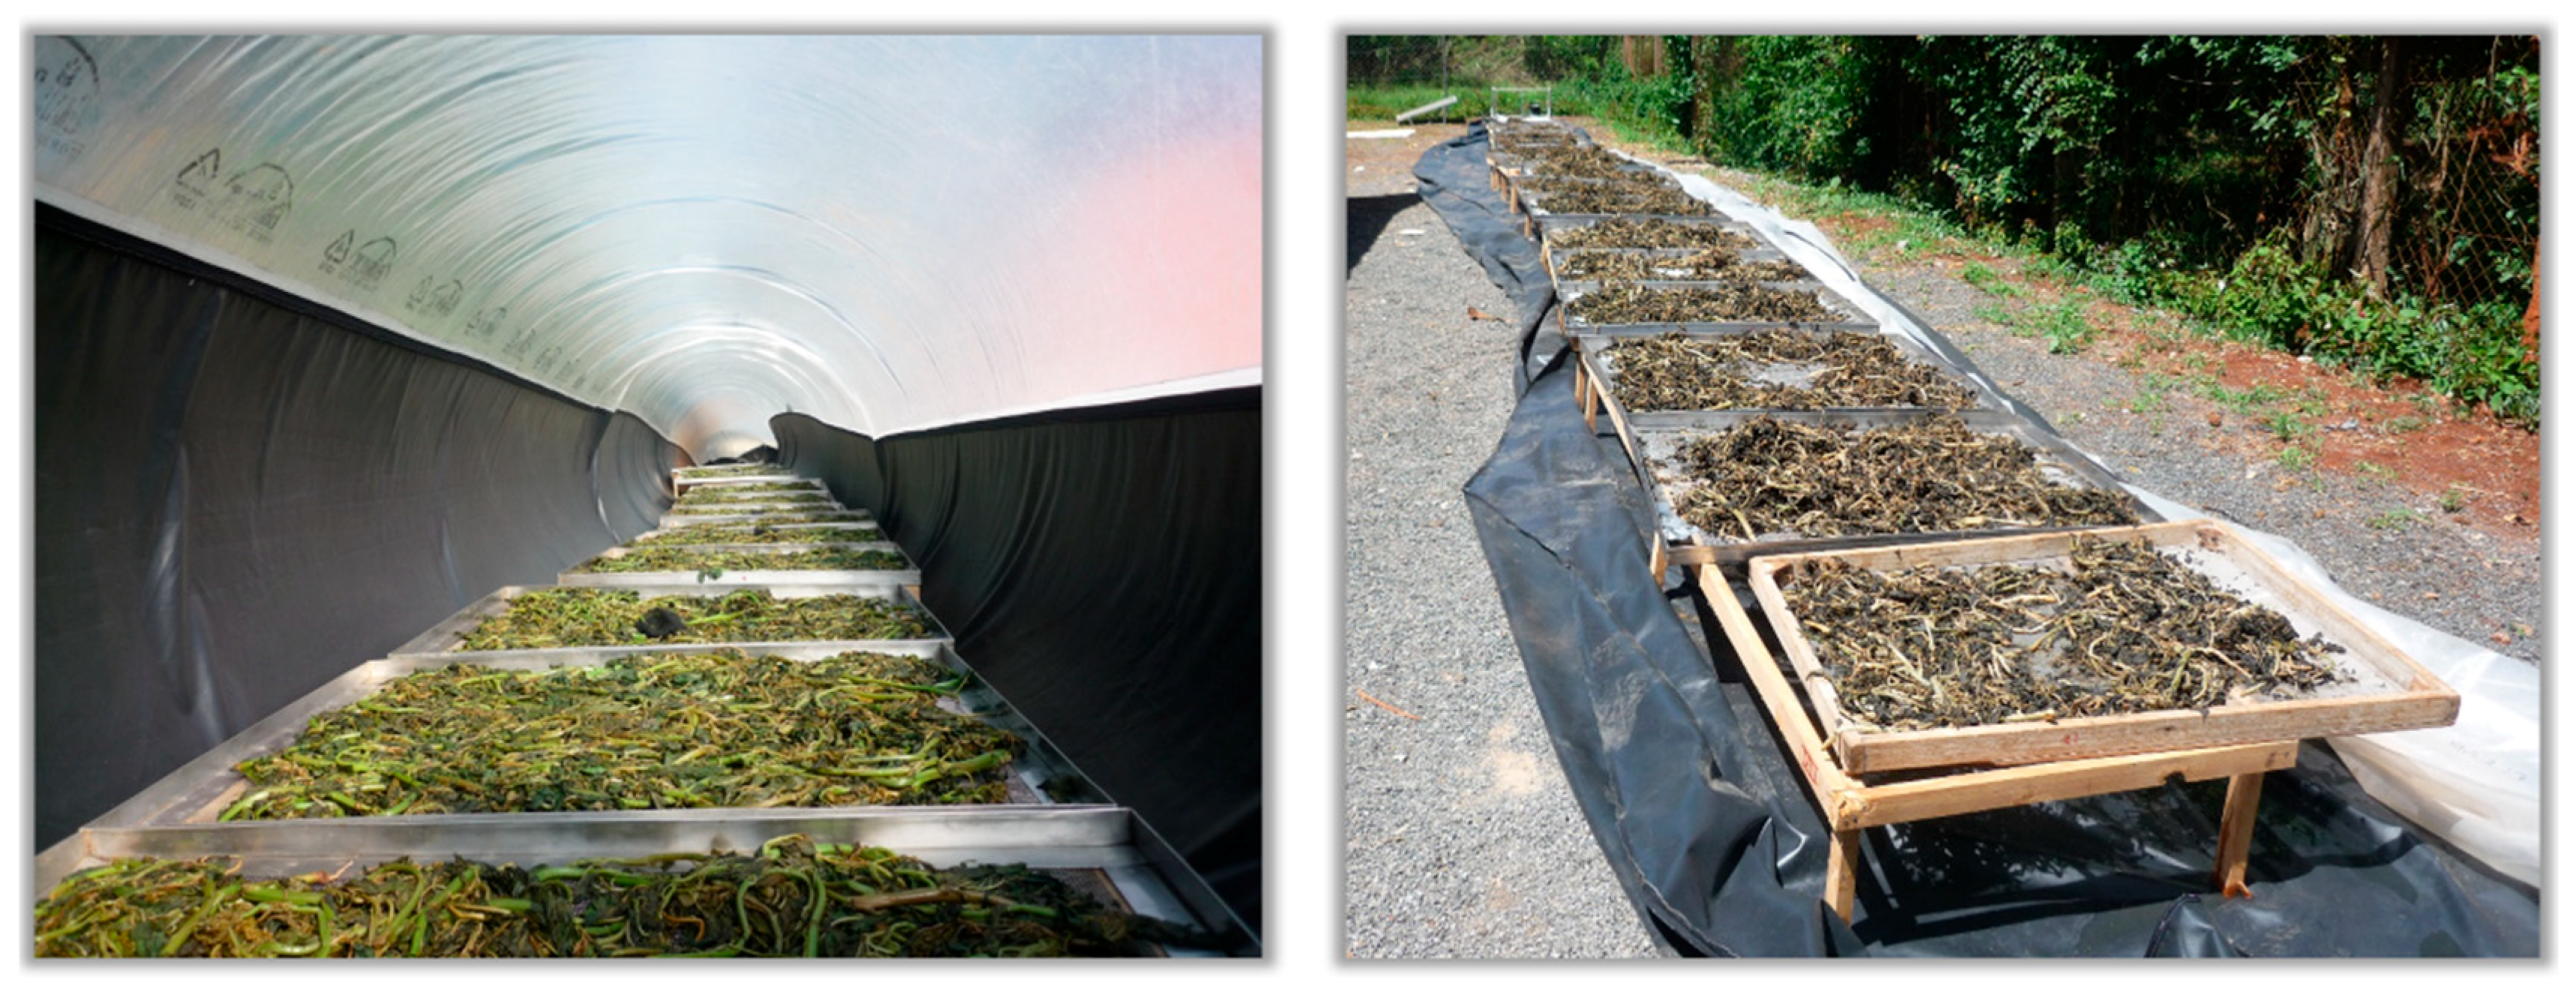
2.1. Inflatable Solar Dryer (ISD)

A commercialized version of the ISD (SBD 50, GrainPro Inc., Zambales, Philippines) was modified to make it suitable for drying vegetables. The dryer was 26 m long and 2 m wide and consisted of a 150 µm thick UV-stabilized transparent polyethylene (PE) foil as top layer and a 520 µm thick reinforced black polyvinyl chloride (PVC) foil as bottom layer. Both layers were connected by a zipper, forming a foil tunnel that could be opened for loading and unloading the drying area. An air deflector was placed inside the ISD to prevent blowing away the vegetable leaves from the trays. The deflector was made of a plywood board reinforced with a wood beam and held by a metal rod. The tilt angle was 60° from the ground. The deflector was located in the preheating area, 2665 mm from the fans and 1000 mm from the first tray. In order to prevent cuts in the film from sharp edges of the deflector, a 45° chamfer was made on the upper edges of the sheet (see Figure 1).
Air was blown through the foil tunnel by two 12 V/2.60 A DC axial fans (RDF2589B12N18S, Runda Electronics CO., LTD, Shenzhen, China), which inflated the tunnel and provided an airflow for drying. The fans were connected to a sealed rechargeable 12 V/75 Ah battery (GT 12-75C, GasTon Battery, Kowloon, Hong Kong), which was continuously charged by two 100 Wp photovoltaic (PV) modules (Model 100W, Guangxi Sacred New Energy Co. LTD, Shenzhen, China). Each module was 134 cm long and 110 cm wide, installed with a tilt angle of 15° from the ground, and was facing south. During the night, the fan PV modules and battery were brought into a nearby building for safety reasons.
In order to place the drying product, 21 trays covered with 4 × 4 mm wire mesh, each with 1065 × 860 mm surface area were lined up inside the dryer. Three trays each were placed on a wooden stand, which was 2630 mm long and 1065 mm wide. In total, seven wooden stands were placed in the ISD. See Figure 2.

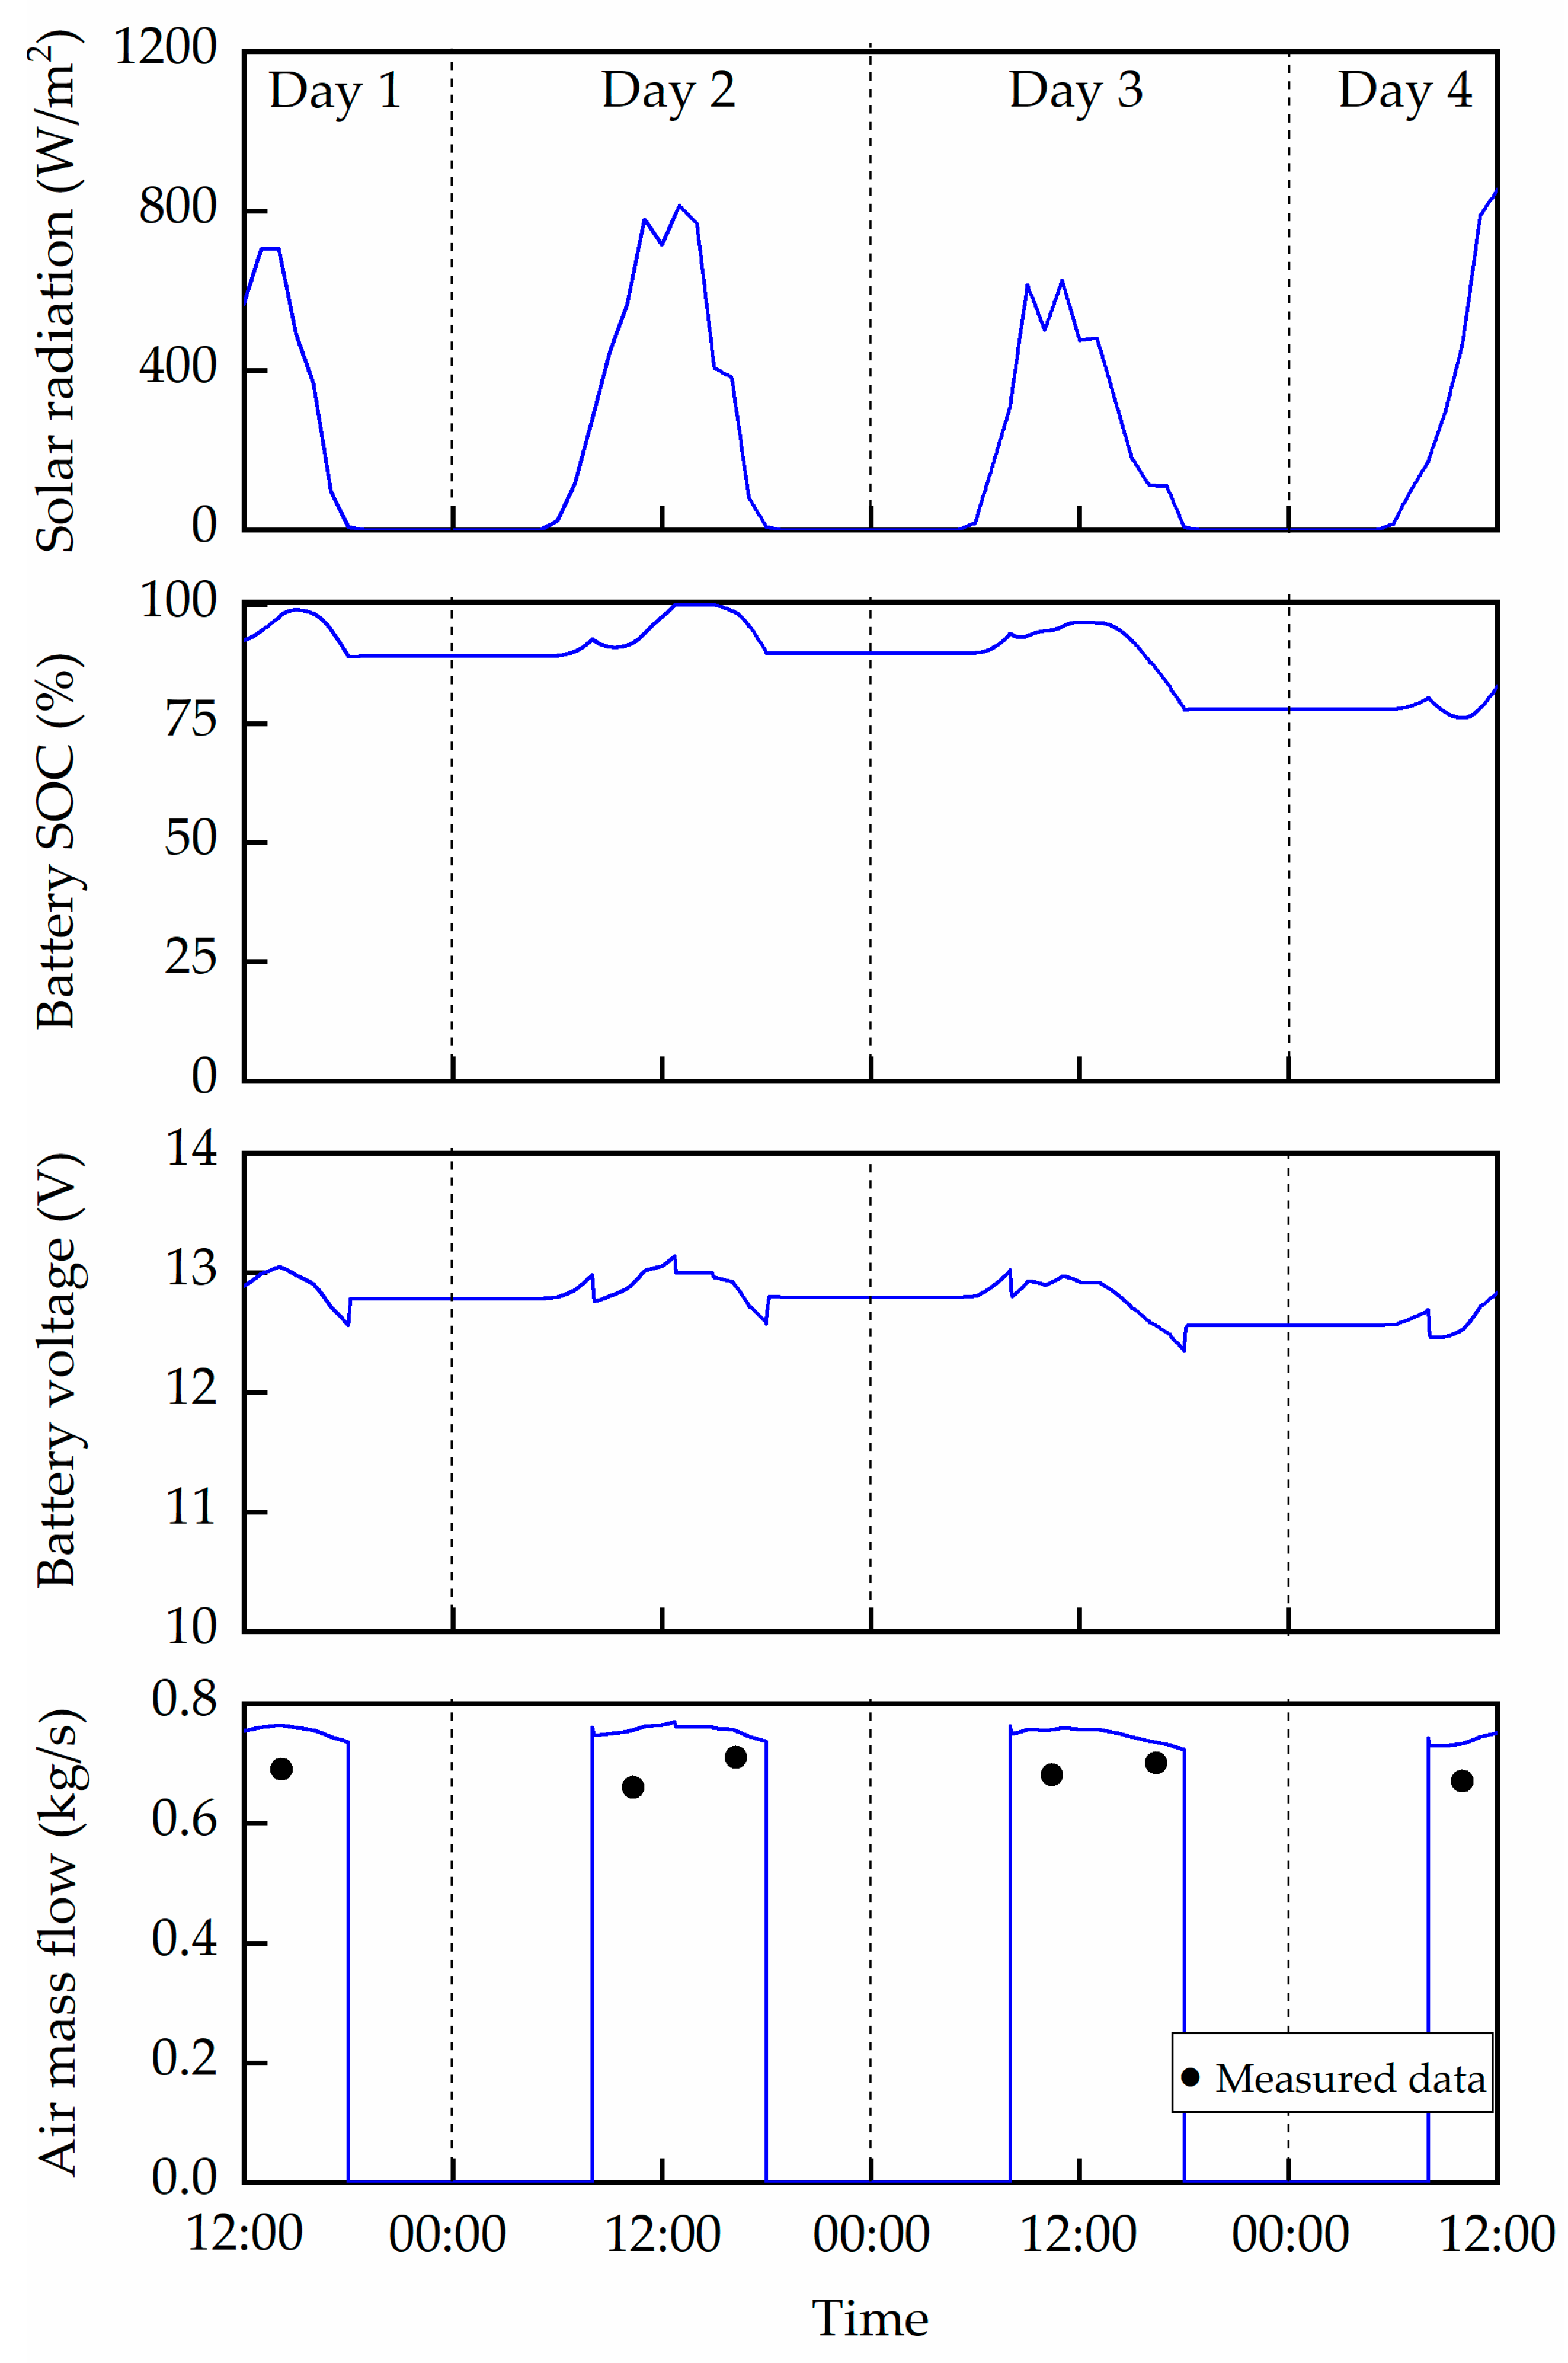
2.2. Simulation of the Photovoltaic Energy Supply System

The solar energy supply system and the estimated fan performance of the two fans of the ISD were simulated using simulation und model-based design software (MATLAB Simulink, The Mathworks Inc., Natick, MA, USA) using weather data of Nairobi, Kenya. For this purpose, the weather data set KEN_Nairobi-Kenyatta.637400_SWERA was obtained (Meteonorm, Meteotest AG, Bern, Switzerland). The simulation model of the solar battery and the charge controller was set according to Sukamongkol et al. [20]. Based on the climate data input, the voltage of the PV modules, state-of-charge (SOC) of the battery, and fan performance were simulated [21].
The voltage-dependent characteristics per single fan were measured in preparatory tests in a range between 5.4 and 14.8 V, and linear functions were established:
I = 0.20·U − 0.43,   R2 = 0.997
n = 138.94·U + 176.44,   R2 = 0.995
m = 0.028·U + 0.015,  R2 = 0.987
with voltage U (V), current I (A), rotational speed n (rpm), and air mass flow m (kg/s) at a temperature of 25 °C.
The operating mode was assumed to be as follows: initial SOC of the battery is 90%, the system shut downs when SOC falls below 40%, and the system restarts when SOC again exceeds 45%.

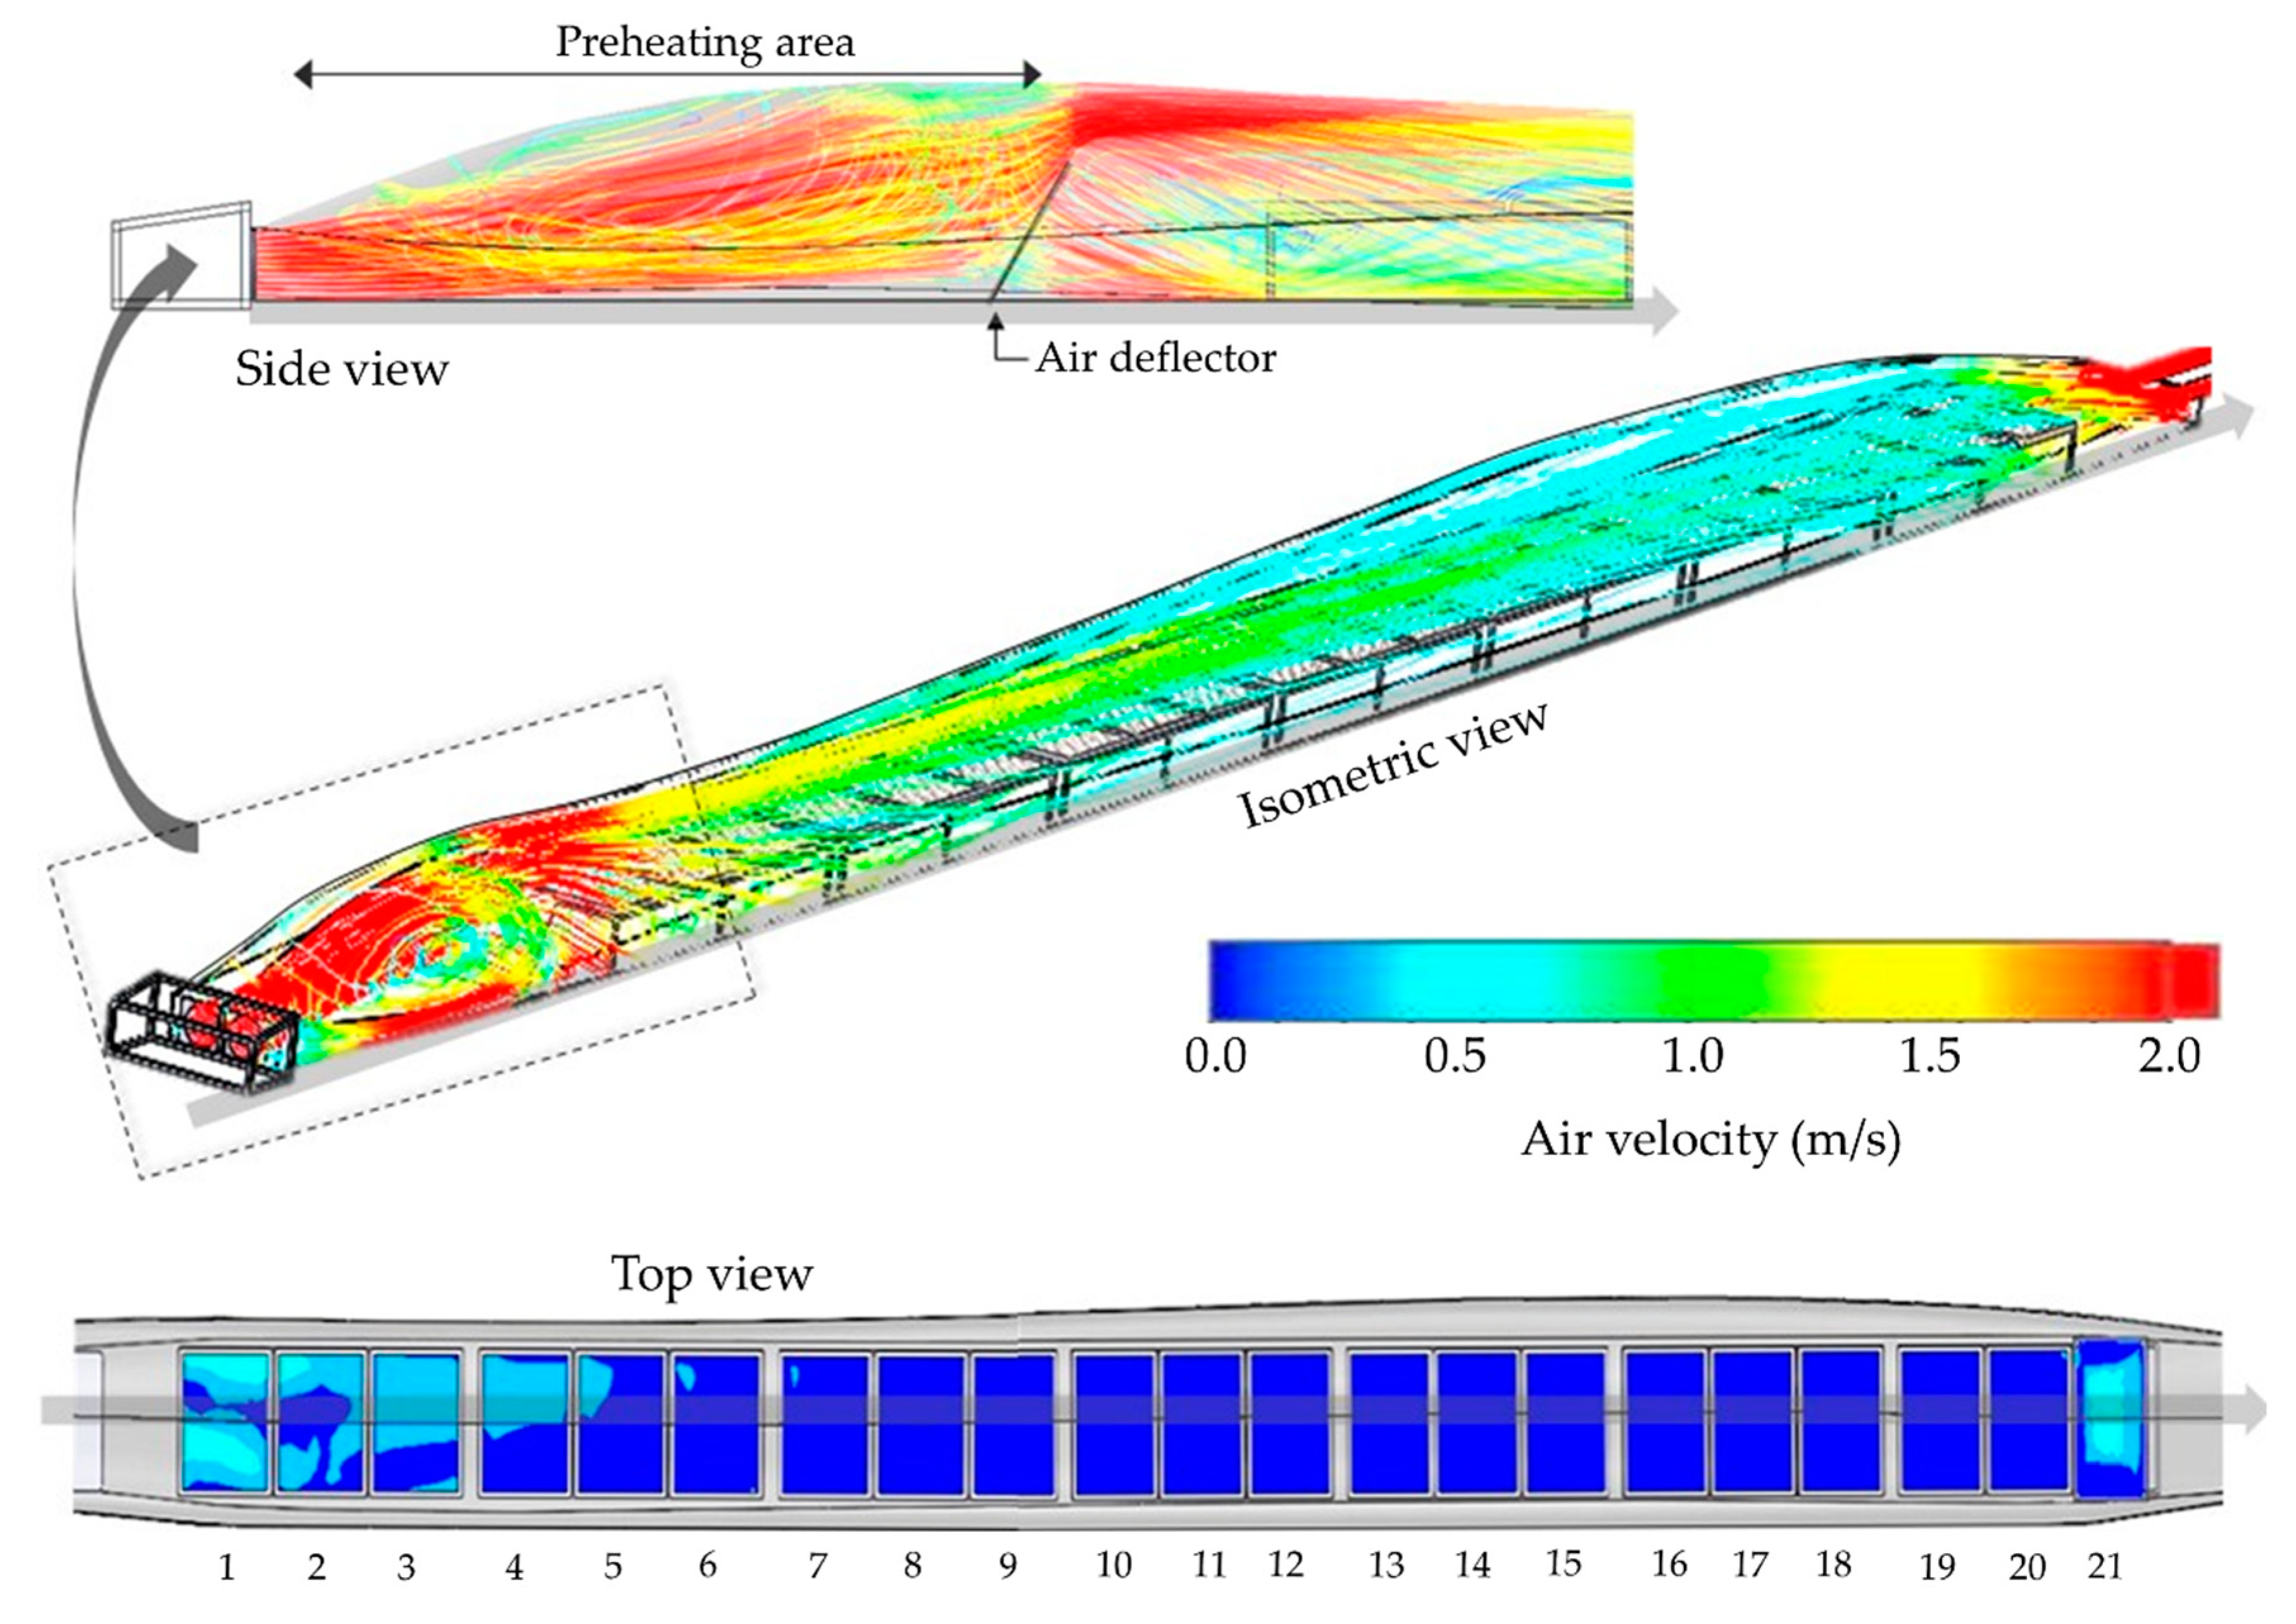
2.3. Computational Evaluation of Airflow inside the ISD

The air velocity and the airflow distribution above the trays in the ISD could not be measured during the drying experiments. Frequent opening of the ISD for repeated measurements would greatly affect the drying performance [22]. Therefore, a numerical analysis using computational fluid dynamics (CFD) was applied to estimate and visualize the spatial air velocity distribution in the ISD, as suggested by Khazimov et al. [8]. CFD simulation and 3D design of ISD were performed by software Solidworks (Solidworks 2017, Dassault Systèmes, Velizy Villacoublay, France). The air flow was governed according to Navier–Stokes equations, with regard to mass, momentum, and energy conservation laws [23]. Geometry of the ISD, along with the air deflector, the trays, and the stands, was made according to the shape and size of the dryer during drying experiments. Three-dimensional body of the ISD was assumed to be an adiabatic wall. Cavities without flow conditions were excluded. Fluid volume inside ISD was 22.1 m3. Automatic mesh generation was carried out, and total number of the cells was 67,671. As for the boundary conditions, environmental pressure of 101.3 kPa in the outlet and air mass flow of 0.75 kg/s in the inlet were set. The flow was assumed to be fully developed at steady-state condition, and the calculation of the flow was time-independent. The calculation converged after 343 iterations. Air temperature at the inlet was considered to be similar to the average ambient temperature, which was set to 30 °C during the day. Because heat transfer and temperature distribution was excluded in the simulation, temperature rise along the ISD tunnel was neglected. The wire mesh bottom of the trays and the layer of drying material resting on it was assumed as a porous medium with a porosity of 0.6 [24]. The resulting resolution was set at level 8, which is the highest level.

2.4. Drying Experiments

The drying experiments were conducted in Thika, Kiambu County, Kenya (1.042957° S, 37.096790° E), during December 2016. About 200 kg of fresh amaranth leaves of the variety “Big Leaf Mchicha” was obtained from the Marikiti market in Nairobi. The leaves were washed in clean water, blanched in water at 90 °C for about two minutes, and then cooled on an open stand for about five minutes. Subsequently, the leaves were layered 50 mm thick on the trays using a measuring stick. The weight of the fresh leaves was 8.5 kg per tray, corresponding with a loading density of 9.3 kg/m2. As a control for solar drying, a tray loaded in the same way was placed outside the dryer 900 mm from ground for conventional sun drying. A mesh bag filled with a bunch of leaves was placed on tray 5 in the ISD and another one on the control tray under sun drying. The air velocity at the ISD outlet was regularly measured in the morning and at noon using a digital anemometer (Testo 435, Testo SE & Co. KGaA, Lenzkirch, Germany).
Drying was started at noon. From the second day on, the fans were turned on at 08:00 and switched off at 18:00. During the drying, mixing was conducted manually every 2 h. To establish drying curves, the mesh bags were weighed at the time of mixing using a digital mass scale (RM/299, Ramtons, Nairobi, Kenya), and about 100 g of leaves were taken from tray 5 in the ISD and from the control tray under sun drying. The samples were kept in airtight aluminum bags for subsequent moisture content analysis according to DIN CEN/TS 14774-3 [25] at the International Center for Tropical Agriculture (CIAT) laboratory.
Solar radiation (W/m²) and voltage (V) of the PV modules, along with temperature (°C) and relative humidity (%) of ambient air and air inside the dyer (tray 5), were measured using USB data loggers (DL-131, DL-191V, DL-181THP, Voltcraft, Hirschau, Germany). Solar radiation and voltage were measured in 1 min intervals, whereas temperature and relative humidity were measured in 3 min intervals. Measurements were carried out based on East Africa Time (UTC + 03:00).

2.5. Statistical Analysis

Data analysis and graphing software (OriginPro 9.0, OriginLab Corp, Northampton, MA, USA) was used to fit mathematical models.

3. Results and Discussion

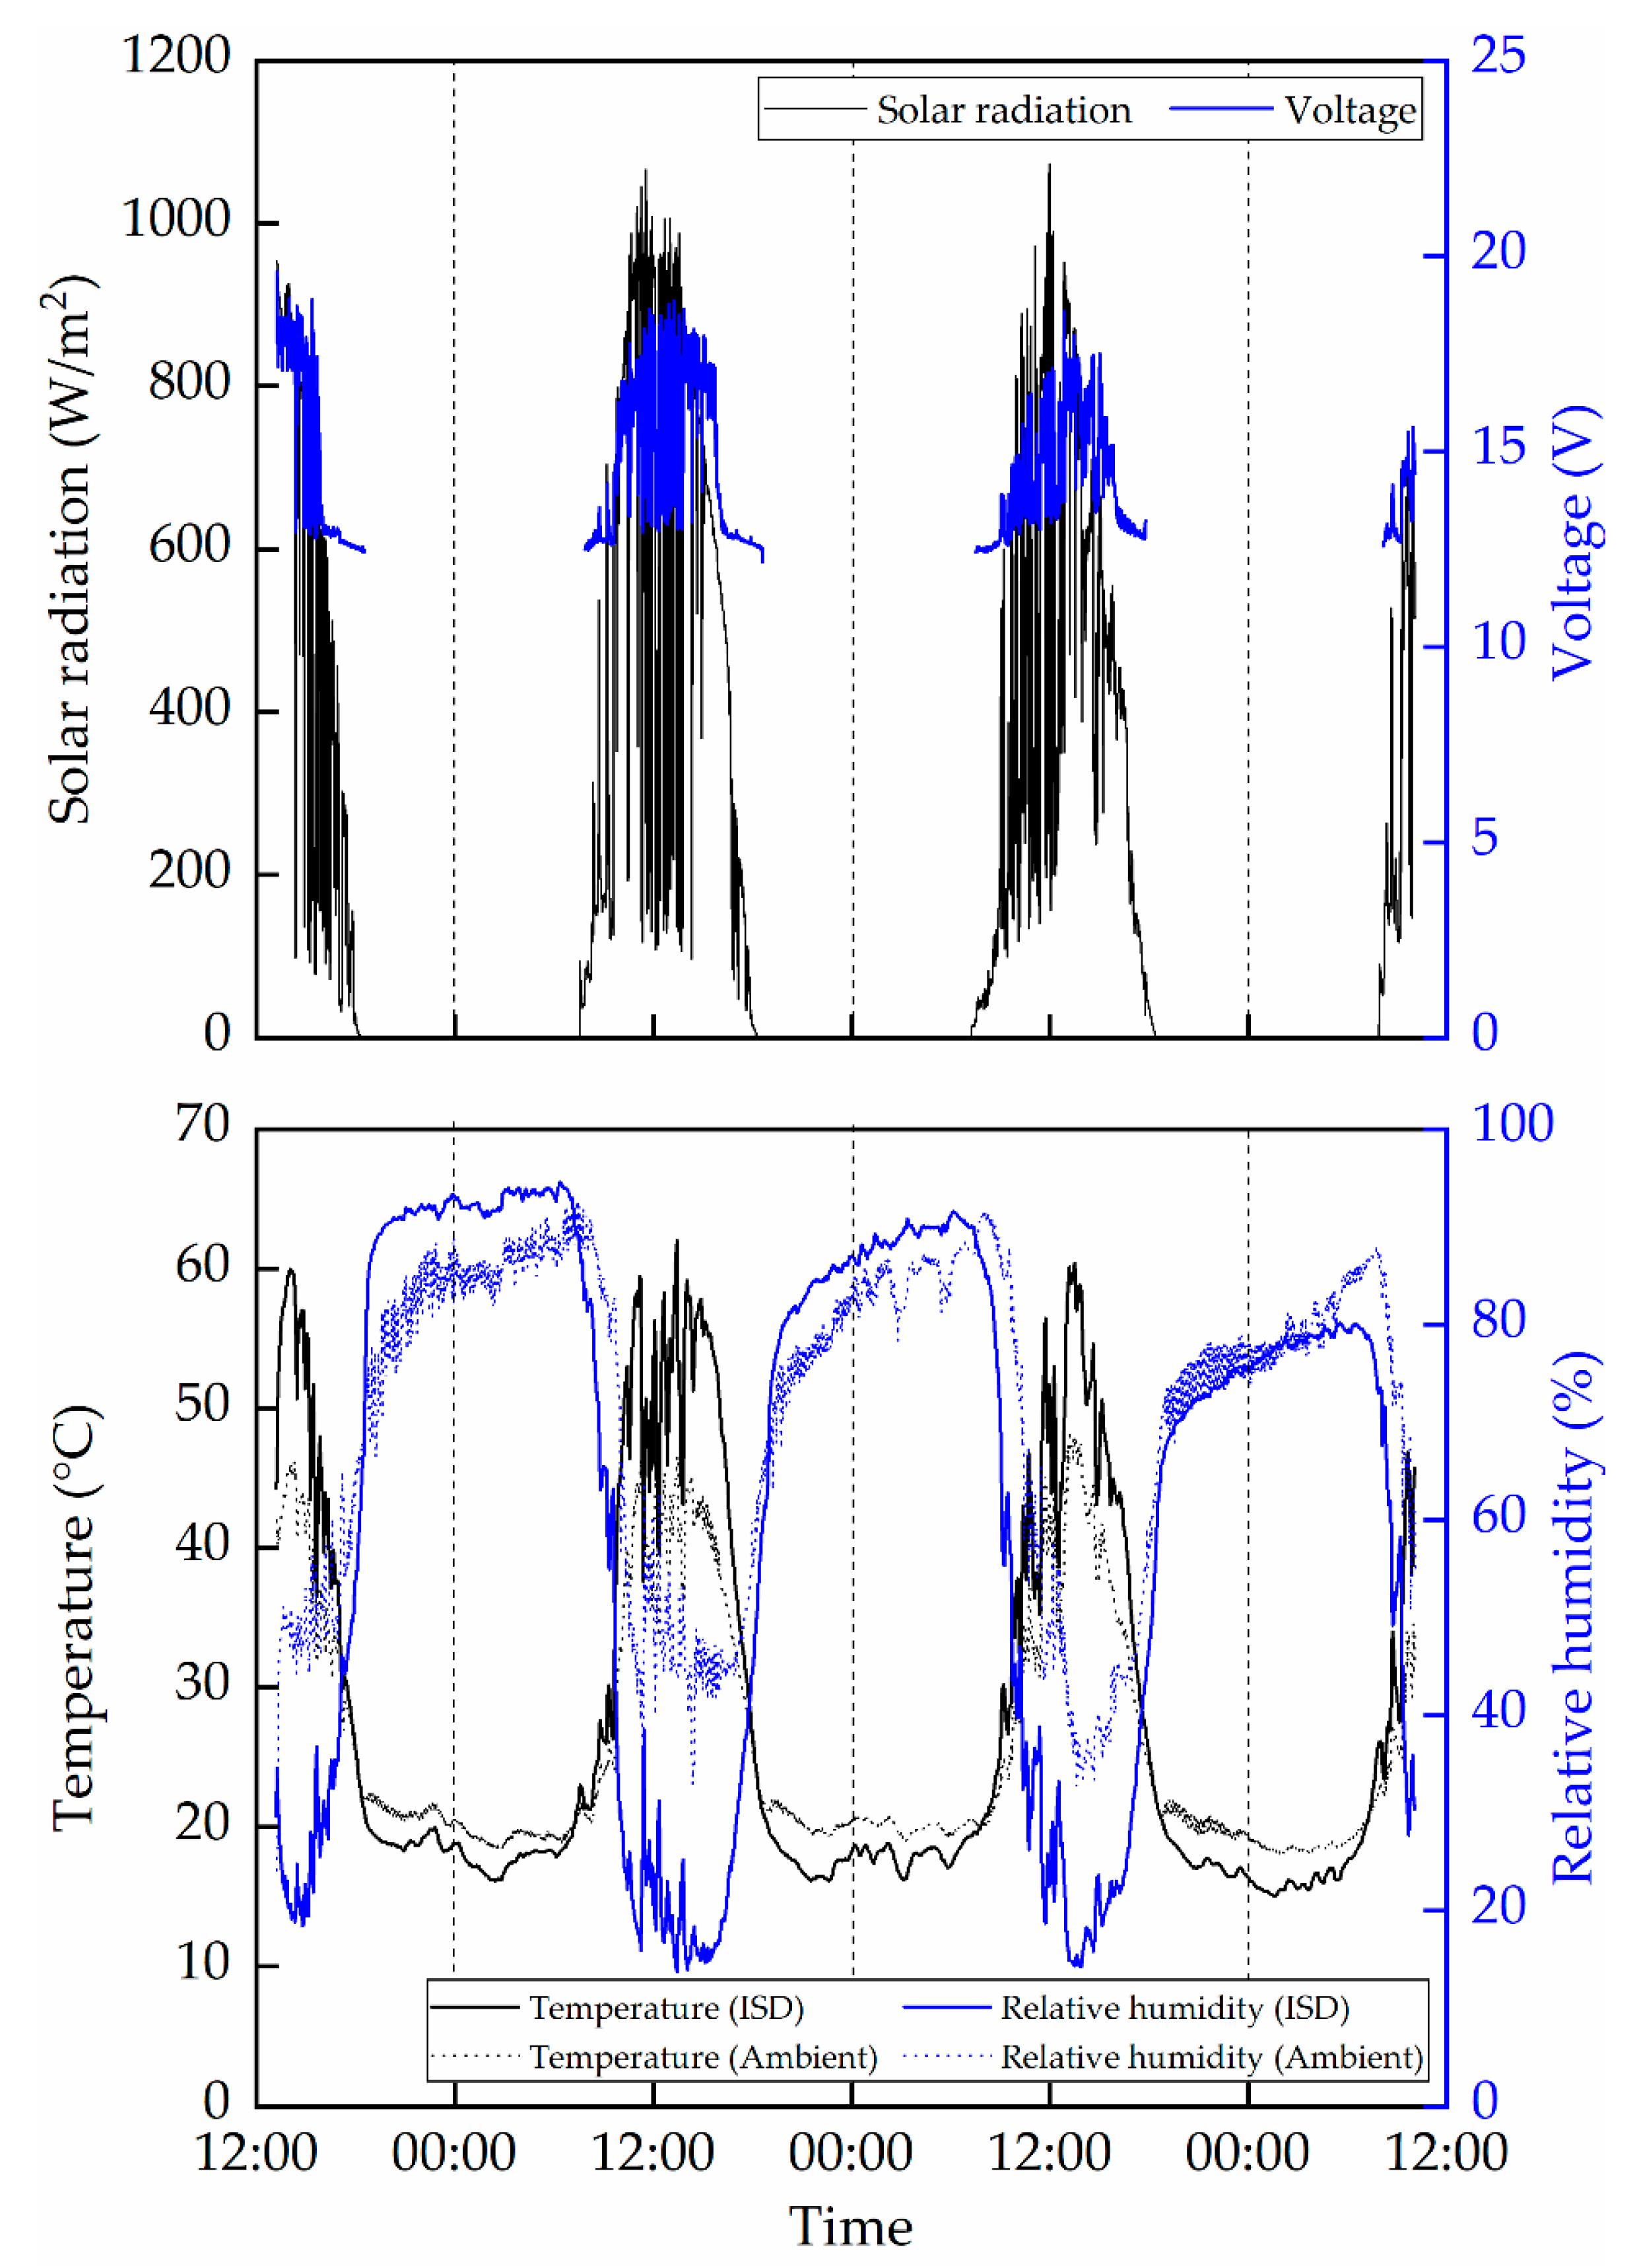
3.1. Estimated Performance of the ISD Solar System

Figure 3 presents solar radiation of Nairobi on 8–11 December 2016, together with the estimated course of SOC and voltage of the battery and resulting air mass flow of the two fans of the ISD. The fans were assumed to be switched off daily from 18:00 to 08:00, which was indicated by constant SOC and zero voltage in the simulation. When the solar system was switched off, the lowest battery SOC was noted as 76.3%. During operation, battery voltage and air mass flow of the fans varied from 12.3 to 13.1 V and from 0.72 to 0.76 kg/s, respectively. Total energy consumption during an assumed drying run of 72 h was 1587 Wh. Using a solar battery with an energy storage capacity of 912 Wh and two PV modules with a total capacity of 200 Wp, the solar system was sufficient to power the fans without any interruption. As for comparison, measured data from air mass flow were added. A difference between the measured and the simulated air mass flow ranged between 0.03 and 0.10 kg/s. It could correspond to turbulent airflow at the outlet and any small leaks along the ISD.

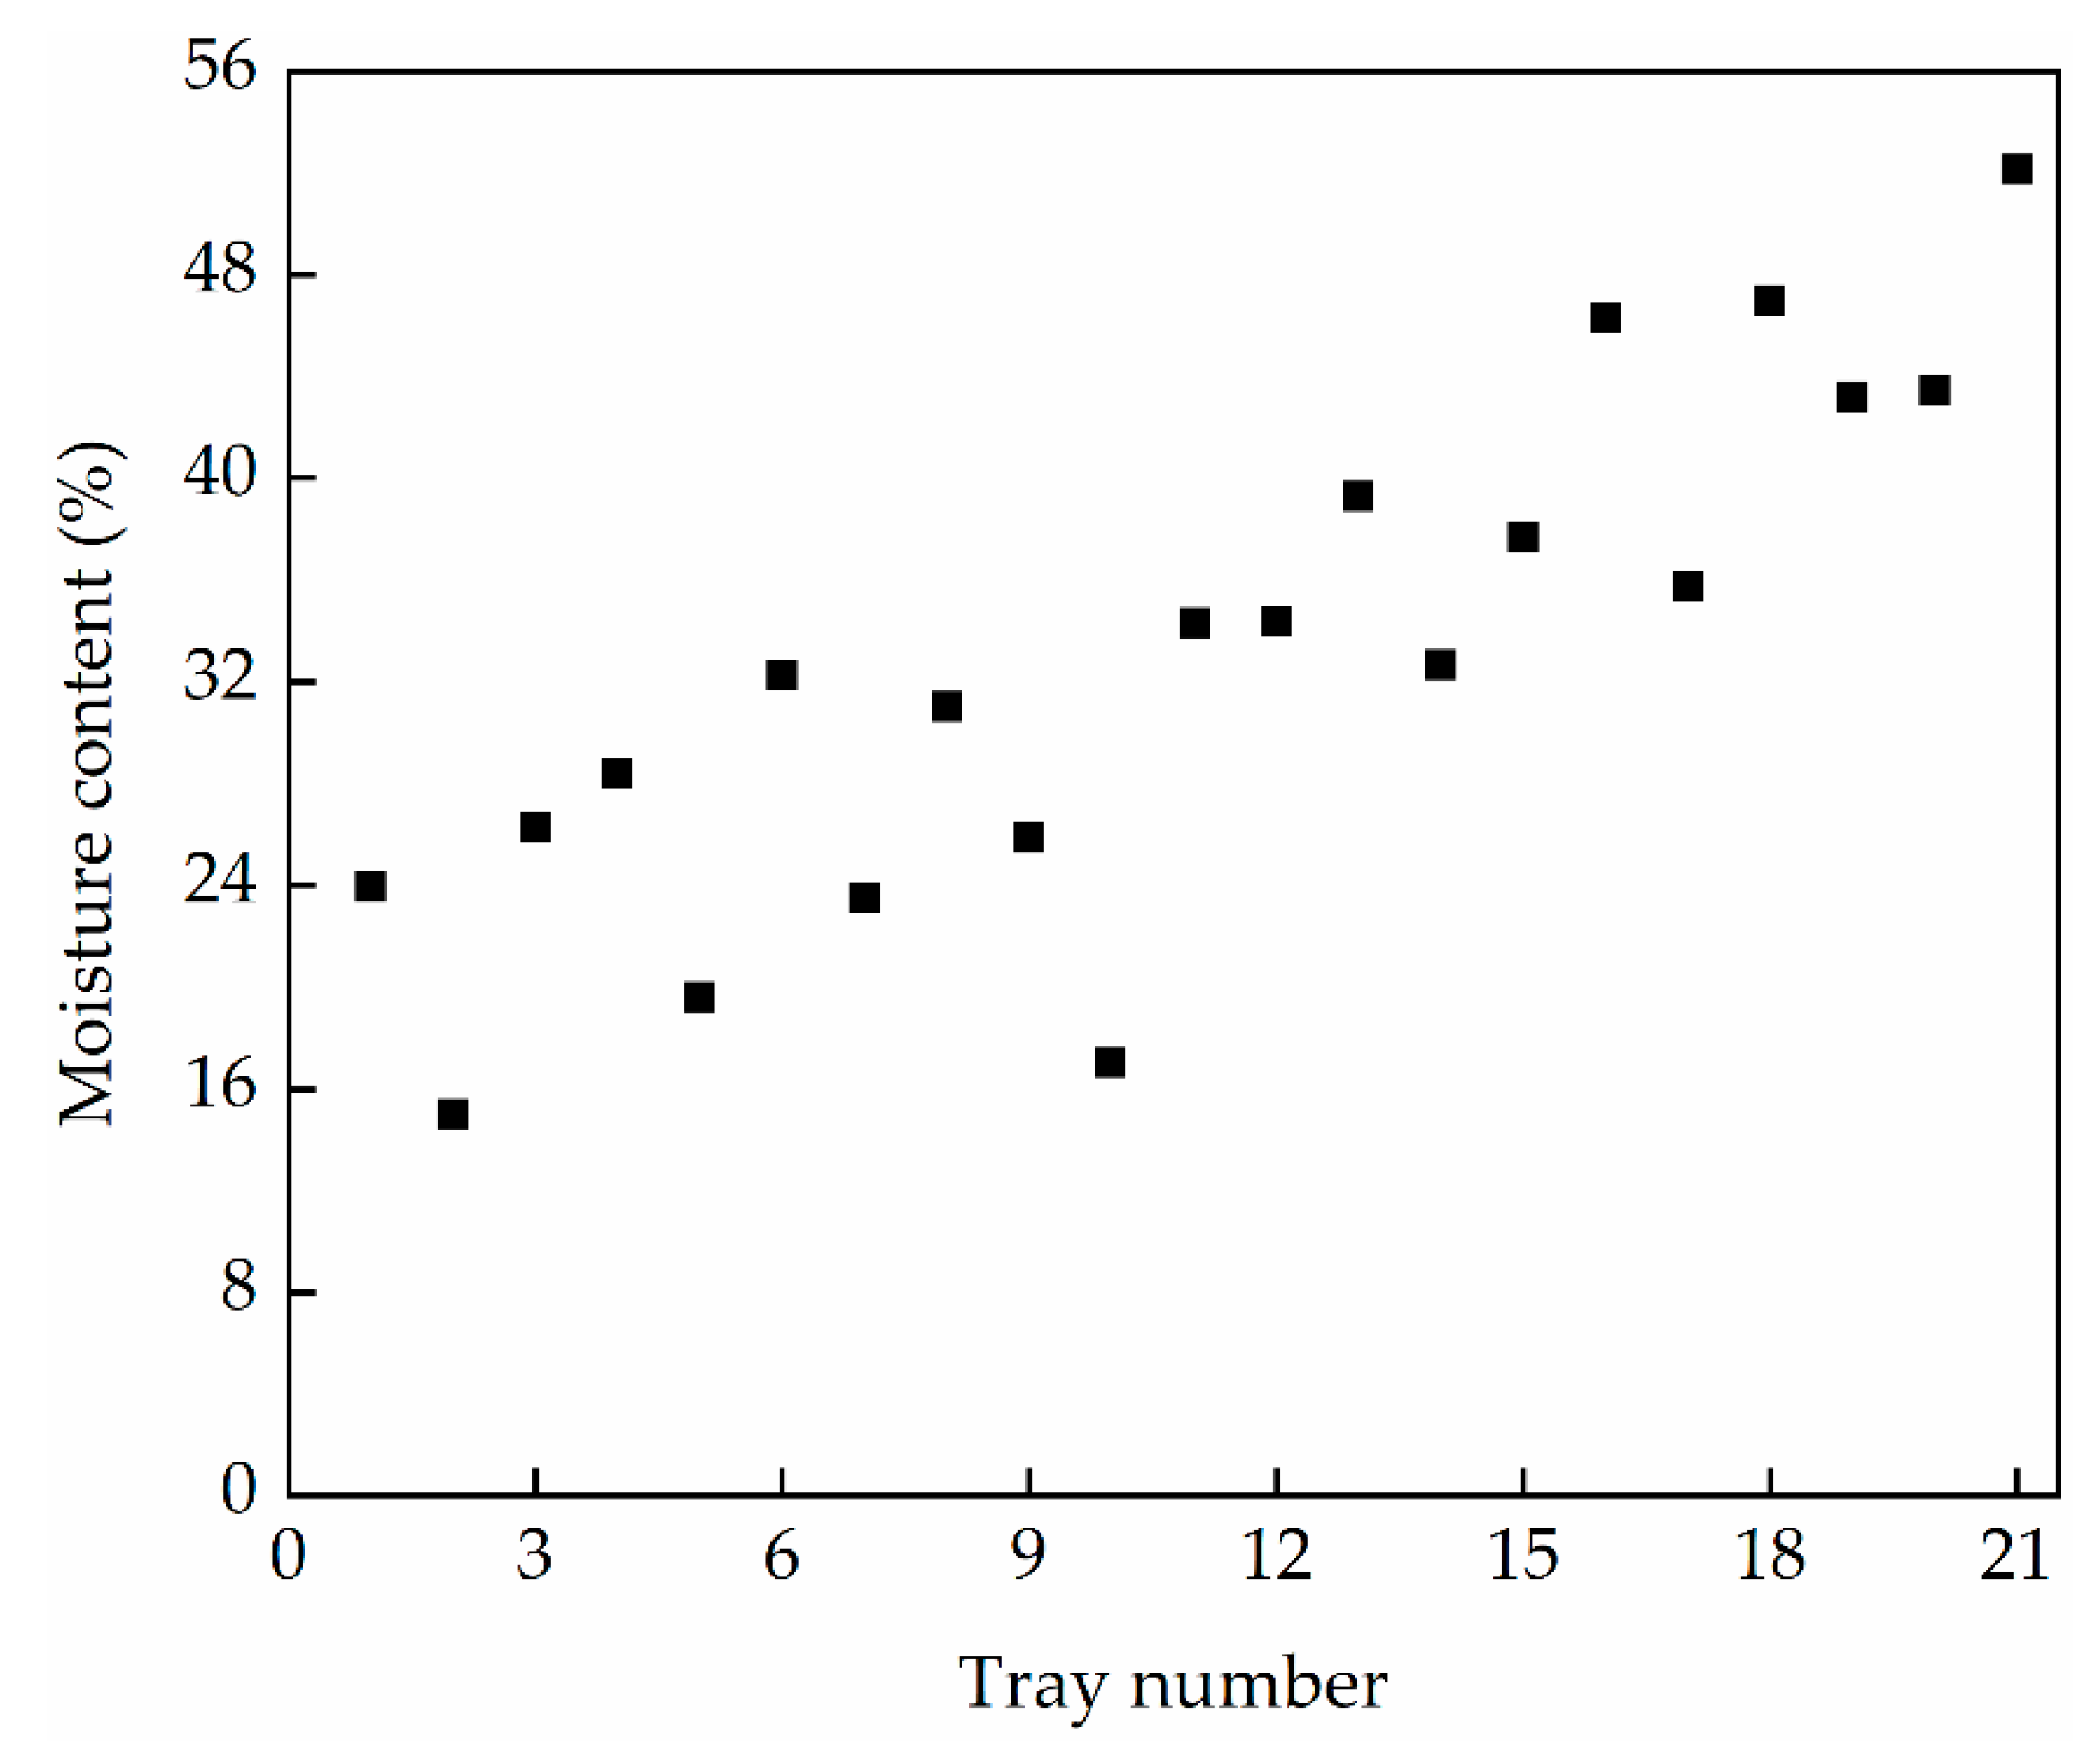
3.2. Simulation of Airflow Distribution in the ISD

Visualization of simulated airflow distribution and direction in the ISD (isometric and side view) and throughflow on the trays, i.e., exclusively vertical direction (top view), is presented in Figure 4. Air velocity inside the ISD varied between 0.5 and 1.5 m/s. High turbulence was visible in the preheating area. After the air deflector, air with high velocity passed across tray 1 to 5. It could be seen that the stands allowed both through- and overflow of the air, particularly on those trays. The contact of the leaves with the air was intense, and the air velocity was high, with values between 0.5 and 0.7 m/s. This indicates that the leaves on those trays might have had a faster drying rate compared to the other trays. The following trays 6 to 20 showed mainly overflow at a relatively uniform air velocity of around 0.15 m/s. Close to the outlet, particularly tray 21, turbulence was high again.
Due to the spatial differences in intensity of the vertical component of the air flow and the increasing relative humidity of the dryer, the drying rate decreased along the dryer. Figure 5 presents the momentary moisture content of the amaranth leaves after 68 h of drying along the dryer. An increasing pattern of moisture content of the leaves as they got closer to the outlet was observed. The highest moisture content of leaves of 55.2% was detected on tray 21.

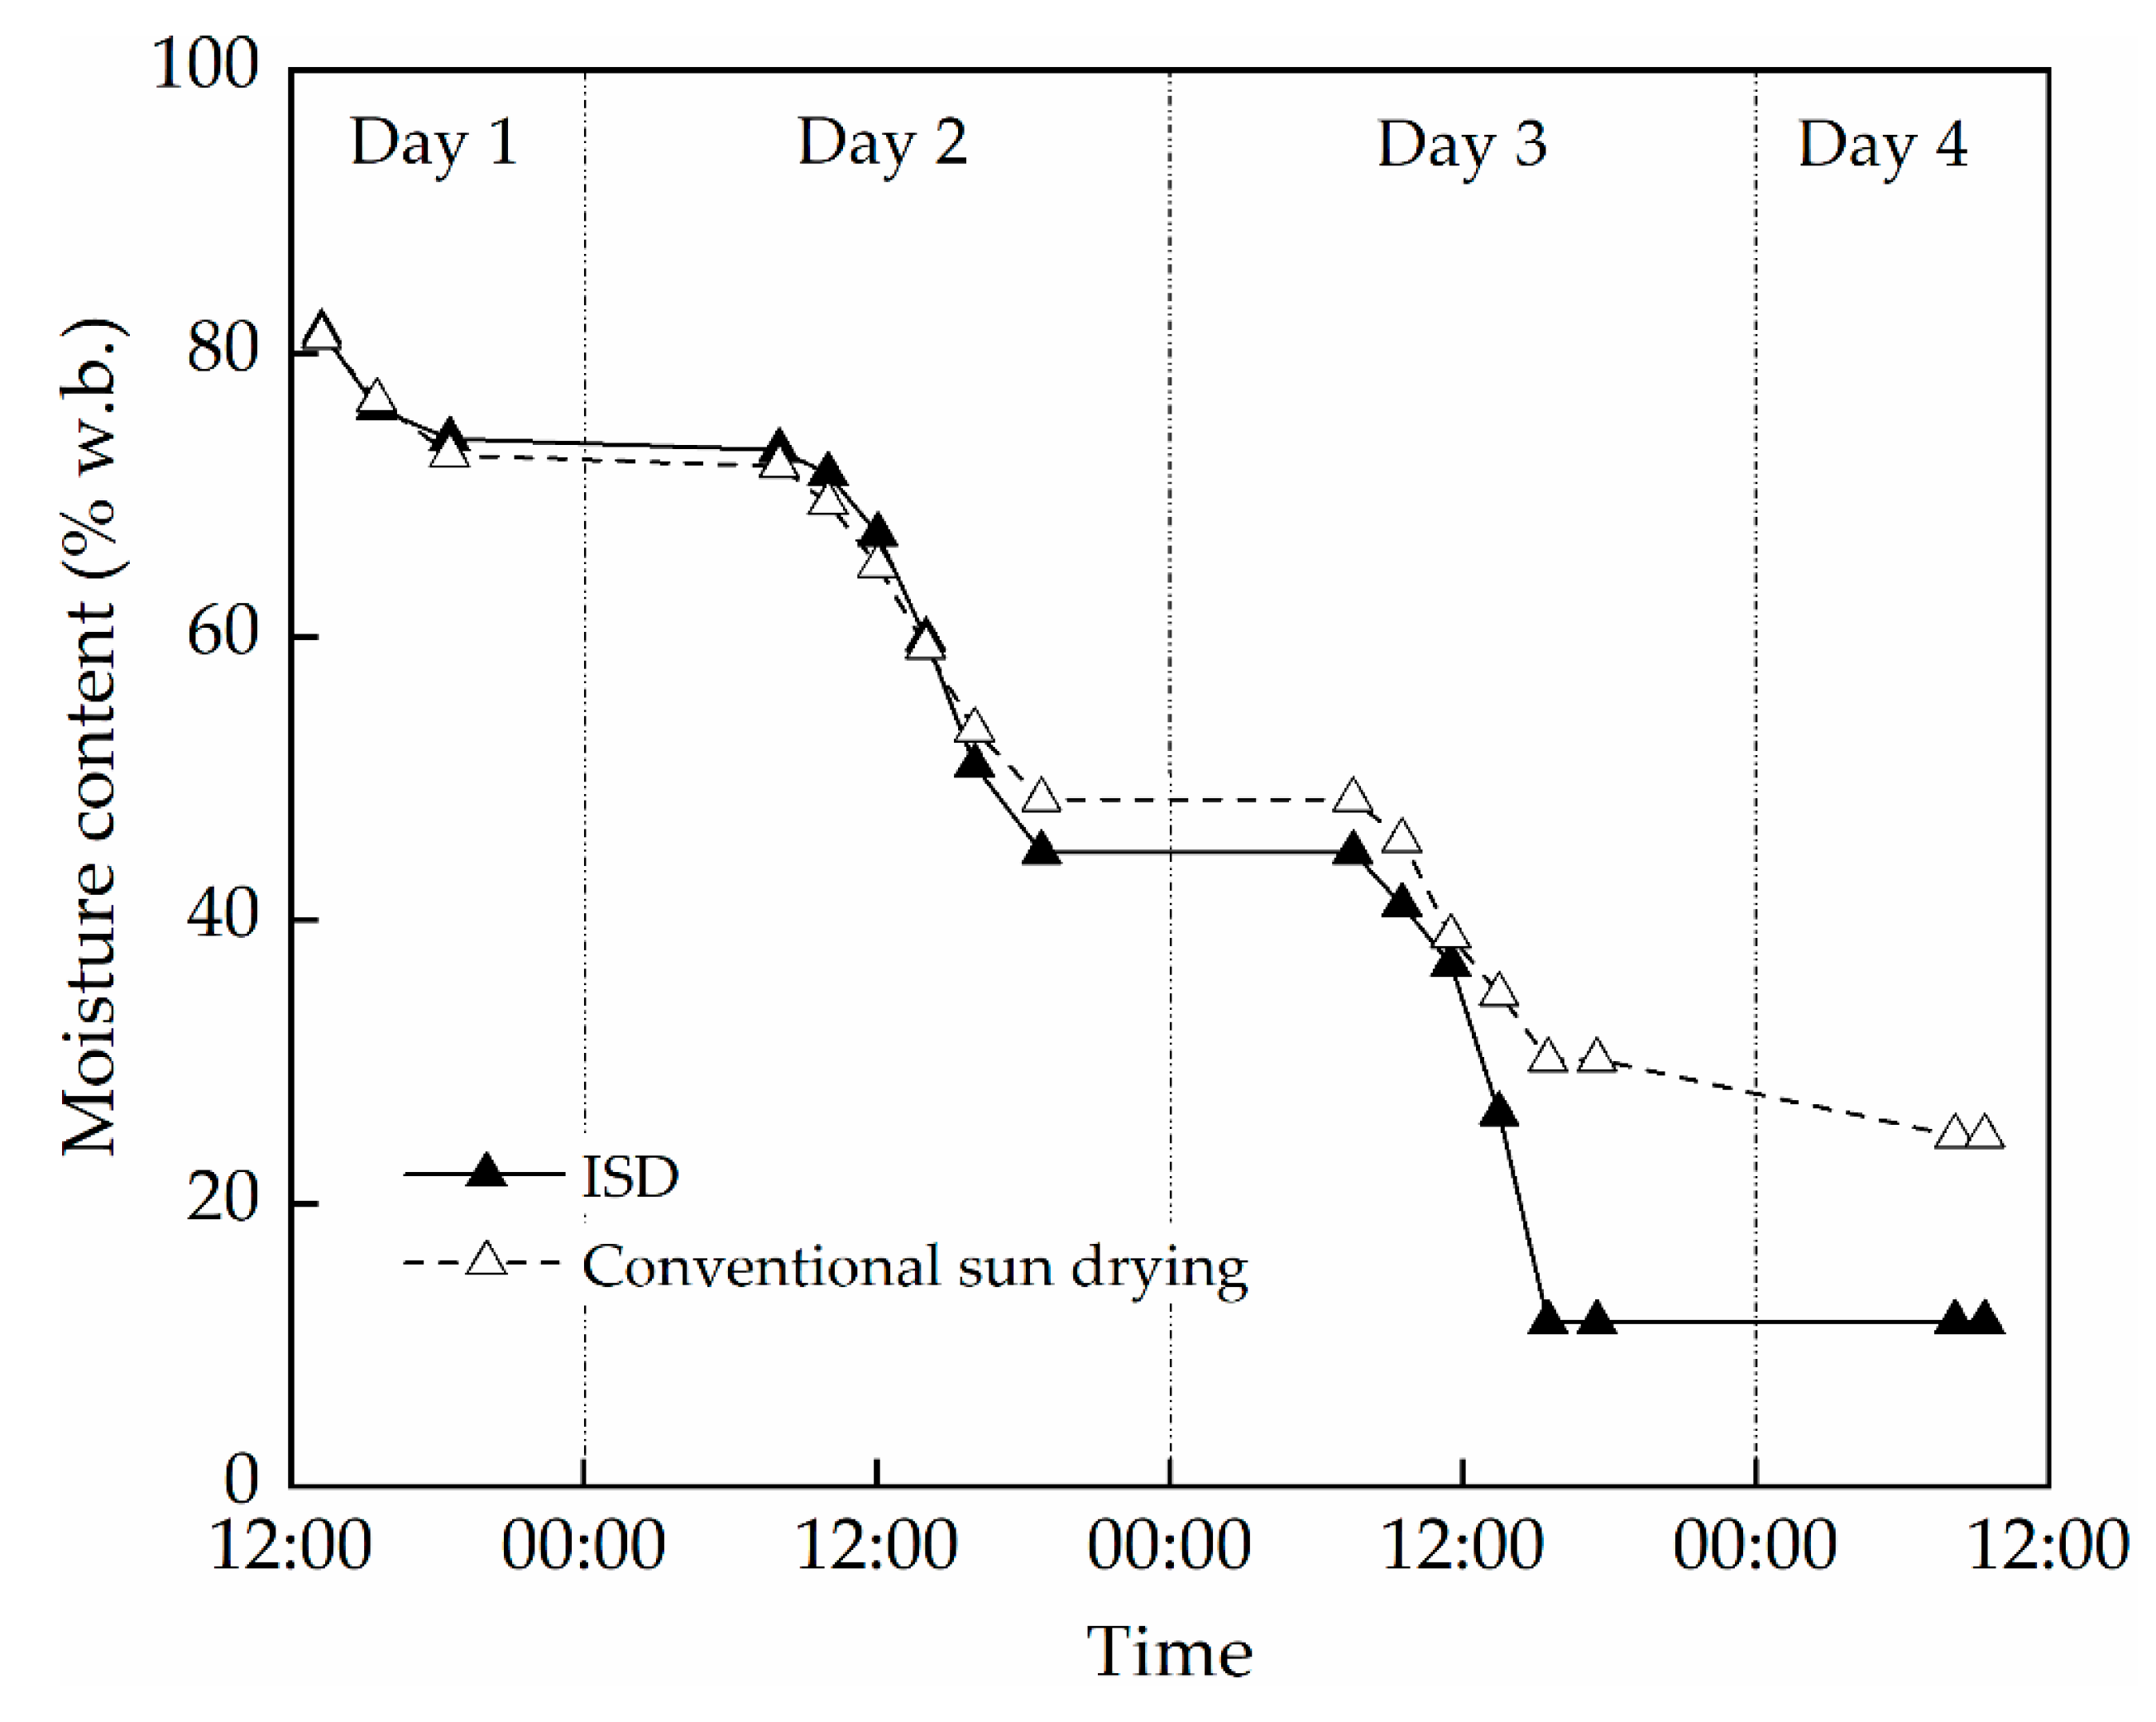
3.3. Drying Performance of the ISD Compared to Conventional Sun Drying

Solar radiation and PV voltage, along with temperature and relative humidity inside the ISD, were compared to ambient conditions for a four-day drying experiment on 8–11 December 2016 and are shown in Figure 6. During the measurement period, bright cloud fields passed through and the sun was frequently shining through openings, causing frequent fluctuations in measured solar radiation and resulting in high peaks up to 1070 W/m2. Same fluctuations were reflected in PV voltage, where values of 10.22 to 18.75 V were obtained for solar radiation of 510 to 950 W/m2. Maximum PV voltage was 18.91 V and was achieved on December 8 (day 1) at 14:00. During the night, the ambient temperature and relative humidity could reach up to 18.0 °C and 92.7%. The highest recorded temperature inside the ISD was 63.4 °C on December 9 at 14:09, while the ambient temperature was 45.4 °C. Drying conditions at temperatures of 40 °C or above were typically achieved in the ISD from 12:00 to 16:00. During the night, the ISD could show a lower temperature and a higher relative humidity than the ambient condition.
Fluctuations of the temperature could be attributed to the opening of the zipper while mixing the leaves, which resulted in heat loss. In total, mixing the leaves on all 21 trays required around 3.5 to 4.5 min. In order to minimize the opening time of the zipper, the mixing process should be done as efficiently as possible.
The drying curve of blanched amaranth leaves inside the ISD and under sun drying is presented in Figure 7. The total drying time was 68.08 h, whereas the final moisture content of the leaves dried in the ISD and sun drying was 11.6% and 24.7% w.b., respectively. It can be seen that the ISD showed a better drying performance than sun drying, particularly on day 3. In the night between days 3 and 4, a visible reduction of the moisture content in the leaves under sun drying was detected. This might be due to lower relative humidity of the ambient air and occurrence of wind, which was observed during that night. A lower relative humidity of the air causes a higher vapor pressure deficit of the air, which accelerates the drying rate [26].
A different pattern was reported in drying paddy rice using a previous type of the ISD, which resulted in a lower drying performance than sun drying during the dry season [13]. This might not be the case for amaranth leaves. Unlike paddy rice, amaranth leaves have no hulls or shells that form a resistance to moisture diffusion and thus reduce the drying rate [27].
By visual inspection, it was observed that the leaves were not dried uniformly. On the last day, leaves in the corners of the trays were not completely dried. This might have been caused by shading of the leaves by the black bottom layer, which was raised at both sides when the tunnel was inflated. To improve the design, the width of the black bottom layer in the ISD should be reduced.
Another aspect that lowered the drying performance of amaranth leaves was the presence of stalks. It was observed that the proportion of stalks in blanched leaves was around 41%. At the end of drying, the stalks were less dry than the leaves, as shown in Figure 8. The stalks have an outer layer, which prevents water evaporation and therefore prolongs the overall drying time. In common practice, solar drying of leafy vegetables without the stalks takes only about 12 h [28]. The optimum time and method to dry the stalks should be further studied. The stalks are also a valuable commodity for amaranth leaf processors. In order to reduce the load in the dryer and accelerate the drying process, it is recommended to first unload the leaves soon after they are completely dried and then proceed with the stalks.

4. Conclusions

The drying performance of an inflatable solar dryer for drying amaranth leaves was compared to conventional sun drying. The ISD showed potential as a mobile solar dryer for small and medium enterprises (SMEs) to accelerate the drying process of amaranth leaves and to protect the drying product from dust and insects. The temperature inside the ISD was considerably higher than the ambient temperature, and the drying rate of leaves was thus faster in the ISD than with sun drying. The air deflector integrated in the preheating zone showed the desired effect, i.e., to avoid blowing away dried leaves from the trays. As a further hardware improvement, it is recommended that the width of the black bottom layer of the ISD be reduced to avoid lateral shading of the drying product. To improve the drying process of amaranth leaves, the stalks should be separated from the leaves, chopped, and put on different trays for longer drying.
Further research should focus on a fan operation of the ISD also during the night for periods with favorable ambient conditions by increasing the battery capacity. Furthermore, advanced CFD modeling with an integration of mass and heat transfer should be used to further understand the influence of airflow distribution on the drying performance.

Author Contributions

Conceptualization, S.R., M.N., and J.M.; data curation, S.R.; formal analysis, S.R.; funding acquisition, C.G.K.C. and J.M.; investigation, S.R.; methodology, S.R.; project administration, M.N., S.S., C.G.K.C., and J.M.; resources, S.S., C.G.K.C., and J.M.; supervision, M.N. and J.M.; validation, S.R.; visualization, S.R.; writing—original draft preparation, S.R.; writing—review and editing, M.N., S.S., C.G.K.C., and J.M.

Funding

This research was financially supported by the German Federal Ministry for Economic Cooperation and Development (BMZ) through the project 15.7860.8-001.00 “Making Value Chains Work for Food and Nutrition Security of Vulnerable Populations in East Africa”, led by the International Center for Tropical Agriculture (CIAT).

Acknowledgments

The authors are grateful to Mercy Lung’aho, Anthony Ngoto, and Juliet Ogola from the International Center for Tropical Agriculture (CIAT) for all the facilities and support. The authors also express gratitude to Jackson Otenga as operational manager and Tei Mukunya as CEO of Azuri Health in Kenya for their support during field experiments. The authors would also like to thank Sabine Nugent for language editing.

Conflicts of Interest

The authors declare no conflict of interest.

References

  1. Grabowski, S.; Ramaswamy, H.S.; Marcotte, M. Drying of fruits, vegetables, and spices. In Handbook of Postharvest Technology: Cereals, Fruits, Vegetables, Tea, and Spices; Ramaswamy, H.S., Raghavan, G.S.V., Chakraverty, A., Mujumdar, A.S., Eds.; Marcel Dekker Inc.: New York, NY, USA, 2003; pp. 653–695. [Google Scholar]
  2. Janjai, S.; Bala, B.K. Solar Drying Technology. Food Eng. Rev. 2012, 4, 16–54. [Google Scholar] [CrossRef]
  3. Müller, J.; Mühlbauer, W. Solar drying. In Modern Drying Technology; Tsotsas, E., Mujumdar, A.S., Eds.; Wiley-VCH Verlag GmbH & Co. KGaA: Weinheim, Germany, 2011; pp. 199–243. [Google Scholar]
  4. Jebur, H.A.; Jabr, A.K.; Jassim, S.Y. Evaluation of thermal efficiency for solar energy storage of agricultural products: A review. Plant Arch. 2019, 19, 17–24. [Google Scholar]
  5. Sharma, V.K.; Colangelo, A.; Spagna, G. Experimental investigation of different solar dryers suitable for fruit and vegetable drying. Renew. Energy 1995, 6, 413–424. [Google Scholar] [CrossRef]
  6. Amir, E.J.; Grandegger, K.; Esper, A.; Sumarsono, M.; Djaya, C.; Mühlbauer, W. Development of a multi-purpose solar tunnel dryer for use in humid tropics. Renew. Energy 1991, 1, 167–176. [Google Scholar] [CrossRef]
  7. Singh, P.; Shrivastava, V.; Kumar, A. Recent developments in greenhouse solar drying: A review. Renew. Sustain. Energy Rev. 2018, 82, 3250–3262. [Google Scholar] [CrossRef]
  8. Khazimov, M.Z.; Khazimov, K.M.; Urmashev, B.A.; Tazhibayev, T.S.; Sagyndykova, Z.B. Intensification of the Plant Products Drying Process by Improving Solar Dryer Design. J. Eng. Thermophys. 2018, 27, 580–592. [Google Scholar] [CrossRef]
  9. Sai Krishna Teja, M.; Narasimha Rao, K.V.; Pochont, N.R. Design, development and experimental evaluation of solar dryer. Int. J. Mech. Prod. Eng. Res. Dev. 2018, 8, 949–968. [Google Scholar]
  10. Noh, A.M.; Mat, S.; Ruslan, M.H. CFD simulation of temperature and air flow distribution inside industrial scale solar dryer. J. Adv. Res. Fluid Mech. Therm. Sci. 2018, 45, 156–164. [Google Scholar]
  11. Orbegoso, E.M.; Saavedra, R.; Marcelo, D.; La Madrid, R. Numerical characterisation of one-step and three-step solar air heating collectors used for cocoa bean solar drying. J. Environ. Manag. 2017, 203, 1080–1094. [Google Scholar] [CrossRef]
  12. Lutz, K.; Mühlbauer, W. Solar tunnel dryer with integrated collector. Dry. Technol. 1986, 4, 583–603. [Google Scholar] [CrossRef]
  13. Salvatierra-Rojas, A.; Nagle, M.; Gummert, M.; de Bruin, T.; Müller, J. Development of an inflatable solar dryer for improved postharvest handling of paddy rice in humid climates. Int. J. Agric. Biol. Eng. 2017, 10, 269–282. [Google Scholar]
  14. Ng’Ang’A, M.N.; Muasya, R.M.; Omami, E.; Ohiokpehai, O. Effect of environment, intercropping systems and harvest intervals on protein and β-carotene contents of leaf Amaranth. Acta Hortic. 2011, 911, 433–436. [Google Scholar]
  15. Liu, F.; Stützel, H. Leaf water relations of vegetable amaranth (Amaranthus spp.) in response to soil drying. Eur. J. Agron. 2002, 16, 137–150. [Google Scholar] [CrossRef]
  16. Nzomo, E.M.; Ariyawardana, A.; Sila, D.N.; Sellahewa, J.N. Reaping the potential benefits of amaranth: Value chain challenges ahead for Kenya. In Acta Horticulturae; Mecozzi, M., Srinivasan, R., Keatinge, J.D.H., Eds.; International Society for Horticultural Science: Leuven, Belgium, 2015; Volume 1102, pp. 191–198. [Google Scholar]
  17. Oliveira, S.M.; Brandão, T.R.S.; Silva, C.L.M. Influence of Drying Processes and Pretreatments on Nutritional and Bioactive Characteristics of Dried Vegetables: A Review. Food Eng. Rev. 2016, 8, 134–163. [Google Scholar] [CrossRef]
  18. Negi, P.S.; Roy, S.K. Effect of Blanching and Drying Methods on β -Carotene, Ascorbic acid and Chlorophyll Retention of Leafy Vegetables. LWT Food Sci. Technol. 2000, 33, 295–298. [Google Scholar] [CrossRef]
  19. Oboh, G. Effect of blanching on the antioxidant properties of some tropical green leafy vegetables. LWT Food Sci. Technol. 2005, 38, 513–517. [Google Scholar] [CrossRef]
  20. Sukamongkol, Y.; Chungpaibulpatana, S.; Ongsakul, W. A simulation model for predicting the performance of a solar photovoltaic system with alternating current loads. Renew. Energy 2002, 27, 237–258. [Google Scholar] [CrossRef]
  21. Torres-Toledo, V.; Meissner, K.; Täschner, P.; Martınez-Ballester, S.; Müller, J. Design and performance of a small-scale solar ice-maker based on a DC-freezer and an adaptive control unit. Sol. Energy 2016, 139, 433–443. [Google Scholar] [CrossRef]
  22. Poblete, R.; Cortes, E.; Macchiavello, J.; Bakit, J. Factors influencing solar drying performance of the red algae Gracilaria chilensis. Renew. Energy 2018, 126, 978–986. [Google Scholar] [CrossRef]
  23. Dassault Systèmes. Technical Reference-Solidworks Flow Simulation 2017; Dassault Systèmes: Vélizy-Villacoublay, France, 2017. [Google Scholar]
  24. Zogzas, N.P.; Maroulis, Z.B.; Marinos-Kouris, D. Densities, shrinkage and porosity of some vegetables during air drying. Dry. Technol. 1994, 12, 1653–1666. [Google Scholar] [CrossRef]
  25. DIN CEN/TS 14774-3. Determination of moisture content-oven dry method. In Part 3: Moisture in General Analysis Sample; Deutsches Institut für Normung e.V.: Berlin, Germany, 2004. [Google Scholar]
  26. Pereira, L.S.; Allen, R.G.; Smith, M.; Raes, D. Crop evapotranspiration estimation with FAO56: Past and future. Agric. Water Manag. 2015, 147, 4–20. [Google Scholar] [CrossRef]
  27. Sharma, A.; Chen, C.R.; Vu Lan, N. Solar-energy drying systems: A review. Renew. Sustain. Energy Rev. 2009, 13, 1185–1210. [Google Scholar] [CrossRef]
  28. Sobukola, O.P.; Dairo, O.U.; Sanni, L.O.; Odunewu, A.V.; Fafiolu, B.O. Thin layer drying process of some leafy vegetables under open sun. Food Sci. Technol. Int. 2007, 13, 35–40. [Google Scholar] [CrossRef]
Figure 1. Inflatable solar dryer (ISD) before being inflated (left, note the deflector board) and the inflated ISD during drying experiments (right).
Applsci 09 03431 g001
Figure 2. Placement of trays on wooden frames inside the ISD.
Applsci 09 03431 g002
Figure 3. State-of-charge (SOC) and voltage of battery and air mass flow of an inflatable solar dryer (ISD) with two 100 Wp PV modules and a 912 Wh battery, estimated for solar radiation data of Nairobi, together with measured data for air mass flow (data points), Kenya, on 8–11 December 2016.
Applsci 09 03431 g003
Figure 4. Visualization of airflow distribution and direction in the ISD (isometric and side view) and vertical flow through the 21 trays (top view).
Applsci 09 03431 g004
Figure 5. Momentary moisture content of leaves along the dryer (trays 1–21) in the ISD after 68 h of drying.
Applsci 09 03431 g005
Figure 6. Solar radiation and voltage generated by the PV modules (top) and temperature and relative humidity in the ISD and ambient conditions (bottom) during the drying experiment on 8–11 December 2016.
Applsci 09 03431 g006
Figure 7. Moisture content (MC) over time of amaranth leaves dried in the ISD and under sun drying (8–11 December 2016).
Applsci 09 03431 g007
Figure 8. Amaranth leaves during drying with a high share of stalks (left) and the separated stalks (right).
Applsci 09 03431 g008

