Article

Assessment of Performance of Fiber Reinforced Geopolymer Composites by Experiment and Simulation Analysis

1
Department of Architectural Engineering, Sejong University, Seoul 05006, Korea
2
Faculty of Civil Engineering, Vietnam National University of Ho Chi Minh City, Ho Chi Minh City 700000, Vietnam
3
Department of Architectural Engineering, Hanyang University, Seoul 04763, Korea
*
Author to whom correspondence should be addressed.
Appl. Sci. 2019, 9(16), 3424; https://doi.org/10.3390/app9163424
Submission received: 16 July 2019 / Revised: 16 August 2019 / Accepted: 16 August 2019 / Published: 20 August 2019

Abstract

:
In this work, the experimental and simulation analysis of the performance of geopolymer composites reinforced with steel fiber and polypropylene fiber is investigated. By embedding hooked end steel fiber and polypropylene fiber with various volume fractions of 0%, 0.5%, 1%, 1.5% to the geopolymer concrete mixture, the mechanical behavior was enhanced significantly through experimental results. The compressive strength was improved 26% with 0.5% of polypropylene fiber and 46% with 1% of hooked end steel fiber while the increment of splitting tensile strength was 12% and 28%, respectively. The flexural strength of specimens using two fiber types was also improved when compared with the non-fiber geopolymer concrete. The highest increment obtained with 1.5% of fiber volume content was from 26% to 42%. The compressive performance and flexural performance of fiber-reinforced geopolymer concrete were also better than specimens without fiber, with a higher load carrying capacity, higher stress, higher toughness and smaller strain. Using hooked end steel fiber resulted in better mechanical strength than using polypropylene fiber, and the presence of fibers is an important factor related to the strength improvements. A finite element analysis was modeled by the ANSYS program, and this showed that the load–deflection response and crack patterns also agreed quite well with experimental results.

1. Introduction

Concrete is one of the most popular materials used in modern construction, and cement is known as the main binder of the concrete structure. However, using cement leads to a negative effect on the environment due to the emission of carbon dioxide generated during the production of cement, according to Davidovits [1]. As a consequence, the influence of climate change, greenhouse effect, calamities have serious threats to human life and the environment. The demand for research regarding friendly environmental construction materials, a decrement the carbon dioxide emissions into the air, and a reduction of cost are important needs for sustainable development all around the world. Therefore, many works have been carried out to develop a new eco-friendly and green material used to alter cement in concrete.
“Geopolymers” was a term invented by Davidovits [2] in the 1970s which can be used to be describe new materials or alternative binders in concrete. Geopolymers were investigated by combining source materials such as slag, fly ash, and minerals to replace cement and alkaline solution. There are many advantages when using geopolymer composites, such as higher mechanical performance, low production cost, good properties like low creep and drying shrinkage, excellent fire resistance, and a low corrosion rate [3,4,5,6,7,8].
Though geopolymer composites have good performance, their poor flexural and tensile properties are issues that need investigation. The combing of fibers in geopolymer mixtures is one of the best solutions to enhance these properties. In terms of ordinary concrete, cement, steel, glass, polypropylene and other fiber have been successfully used and applied in its structure. The embedding of fiber in concrete leads to the improvement of strength properties as well as control of the development of cracking in structural applications. Many works have indicated that the properties of concrete reinforced with fiber, such as compressive strength, flexural strength, tensile strength, toughness, ductility, fatigue behavior and creep behavior were improved significantly compared to concrete without fibers.
Vijai et al. [9] presented the mechanical properties of glass fiber-reinforced geopolymer concrete. This work concludes that the presence of 0.03% glass fiber enhanced compressive strength and flexural strength by 6% and 16%, respectively. Alomayri and Low [10] considered the influence of volume fractions from 0% to 1% of cotton fiber on the characteristics of geopolymer composites. Their study found that compressive strength of geopolymer paste increased at 0.5% and decreased at 0.7% and 1% of volume fraction of fiber.
Bernal et al. [11] studied geopolymer concrete using slag as a source material and steel fiber. There is a decrease in compressive strength and an increase in flexural strength and splitting tensile strength when the volume fraction of fiber increases. The influence of steel fiber on geopolymer concrete composites using boroaluminosilicate was also found by yje research of Nazari et al. [12] and Al-mashhadani et al. [13]. Their results indicated that there was good adhesion between steel fiber, geopolymeric paste, and mortar. The increase in the compressive and flexural strength depends on the volume fractions of steel fibers used, and the microstructural analysis showed that there was a good interfacial bonding of the embedded fiber and the geopolymeric binder.
In another study, the improvements in the strength of alkaline cement mortars reinforced with polypropylene fiber were investigated. Puertas et al. [14] carried out an experiment with mortar specimens with three types of source materials—slag, fly ash, and a fly ash/slag combination—to evaluate the mechanical properties of the alkaline mortars. A slight decrease of mechanical properties happened while using 0%, 0.5% and 1% of polypropylene fiber. In terms of the effect of other fibers such as carbon fiber, polyvinylalcohol PVA fiber on fiber-reinforced geopolymer paste and concrete were also investigated in related paper [15,16,17,18].
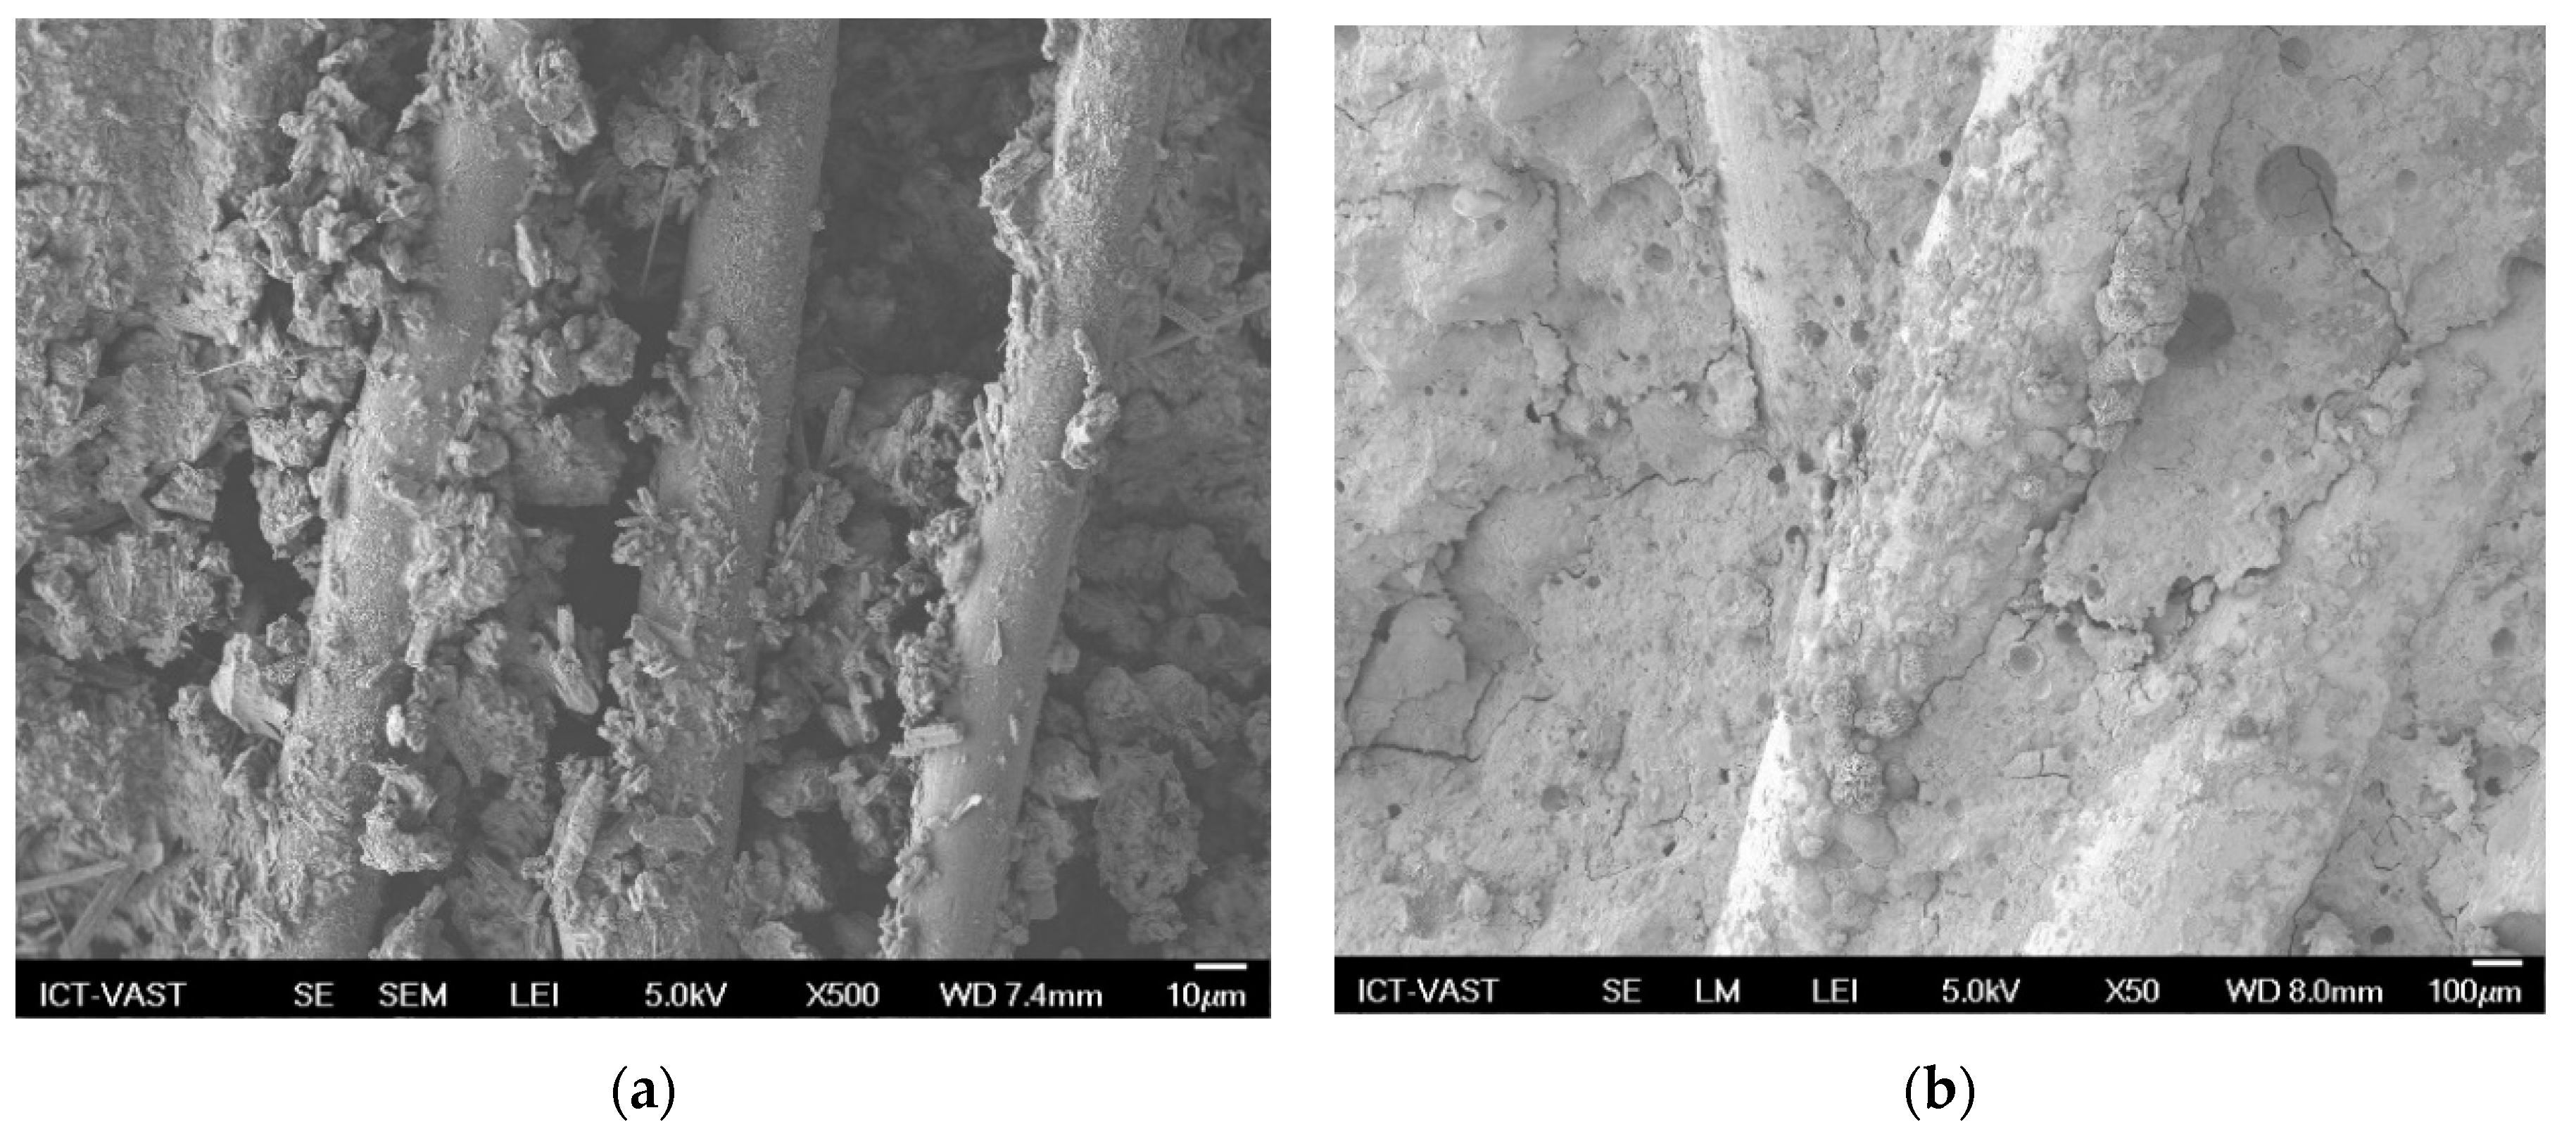
The corporation of fiber has been researched in some studies, however, the influences of fiber on the performance of geopolymer concrete fabricated with fibers, especially types and geometry properties, needs to be investigated fully. Only the performance of a single fiber reinforced in a geopolymer matrix and mortar was considered, and there remains a question of the mechanical response of fiber-reinforced geopolymer concrete. Thus, the main purpose of this work was to figure out the deeper understanding of the effect of fiber on the mechanical performance of geopolymer concrete using fly ash as the main source material. Performance aspects such as compressive performance, splitting tensile strength, and flexural performance with both polypropylene fiber and hooked end steel fiber were studied. In addition, a simulation analysis of geopolymer concrete was conducted, and a comparison between experimental results and analytical results are shown in this study. Addtionally, the adhesion of fibers and geopolymer paste was investigated through scanning electron microscope (SEM) photos.

2. Materials and Methods

2.1. Materials and Mix Proportions

The experiment was conducted by using fly ash, fibers, aggregate and an alkaline solution as shown in Figure 1 and Figure 2 and mix proportion of fiber-reinforced geopolymer concrete per mass is shown in Table 1. In a mixture of geopolymer composites, fly ash class F, according to the classification of standard ASTM C618 [19], was used as the main material with the chemical composition, as shown in Table 2. The silicon dioxide and aluminum oxide mainly constitute composition with 51.4% and 26.7%, respectively. Coarse aggerate and fine aggerate in dry conditions with specific gravities of 2.70 and 2.65 ton/m3 was used for the experiment.
To activate the geopolymerization of fly ash geopolymer concrete, an alkaline solution was mixed with the ratio of 0.7 to fly ash. An alkaline solution is a combination of a sodium hydroxide solution and a sodium silicate solution, and this one as prepared one day before the experiment.
Mixing ranges of 0%, 0.5%, 1% and 1.5% of hooked end steel fiber and polypropylene fiber were also embedded into the concrete mixture, according to the mass of concrete. The hooked end steel fiber H1, H2 had of 30 and 35 mm in length and 0.5 mm in diameter, along with the length to diameter L/d ratios of 60 and 70. Meanwhile, polypropylene fiber P1, P2 were used with the L/d ratios of 200 and 300, with a 0.05 mm in diameter, 10 and 15 mm in length, respectively. The elastic modulus of steel fiber and polypropylene were 205 and 3.5 GPa, and the tensile strength were 1100 and 700 MPa, respectively. The mechanical properties and notations of steel fiber and polypropylene fiber are described in Table 3 and Table 4. All specimens were made and cured at 80 °C for 10 h, as shown in Figure 3 to activate the geopolymerization process of the geopolymer concrete structure.

2.2. Compressive Test and Splitting Tensile Test

For one mix proportion, three cylindrical specimens with 200 mm in height and 100 mm in diameter, and strain gauges were used for a compressive test. Figure 4 and Figure 5 illustrate the specimen and the compressive test at a loading rate of 0.2 MPa per second. The compressive strength was calculated according to ASTM Standard C39M [20].
The splitting tensile strength of fiber-reinforced geopolymer concrete was measured by recording the maximum applied load, as shown in ASTM C496 [21], with three specimens for one mix proportion. Figure 6 describes the splitting tensile test in details.

2.3. Experiment of Poisson’s Ratio and Elastic Modulus

Figure 7 describes the experiment according to ASTM C469 [22] to obtain the Poisson’s ratio and elastic modulus. The experiment was carried out by a compression test capable of imposing a load of 0.2 MPa/sec. After that, the Poisson’s ratio and elastic modulus were obtained by measuring the stress, longitudinal strain, and transverse strain of 100 × 200 mm of specimens under loading.

2.4. Flexural Test

Based on ASTM C78 and ASTM C1609 [23,24], the flexural test was conducted by using specimens 100 × 100 × 400 mm in size with a span length of 300 mm as shown in Figure 8. In this test, the linear variable differential transformer LVDT was used to measure the mid-span deflection of geopolymer concrete beam. The flexural performance was evaluated by obtaining flexural strengths, load–deflection curves, and the toughness of fiber-reinforced geopolymer concrete.

3. Simulation Analysis

A finite element modeling of reinforced geopolymer concrete beam was constructed by ANSYS software [
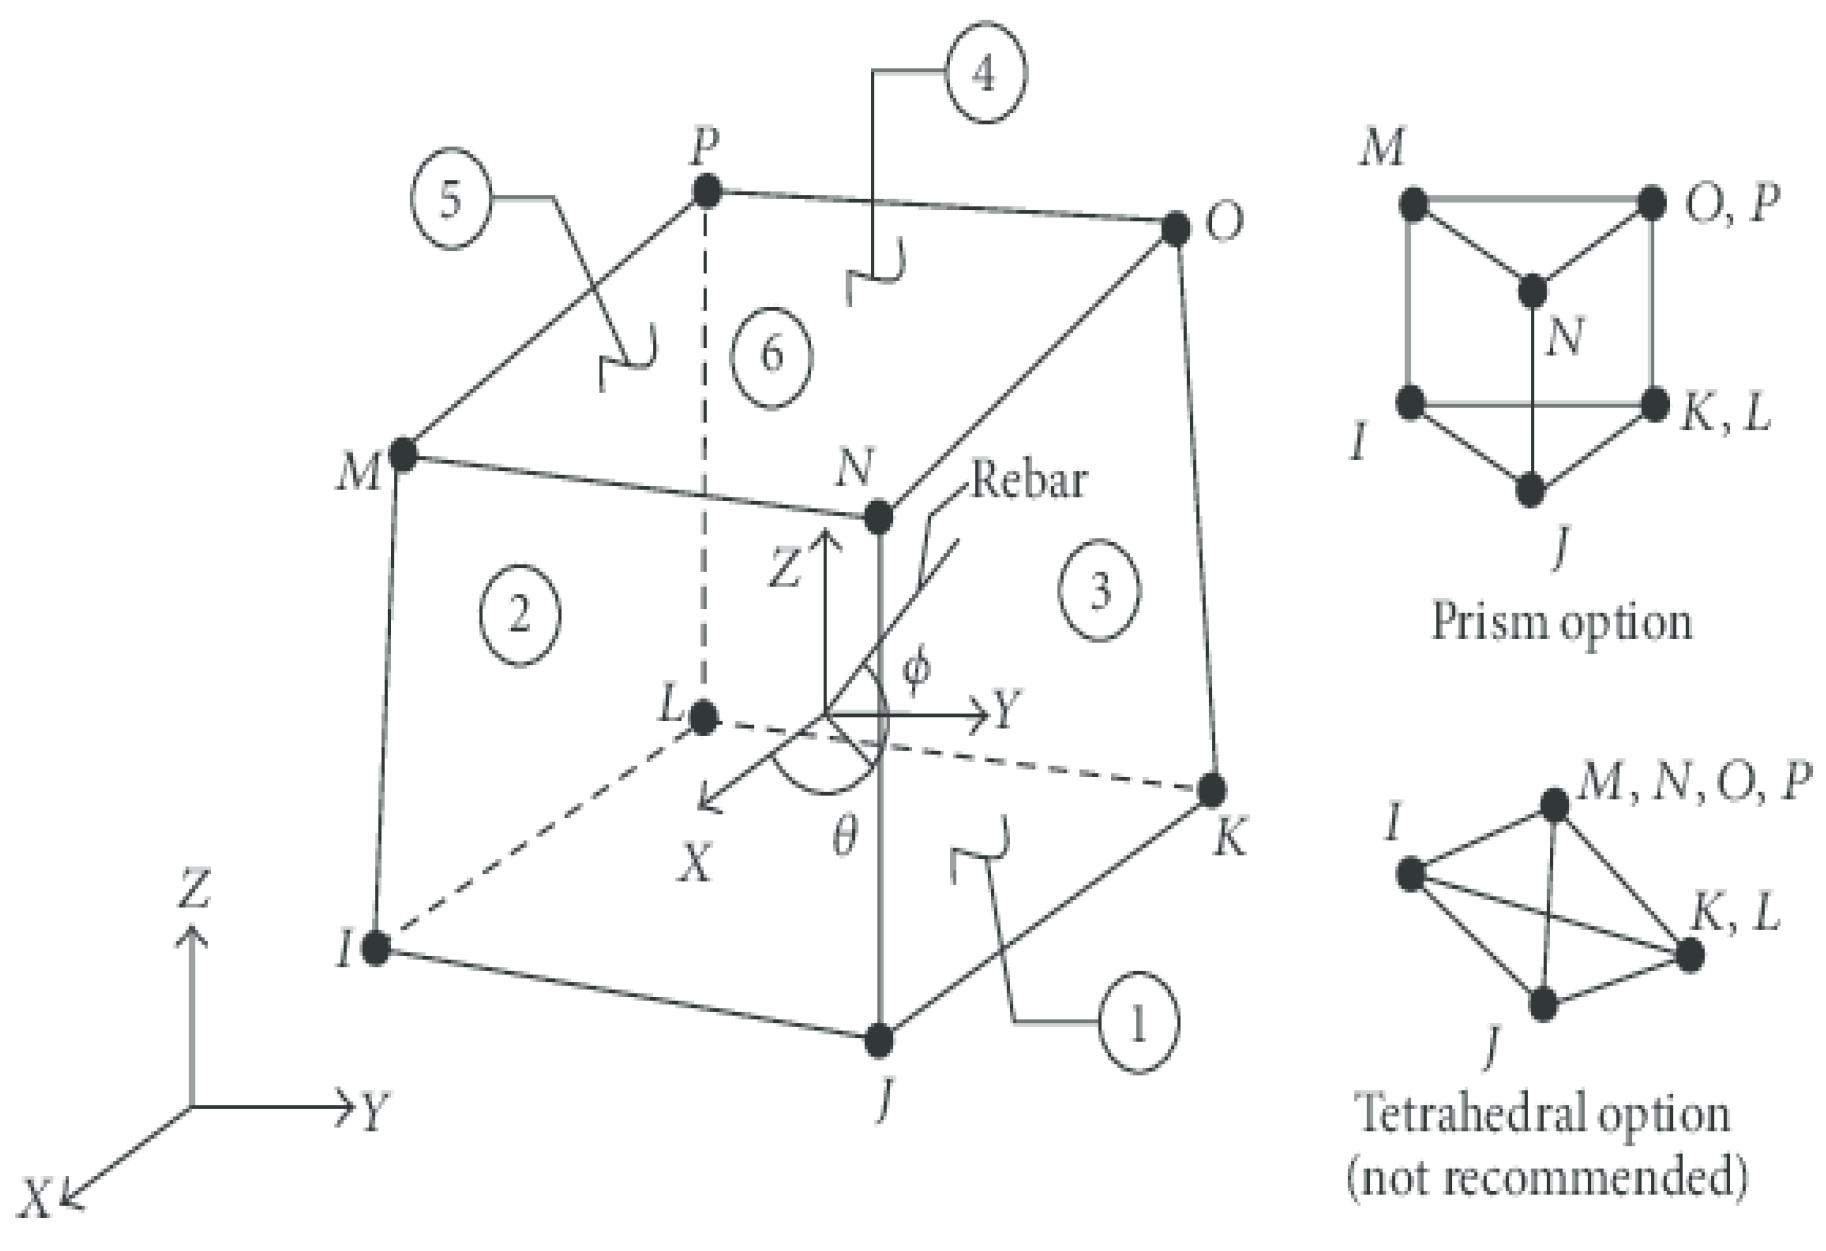
25] in order to analyze the flexural performance. The nonlinear elasticity model was adopted for the polypropylene fiber and steel fiber geopolymer concrete specimens. The response could be predicted numerically by using the eight-node element Solid 65, as shown in Figure 9. In this simulation analysis, the element with three freedom degrees was chosen for the structure beam and was suitable for considering cracking and flexural deformation.
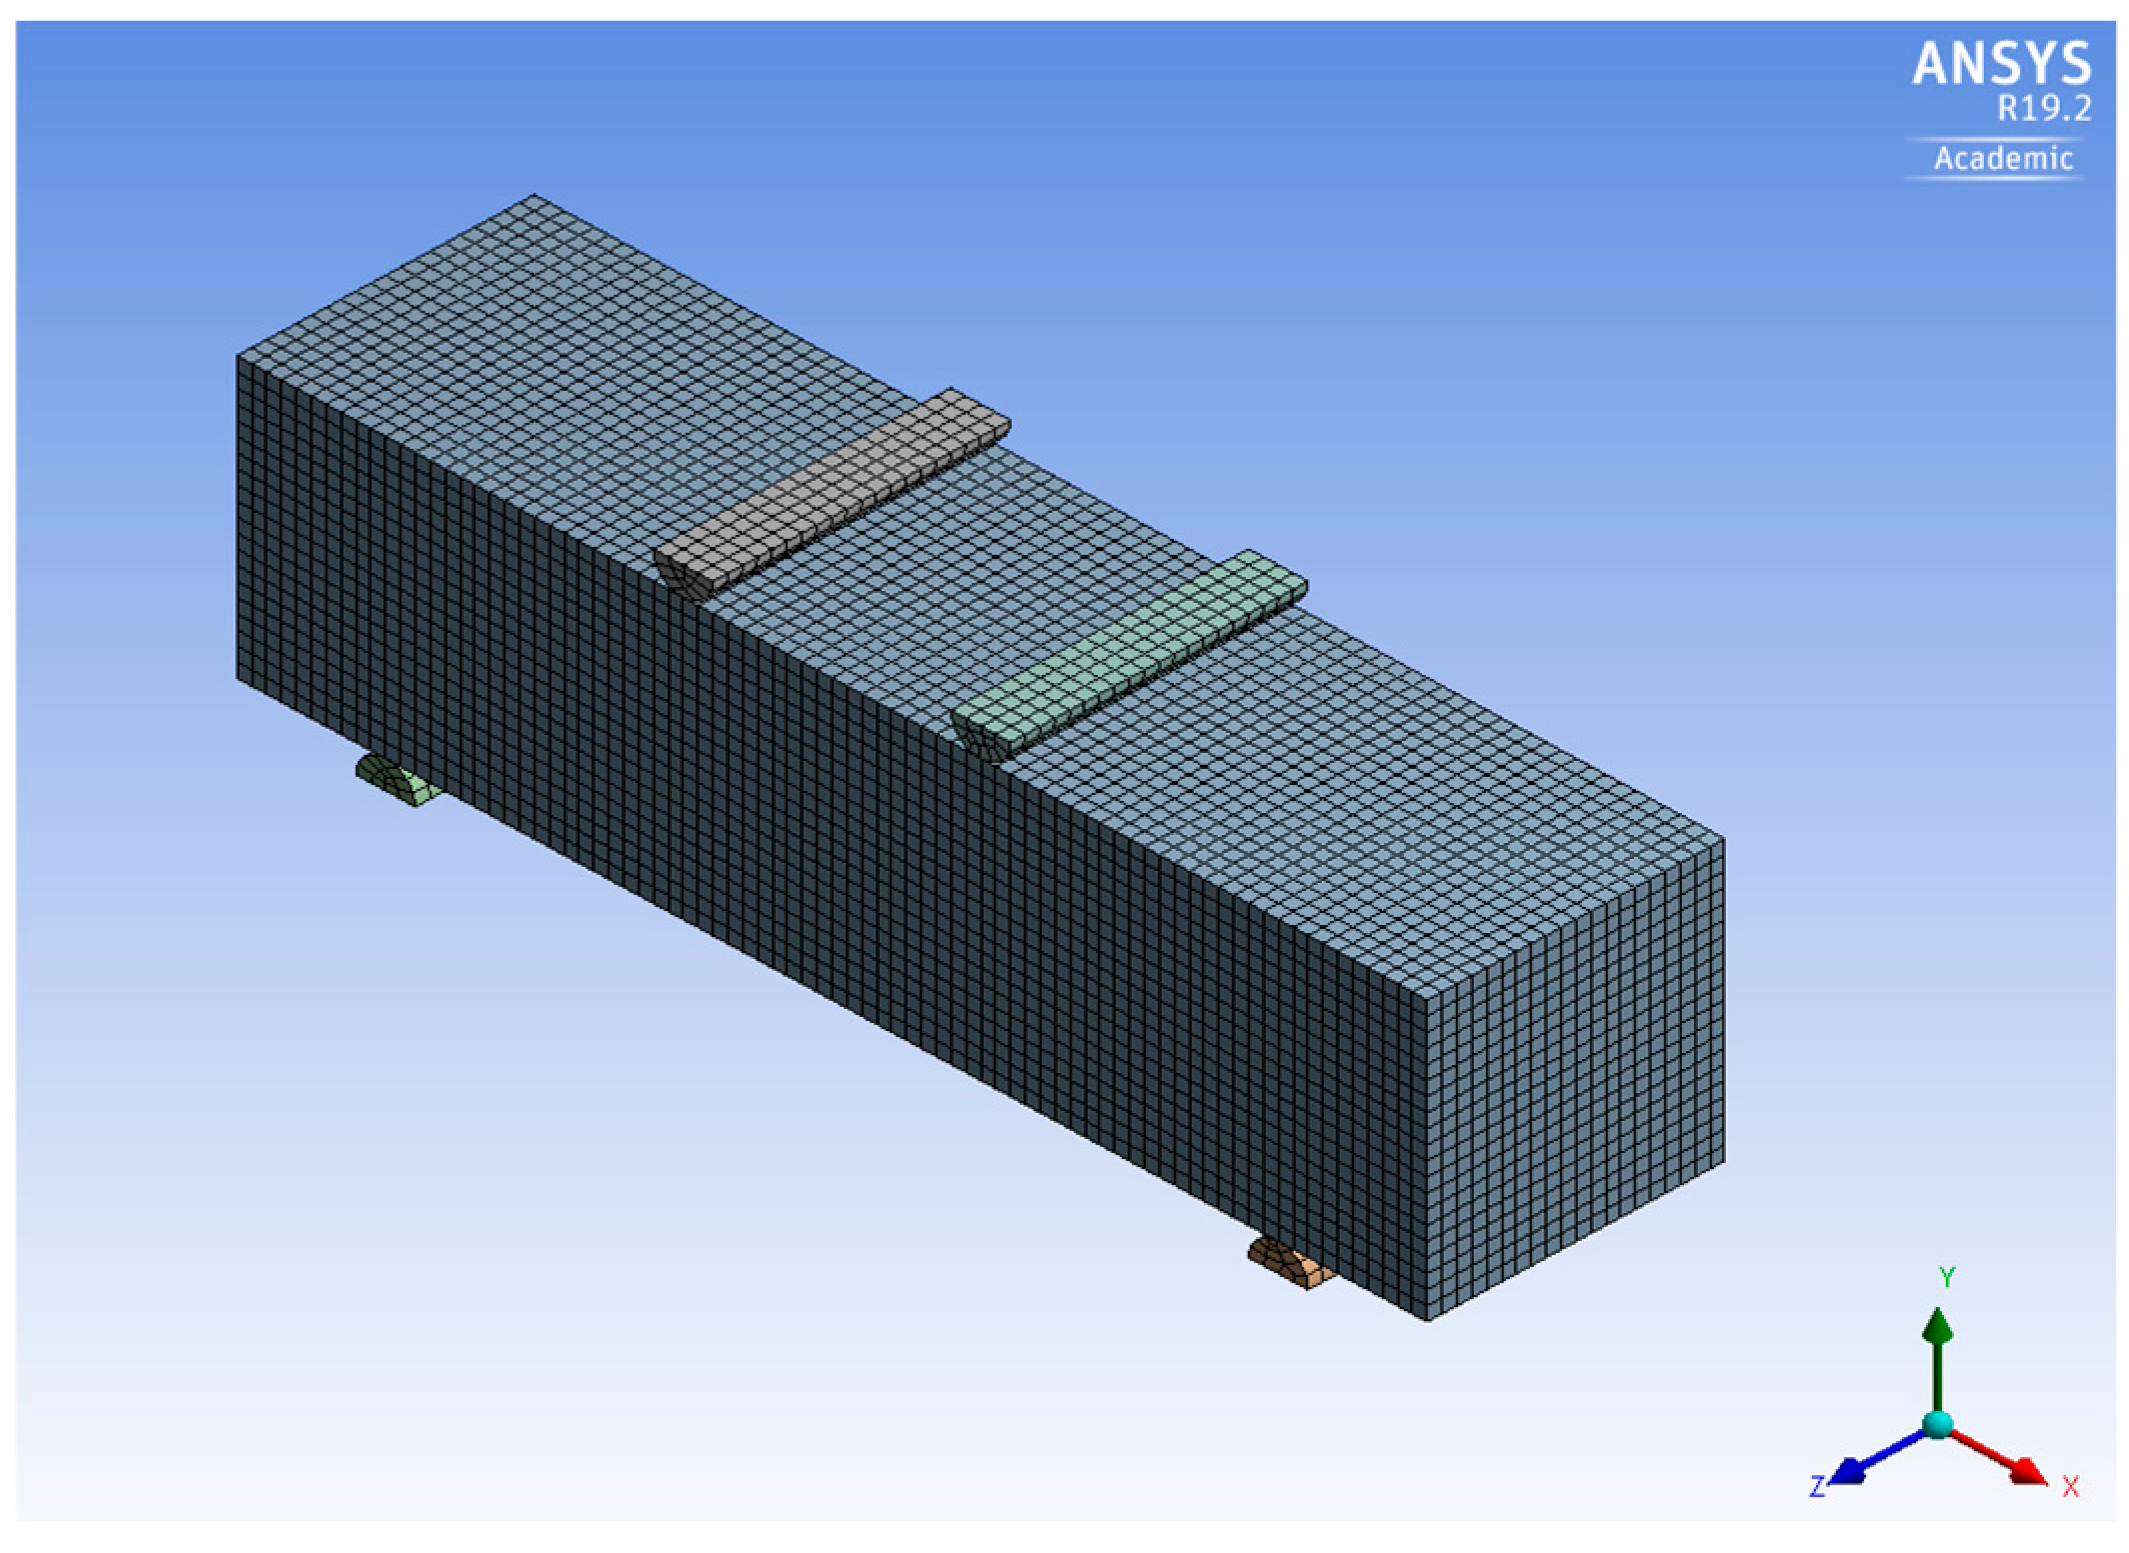
The supported beams with 400 mm effective length and a cross-section of 100 × 100 mm were taken for simulation analysis with the different volume fractions of each embedded fiber, as shown in Figure 10. The failure criterion of von Mises was used for the definition of the concrete failure, as was William’s model [
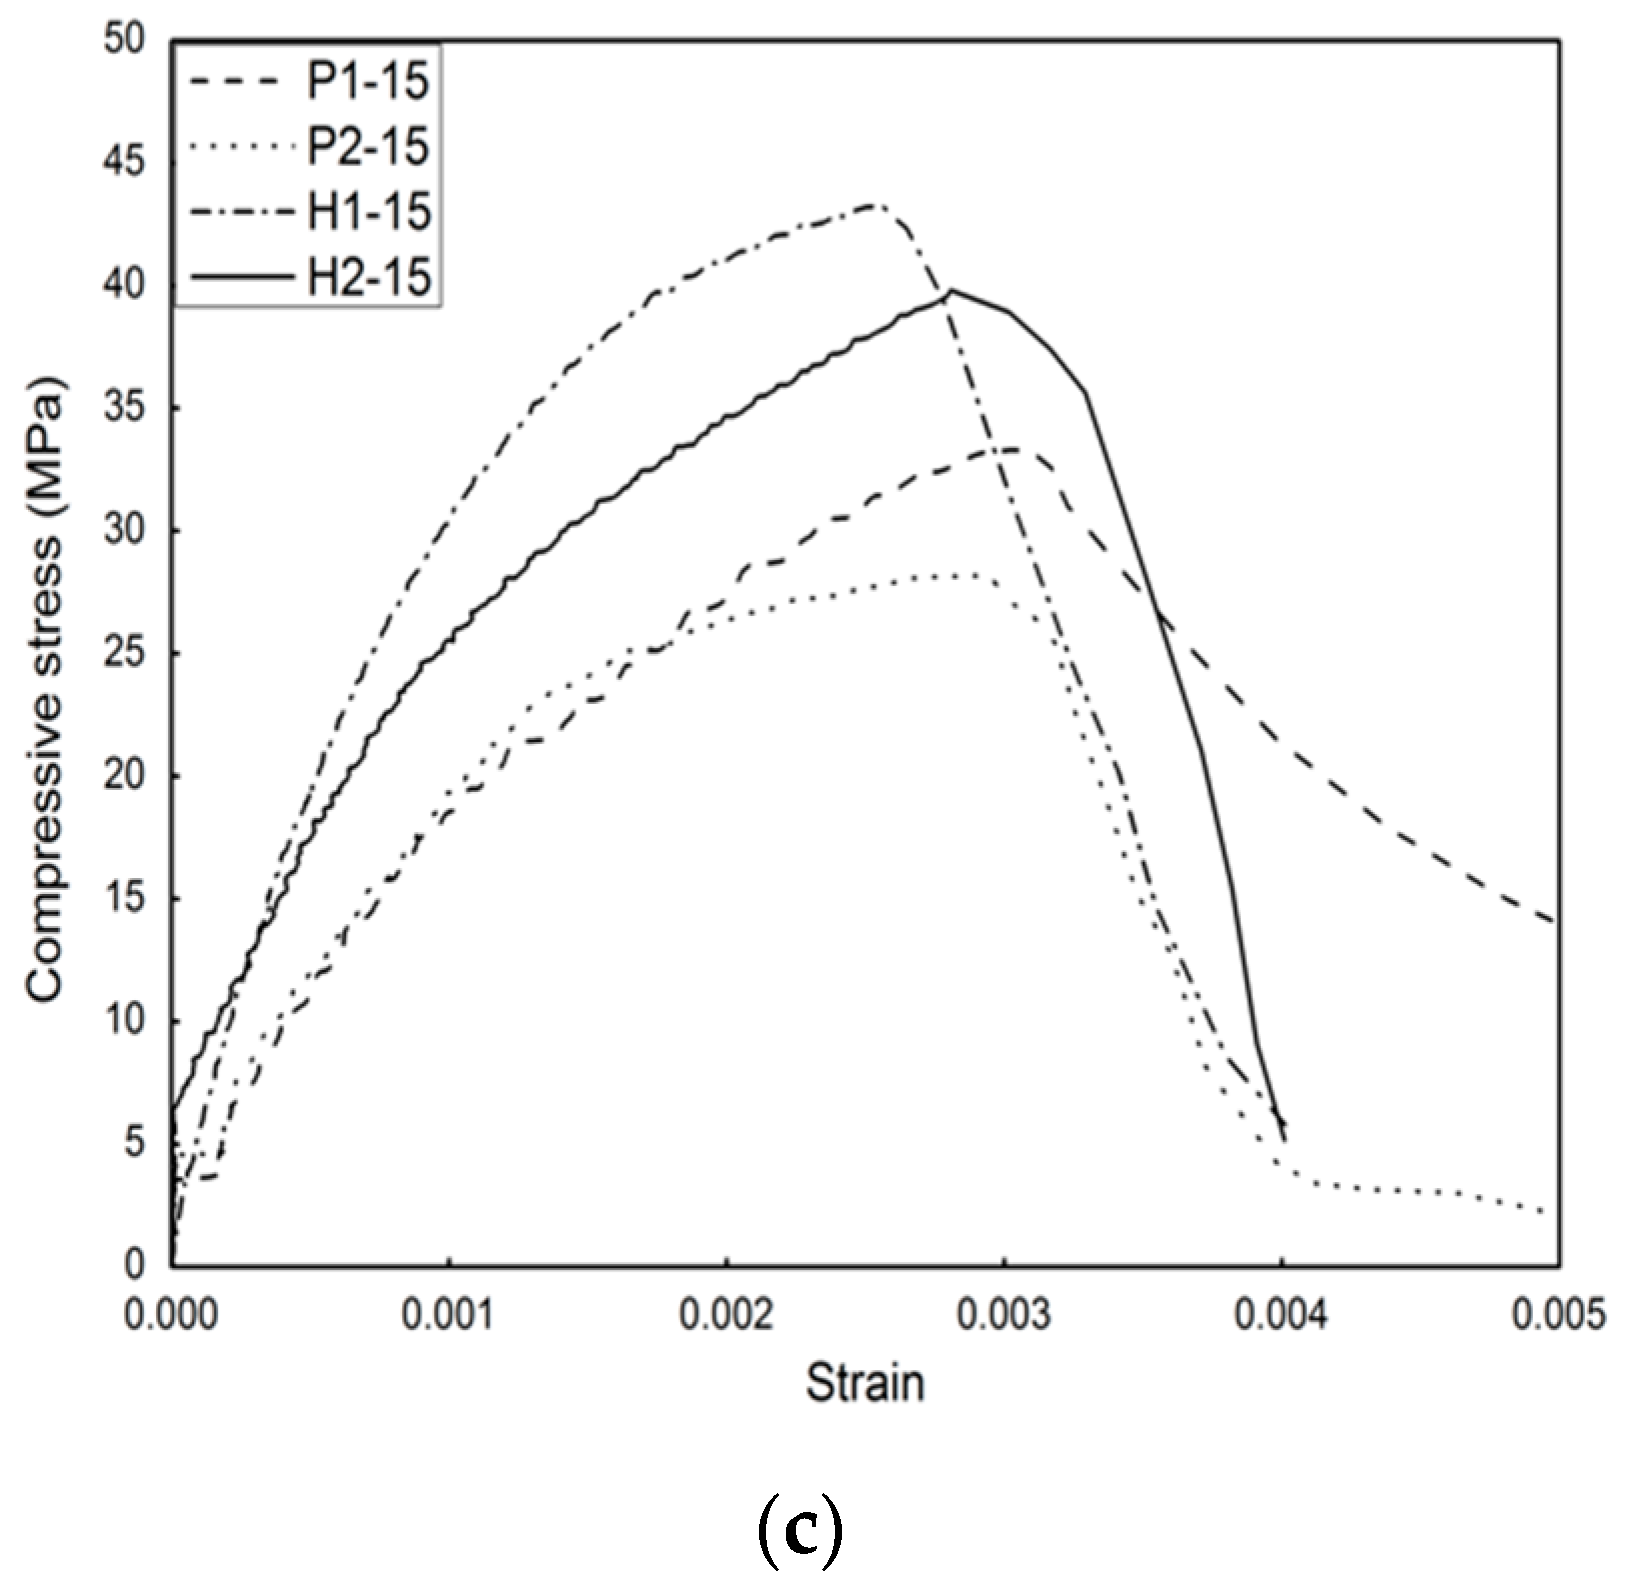
26]. The stress–strain relationship of specimens was determined from the experiment, as shown in Section 4.1.2, with the various dosages of fiber. Equation (1) shows how to measure the stress–strain relationship of the fiber-reinforced geopolymer concrete model with stress f at strain ε and ultimate compressive strength f’c at strain εo [27].
f = E c ε 1 + ( ε ε o ) 2 ε o = 2 f c E c E c = f ε
The material properties of the fiber geopolymer concrete model were defined by using experimental results, as shown in 
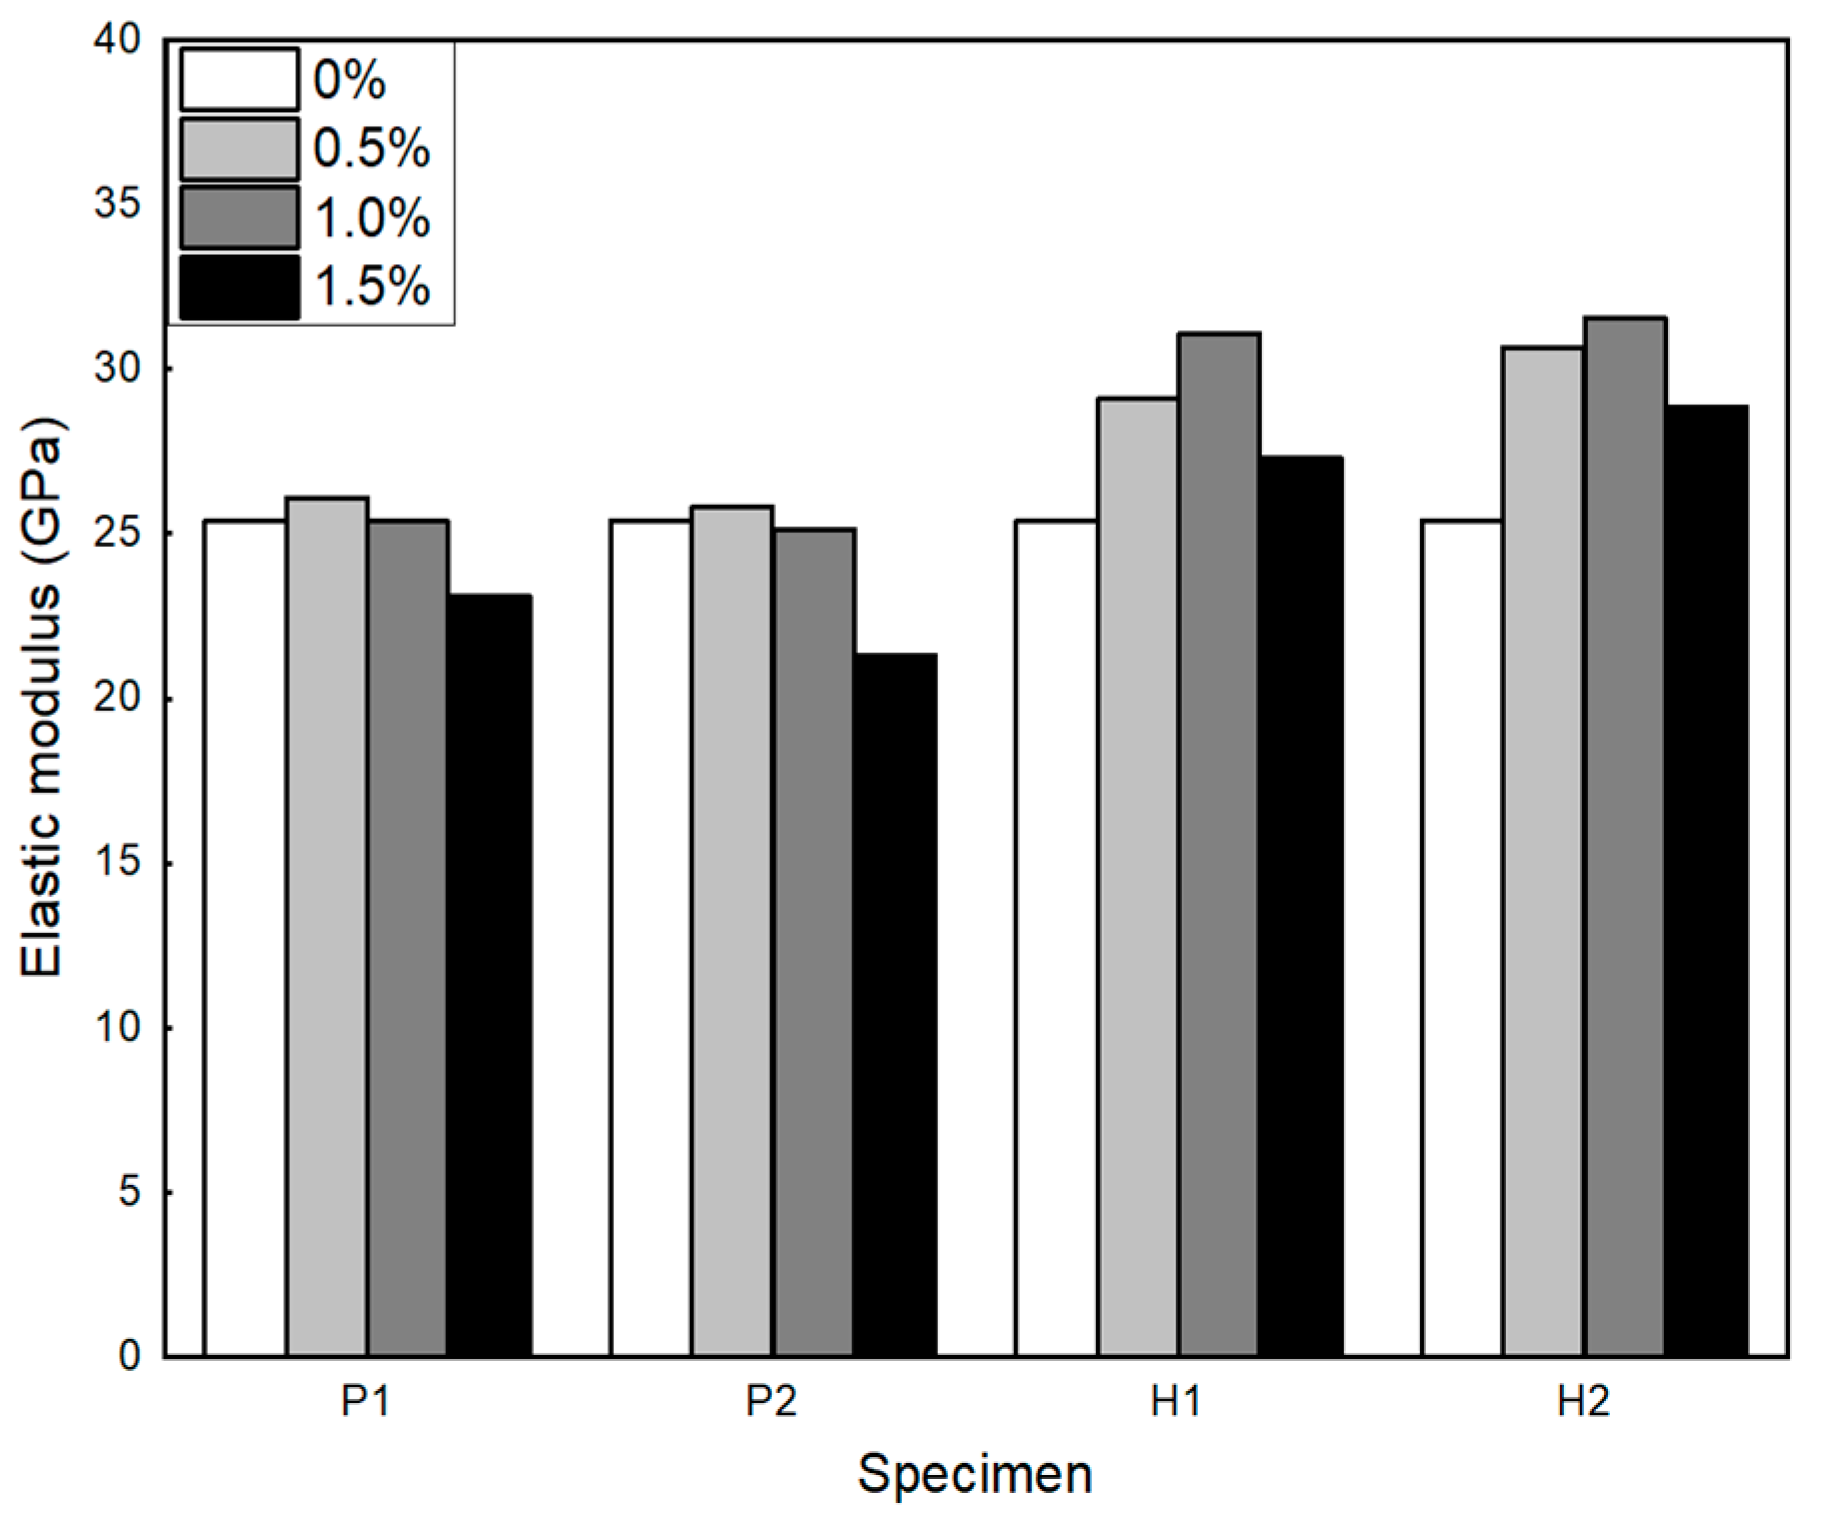
Section 4.1.2. These data were measured from flexural tests. The geopolymer concrete (GC) without fiber had an elastic modulus of 25.40 GPa and a Poisson’s ratio of 0.128, while the generated fiber had different properties depending on the volume fraction of fiber.
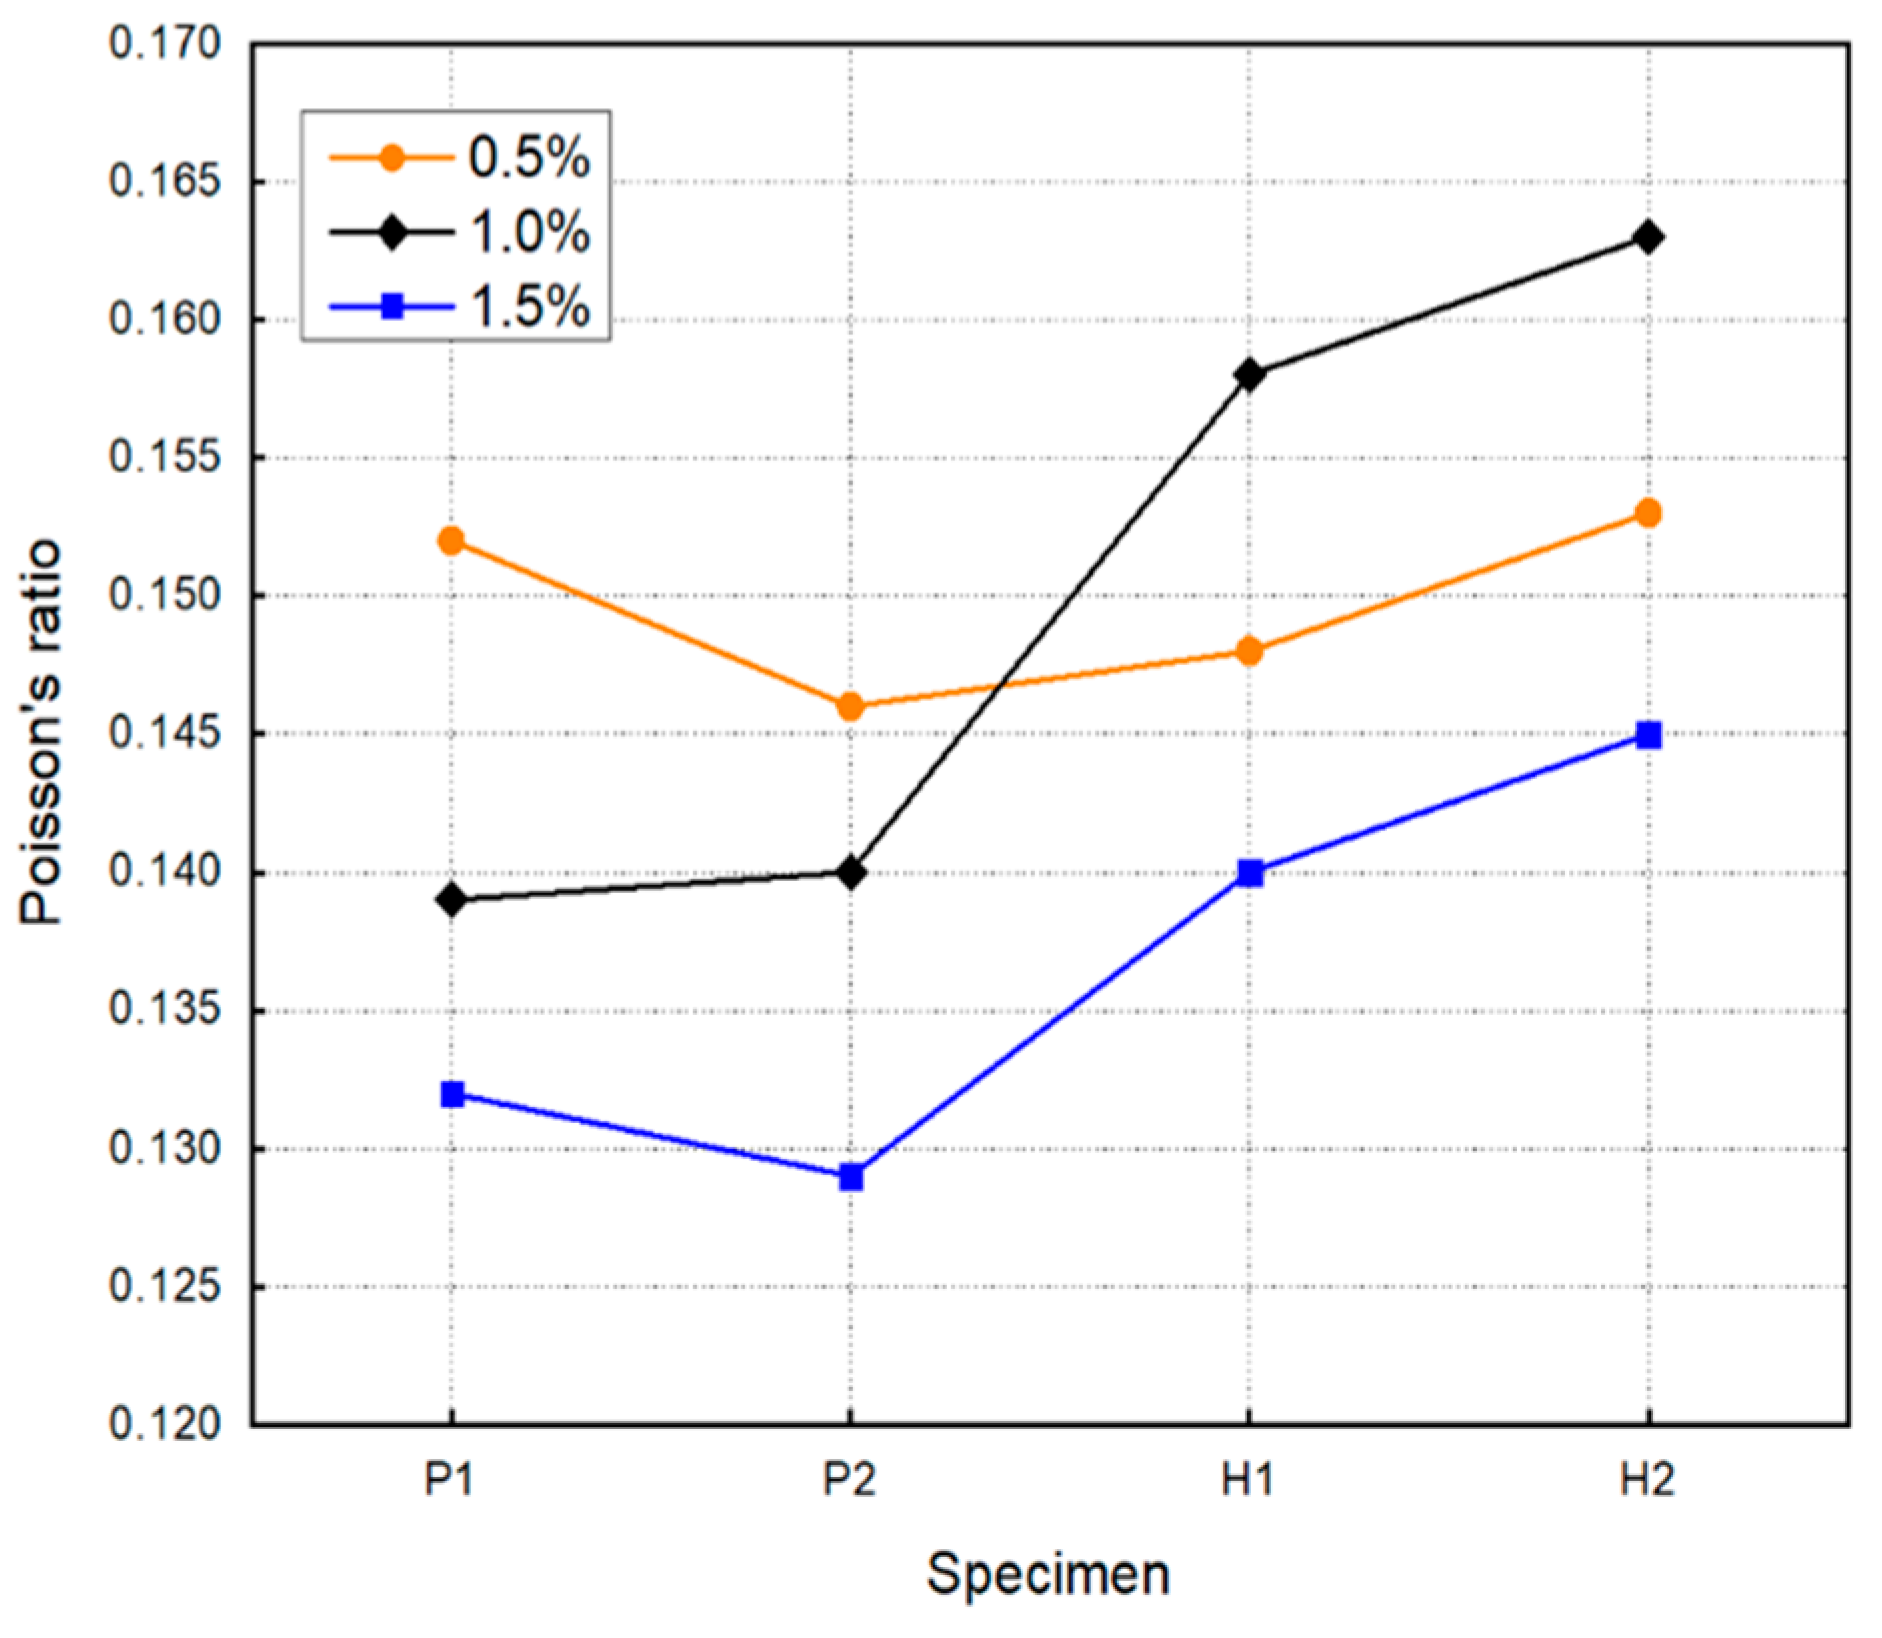
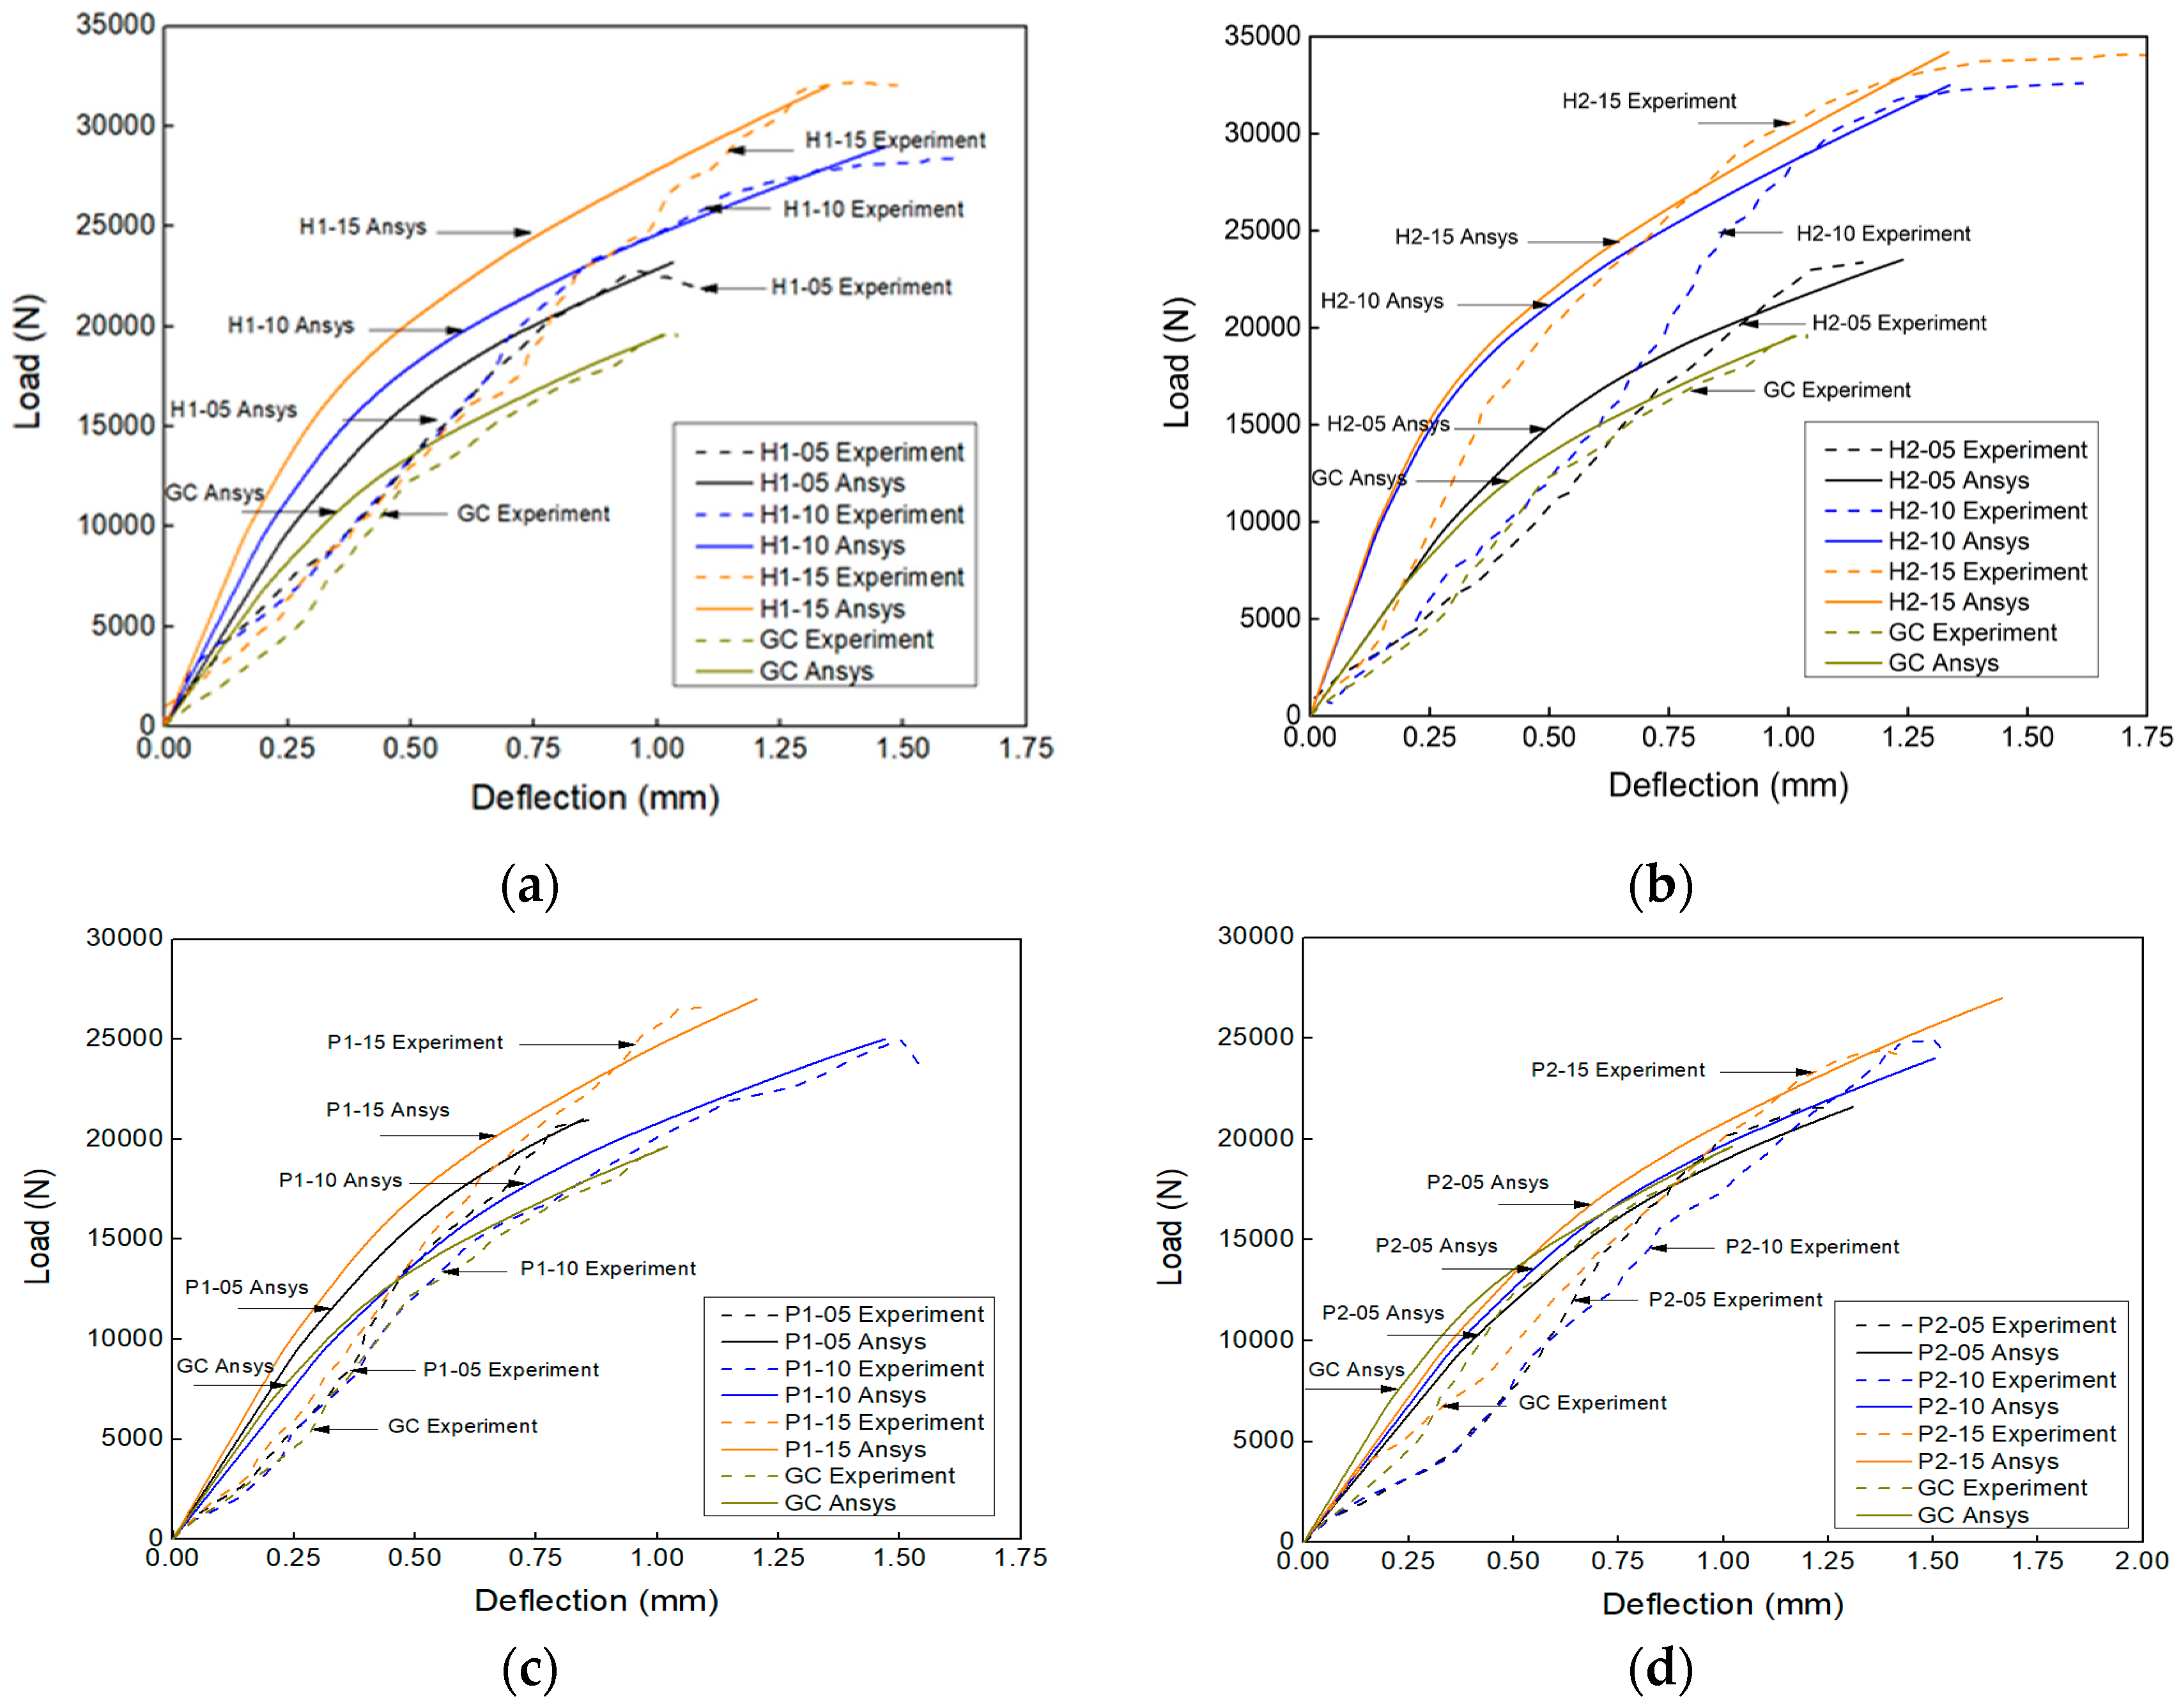
There were a total of nine specimens with volume fractions ranging from 0.5% to 1.5%—the same as the experimental test. The elastic modulus of specimens P1 and P2 reinforced with polypropylene fiber ranged from 21.32 to 26.10 GPa, and their Poisson’s ratios ranged from 0.129 to 0.152. Meanwhile, for specimens H1 and H2, generated with steel fiber, the higher elastic moduli were 27.29–31.56 GPa, and Poisson’s ratios of 0.140–0.163 were input.
The boundary conditions were simulated exactly the same as the experiment set up, as shown in 
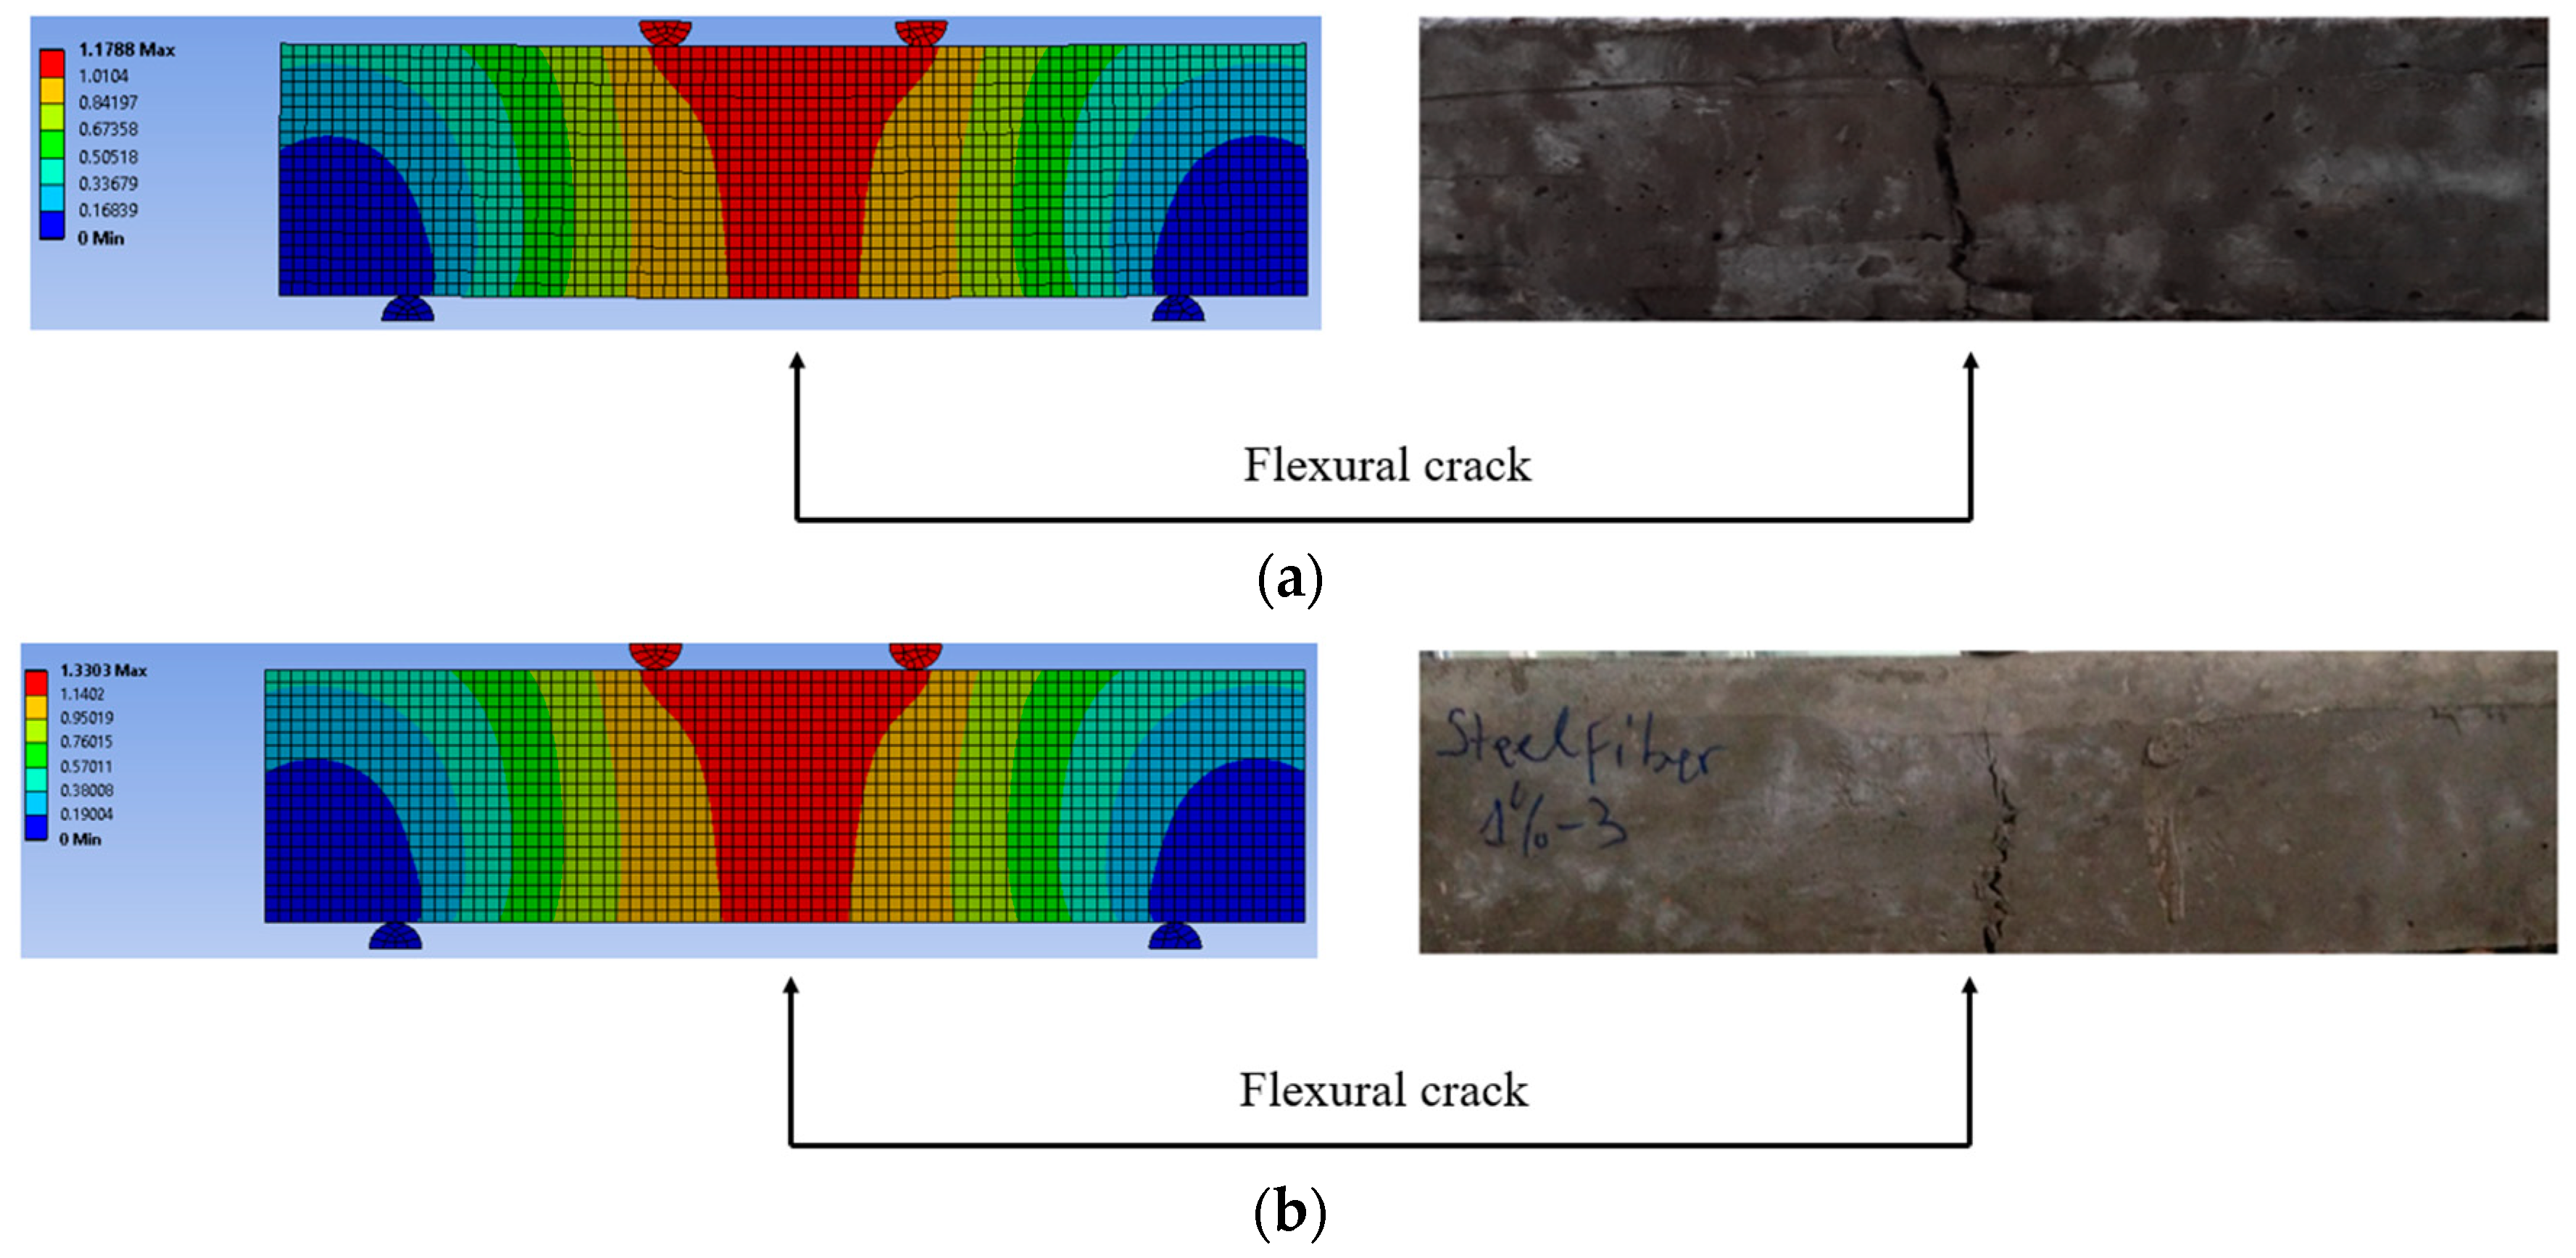
Figure 8. The meshing size was 5 mm with over 30,000 elements. In the middle span beams, the concentrated transverse load was applied to specimens and was divided into a load increments called load steps. The load-deflection relationship was obtained from the first crack load up to fully collapse. Additionally, the crack patterns of the geopolymer composites beams were also determined at the last converged load steps.

4. Results and Discussion

4.1. Compressive Performance of Fiber Reinforced Geopolymer Concrete

4.1.1. Compressive Strength

Table 5 and Figure 11 show the compressive strengths of geopolymer concrete reinforced with two types of fiber, including series P1, P2, H1, and H2. There were two results of compressive strength when the volume fractions of fiber were changed. In terms of polypropylene fiber-reinforced geopolymer concrete (PFRGC), the strength was improved at 0% and 0.5% of fiber and decreased at volume fractions of 1.0% and 1.5%. Besides, the strength of hooked end steel fiber-reinforced geopolymer concrete (HFRGC) increased from 0% to 1.0% of fiber and decreased at a volume fraction of 1.5%. The greatest values were 43.33 and 59.30 MPa for PFRGC and HFRGC, respectively, with a difference of 26.93%.
When embedding 0.5% of fiber to a geopolymer concrete mixture, the difference between specimens using polypropylene and steel fibers was small, and this difference varied significantly at higher volume fractions. These compressive strengths were 36.18–59.30 MPa and 32.45–49.44 MPa with differences of 34.36% and 38.99% at 1.0% and 1.5% of fiber, respectively. Steel fiber had better properties than those of polypropylene fiber, and the adhesion between steel fiber and the base material was also better than polypropylene because of the special shape and rough surface of steel fiber. As a consequence, the compressive strength of HFRGC was always higher than those of PFRGC, as indicated by the experimental results.

4.1.2. Stress–Strain Relationship

By conducting a compressive test and using strain gauges, geopolymer concrete embedded by fibers exhibited compressive performance, including compressive stress, strain at peak stress, Poisson’s ratio, and elastic modulus. All these values are shown in Table 6.
As shown in Figure 12, geopolymer concrete specimens using polypropylene fiber and hooked end steel fiber had a similar compressive performance. The stress–strain curves of series P1, P2, H1 and H2 had the same effect. However, hooked end steel fiber specimens had better results than polypropylene fiber specimens with a higher compressive stress and smaller strain. Among four series, the H2-10 series specimen had the highest compressive stress of 59.30 MPa, and the P2-15 series specimen had the smallest compressive stress of 27.13 MPa. Compared with the research of Hardjito [6], the non-fiber geopolymer concrete had strain ranging from 0.0024 to 0.0026. From Figure 12, it can be seen the strains at peak stress of all specimens ranged from 0.0022 to 0.0030. However, most values were within the range from 0.0024–0.0026.

4.1.3. Elastic Modulus and Poisson’s Ratio

The behavior of a structure as well as its elastic deformation could be affected by many factors, and elastic modulus is one of the most important factors. This value of polypropylene fiber and hooked end steel fiber-reinforced geopolymer concrete is illustrated in Figure 13. In terms of specimens using the same 0.5% volume fraction of polypropylene fiber, the values of elastic modulus were the highest and most similar—about 25–26 GPa. These values were the maximum elastic modulus, and they decreased as the volume fraction increased at 1.0% and 1.5%.
Figure 13 also describes the compressive performance with hooked end steel fiber-reinforced geopolymer concrete through elastic modulus E. This modulus had the greatest value at specimens using 1.0% and the smallest value at specimens using 1.5%. The greatest modulus obtained at specimens using 1.5% fiber was 31.56 GPa. By comparing two series specimens, it can be seen that the higher elastic modulus was always measured at specimens reinforced with hooked end steel fiber.
For ordinary concrete, Australia standard (AS) 3600 [28] proposed Equation (2) to calculate the elastic modulus based on compressive strength, where Ec is the elastic modulus, fcm is the mean compressive strength, and ρ is the unit-weight of geopolymer concrete at about 2.35 ton/m3.
E c = ρ 1.5 × ( 0.024 f c m + 0.12 )   ( MPa )
For geopolymer concrete without fiber, Hardjito [6] also presented the following equation to determine the elastic modulus:
E C = 2707 f c m + 5300   ( MPa )
Table 7 and Figure 14 present a comparison of the elastic modulus between measured values from this study, and those of ordinary concrete and geopolymer concrete were calculated from Equations (2) and (3). The elastic modulus of fiber-reinforced geopolymer concrete obtained from this study iwa smaller than those of ordinary concrete. The difference was about 4.3%–23.6%. However, compared with non-fiber geopolymer concrete calculated by Equation (3), the measured modulus was greater than 9%–23.4%.
Another parameter obtained from compression test was the Poisson’s ratio, which wa also shown in Table 6. Figure 15 describes the value of the Poisson’s ratio with four types of polypropylene fibers and hooked end steel fiber and three dosages of fiber. With series P1 and P2 cast with polypropylene fiber, the Poisson’s ratio had a range of 0.129–0.152. Additionally, specimens generated with hooked end steel fiber had higher values from 0.140 to 0.163. Compared with previous studies [6] about non-fiber geopolymer concrete, this ratio also rangee from 0.120 to 0.160.

4.2. Splitting Tensile Strength

Table 8 and Figure 16 show the influence of fibers on the splitting tensile strength of geopolymer concrete. In the PFRGC, alike compressive strengths, there are two effects of splitting tensile strength. From 0% to 0.5% of the volume fraction of fiber, the splitting tensile strength increased gradually from 0.5% to 1.5%, this strength has a tendency of decrement. At the volume fraction 0.5%, PFRGC specimens had the highest splitting tensile strength than GC specimens without fiber. Compared to the splitting tensile strength (3.70 MPa) of GC specimens, the strength of specimens using polypropylene fiber P1-05 and P2-05 increased to 11.9% and 10%, along with 4.20 MPa and 4.11 MPa respectively.
In terms of specimens using steel fiber HFRGC, the splitting tensile strength increase with the increment of volume fraction except at 1.5%. At 0.5% and 1% of volume fraction, compared to the GC specimens without fiber, the strength increases strongly from 11.48% to 28.16%, correspondingly to 4.18 MPa to 5.15 MPa. The highest values were achieved by adding 1.0% hooked end steel fiber to the mixture, with a value of 5.15 MPa of the H2-10 specimen series.
The highest splitting tensile strength of PFRGC and HFRGC were 5.15 MPa and 4.20 MPa with disparity was 18.45%. The difference between the strength of PFRGC and HFRGC was small when adding 0.5% fiber into the geopolymer concrete mixture. However, at volume fractions 1% and 1.5%, the strength of specimens using hooked end steel fiber was much higher than specimens using polypropylene fiber.
Australia Standard AS 3600 [29] revealed Equation (4) for evaluating the compressive strength and splitting tensile strength relationship of ordinary Portland cement concrete, where fct is splitting tensile strength and fcm is compressive strength:
f c t = 0.4 f c m   ( MPa )
For geopolymer concrete, Hardjito recommended Equation (5) to determine the splitting tensile strength:
f c t = 0.7 f c m   ( MPa )
Figure 17 shows compressive strength and splitting tensile strength relationship by using Equations (4) and (5). For fly ash fiber-reinforced geopolymer concrete, the splitting tensile strength had a greater value than those of ordinary concrete. Compared with non-fiber geopolymer concrete, this value was also small—approximately under 10%. Therefore, compressive strength and splitting tensile strength could be evaluated by Equation (5).

4.3. Flexural Performance of Fiber-Reinforced Geopolymer Concrete

4.3.1. Flexural Strength

The flexural test of fiber-reinforced geopolymer composites was carried out with 100 × 100 × 400 mm of specimens and a span length of 300 mm. The flexural strength of both specimens using polypropylene fiber and steel fiber are improved significantly, as shown in Table 9 and Figure 18.
When the volume fraction of fiber increased from 0.5% to 1.5%, the flexural behavior of PFRGC specimens were increased from 6.06% to 26.19%. At 0.5%, the flexural strengths of P1 and P2 specimens were 6.45 MPa and 6.30 MPa, compared with the 5.89 MPa of non-fiber specimen GC. At 1.0% and 1.5%, the improvement of flexural strength was higher, from 10.08% to 26.19%, and the greatest value was measured at series P2-15 with 7.98 MPa.
In terms of HFRGC using steel fiber, the flexural strength is also enhanced strongly from 13.64% to 42.37%. With dosage of fiber at 0.5%, flexural strengths were 6.82 MPa and 7.02 MPa, according to 13.64% and 16.10% of the difference. The flexural strength continued to increase with 1.0% and came to highest value at 1.5%. The specimen H2-15 using 0.15% steel fiber in concrete mixture had the highest strength of 10.22 MPa with a large difference of 42.37%.
Four series specimens P1, P2, H1 and H2 showed the best flexural performance when embedding 1.5% of fiber to the geopolymer concrete mixture. There were 7.98, 7.32, 9.65 and 10.22 MPa for P1, P2, H1, H2, respectively. Between the highest strength of PFRGC and HFRGC, the difference was 21.9% between 7.98 MPa and 10.22 MPa. The properties as well as the workability of fiber in concrete mixture were the main reason for this difference. Based on the properties of steel fiber, including tensile strength, elastic modulus, the specimens reinforced with steel fiber performed the higher behavior than those of specimens using polypropylene fiber. HFRGC exhibited a good influence on geopolymer composites, compared with PFRGC. Besides, hooked end steel fiber had a special shape at two ends, and its rough surface led to the increment of adhesion between steel fiber and base material (as shown in SEM photo analysis) and the improvement of significant flexural strength.

4.3.2. Load–Deflection Relationship

Based on the results obtained from experiments, flexural performance, including flexural strength, load carrying capacity, deflection at peak load and toughness are shown in Table 10. Figure 19a–c describes the load–deflection curve of the specimens using fiber with three volume fractions in a flexural test. All specimens perform the similar load–deflection relationship with the deflection at peak load, between the net 1/300 and 1/600 of span length, are 1–2 mm and the peak load from 21 to 34 kN.
The series of P1-15, P2-15, H1-15 and H2-15 in Figure 19c had the highest behavior of the flexural test, which means that the loading capacity of these series were the best. The flexural performance of hooked end steel FRGC was better than polypropylene FRGC, with the highest load carrying capacity 34,070.4 N, compared with 26,611.2 N; the difference was 21.89%. The L/d ratio of the fibers also influenced the flexural behavior, with 70 outperforming 60 to hooked end steel fiber and 300 outperforming 200 to polypropylene fiber. Because hooked end steel fiber had better properties than polypropylene fiber, such as elastic modulus, tensile strength and surface properties. Moreover, hooked end steel fiber had a special shape, different from the smooth shape of polypropylene fiber. Thus, this shape leads to the increment of the adhesion between steel fiber and materials and the improvement of strength under the impact of the load.

4.3.3. Energy Absorption Capacity (Toughness)

The fibers used in the structure of concrete enhanced the mechanical properties of concrete like the control of crack initiation under loading and the fracture toughness of concrete. Toughness showed the capacity of fiber in flexural test by energy absorption, control crack initiation and propagation. Toughness was obtained by calculating the total area under the load–deflection curves as described in ASTM C1609 23]. The effect of two fiber types with three volume fractions on toughness is illustrated in Figure 20.
With all specimens generated with fiber, the toughness increases with the increase in the volume fraction. For the specimens using polypropylene fiber, the value of toughness was from 7.174 to 13.461 N.m. The variation of toughness depended on the type of polypropylene fiber and volume fractions. With series P2 and 1.5% fiber, the toughness had the maximum value of 13.461 N.m. Similar to P series, the H series geopolymer concrete generated with steel fiber also had the same effect. The highest toughness of HFRGC was 24.191 N.m when added with 1.5% of fiber into the concrete mixture. Generally, HFRGC had always more flexural behavior than PFRGC, with a great difference of toughness, about 44.36%, in accordance with 24.191 and 13.461 N.m.

4.4. Microstructural Photos of Geopolymer Matrix with Fibers

Figure 21 shows SEM photos which describe the microstructures of geopolymer matrixes with fibers. Inside the geopolymer structure, there was adhesion between polypropylene fiber in Figure 21a and hooked end steel fiber in Figure 21b with geopolymer paste.
Therefore, higher strengths were achieved when using fibers to improve mechanical properties of geopolymer concrete. As obvious when comparing two figures, the adhesion between of hooked end steel fiber and base materials was much more than those of polypropylene fiber—the paste around steel fiber was denser and better. Thus, the geopolymer concrete reinforced with hooked end steel fiber always had greater mechanical properties than specimens using polypropylene fiber.

4.5. Comparison of Experimental Results and Simulation Results

The experimental results and simulation analysis of fiber-reinforced geopolymer concrete are illustrated in Figure 22 and Figure 23 with the load-deflection response and crack patterns. Figure 22a–d shows the load-deflection curves of specimens H1, H2, P1 and P2, respectively, with the various volume fractions of fiber, compared with non-fiber geopolymer concrete GC.
Overall, there was a slight difference between the experimental and analysis results. The load of specimen H1 in Figure 22a reached 23,200–32,000 N in modeling and 22,769–32,188 N in the flexural test. Additionally, the peak deflection was similar in experiment and modeling, with 0.95–1.61 and 1.03–1.47, respectively, and the difference of 0.5%–8% was small and acceptable. Compared with the geopolymer concrete without fiber GC, Figure 22a shows strength improvement. The other specimens H2, P1 and P2 also had the same effect of load-deflection behavior. The difference between testing and analysis was also reasonable.
In modeling, the performance of geopolymer composites enhanced with fibers was evaluated and determined through crack patterns at the last converged load steps. Figure 23a,b shows the finite element modeling with the crack patterns of specimens using polypropylene and steel fiber and compared with the failure figures of the test. By comparing the crack appearance in flexural test and simulation analysis, it can be seen that the crack initiation and propagation occurred at the midspan of beam and showed the same shape.

5. Conclusions

The experimental results showed a clearer and deeper understanding of the mechanical performance of geopolymer composites made from fly ash and generated with steel and polypropylene fibers. The mechanical properties including compressive performance, flexural performance, tensile strength, elastic modulus, Poisson’s ratio, and energy absorption capacity were the important parameters which effect structural performance. Understanding the influence of fiber is useful for applying geopolymer composites in modern construction and design. The following conclusions can be obtained by obtaining experimental results and simulation analyses:
  • There was significant improvement of strength of geopolymer concrete, especially flexural performance. The compressive strength and splitting tensile strength were also enhanced with polypropylene and hooked end steel fibers. The suitable volume fraction of fiber was 0.5% to polypropylene fiber and 1.0% to hooked end steel fiber.
  • Geopolymer concrete reinforced with fibers exhibited a compressive performance similarly to non-fiber geopolymer concrete. The compressive stress of geopolymer concrete reinforced with fibers was greater than those of specimens without fiber with the same strain, Poisson’s ratio, and elastic modulus.
  • The flexural performance of specimens fabricated with fibers exhibited a higher loading capacity, higher energy absorption capacity, and lower deflection, compared to geopolymer concrete without fiber.
  • Specimens embedded with hooked end steel fiber exhibited a better response than those of specimens using polypropylene fiber. There was a significant difference between compressive performance, splitting tensile strength, flexural performance between two series specimens.
  • The experimental result and analysis using Ansys software showed a good agreement in the behavior of geopolymer concrete with a slight and acceptable difference. By comparing crack appearance in flexural tests and simulation analyses, it can be seen the crack initiation and propagation occurred at the midspan of the beam and showed the same behavior.

Author Contributions

All authors contributed to this work. K.V.A.P. and T.K.N. designed the experiment, K.V.A.P., G.L. and T.A.L. performed the experiments, analysis, K.V.A.P. and T.K.N. wrote the paper, and S.W.H. and K.L. revised and finalized the paper.

Funding

This research was funded by Ministry of the Interior and Safety as Earthquake Disaster Prevention Human Resource Development Project.

Acknowledgments

This study was funded by Ministry of the Interior and Safety as Earthquake Disaster Prevention Human Resource Development Project. The authors would like to express sincere gratitude for their support.

Conflicts of Interest

The authors declare no conflict of interest.

References

  1. Davidovits, J. Global warming impact on the cement and aggregates industries. World Resour. Rev. 1994, 6, 263–278. [Google Scholar]
  2. Davidovits, J. Geopolymer Chemistry & Applications, 4th ed.; Institut Geopolymere: Saint-Quentin, France, 2015. [Google Scholar]
  3. Wallah, S.E.; Rangan, B.V. Low-Calcium Fly Ash-Based Geopolymer Concrete: Long-Term Properties; Rearch Report GC2; Faculty of Engineering, Curtin University of Technology: Perth, Australia, 2006. [Google Scholar]
  4. Strydom, C.A.; Swanepoel, J.C. Utilisation of fly ash in a geopolymeric material. Appl. Geochem. 2002, 17, 1143–1148. [Google Scholar]
  5. Nguyen, K.T.; Ahn, N.; Le, T.A.; Lee, K. Theoretical and experimental study on mechanical properties and flexural strength of fly ash-geopolymer concrete. Constr. Build. Mater. 2016, 106, 65–77. [Google Scholar] [CrossRef]
  6. Hardjito, D.; Rangan, B.V. Development and Properties of Low-Calcium Fly Ash-Based Geopolymer Concrete; Rearch Report GC1; Faculty of Engineering, Curtin University of Technology: Perth, Australia, 2005. [Google Scholar]
  7. Nguyen, K.T.; Le, T.A.; Lee, K. Investigation on properties of geopolymer mortar using preheated materials and thermogenetic admixtures. Constr. Build. Mater. 2017, 130, 146–155. [Google Scholar] [CrossRef]
  8. Nguyen, K.T.; Le, T.A.; Lee, K. Evaluation of the mechanical properties of sea sand-based geopolymer concrete and the corrosion of embedded steel bar. Constr. Build. Mater. 2018, 169, 462–472. [Google Scholar] [CrossRef]
  9. Vijai, K.; Kumutha, R.; Vishnuram, B.G. Properties of glass fibre reinforced geopolymer concrete composites. Asian J. Civ. Eng. 2012, 13, 511–520. [Google Scholar]
  10. Alomayri, T.; Low, I.M. Synthesis and characterization of mechanical properties in cotton fiber-reinforced geopolymer composites. J. Asian Ceram. Soc. 2013, 1, 30–34. [Google Scholar] [CrossRef] [Green Version]
  11. Bernal, S.; De Gutierrez, R.; Delvasto, S.; Rodriguez, E. Performance of an alkali-activated slag concrete reinforced with steel fibers. Constr. Build. Mater. 2010, 24, 208–214. [Google Scholar] [CrossRef]
  12. Nazari, A.; Maghsoudpour, A.; Sanjayan, J.G. Flexural strength of plain and fibre-reinforced boroaluminosilicate geopolymer. Constr. Build. Mater. 2015, 76, 207–213. [Google Scholar] [CrossRef]
  13. Al-mashhadani, M.M.; Canpolat, O.; Aygörmez, Y.; Uysal, M.; Erdem, S. Mechanical and microstructural characterization of fiber reinforced fly ash based geopolymer composites. Constr. Build. Mater. 2018, 167, 505–513. [Google Scholar] [CrossRef]
  14. Puertas, F.; Amat, T.; Fernández-Jiménez, A.; Vázquez, T. Mechanical and durable behaviour of alkaline cement mortars reinforced with polypropylene fibres. Cem. Concr. Compos. 2003, 33, 2031–2036. [Google Scholar] [CrossRef]
  15. Lin, T.; Jia, D.; He, P.; Wang, M. In situ crack growth observation and fracture behavior of short carbon fiber reinforced geopolymer matrix composites. Mater. Sci. Eng. A 2010, 527, 2404–2407. [Google Scholar] [CrossRef]
  16. He, P.; Jia, D.; Lin, T.; Wang, M.; Zhou, Y. Effects of high-temperature heat treatment on the mechanical properties of unidirectional carbon fiber reinforced geopolymer composites. Ceram. Int. 2010, 36, 1447–1453. [Google Scholar] [CrossRef]
  17. Natali, A.; Manzi, S.; Bignozzi, M.C. Novel fiber-reinforced composite materials based on sustainable geopolymer matrix. Procedia Eng. 2011, 21, 1124–1131. [Google Scholar] [CrossRef] [Green Version]
  18. Atahan, H.N.; Pekmezci, B.Y.; Tuncel, E.Y. Behavior of PVA fiber-reinforced cementitious composites under static and impact flexural effects. J. Mater. Civ. Eng. 2013, 25, 1438–1445. [Google Scholar] [CrossRef]
  19. ASTM C618. Standard Specification for Coal Fly Ash and Raw or Calcined Natural Pozzolan for Use in Concrete; ASTM International: West Conshohocken, PA, USA, 2019. [Google Scholar]
  20. ASTM C39/C39M. Standard Test Method for Compressive Strength of Cylindrical Concrete Specimens; ASTM International: West Conshohocken, PA, USA, 2018. [Google Scholar]
  21. ASTM C496. Standard Test Method for Splitting Tensile Strength of Cylindrical Concrete Specimens; ASTM International: West Conshohocken, PA, USA, 2017. [Google Scholar]
  22. ASTM C469. Standard Test Method for Static Elastic modulus and Poisson’s Ratio of Concrete in Compression; ASTM International: West Conshohocken, PA, USA, 2014. [Google Scholar]
  23. ASTM C1609. Standard Test Method for Flexural Performance of Fiber-Reinforced Concrete (Using Beam with Third-Point Loading); ASTM International: West Conshohocken, PA, USA, 2019. [Google Scholar]
  24. ASTM C78. Standard Test Method for Flexural Strength of Concrete (Using Simple Beam with Third-Point Loading); ASTM International: West Conshohocken, PA, USA, 2018. [Google Scholar]
  25. ANSYS. Swanson Analysis System; ANSYS: Canonsburg, PA, USA, 2018. [Google Scholar]
  26. Willam, K.J.; Warnke, E.P. Constitutive model for triaxial behaviour of concrete. In Proceedings of the Seminar on Concrete Structures Subjected to Triaxial Stressed, International Association of Bridge and Structural Engineering Conference, Bergamo, Italy, 17–19 May 1974. [Google Scholar]
  27. Wight, J.K.; MacGregor, J.G. Reinforced Concrete: Mechanics and Design, 5th ed.; Prentice Hall: Upper Saddle River, NJ, USA, 2008. [Google Scholar]
  28. Standards Australia AS 3600. Methods of Testing Concrete. Method 17: Determination of the Static Chord Elastic Modulus and Poisson’s Ratio of Concrete Specimens; Standards Australia: Sydney, Australia, 2005. [Google Scholar]
  29. Standards Australia AS 2001. Concrete Structures, AS3600-2001; Standards Australia: Sydney, Australia, 2001. [Google Scholar]
Figure 1. Materials used for experiment. (a) Fly ash, and (b) coarse aggregate, and (c) fine aggregate.
Applsci 09 03424 g001
Figure 2. Fibers. (a) hooked end steel fiber and (b) polypropylene fiber.
Applsci 09 03424 g002
Figure 3. Curing specimens.
Applsci 09 03424 g003
Figure 4. Specimens for the compressive test. (a) Strain gauge and bond; (b) specimen with strain gauges.
Applsci 09 03424 g004
Figure 5. Compressive test.
Applsci 09 03424 g005
Figure 6. Splitting tensile test.
Applsci 09 03424 g006
Figure 7. Experiment of Poisson’s ratio and elastic modulus.
Applsci 09 03424 g007
Figure 8. Flexural test.
Applsci 09 03424 g008
Figure 9. Schematic of Solid65 element.
Applsci 09 03424 g009
Figure 10. Modeling of fiber-reinforced geopolymer concrete.
Applsci 09 03424 g010
Figure 11. Compressive strength.
Applsci 09 03424 g011
Figure 12. Stress–strain relationship. (a) At a volume fraction of 0.5%; (b) at a volume fraction of 1.0%; (c) at a volume fraction of 1.5%.
Applsci 09 03424 g012aApplsci 09 03424 g012b
Figure 13. Elastic modulus.
Applsci 09 03424 g013
Figure 14. Compressive strength and elastic modulus relationship.
Applsci 09 03424 g014
Figure 15. Poisson’s ratio.
Applsci 09 03424 g015
Figure 16. Splitting tensile strength.
Applsci 09 03424 g016
Figure 17. Compressive strength and splitting tensile strength relationship.
Applsci 09 03424 g017
Figure 18. Flexural strength.
Applsci 09 03424 g018
Figure 19. Load–deflection relationship. (a) At a volume fraction of 0.5%; (b) at a volume fraction of 1.0%; (c) at a volume fraction of 1.5%.
Applsci 09 03424 g019
Figure 20. Energy absorption capacity (toughness).
Applsci 09 03424 g020
Figure 21. SEM photos. (a) Specimen with polypropylene fiber; (b) specimen with steel fiber.
Applsci 09 03424 g021
Figure 22. Comparison the load–deflection behavior. (a) Specimen H1; (b) specimen H2; (c) specimen P1; (d) specimen P2.
Applsci 09 03424 g022
Figure 23. Crack patterns of experimental beams and modeling. (a) Specimen using polypropylene fiber; (b) specimen using hooked end steel fiber.
Applsci 09 03424 g023
Table 1. Mix proportion of geopolymer concrete.
Fly Ash (kg)Coarse Aggregate (kg)Fine Aggregate (kg)Sodium Hydroxide Solution (kg)Water Glass (kg)
418593170921386
Table 2. Chemical composition of fly ash.
OxideSiO2Al2O3Fe2O3SO3Na2OLoss on Ignition
Percentage (%)51.426.77.810.480.343.03
Table 3. Properties of fibers.
FiberNotationLength (mm)Diameter (mm)L/d RatioDensity (kg/m3)Elastic Modulus (GPa)Tensile Strength (GPa)
Hooked end steel fiberH1300.506090002051.1
H2350.507090002051.1
PolypropyleneP1100.052009103.50.7
P2150.053009103.50.7
Table 4. Notation of series specimens.
FiberSeriesNotationL/d RatioVolume Fraction of Fiber (%)
Non-fiber GCGC00
Hooked end steel fiberH1H1-05600.5
H1-101.0
H1-151.5
H2H2-05700.5
H2-101.0
H2-151.5
PolypropyleneP1P1-052000.5
P1-101.0
P1-151.5
P2P2-053000.5
P2-101.0
P2-151.5
Table 5. Compressive strength.
Volume Fraction of Fiber (%)Compressive Strength (MPa)
P1P2H1H2
0.032.0532.0532.0532.05
0.543.3338.5943.8945.20
1.036.1835.5057.0259.30
1.532.4527.1343.3349.44
Table 6. Compressive performance.
SpecimenCompressive Stress (MPa)StrainPoisson’s RatioElastic Modulus E (GPa)
GC32.610.00210.12825.40
P1-0543.330.00240.15226.10
P1-1036.180.00260.13925.37
P1-1532.450.00300.13223.09
P2-0538.590.00220.14625.82
P2-1035.500.00270.14025.15
P2-1527.130.00290.12921.32
H1-0545.090.00220.14829.09
H1-1057.020.00250.15831.08
H1-1543.310.00300.14027.29
H2-0545.200.00240.15030.67
H2-1059.300.00250.16331.56
H2-1549.440.00270.14528.87
Table 7. Comparison of elastic modulus.
SpecimenCompressive Strength (MPa)Measured E (GPa)AS3600–E (GPa)Hardjito–E (GPa)
P1-0543.3326.1031.6723.12
P1-1036.1825.3730.1221.58
P1-1532.4523.0929.2520.72
P2-0538.5925.8230.6522.12
P2-1035.5025.1529.9621.43
P2-1527.1321.3227.9119.40
H1-0545.0929.0932.0323.48
H1-1057.0231.0834.3225.74
H1-1543.3127.2931.6623.11
H2-0545.2030.6732.0523.50
H2-1059.3031.5634.7226.15
H2-1549.4428.8732.8924.33
Table 8. Splitting tensile strength.
Volume Fraction of Fiber (%)Splitting Tensile Strength (MPa)
P1P2H1H2
0.03.703.703.703.70
0.54.204.114.294.18
1.04.113.874.985.15
1.53.953.884.254.58
Table 9. Flexural strength.
Volume Fraction of Fiber (%)Flexural Strength (MPa)
P1P2H1H2
0.05.895.895.895.89
0.56.456.306.827.02
1.07.457.178.489.78
1.57.987.329.6510.22
Table 10. Flexural performance.
SpecimenFlexural Strength (MPa)Deflection at Peak (mm)Peak Load (N)Toughness (Nm)
GC5.891.20619,638.267.091
P1-056.451.25221,553.729.843
P1-107.451.83924,833.5913.685
P1-157.981.10026,611.2014.444
P2-056.301.25321,096.308.354
P2-107.171.69123,901.6012.740
P2-157.321.39224,409.1713.461
H1-056.820.94922,769.9816.794
H1-108.481.89228,412.1619.138
H1-159.651.48832,188.8023.330
H2-057.021.17023,442.0517.578
H2-109.781.76532,592.0021.126
H2-1510.221.62834,070.4024.191

