Article

High-Precision Pseudo-Noise Ranging Based on BOC Signal: Zero-Bias Mitigation Methods

College of Electronic Science, National University of Defense Technology, Changsha 410073, China
*
Author to whom correspondence should be addressed.
Appl. Sci. 2019, 9(15), 3162; https://doi.org/10.3390/app9153162
Submission received: 22 June 2019 / Revised: 30 July 2019 / Accepted: 31 July 2019 / Published: 3 August 2019
(This article belongs to the Special Issue Signal Processing for Satellite Positioning Systems)

Abstract

:
In high precision applications based on binary subcarrier offset (BOC) signals, zero-bias of the digital discriminator is an error of importance. Unlike the thermal noise error, zero-bias is a fixed deviation that is challenging to eliminate by filtering in the time domain. In this paper, a statistical error analysis model for the zero-bias of BOC signal’s digital phase discriminator is established. The evaluation of the zero-bias is inseparable from the spreading code sequence and the initial phase of the signal through defining the concept of statistics maximum and statistics standard deviation. Based on the zero-bias statistical error analysis model, two receiver parameter design methods, namely, the baseband signal sampling frequency and the early-late correlation interval, are proposed. The performance of the algorithm is simulated on account of the limited bandwidth, Doppler frequency offset and thermal noise. The simulation results prove that the proposed algorithm can suppress the standard deviation of zero-bias within one phase resolution, which contributes substantially to the improvement of the measurement accuracy of pseudo-noise ranging.

Graphical Abstract

1. Introduction

Binary offset subcarrier (BOC) modulation is a modern navigation signal modulation method that is widely used in global navigation satellite systems (GNSS) including Global Positioning System (GPS), Galileo, and BeiDou navigation satellite system (BDS) [1,2,3]. Compared with traditional binary phase shift keying (BPSK) modulation, BOC-modulated signal has better spectrum utilization, anti-interference capability, and theoretically higher pseudo-noise ranging performance [4]. In general, thermal noise and channel interference are the main factors limiting the tracking accuracy of the BOC signal. However, in high-precision applications where the channel environment is moderate, the pseudo-noise ranging deviation caused by digital signal sampling distortion can be significant [5,6,7].
There are two types of sampling distortion for a digital phase discriminator: Resolution error and zero-bias. The resolution error of the discriminator is caused by insufficient sampling of the digital signal [8]. Under the condition of commensurate sampling where the sampling frequency and the spreading symbol rate satisfy an integer-multiple relationship, the phase resolution error of the digital discriminator will increase significantly so that the phase resolution of the digital discriminator will be equal to the sampling interval of the digital signal [9,10]. In addition, the zero-bias of the discriminator arises from the asymmetry of the digital correlation curve of the pseudo-random spread spectrum signal [11,12]. Randomly flipping the chips of the pseudo-random spreading sequence destroys the symmetry of the digital correlation curve.
The BOC signal modulates the sinusoidal or cosine subcarrier on the BPSK signal [1]. Tracking ambiguity may occur in the full match reception of the BOC signal [13,14]. The dual estimation loop (DEL) reception method separately tracks the code phase and subcarrier phase and can eliminate this ambiguity [15,16,17]. In digital implementation, both the code phase discriminator and the subcarrier phase discriminator in the DEL are affected by sampling distortion. Many studies have focused on the impact of sampling distortion on the code phase discriminator [5,6,7,8,9,10,11,12,18,19,20,21,22], while only a few of them study of the digital subcarrier phase discriminator.
The effects of sampling and quantization of all-digital receivers are listed in this paragraph. Akos first studied the relationship between sampling frequency and spreading code rate, and suggested that in the case of commensurate sampling, the digital correlation curve will produce significant distortion [6]. To eliminate this distortion, Quirk proposed a noncommensurate sampling method that can efficiently improve the resolution of the digital correlation curve [8]. In addition, Jin and Tran proposed a method based on phase jitter, which can further improve the phase resolution [20,21]. When phase resolution is enhanced, the zero-bias effect is highlighted [11]. Jin proposed two ways to eliminate zero-bias based phase errors, one is zero-bias compensation [11] and the other is zero-bias mitigation [11,22]. Jin developed an implementation of zero-bias mitigation by designing the optimal sampling frequency. However, in a typical receiver, the optimal sampling frequency determined by Jin’s method is usually not easy to be implemented. In addition, Yang analyzed the zero-bias characteristics of a digital code-based phase discriminator and finds a close correlation between zero-bias, sampling frequency and correlation interval. Yang analyzed the comprehensive error of the discriminator and obtained some useful information but did not give a quantitative description of the zero-bias.
In this paper, sampling distortion of BOC signal reception is studied. The influence of sampling distortion on the code phase discriminator and subcarrier phase discriminator in the double loop is analyzed. The zero-bias of the BOC signal is modeled using noncommensurate sampling. The statistical characteristics of the zero-bias for aperiodic spreading code sequences are analyzed, while the maximum and standard deviation are used to evaluate their performances. Using the equivalent reference waveform method [23,24,25], the analytical expressions of the maximum and standard deviation are derived, and the quantitative relationship between the statistical properties of the zero-bias, the sampling frequency, and correlation interval are obtained. Two receiver parameter design methods, whose flexibility allows their effectiveness under a variety of constraints, based on this quantitative relationship are proposed, which can efficiently suppress the zero-bias. In addition, a series of simulations analyze the performance of this approach while the effects of radio frequency (RF) front-end bandwidth, Doppler-frequency deviation, and thermal noise are considered.
The article is organized according to the following structure. The sampling distortion of the BOC signal is modeled in Section 2. The statistical characteristics of the BOC signal zero-bias are analyzed in Section 3. Two parameter design methods for zero-bias mitigation are described in Section 4. The performance of the algorithm is simulated in Section 5, and a summary is given at the end of the article.

2. System Description

The BOC signal is received using dual estimation loops, including a code phase tracking loop and the subcarrier phase tracking loop, which are subject to sampling distortion. The sampling distortion of the BOC signal includes resolution errors and zero-bias, which are modeled as follows.

2.1. Signal Reception Model

The influence of subcarriers introduces the possibility of a lock ambiguity in the full match tracking of BOC signals [13,14]. Double estimation loops, delay locked loops (DLLs) and subcarrier lock loops (SLLs) work independently, which eliminates lock ambiguity.
Figure 1 shows the block diagram of the BOC signal’s receiving structure based on a double estimation. One baseband BOC signal enters the early-late code phase correlator after stripping the subcarrier signal. Then, the other baseband signal enters the early-late subcarrier phase correlator after stripping the spread code signal. The code tracking loop and the subcarrier tracking loop estimate and filter the code phase error, the subcarrier phase error, and their feedback control the generation of the local code signal and the local subcarrier signal. As shown in Figure 1, s ( t ) is the baseband BOC input signal, c ( t ) , c ( t + d 0 c ) , and c ( t d 0 c ) are punctual, early, and late local code signals respectively, d 0 c is the early or late code phase, s c ( t ) , s c ( t + d 0 s c ) , and s c ( t d 0 s c ) are punctual, early, and late subcarrier signal respectively, d 0 s c is the early or late subcarrier phase, R E c and R L c are the correlation values of the early and late code phases respectively, R E s c and R L s c are the correlation values of the early and late subcarrier phases respectively, τ ^ 0 c and τ ^ 0 s c are code phase and subcarrier phase estimated value respectively.
For code phase correlators, assuming that the subcarrier phases in the local and received signals are fully synchronized, the normalized code phase correlation function R c ( τ 1 c , τ 2 c ) can be expressed as:
R c ( τ 1 c , τ 2 c ) = 1 N s m = 0 N s 1 c g m c ( τ 1 c ) c g m c ( τ 2 c )
where c k is the k-th chip in the spreading code sequence { c 1 , c 2 , , c k , } , g m c ( τ c ) ( = mod ( ( m T s τ c ) / T c ) ) is the code index of the m-th sample in the signal with the initial phase τ c , τ 1 c and τ 2 c denote the code phase deviation of the local signal and the received signal, respectively. N s is the number of coherent integration points of the correlator, T s ( = 1 / F s ) is the sampling interval of the baseband signal, F s is the sampling frequency of the baseband signal, T c ( = 1 / F c ) is the width of the spread spectrum chip and F c is the spreading code rate.
The code phase discriminator estimates the code phase deviation of the local signal from the received signal using an early-late code phase correlator. The normalized code phase discrimination function D c ( τ 0 c , ε ) is:
D c ( τ 0 c , ε ) = 1 1 + 2 d 0 c [ R c ( τ 0 c , τ 0 c + ε + d 0 c ) R c ( τ 0 c , τ 0 c + ε d 0 c ) ]
where τ 0 c is the initial code phase of the received signal, ε is the code phase deviation of the local signal from the received signal and 2 d 0 c is the early-late correlation interval of the code phase discriminator.
For the subcarrier phase correlator, assuming that the code phase in the local signal and the received signal are fully synchronized, the normalized subcarrier phase correlation function R s c ( τ 1 s c , τ 2 s c ) is:
R s c ( τ 1 s c , τ 2 s c ) = 1 N s m = 0 N s 1 s c g m s c ( τ 1 s c ) s c g m s c ( τ 2 s c ) ,
where s c k is the k-th symbol in the subcarrier sequence { s c 1 , s c 2 , , s c k , } , g m s c ( τ s c ) ( = mod ( ( m T s τ s c ) / T s c ) ) is the subcarrier index of the m-th sample in the signal with the initial phase τ s c , τ 1 s c and τ 2 s c represent the subcarrier phase error of the input signal and the local signal. T s c ( = 1 / F s c ) is the symbol width of the subcarrier and F s c is the subcarrier symbol rate.
The early-late subcarrier phase correlator is utilized to estimate the subcarrier phase offset of the local signal and the received signal. The normalized subcarrier phase discrimination function D s c ( τ 0 s c , ε ) is:
D s c ( τ 0 s c , ε ) = 1 1 + 2 d 0 s c [ R s c ( τ 0 s c , τ 0 s c + ε + d 0 s c ) R s c ( τ 0 s c , τ 0 s c + ε d 0 s c ) ] ,
where τ 0 s c is the initial subcarrier phase of the received signal and 2 d 0 s c is the early late correlation interval of the subcarrier phase discriminator.
Since the symbol rate of the subcarrier is higher than the spreading code rate, the subcarrier phase has a higher estimation accuracy than that of the spreading code. However, the estimation of the subcarrier phase has periodic ambiguity. Therefore, the pseudo-noise ranging of the BOC signal is usually estimated by combining the code phase and the subcarrier phase
τ ^ = r o u n d ( τ ^ 0 c τ ^ 0 s c T s c ) × T s c + τ ^ 0 s c ,
where r o u n d ( ) represents a rounding function, τ ^ 0 c is a code phase estimation result, τ ^ 0 s c is a subcarrier phase estimation value and T s c is a phase period of the subcarrier discriminator.

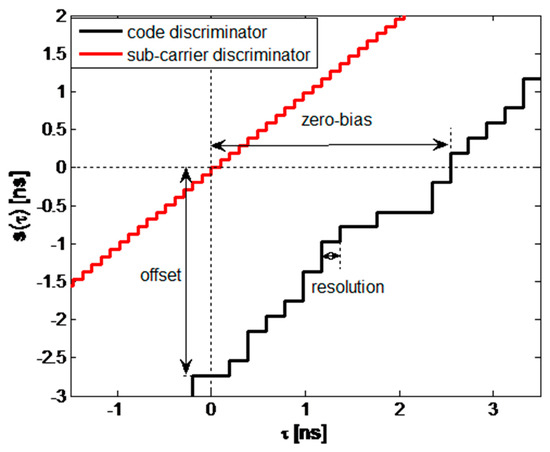
2.2. Sampling Distortion: Resolution Error

Insufficient resolution due to sampling distortions can cause errors in signal phase estimation or resolution errors. In the time domain, the signal resolution depends on the sampling frequency and is numerically equal to the sampling interval. In the correlation domain, since the phase information distributed at different sampling points can be utilized, a higher phase resolution can usually be obtained, which is affected by the sampling frequency and the signal frequency.
For a digital square wave signal, assuming that the coherent integration time of the correlator is an integer of the spread symbol width, and the correlation interval of the discriminator is an integer of the phase resolution of the correlator, the resolution P ( k s , k ) of the phase discriminator is [8,12]:
P ( k s , k ) = 1 F 0 l c m ( k s , k ) ,
where l c m ( ) represents the calculation of the least common multiple, F 0 ( = 1 / T c o h ) is the reference frequency, T c o h is the signal correlation time, k s ( = F s / F 0 ) is the sampling coefficient and k is the spreading factor.
According to Formula (6), the noncommensurate sampling frequency of the BOC signal, F ˜ s , is defined as:
F ˜ s = k ˜ s F 0 ,
where k ˜ s is a positive integer that is incomparable with both k c and k s c , k c ( = F c / F 0 ) is the frequency coefficient of the code and k s c ( = F s c / F 0 ) is the frequency coefficient of the subcarrier.
Noncommensurate sampling can remarkably improve the phase resolution of a digital discriminator. For a BOCs (1, 1) signal with a spreading code rate F c of 1.023 MHz, a subcarrier symbol rate F s c of 2.046 MHz, a coherent integration time T c o h of 1 ms, and a corresponding reference frequency F 0 of 1 KHz, and the noncommensurate sampling frequency is designed to be 4.999 MHz, the resolution of the code phase discriminator, P c , is 0.2 ns (2.0 × 10⁻⁴ chips), while the resolution of the subcarrier phase discriminator, P s c , is 0.1 ns (1.0 × 10⁻⁴ chips), which is obviously higher than the time domain resolution of the signal T s (200 ns).

2.3. Sampling Distortion: Zero-Bias

In addition to resolution error, the sampling distortion causes a zero-bias in the phase estimation of the digital discriminator. In the commensurate sampling case, the resolution error is much larger than the zero-bias. While in the noncommensurate sampling case the effect of the zero-bias phase is more arresting since resolution error is suppressed. The zero-bias of the discriminator arises due to the asymmetry of the correlation curve and is related to the randomness of the spreading sequence. In a real-world scenario, the zero-bias of the code phase discriminator is prominent, but the zero-bias of a sub-carrier phase discriminator is not that obvious.
The zero-bias of the digital phase discriminator is defined as the phase delay of a stable convergence point of the discrimination curve, i.e.,
S ( τ 0 ) = ε | D ( τ 0 , ε ) = 0 .
In the case of noncommensurate sampling, regardless of the influence of phase resolution error, the zero-bias of the discriminator can be equivalent to the phase discrimination value at zero phase, i.e.,
S ( τ 0 ) D ( τ 0 , 0 ) .
Figure 2 shows the simulation results of the code phase discriminator and subcarrier phase discriminator of the BOCs (1, 1) signal. The simulation selects a GPS L1C signal whose pseudo-random number (PRN) is 1. The noncommensurate sampling frequency F ˜ s is set to 4.999 MHz, the spreading code rate F c is 1.023 MHz, the subcarrier symbol rate F s c is 2.046 MHz and the coherent integration time T c o h is 1 ms. The correlation interval of the discriminator is an integer multiple of the phase resolution and is close to a typical value. The correlation interval, 2 d 0 c , of the code phase discriminator is 0.5001 chips, and the correlation interval of the subcarrier phase discriminator is 0.5 d 0 c chips. Thus, the zero-bias of the digital code phase discriminator is 2.5 ns (2.5 × 10⁻³ chips), which is evidently larger than the phase resolution of 0.2 ns (2.0 × 10⁻⁴ chips). Meanwhile, the zero-bias of the digital subcarrier phase discriminator is similar to the phase resolution.
Figure 3 simulates the code phase discriminator and subcarrier phase discriminator of the BOCs (1, 1) signal, and analyzes the effect of the signal’s initial phase. The initial phase of the signal is set to a range of [ T s / 2 , T s / 2 ] , and the simulation interval is 1/10 of the resolution of the subcarrier phase discriminator P s c . The simulation results show that: (1) The zero-bias of the digital subcarrier phase discriminator is significantly smaller than the digital code phase discriminator, (2) the resolution of the zero-bias of the digital code phase is equal to the phase resolution of the discrimination curve, (3) the variation of the zero-bias can be approximately continuous, reaching a maximum at a specific phase.

2.4. Comprehensive Analysis

The zero-bias of the subcarrier phase discriminator is smaller than the code phase discriminator according to the simulation in Section 2.3. The symbols 0 and 1 in the subcarrier signal are alternately arranged with no randomness, leading to better symmetry of the correlation curve while assuming that the subcarrier loop is independent of the code loop for the BOC signal. In fact, in a dual estimation loop, the code phase tracking error can have an enormous impact on the subcarrier phase estimation. Considering the influence of the code phase estimation error τ e c , the zero-bias formula of the digital subcarrier phase discriminator can be expressed as:
S s c ( τ 0 , τ e c ) = m = 0 N s 1 c g m c ( τ 0 ) c g m c ( τ 0 + τ e c ) s c g m s c ( τ 0 ) ( s c g m s c ( τ 0 d 0 s c ) s c g m s c ( τ 0 + d 0 s c ) ) ( 1 + 2 d 0 s c ) N s ,
where τ 0 is the initial phase of the BOC signal.
Figure 4 simulates the digital subcarrier phase discriminator of the BOCs (1, 1) signal. The designed range of the signal’s initial phase is ±0.1 chips and the code phase estimation deviation varies within ±0.2 chips. The sample rate of the phase in Figure 4a is the resolution of the digital code phase discrimination curve (2.0 × 10⁻⁴ chips). Figure 4b extracts the initial phase of the signal that is proportional to 100. The simulation results show that the zero-bias of the code phase discriminator of the BOCs (1, 1) signal is transmitted to the sub-carrier phase discriminator, but the amplitude of the zero-bias error is reduced to 25.0%.
The frequently used mathematical notations in this paper are summarized in Table 1.

3. Statistical Characteristic of Zero-Bias

According to the analysis in Section 2, the pseudo-noise ranging measurement of the BOC signal is still affected by the zero-bias of the digital code phase discriminator. The zero-bias of the discriminator is related to the initial phase of the signal and the spreading sequence, but these two factors may not work in practical applications. An equivalent reference waveform method is proposed to analyze the zero-bias of the digital phase discriminator. The statistical performance of discriminator zero-bias of aperiodic codes is analyzed, and an evaluation method based on maximum and standard deviation is proposed. In addition, the relationship between the zero-bias of the digital discriminator and the randomness of the spreading sequence is explained.

3.1. Equivalent Reference Waveform Analysis

The equivalent reference waveform is in a form of the local signal of the early-late phase discriminator [23,24,25]. The early-late phase discriminator estimates phase using the information difference between an early correlator and a late correlator. A phase discriminator based on an equivalent reference waveform utilizes the correlation of the local reference signal with the received signal to estimate the phase.
As shown in Figure 5, the rectangular reference waveform w ( t ) is defined as the difference between the early local signal and the late local signal [26] as follows
w ( t ) = 0.5 ( s ( t + d 0 ) s ( t d 0 ) ) ,
where 2 d 0 is the correlation interval of the discriminator, which is numerically equal to the gate width of the reference wavef orm. The rectangular reference waveform is the first reference waveform [27], and the valid symbol appears as the polarity inversion of the chip.
An equivalent phase discriminator can be obtained by correlating the reference waveform with the received signal. Assuming that the local signal is synchronized with the received signal, the composite signal associated with the reference waveform and the received signal p ( t ) is
p ( t ) = s ( t ) w ( t ) .
According to Equation (9), the zero-bias of the digital discriminator can be approximated as the output value of the discriminator when the phase error is zero, namely:
S ( τ 0 ) = 2 ( 1 + 2 d 0 ) × N s n = 0 N p 1 ( p ( n ) ) ,
where p ( n ) represents the n-th accumulated value of the composite waveform and N p represents the number of waveforms of the composite signal during the coherent integration time T c o h .
When the reference signal is synchronized with the local signal, the composite waveform symbol p ( n ) is oddly symmetric about the center point. Considering the sampling effect, the accumulated value of the composite waveform’s actual value may be +1, −1 or 0. If the number of sampling points of the composite waveform is even, the accumulated value is zero. Otherwise, the accumulated value is non-zero if the number of sampling points is odd.

3.2. Standard Deviation of Zero-Bias

According to the analysis in Section 3.1, a composite waveform with a non-zero accumulated value may affect the zero-bias of the digital phase discriminator. Whether the phase synchronization result is equal to zero depends on the parity of sampling point number of the composite waveform. Suppose the composite waveform appear continuously, the average of composite waveform samples defined during the coherent integration time is
c ¯ s = 2 d 0 F ˜ s / F p ,
where F p represents the symbol rate of the composite signal.
Under noncommensurate sampling conditions, the sampling frequency is not proportional to the symbol rate, therefore the number of sampling points varies according to different symbol waveforms. The average number of samples reflect the statistical characteristics of the coherent integration time. When the average of sampling points is close to an odd number, the number of sampling points is large. However, when the number of composite waveforms is an odd, the number of sampling points is rather small.
According to this relationship, the number of composite waveforms N ˜ p where the cumulative value is non-zero can be determined by
N ˜ p = F p T c o h | c ¯ s 2 r o u n d ( c ¯ s / 2 ) | .
For subcarrier signals, each adjacent subcarrier symbol is flipped. Thus, the number of composite waveforms whose non-zero accumulated value is equal to N ˜ p . Since the composite waveform is continuous, a composite waveform with accumulated values of +1 and −1 will be canceled when coherently accumulated. This explains why the zero-bias of the digital subcarrier phase discriminator is very small.
However, for a spreading code sequence, the polarity flip of the adjacent chips is random. In a statistical sense, the polarity inversion of a pseudo-random spreading code sequence can approximately satisfy a Bernoulli distribution with a probability of 1/2. Therefore, for the spreading code sequence, the number of symbol waveforms, whose accumulated values are non-zero, is smaller than N ˜ p . In the spread spectrum sequence, the position of the symbol waveform whose accumulated value is non-zero is related not only to the sampling frequency, the code rate, and the initial phase of the signal but also to the polarity inversion of the code sequence.
For the most extreme case, assuming that there is a set of spreading code sequences { c 1 , c 2 , , c n } , a polarity inversion occurs for all composite waveforms with an accumulated value of +1, and no polarity inversion occurs for any positions where the accumulated value is −1. Then, the digital code phase discriminator corresponds to the maximum zero-bias MAX ( S c ) , which is characterized by
MAX ( S c ) = F c ( 1 + 2 d 0 c ) F ˜ s | c ¯ s 2 r o u n d ( c ¯ s / 2 ) | .
The maximum value of the zero-bias is just a special case. In order to apply the general case, a standard zero-bias deviation of the non-periodic spreading code sequence is defined below. With an assumption that the probability of polarity inversion of the non-periodic spreading code sequence is 1/2 and is independent of each other. According to Appendix A, the variance of the composite waveform accumulated value based on the aperiodic spreading code sequence is:
VAR ( Z ) = N ˜ p 4 .
wherein, the statistic Z is equivalent to the accumulated value n = 0 N 1 ( p ( n ) ) of the composite waveform in the coherent integration time T c o h .
According to Equation (13), the standard deviation of the zero-bias of the code phase discriminator is:
σ S c = F c T c o h | c ¯ s 2 r o u n d ( c ¯ s / 2 ) | ( 1 + 2 d 0 c ) F ˜ s T c o h .

4. Zero-Bias Mitigation Method

The sampling distortion of the BOC signal causes the resolution errors and zero-bias of phase estimation. If a noncommensurate sampling frequency is used, the phase resolution error can be effectively suppressed, and as a result, the dominating sampling distortion error becomes zero-bias. According to the analysis in Section 2, In spite that the zero-bias of the digital subcarrier phase discriminator is very small, the zero-bias of the digital code phase discriminator in double estimation loop is transmitted to the subcarrier loop and causes pseudo-noise ranging. Section 3 analyzes the statistical characteristics of the zero-bias of the BOC signal phase discriminator and obtains quantitative description results. Based on the statistical standard deviation of zero-bias, the mitigation method of BOC signal zero-bias is explored in two aspects: Correlation interval and sampling frequency.

4.1. Correlation Interval Design

When the average number of sample points c ¯ s of the composite waveform is even, the digital code phase discriminator has the smallest zero-bias. Regardless of the limited bandwidth influence in the front end of the BOC signal, the optimal correlation interval for suppressing the zero-bias is:
2 d 0 c = 2 k F c / F ˜ s , ( k = 1 , 2 , 3 , , 0.5 F s / F ˜ c ) ,
where represents rounding down.
Figure 6 shows the simulation results of a digital code phase discriminator for BOCs (1, 1) signals at different correlation intervals. The simulation selects 10,000 sets of GPS P code sequences, sets the noncommensurate sampling frequency to 11.251 MHz, the code sequence length is 1,023 chips, and the spreading code rate is 1.023 MHz. The subcarrier symbol rate is 2.046 MHz, the correlation interval of the subcarrier phase discriminator is 0.25 chips, and the coherent integration time is 1 ms. The simulation results show that if the optimal correlation interval is selected, the zero-bias of the digital code phase discriminator is negligible. For example, for a digital code phase discriminator with a correlation interval of 10 T s (approximately 0.91 chips), the discriminator has a code phase resolution of 86.8 ps (8.8 × 10⁻⁵ chips), while the standard deviation of zeros-bias is only 10.8 ps (1.1 × 10⁻⁵ chips).
The optimal correlation interval obtained according to the method proposed in this paper is the same as that of Yang’s paper [12]. Although these two different methods share the conclusion, the method proposed in this paper is capable to quantitatively evaluate the performance of all parameters, instead of being limited to optimal parameter design As shown in Figure 6, the correlation interval near the optimal value 10 T s corresponds to the similar zero-bias performance.

4.2. Sampling Frequency Design

In satellite navigation receivers, the local phase is controlled by a numerically controlled oscillator (NCO). In order to save computing resources, the correlator interval is designed to be (1/2)n chips. At the same time, the impact of the limited bandwidth of the RF front end needs to be considered while choosing the relevant intervals. Therefore, an optimal sampling frequency design method for suppressing zero-bias is proposed below:
(1)
Determine specific parameters such as spreading code rate F c , correlator interval 2 d 0 c , and coherent integration time T c o h ;
(2)
Limit the range of sampling frequency to [ F 1 , F 2 ] , according to the actual resource conditions;
(3)
Select the available noncommensurate sampling frequency F ˜ s = k F 0 , k Z according to Formula (7);
(4)
Design the optimal sampling frequency to suppress zero-bias according to Equation (18).
(5)
For multi-system satellite navigation receivers, different spreading code rates and systems might be necessary for signal receiving [28,29,30]. In addition, in a multi-stage loop tracking design, it may be necessary to select different discrimination intervals. When multiple constraints need to be met, the above design method can still be used to select a relatively good sampling frequency.
Figure 7 shows the simulation results of a digital code phase discriminator for BOCs (1, 1) signals at different sampling frequencies. The code phase correlation interval is set to 1 chip and the parameter configuration is the same as that in Figure 6. The simulation results show that if the sampling frequency is selected appropriately, the zero-bias of the code phase discriminator also can be effectively suppressed. When the sampling frequency is 10.231 MHz, the resolution of the digital code phase discriminator is 95.5 ps (9.8 × 10⁻⁵ chips), and the resolution of the digital subcarrier phase discriminator is 47.8 ps (4.9 × 10⁻⁵ chips), and in this case the standard deviation of the zero-bias of the code phase discriminator is only 11.4 ps (1.2 × 10⁻⁵ chips).
According to Jin’s conclusion in [11], the implementation of compensation-free zero-bias mitigation method requires that the sampling ratio should be designed to be 1/8 + 1/8176. Among them, the sampling frequency is 8.176 MHz, and the standard deviation of the zero-bias is 36.1 ps (3.8 × 10⁻⁵ chips). The sampling frequency design given in this paper is 8.185 MHz, and the standard deviation corresponding to the zero-bias is 14.3 ps (1.5 × 10⁻⁵ chips). From the aspect of standard deviation of zero-bias, the algorithm of this paper is superior to the method in [11]. Like the correlation interval design method, the purpose of the sampling frequency design method proposed in this paper is not to be confined to reveal the optimal sampling frequency but to quantitatively evaluate the zero-bias performance of different sampling frequencies.

5. Performance Simulation and Analysis

Section 4 describes two methods of zero-bias mitigation, but only the condition of pure signals is considered. The effects of limited bandwidth, Doppler effect, and thermal noise on the sampling distortion of digital BOC signals are discussed below.

5.1. Limited Bandwidth

In a band-limited system, the energy of the BOC signal’s high-frequency portion is limited. The discrimination curve of the band-limited signal is relatively smooth compared to the discrimination curve of the non-bandlimited signal. However, if the local reference signal is non-bandlimited, the received band-limited signal has little effect on the resolution of the digital discriminator.
Figure 8 shows the simulation results of the code phase discriminator and subcarrier phase discriminator of the BOC signal under different RF front-end bandwidth settings. A spreading code sequence with a PRN of 1 for the GPS L1C/A signal is selected. The sampling frequency, the spreading code rate, and the subcarrier symbol rate are set to 11.251, 1.023, and 2.046 MHz, respectively. The code phase correlation interval, the subcarrier phase correlation interval, and the coherent integration time are set to is 1 chip, 0.25 chips, and 1 ms, respectively. The simulation results show that the limited bandwidth affects the slope, phase resolution and zero-bias of the digital phase discriminator, the effects are not serious.
Figure 9 shows the simulation results of the zero-bias of the BOCs (1, 1) signal under different bandwidth conditions. The simulation results show that the limited bandwidth has little effect on the variation of the zero-bias of the BOCs (1, 1) signal reception. In fact, although the linear bandpass filter limits the high-frequency portion of the BOC signal, it does not destroy the symmetry of the correlation curve or the characteristics of the phase response curve.

5.2. Doppler Frequency Shift

The received signal will be affected by the Doppler effect if radial relative motion between the receiving terminal and the generating terminal exists. Thus, the Doppler effect is an indispensable factor that the satellite navigation receivers should consider as the satellites in satellite navigation systems always move around the Earth. The omitting of the Doppler frequency offset of the received signal is the source that the resolution error of the digital phase discriminator is significantly smaller than the zero-bias under noncommensurate sampling conditions. The two methods of zero-bias mitigation proposed in Section 4 ignore the influence of the phase resolution error of the signal under the condition of noncommensurate sampling. The influence of Doppler shift on phase resolution is given the priority, rather than the effect of multi-frequency shift on zero-bias.
According to Formula (6), when the number of chips in the coherent integration time is an integer, the resolution of the digital phase discriminator is P ( k s , k c ) . According to the analysis in [7], the approaching of Doppler frequency to the magnitude of the reference frequency F 0 could exert an impact on the phase resolution. Figure 10 shows the simulation results of the effect of Doppler frequency on the phase resolution of the digital code discriminator. Typically, a low-speed satellite navigation receiver has a code Doppler frequency less than 1 Hz. The Doppler frequency is set in a range of ±1 KHz in the simulation. When the coherent integration time of the digital code phase discriminator is set to 1 ms, the reference frequency F 0 is 1 KHz. In this case, only when the Doppler frequency reaches the order of 100 Hz, the resolution of the discriminator will be exerted a large impact. When the Doppler frequency is close to 100 Hz, the resolution of the digital discriminator changes significantly.
For the general case, assuming that the Doppler frequency is less than 1 Hz, so the effect of the digital code discriminator phase resolution can be ignored. With this assumption, the standard deviation of the zero-bias of code phase discriminator can be corrected to:
σ S d c = ( F c + F d ) T c o h | c ¯ s d 2 r o u n d ( c ¯ s d / 2 ) | ( 1 + 2 d 0 c ) F ˜ s T c o h ,
where c ¯ s d ( = 2 d 0 F ˜ s / ( F c + F d ) ) represents the average number of sampling points of the composite signal waveform that considers the Doppler code effect.
Figure 11 depicts the code Doppler effect influence on the zero-bias of the digital code phase discriminator of the BOCs (1, 1) signal. The simulation selects three noncommensurate sampling frequencies 10.231, 10.741, and 11.251 MHz, which corresponds to weak, medium and severe zero-bias respectively. The simulation results show that the simulation results of zero-bias are consistent with the theoretical values under different Doppler code frequency offset conditions. When the Doppler frequency is smaller than 1 Hz, the zero-bias variation with the Doppler frequency is not large.

5.3. Thermal Noise

There is a little correlation between the zero-bias of the digital phase discriminator and the thermal noise in the signal on account of the distortion error caused by the sampling. Therefore, the effects of thermal noise are not considered in the signal model in Section 2 and the zero-bias statistical error analysis in Section 3. In satellite navigation receivers, the estimation of the phase is affected by thermal noise since the signal power is typically lower than noise power. In this case, thermal noise can affect the accuracy of the pseudorange measurement. In order to compare the thermal noise error and the zero-bias in the pseudorange measurement, a joint analysis is performed below.
For the BOC signal, the thermal noise error of the subcarrier phase discriminator σ T is:
σ T = d 0 s c 2 T c o h C / N 0 ( 1 + 1 ( 1 d 0 s c ) T c o h C / N 0 ) ,
where C / N 0 represents the carrier-to-noise ratio of the BOC signal.
For the short-period spreading code sequence, assuming that the initial phase of the reception is unchanged, the zero-bias of the BOC signal is a fixed value depending on the sequence of the spreading code and the initial phase of the received signal. Therefore, making it possible for the fixed value to reach a maximum. For a non-periodic spreading code sequence, the zero-bias of the BOC signal at different times approximately satisfies the standard normal distribution.
For BOC signals based on non-periodic codes, the standard deviation σ D 2 of the phase measurement is
σ D 2 = k s c 2 σ S c 2 + σ T 2 ,
where k s c represents the error transfer coefficient of the code tracking loop to the subcarrier tracking loop.
According to the loop filtering theory of Betz and Kolodzjejski [31,32,33], if the phase noise obeys a normal distribution, and the original phase discrimination value has an observation error of σ D 2 , the error of the obtained phase measurement value is as follows after applying a low pass filter with the bandwidth B L .
σ 2 σ D 2 2 B L T c o h .
Figure 12 simulates the zero-bias and thermal noise errors in the BOC (1, 1) signal reception. The simulation selects sampling frequencies of 5 and 10 MHz respectively representing severe and slight sample distortions. The simulation results show that: (1) For long-period spreading code sequences, when the sampling frequency is 5 MHz and the received signal-to-noise ratio is greater than 65 dBHz, the effect of sampling distortion will be greater than thermal noise. When the sampling frequency is 10 MHz, the corresponding signal-to-noise ratio threshold is 70 dBHz. (2) For short-period spreading code sequences, when the carrier-to-noise ratio is 20.5 dBHz (5 MHz) and 30.3 dBHz (10 MHz), the maximum value of the zero-bias of the received signal is equivalent to the thermal noise error. When the carrier-to-noise ratio is 38.5 dBHz (5 MHz) and 49.5 dBHz (10 MHz), the standard deviation of the zero-bias of the received signal is comparable to the thermal noise error.

6. Discussion

This paper aims to solve the zero-bias problem caused by sampling distortion in BOC signal pseudorange measurement. From a statistical point of view, a new indicator for evaluating the bias performance is proposed, which is conducive to eliminate the effects of the spreading sequence and the initial phase. An analytical method of equivalent reference waveform is proposed, and the analytical expression of the standard deviation of the zero-bias is derived. A quantizable zero-bias suppression method based on receiver parameter design is provided. Some research results are achieved, but the following aspects still wait to be explored.
(1)
When the sampling frequency of the baseband signal is limited to an equal sampling frequency, the phase resolution error of the digital discriminator is incapable to be avoided. In this case, the elimination of the influence of phase resolution error on pseudorange accuracy is inseparable from further study.
(2)
The article simulates the BOC (1, 1) signal, and the conclusion can be directly extended to the BOC (m, n) signal, but the applicability to the MBOC signal is still worth exploring.
(3)
This paper is confined to the influence of signal Doppler frequency on the statistical standard deviation of zero-bias. In the case of non-zero Doppler, the initial phase of the received signal changes continuously, and the zero-bias of the digital discriminator changes. For the phase discriminator of short-period codes, the elimination of the bias by means of the Doppler effect design algorithm is needed to be studied further.
(4)
When multiple signals are simultaneously transmitted in the channel, the multiple access interference has a significant impact on the high precision measurement of the pseudorange. How to quantify the impact of multiple access effects on pseudorange accuracy is still worth studying.

7. Conclusions

In this paper, the digital reception model of the BOC signal is analyzed. The analysis models of resolution error, the zero-bias of the digital code phase discriminator and the digital subcarrier phase discriminator are established. The propagation error relationship between the code tracking loop and the subcarrier tracking loop is derived, indicating that the sampling distortion error of the BOC signal, under noncommensurate sampling conditions, mainly depends on the zero-bias of the code phase discriminator. The statistical analysis model of the zero-bias of BOC signal is established, and the analytical expression of the statistical standard deviation of the zero-bias is derived. Two zero-bias mitigation methods based on the receiver parameters are proposed. The quantitative relationship between the zero-bias, the sampling frequency and correlation interval of the receiver are also introduced. The zero-bias mitigation methods, based on a quantitative relationship, can adapt different constraints and flexibly design parameters. In addition, this work uses simulations to verify the existence of limited bandwidth, the Doppler frequency offset, and thermal noise. Thus, the simulation fully validates the effectiveness of the proposed method.

Author Contributions

The work presented here was carried out in collaboration with all authors. C.M. made the research theme, designed the methods, and wrote the paper. X.T., Z.L. and Z.X. carried out the experiments, analyzed the data, and prepared the draft. G.G. worked on reviewing the manuscript.

Funding

This research was funded by the National Natural Science Foundation of China, grant number 61601485.

Conflicts of Interest

The authors declare no conflict of interest. The founding sponsors had no role in the design of the study, in the collection, analyses, or interpretation of data, in the writing of the manuscript, and in the decision to publish the results.

Appendix A

When the baseband signal s ( t ) in each symbol period is inverted, the number of the composite waveform p ( n ) is N p in the coherent integration time T c o h . Since the initial phase of the received signal is the same as the local signal, the combined waveform p ( n ) is oddly symmetric with respect to the center point. When the composite waveform is discretized, the accumulated value p ( n ) may be +1, −1, and 0. If the number of sampling points of the composite waveform in the coherent integration time T c o h is c ¯ s ( = 2 d 0 F ˜ s / F p ) , the number of composite waveforms in which the non-zero accumulated value is correlated with the distance between c ¯ s and the adjacent odd number. According to formula (15), the statistical value of the composite waveform whose accumulated value is non-zero is N ˜ p ( = F p T c o h | c ¯ s 2 r o u n d ( c ¯ s / 2 ) | ) . The number of waveforms whose accumulated value is +1 or −1 is N ˜ p / 2 , which is assumed to be an integer.
For a pseudo-random spreading code sequence, the flipping of the chips is random. The composite waveform p ( n ) is generated at the position where the chip is flipped. The flip position of the chip exerts an influence on the integrated value of the composite signal during the coherent time. If the chip of the spreading sequence is flipped at the accumulated value of +1, and the position of −1 is not inverted, corresponding to the maximum zero-bias of the digital phase discriminator.
However, the chip flip of the pseudo-random spreading code sequence occurs randomly, and the flipping probability is 1/2 and independent of each other. It is assumed that the chip flip is event X ( i ) , i [ 1 , 2 , , N ˜ p / 2 ] at the position where the i-th composite waveform accumulated value is +1, and the chip flip is turned to event Y ( j ) , j [ 1 , 2 , , N ˜ p / 2 ] at the position where the j-th composite waveform accumulated value is −1. The random variable Z is defined as follows:
Z = X ( 1 ) + X ( 2 ) + + X ( N ˜ p / 2 ) Y ( 1 ) Y ( 2 ) Y ( N ˜ p / 2 )
wherein, E ( X ( i ) ) = 1 / 2 , E ( X 2 ( i ) ) = 1 / 2 , E ( Y ( j ) ) = 1 / 2 , E ( Y 2 ( j ) ) = 1 / 2 , E ( X ( i ) Y ( j ) ) = 0 .
The mean value of the random variable Z is:
E ( Z ) = 0
The variance of the random variable Z is:
D ( Z ) = N ˜ p / 4

References

  1. Betz, J.W. Binary offset carrier modulations for radio navigation. Navigation 2002, 48, 227–246. [Google Scholar] [CrossRef]
  2. Hegarty, C.J. GNSS signals—An overview. In Proceedings of the IEEE International Frequency Control Symposium, Baltimore, MD, USA, 21–24 May 2012; pp. 1–7. [Google Scholar] [CrossRef]
  3. Sun, F.; Liu, S.; Zhu, X.; Men, B. Research and progress of Beidou satellite navigation system. Sci. China Inf. Sci. 2012, 55, 2899–2907. [Google Scholar] [CrossRef]
  4. Kaplan, E.; Hegarty, C. Understanding GPS: Principles and Applications; Artech House: Norwood, MA, USA, 2006. [Google Scholar]
  5. Liu, Z.; Li, B.; Zhu, X.; Li, L.; Sun, G. Band-Pass Sampling in High-Order BOC Signal Acquisition. Appl. Sci. 2018, 8, 2226. [Google Scholar] [CrossRef]
  6. Akos, D.M.; Pini, M. Effect of sampling frequency on GNSS receiver performance. Navigation 2006, 53, 85–95. [Google Scholar] [CrossRef]
  7. Brown, J.L. On quadrature sampling of bandpass signals. IEEE Trans. Aerosp. Electron. Syst. 1979, 15, 366–371. [Google Scholar] [CrossRef]
  8. Quirk, K.J.; Srinivasan, M. PN code tracking using noncommensurate sampling. IEEE Trans. Commun. 2006, 54, 1845–1856. [Google Scholar] [CrossRef]
  9. Hegarty, C.J. Analytical model for GNSS receiver implementation losses. Navigation 2011, 58, 29–44. [Google Scholar] [CrossRef]
  10. Tran, V.T.; Shivaramaiah, N.C.; Nguyen, T.D.; Glennon, E.P.; Joon, W.C.; Dempster, A.G. Generalized theory on the effects of sampling frequency on GNSS code tracking. J. Navig. 2018, 71, 257–280. [Google Scholar] [CrossRef]
  11. Jin, X.; Zhang, N.; Yang, K. PN ranging based on noncommensurate sampling zero bias mitigation methods. IEEE Trans. Aerosp. Electron. Syst. 2017, 53, 926–940. [Google Scholar] [CrossRef]
  12. Yang, J.; Yang, Y.; Li, J.; Li, H.; Yang, T. Analysis of noncommensurate sampling effects on the performance of PN code tracking loops. Sci. China Technol. Sci. 2018, 61, 893–905. [Google Scholar] [CrossRef]
  13. Yao, Z.; Lu, M.; Feng, Z. Unambiguous sine-phased binary offset carrier modulated signal acquisition technique. IEEE Trans. Wirel. Commun. 2010, 9, 577–580. [Google Scholar] [CrossRef]
  14. Yao, Z.; Cui, X.; Lu, M.; Feng, Z.; Yang, J. Pseudo-Correlation-Function-Based Unambiguous Tracking Technique for Sine-BOC Signals. IEEE Trans. Aerosp. Electron. Syst. 2010, 46, 1782–1796. [Google Scholar] [CrossRef]
  15. Hodgart, M.S.; Blunt, P.D. Dual estimate receiver of binary offset carrier modulated signals for global navigation satellite systems. Electron. Lett. 2007, 43, 877–878. [Google Scholar] [CrossRef] [Green Version]
  16. Yao, Z.; Gao, Y.; Lu, M. Generalized Theory of BOC Signal Unambiguous Tracking with Two Dimensional Loops. IEEE Trans. Aerosp. Electron. Syst. 2017, 53, 3056–3069. [Google Scholar] [CrossRef]
  17. Gao, Y.; Yao, Z.; Lu, M. Theoretical analysis of unambiguous 2-D tracking loop performance for band-limited BOC signals. GPS Solut. 2018, 22, 1–13. [Google Scholar] [CrossRef]
  18. Mileant, A.; Million, S.; Hinedi, S.; Cheng, U. The performance of the all-digital data transition tracking loop using nonlinear analysis. IEEE Trans. Commun. 1995, 43, 1202–1215. [Google Scholar] [CrossRef]
  19. Quirk, K.J.; Srinivasan, M. Analysis of sampling and quantization effects on the performance of PN code tracking loops. In Proceedings of the IEEE International Conference on Communications, New York, NY, USA, 28 April–2 May 2002; IEEE: Piscataway, NJ, USA; Volume 3, pp. 1480–1484. [Google Scholar] [CrossRef]
  20. Jin, X.; Zhang, C.; Jin, Z.; Jiang, J.; Yang, W. Pseudo-noise code regeneration based on noncommensurate sampling and dynamic clock phase shifting. Electron. Lett. 2010, 46, 1126–1127. [Google Scholar] [CrossRef]
  21. Tran, V.T.; Shivaramaiah, N.C.; Nguyen, T.D.; Glennon, E.P.; Dempster, A.G. GNSS receiver implementations to mitigate the effects of commensurate sampling frequencies on DLL code tracking. GPS Solut. 2018, 22, 22–24. [Google Scholar] [CrossRef]
  22. Jin, Z.; Zhang, C.; Xu, Z.; Jin, Z. Simple approach to determining parameters of noncommensurate sampling for optimal pseudo-noise code phase delay discrimination. Electron. Lett. 2014, 50, 283–284. [Google Scholar] [CrossRef]
  23. Xu, C.; Liu, Z.; Tang, X.; Wang, F. A Design Method of Code Correlation Reference Waveform in GNSS Based on Least-Squares Fitting. Sensors 2016, 16, 1194. [Google Scholar] [CrossRef]
  24. Chen, H.; Jia, W.; Ren, J.; Yao, M. Unambiguous S-curve shaping technique for multipath mitigation in cosine-boc signals. IEEE Commun. Lett. 2012, 16, 1725–1728. [Google Scholar] [CrossRef]
  25. Liu, Z.; Pang, J.; Liu, Y.; Wang, F. Double Strobe Technique for Unambiguous Tracking of TMBOC Modulated Signal in GPS. IEEE Signal Process. Lett. 2015, 22, 2204–2208. [Google Scholar] [CrossRef]
  26. Ma, C.; Tang, X.; Liu, Y.; Xiao, Z.; Sun, G. A method of carrier phase multipath mitigation based on punctual code reference waveform. In Proceedings of the China Satellite Navigation Conference, Haerbin, China, 23–25 May 2018; pp. 477–487. [Google Scholar] [CrossRef]
  27. Fernando, D.N.; Fernando, M.G.S.; Jose, M.N.L. Gating functions for multipath mitigation in GNSS BOC signals. IEEE Trans. Aaerosp. Electron. Syst. 2007, 43, 951–964. [Google Scholar] [CrossRef]
  28. Borio, D.; Fantino, M.; Lo, P.L. The Impact of the Galileo Signal in Space in the Acquisition System. Signals Commun. Technol. 2006, 47, 151–167. [Google Scholar] [CrossRef]
  29. Hein, G.W.; Avila-Rodriguez, J.A.; Wallner, S.; Pratt, A.R.; Owen, J.; Issler, J.L.; Betz, J.W.; Hegarty, C.J.; Lenahan, L.S.; Rushanan, J.J.; et al. MBOC: The new optimized spreading modulation recommended for GALILEO L1 OS and GPS L1C. In Proceedings of the ION Position, Location, and Navigation Symposium 2006, Coronado, CA, USA, 25–27 April 2006; pp. 883–892. [Google Scholar] [CrossRef]
  30. Xiao, W.; Liu, W.; Sun, G. Modernization milestone: BeiDou M2-S initial signal analysis. GPS Solut. 2016, 20, 125–133. [Google Scholar] [CrossRef]
  31. Betz, J.W.; Kolodziejski, K.R. Extended theory of Early-Late code tracking for a bandlimited GPS receiver. Navigation 2000, 47, 211–226. [Google Scholar] [CrossRef]
  32. Betz, J.W.; Kolodziejski, K.R. Generalized theory of code tracking with an early-late discriminator Part I: Lower bound and coherent processing. IEEE Trans. Aerosp. Electron. Syst. 2009, 45, 1538–1556. [Google Scholar] [CrossRef]
  33. Betz, J.W.; Kolodziejski, K.R. Generalized theory of code tracking with an early-late discriminator part II: Noncoherent processing and numerical results. IEEE Trans. Aerosp. Electron. Syst. 2009, 45, 1557–1564. [Google Scholar] [CrossRef]
Figure 1. Block diagram of binary offset subcarrier (BOC) signal receiving structure based on double estimation loop.
Applsci 09 03162 g001
Figure 2. Schematic diagram of resolution error and zero-bias of the digital discriminator of the BOCs (1, 1) signal.
Applsci 09 03162 g002
Figure 3. The zero-bias of BOCs (1, 1) signal under different initial phase.
Applsci 09 03162 g003
Figure 4. The variation curve of the zero deviation of the BOCs (1, 1) signal with the initial phase and code phase estimation deviation of the signal. (a) Three-dimensional view; (b) Two-dimensional view.
Applsci 09 03162 g004
Figure 5. Schematic diagram of time domain sampling of local reference signals and equivalent reference waveforms.
Applsci 09 03162 g005
Figure 6. Standard deviation of zero-bias of BOCs (1, 1) signal corresponding to different correlation intervals ( F s = 11.251 MHz, F c = 1.023 MHz, F s c = 2.046 MHz, 2 d 0 s c = 0.25 chip, T c o h = 1 ms).
Applsci 09 03162 g006
Figure 7. Standard deviation of the zero-bias of the BOCs (1, 1) signal corresponding to different sampling frequencies ( F c = 1.023 MHz, F s c = 2.046 MHz, 2 d 0 c = 1 chip, 2 d 0 s c = 0.25 chip, T c o h = 1 ms).
Applsci 09 03162 g007
Figure 8. Resolution comparison of digital discriminators for BOCs (1, 1) signals under different bandwidth conditions ( F s = 11.251 MHz, F c = 1.023 MHz, F s c = 2.046 MHz, 2 d 0 c = 1 chip, 2 d 0 s c = 0.25 chip, T c o h = 1 ms).
Applsci 09 03162 g008
Figure 9. Zero-bias of digital code phase discriminator for BOCs (1, 1) signals at different bandwidths ( F c = 1.023 MHz, F s c = 2.046 MHz, 2 d 0 c = 1 chip, 2 d 0 s c = 0.25 chip, T c o h = 1 ms).
Applsci 09 03162 g009
Figure 10. The phase resolution of the digital code discriminator of the BOCs (1, 1) signal varies with the Doppler frequency ( F s = 10 MHz, F c = 1.023 MHz, F s c = 2.046 MHz, 2 d 0 c = 1 chip, 2 d 0 s c = 0.25 chip, T c o h = 1 ms).
Applsci 09 03162 g010
Figure 11. The zero-bias curve of the digital code phase discriminator of the BOCs (1, 1) signal with the code Doppler frequency ( F c = 1.023 MHz, 2 d 0 c = 1 chip, T c o h = 1 ms).
Applsci 09 03162 g011
Figure 12. Zero-bias and thermal noise error of BOCs (1, 1) signal ( F c = 1.023 MHz, F s c = 2.046 MHz, 2 d 0 c = 1 chip, 2 d 0 s c = 0.25 chip, T c o h = 1 ms). (a) Long period code. (b) Short period code.
Applsci 09 03162 g012
Table 1. Frequently used notations.
NotationDefinition
s ( t ) Baseband signal
c ( t ) Code signal
s c ( t ) Subcarrier signal
w ( t ) Rectangular reference signal
p ( t ) Composite signal
τ 0 c , τ 1 c , τ 2 c Initial code phase
τ 0 s c , τ 1 s c , τ 2 s c Initial subcarrier phase
τ ^ 0 c , τ ^ 0 s c Phase estimation
T s , T c , T s c , T c o h Sampling period, chip period and subcarrier period, coherent integration time
F s , F c , F s c , F 0 , F ˜ s Sampling frequency, code rate, subcarrier rate, reference frequency, noncommensurate sampling frequency
k , k s , k c , k s c , k ˜ s Frequency coefficient
2 d 0 c , 2 d 0 s c Early-late correlation interval of the phase discriminator
R c , R E c , R L c Correlation values corresponding to different code phases
R s c , R E s c , R L s c Correlation values corresponding to different subcarrier phases
D c , D s c Phase discrimination results
P c , P s c Phase resolution
S , S c , S s c Zeros-bias of disrimination
c ¯ s Average number of samples of the composite waveform
N s , N p , N ˜ p Number of coherent integration points of the correlator, number of composite waveforms, number of non-zero composite waveforms
l c m ( ) Least common multiple operation
r o u n d ( ) Rounding operation
MAX ( S c ) The maximum deviation of zero-bias
STD ( S c ) The standard deviation of zero-bias

