Article

A Model for Evaluating the Performance of the Bearing Manufacturing Process

1
Department of Industrial Engineering and Management, National Chin-Yi University of Technology, Taichung 41170, Taiwan
2
Institute of Innovation and Circular Economy, Asia University, Taichung 41354, Taiwan
3
Counseling Center, National Chin-Yi University of Technology, Taichung 41170, Taiwan
4
Department of Finance, National Taichung University of Science and Technology, Taichung 40401, Taiwan
5
Department of Finance, Chaoyang University of Technology, Taichung 41349, Taiwan
*
Authors to whom correspondence should be addressed.
Appl. Sci. 2019, 9(15), 3105; https://doi.org/10.3390/app9153105
Submission received: 4 July 2019 / Revised: 26 July 2019 / Accepted: 27 July 2019 / Published: 31 July 2019

Abstract

:
Reliability and product process quality are essential in meeting market demand and enhancing competitiveness in the machine tool industry. In addition, manufacturing time performance is also one of the important indices. Therefore, this paper focuses on process quality and manufacturing time and defines a manufacturing time performance index to feedback the acceptance rate of the manufacturing time. The process performance evaluation chart delineated the observations of variations in various workstations, and, hence, in controlling the stability of the work process. The Six Sigma quality indices are constructed by the process accuracy indices and precision indices are represented by X-axis and Y-axis respectively. The process quality evaluation chart evaluates the level of the process quality, as well as proposes the direction of improvement. The manufacturing time performance—Z-axis is used to assess whether the manufacturing time performance meets the requirements. The process performance evaluation chart constructed by this paper makes it easier for researchers to observe which workstations have a process variation in the process, to control the stability of the process effectively, to provide the improvement reference for staff on the scene and to enhance the competitiveness of the industry.

1. Introduction

The machine tool industry is the foundation of all manufacturing industries and mainly produces components for various types of machining platforms and processing equipment. Machine tools play a pivotal role in the development of the entire machine industry and thus are known as the “mother of all machines”. The development of the machine tool industry in a country is strongly correlated with its economic system as machine tools are a major foundation for the nation’s economic development and demonstrate national competitiveness. Numerous industries must rely on machine tools to achieve production value. Taiwan is the seventh-largest machine tool producer and fourth-largest machine tool exporter in the world. Japan and Germany have enacted policies to depreciate their currency, and China has experienced rapid and considerable technological development. Consequently, Taiwan’s advantage in the export of machine tools has been declining. To satisfy market demands and improve the competitiveness of the industry, improving the quality and manufacturing process of machine tools and mitigating the effects of international competition are necessary steps to take.
Machines tools are composed of numerous components. Bearings are a critical part of such components, and they mainly function to hold moving parts in a machine. The use of bearings can reduce friction loss in shafts and other machine elements. Bearings also guide and limit the movement of other machine elements, support the rotational or linear motion of moving parts, and effectively increase transmission efficiency. As such, bearings are critical to the smooth operation of a machine. When a bearing is excessively misaligned, its shaft may experience unnecessary resistance and friction, affecting product quality and machine service life. Therefore, bearing connectors must be used to assist bearings to maintain shaft alignment and control shaft movement. Bearing connectors can be separated into three categories according to structure and function; these categories are rigid coupling, flexible coupling, and fluid coupling. The main function of bearing connectors is to connect two shafts so that the rotational movement and torque of one shaft can be transmitted to the other. Bearing connectors also tolerate and compensate for the misalignment between two rotating shafts, allowing them to pass on the momentum created in their rotating motion. Therefore, the quality of bearing connectors not only affects bearing rotation but also affects the operation of machine tools indirectly.
In today’s industrial environment with intense international and global competition, assisting businesses to effectively evaluate the performance of bearing connector production and determine if it meets the standards of customer demands is an urgent issue. Therefore, this study targeted rigid couplings, as depicted in Figure 1, and endeavored to develop an evaluation model for examining the performance of bearing connector production. The objective was to create a reference for improving and enhancing the performance of the manufacturing process of bearing connectors.
This study cooperated with a case company and used the rigid coupling provided by the case company as an example. The aim was to propose improvements for key qualities and characteristics of the product. Chen et al. [1] argued that the manufacturing time is a major indicator of manufacturing performance. An overly short manufacturing time can affect quality, and an overly lengthy manufacturing time may affect corporate performance. On the basis of this premise, we proposed a manufacturing time performance index that can reflect the approval rate of manufacturing time. The Six Sigma quality index can present the relationship between manufacturing performance and product specifications in a numerical manner. The index is commonly used to evaluate whether manufacturing quality has reached the level of customer demand [2,3,4,5]. However, in 1986, Motorola proposed the Six Sigma quality management model, which is a method for process improvement. The model can be used to continually improve the manufacturing process, effectively reducing defect rate and improving product quality. To increase the reliability and overall product quality of machine tools, the quality of the manufacturing process of all machine components must be improved [6,7,8,9,10]. Although the aforementioned study could determine the range of manufacturing process quality, it could not precisely quantify manufacturing process quality. To enable quality control personnel to determine manufacturing capacity more easily, Chen et al. [8] proposed applying the Six Sigma quality index, which can be used to directly judge the quality of products of the manufacturing process. Specifically, the index can precisely reflect the quality level of the product’s quality characteristics. This facilitates the implementation of manufacturing process analysis and improvements by quality control personnel. Based on Chen et al. [11], this paper adapts their proposition of Six Sigma Quality Indices (SSQIs) containing LTB, STB, and NTB and uses it as the evaluation tool. By virtue of this, quality control personnel can implement their manufacturing process analysis and improvement with relative ease. Many studies point out these three indices all have one-to-one mathematical relation with process yield and can directly reflect the process yield; simultaneously, they can directly reflect SSQIs quality [12,13,14,15,16].
Chen et al. [1] pointed out that manufacturing time is also one of the important indices for the evaluation of manufacturing process performance besides the examination of quality. Based on this point, this paper combines SSQIs with manufacturing time performance index, establishing a manufacturing process performance evaluation chart for bearing connectors so to provide the staff with a reference for improvement, and thereby improve competitiveness. There are several advantages to the manufacturing process performance evaluation chart used in this paper:
  • It can simultaneously evaluate product process quality performance with multiple quality characteristics so as to make the real-time staff supervise the manufacturing process quality or submit improvement measures when the quality is below standard.
  • It provides simultaneous supervision of manufacturing time performance, offering the quality control staff the best timing for manufacturing.
The framework of this study is as follows: Section 1 is the introduction. Section 2 introduces the process and three crucial qualities and associated tolerances of bearing connectors. Section 3 defines and evaluates manufacturing process quality and manufacturing time performance evaluation indices. Additionally, the method for judging whether product quality has been satisfactory is explained in the Section. Section 4 describes the sampling that was conducted on the three crucial quality characteristics of bearing connectors. Additionally, outcomes of calculation were integrated into the manufacturing process quality and time performance evaluation model with the aim to provide improvement direction for quality characteristics that failed to reach the standard level. Finally, Section 5 summarizes the research outcomes to provide reference information for the industry and future research directions.

2. Case Introduction

This study used bearing connectors processed by a small-scale machinery factory in central Taiwan for a case study. The company’s standard operation process was subjected to situation analysis. The case company first purchases raw materials and examines whether the materials meet its quality requirements. Before conducting the numerous processes, parameter setting for the machine tools involved is conducted. Additionally, the selection of cutters is also of great importance. Subsequently, the manufacturing process can be conducted, and a measuring instrument can be used to examine whether the products are within the acceptable tolerance range following the manufacturing process. Products can be packaged and shipped if they pass the inspection. The manufacturing process for the bearing connector is introduced in the following, and the flow chart of the manufacturing process is depicted in Figure 2.
Explanation of the entire manufacturing process is as follows:
  • Raw material procurement and inspection: The material is stainless steel, and it is examined for rust or defects.
  • Parameter setting: According to product characteristics, suitable cutters and rotation speeds are selected. Subsequently, CNC program codes are entered to control the automatic manufacturing process of machine tools.
  • External diameter cutting: A lathe is used to conduct processing, with a rotation speed of 3000 rpm. During heavy cutting, the cutters can wear out easily. To ensure processing quality, cutters are given individual codes for easier monitoring of processing time and cutter condition.
  • Internal diameter cutting: The lathe is set at 1500 rpm, and the processing time of cutting the internal diameter of a workpiece to the required tolerance is approximately five minutes.
  • Thread carving: The lathe’s rotation speed is set at 2000 rpm and the feeding rate is 20 threads per minute. A cycle involves moving a milling cutter precisely and steadily around the circumference of a workpiece in relative rotation. The grooves that are formed initially guide the forward movement of the milling cutter.
  • Finished product inspection: Examine whether the external diameter, internal diameter, and threads of the product have become deformed due to the cutting. Additionally, whether the product meets the specifications is examined. Products that fail to meet the specifications are eliminated to ensure product quality.
  • Packaging and shipping: protective measures are implemented on products to avoid rusting or friction-induced damage, and products can be shipped after packaging.
These steps indicate that bearing connectors are associated with three quality characteristics, namely the internal diameter, external diameter, and threads. These are the key quality items that manufacturers must examine after the whole manufacturing process is completed. Therefore, this study first focused on these crucial nominal-the-best quality characteristics and provided evaluation indices corresponding to manufacturing process quality and time. As mentioned previously, the study of Chen et al. [17] was referenced for the manufacturing time performance index, and the Six Sigma quality indices proposed by Chen et al. [8] were used for quality evaluation. Additionally, an evaluation model concerning both manufacturing time performance and process quality was constructed for the manufacturing process of bearing connectors. The objective was to improve the manufacturing process quality and manufacturing time performance of bearing connectors.
A detailed explanation regarding the processing of bearing connectors has been provided in the previous section. Bearing connectors are key components that affect the stability of machine tools, and their process quality directly affects the operational quality of the bearing, which in turn affects the quality of machine tools. We compiled the three critical quality characteristics of the bearing connector and list them in Table 1. Figure 3 depicts a bearing connector and its three pivotal process quality characteristics. The first process quality characteristic, marked as A, is external diameter, with a tolerance of 19 ± 0.04 . The second process quality characteristic is internal diameter, marked as B, with a tolerance of 10 + 0.01 + 0.03 . The third process quality characteristic is threaded, marked as C, with a tolerance of 8.125 ± 0.1.

3. Defining the Evaluation Indices of Manufacturing Process Quality and Manufacturing Time Performance

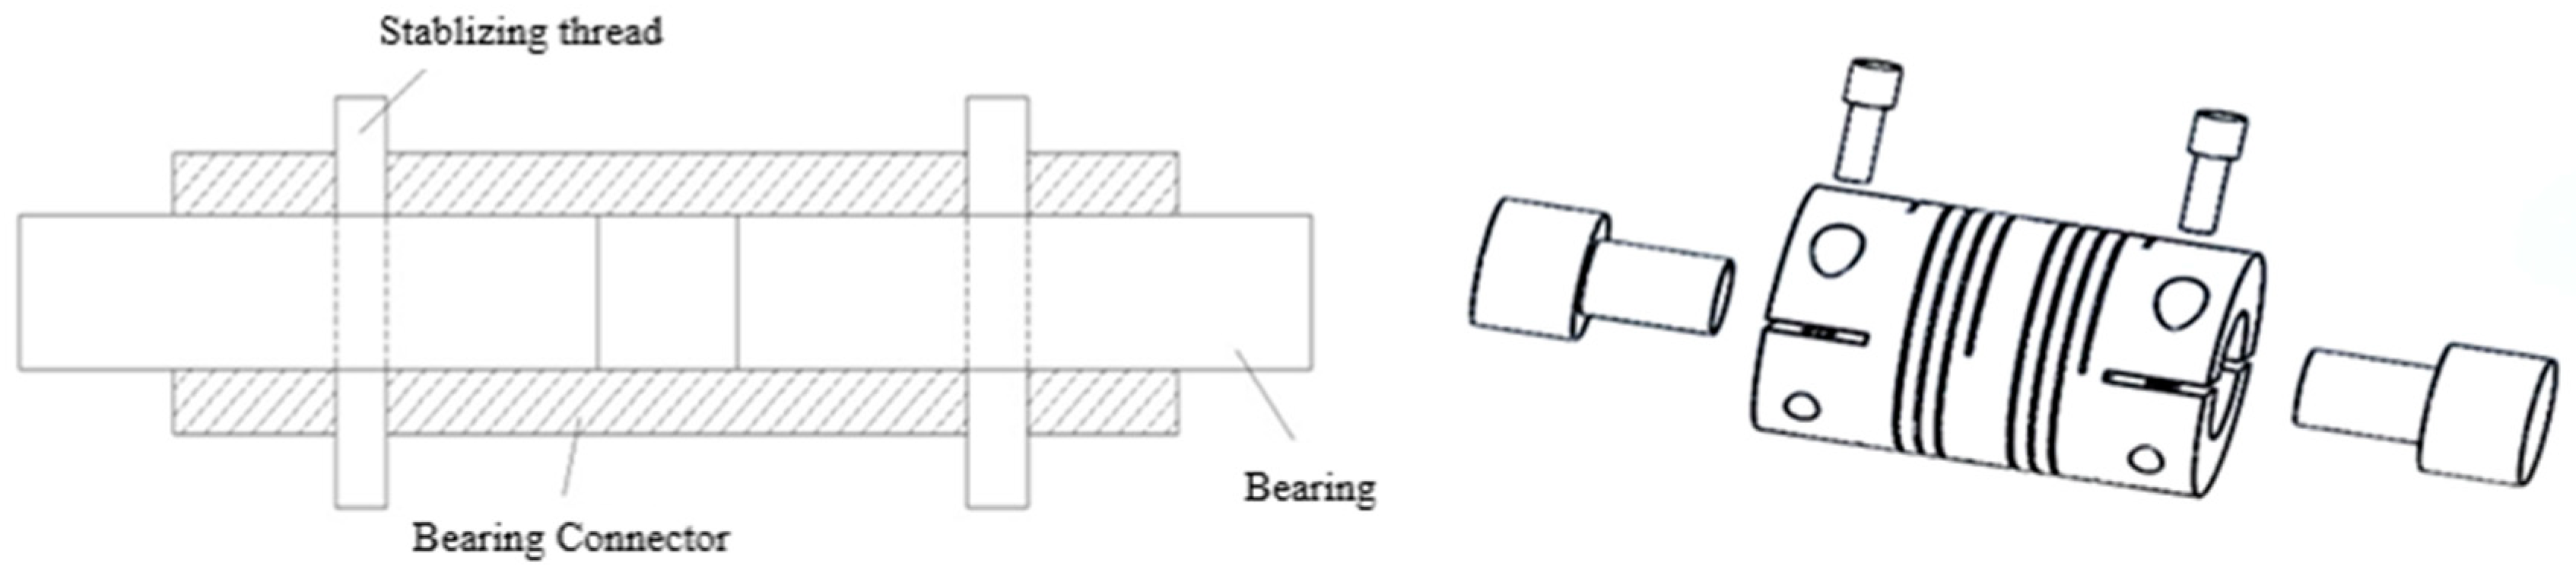
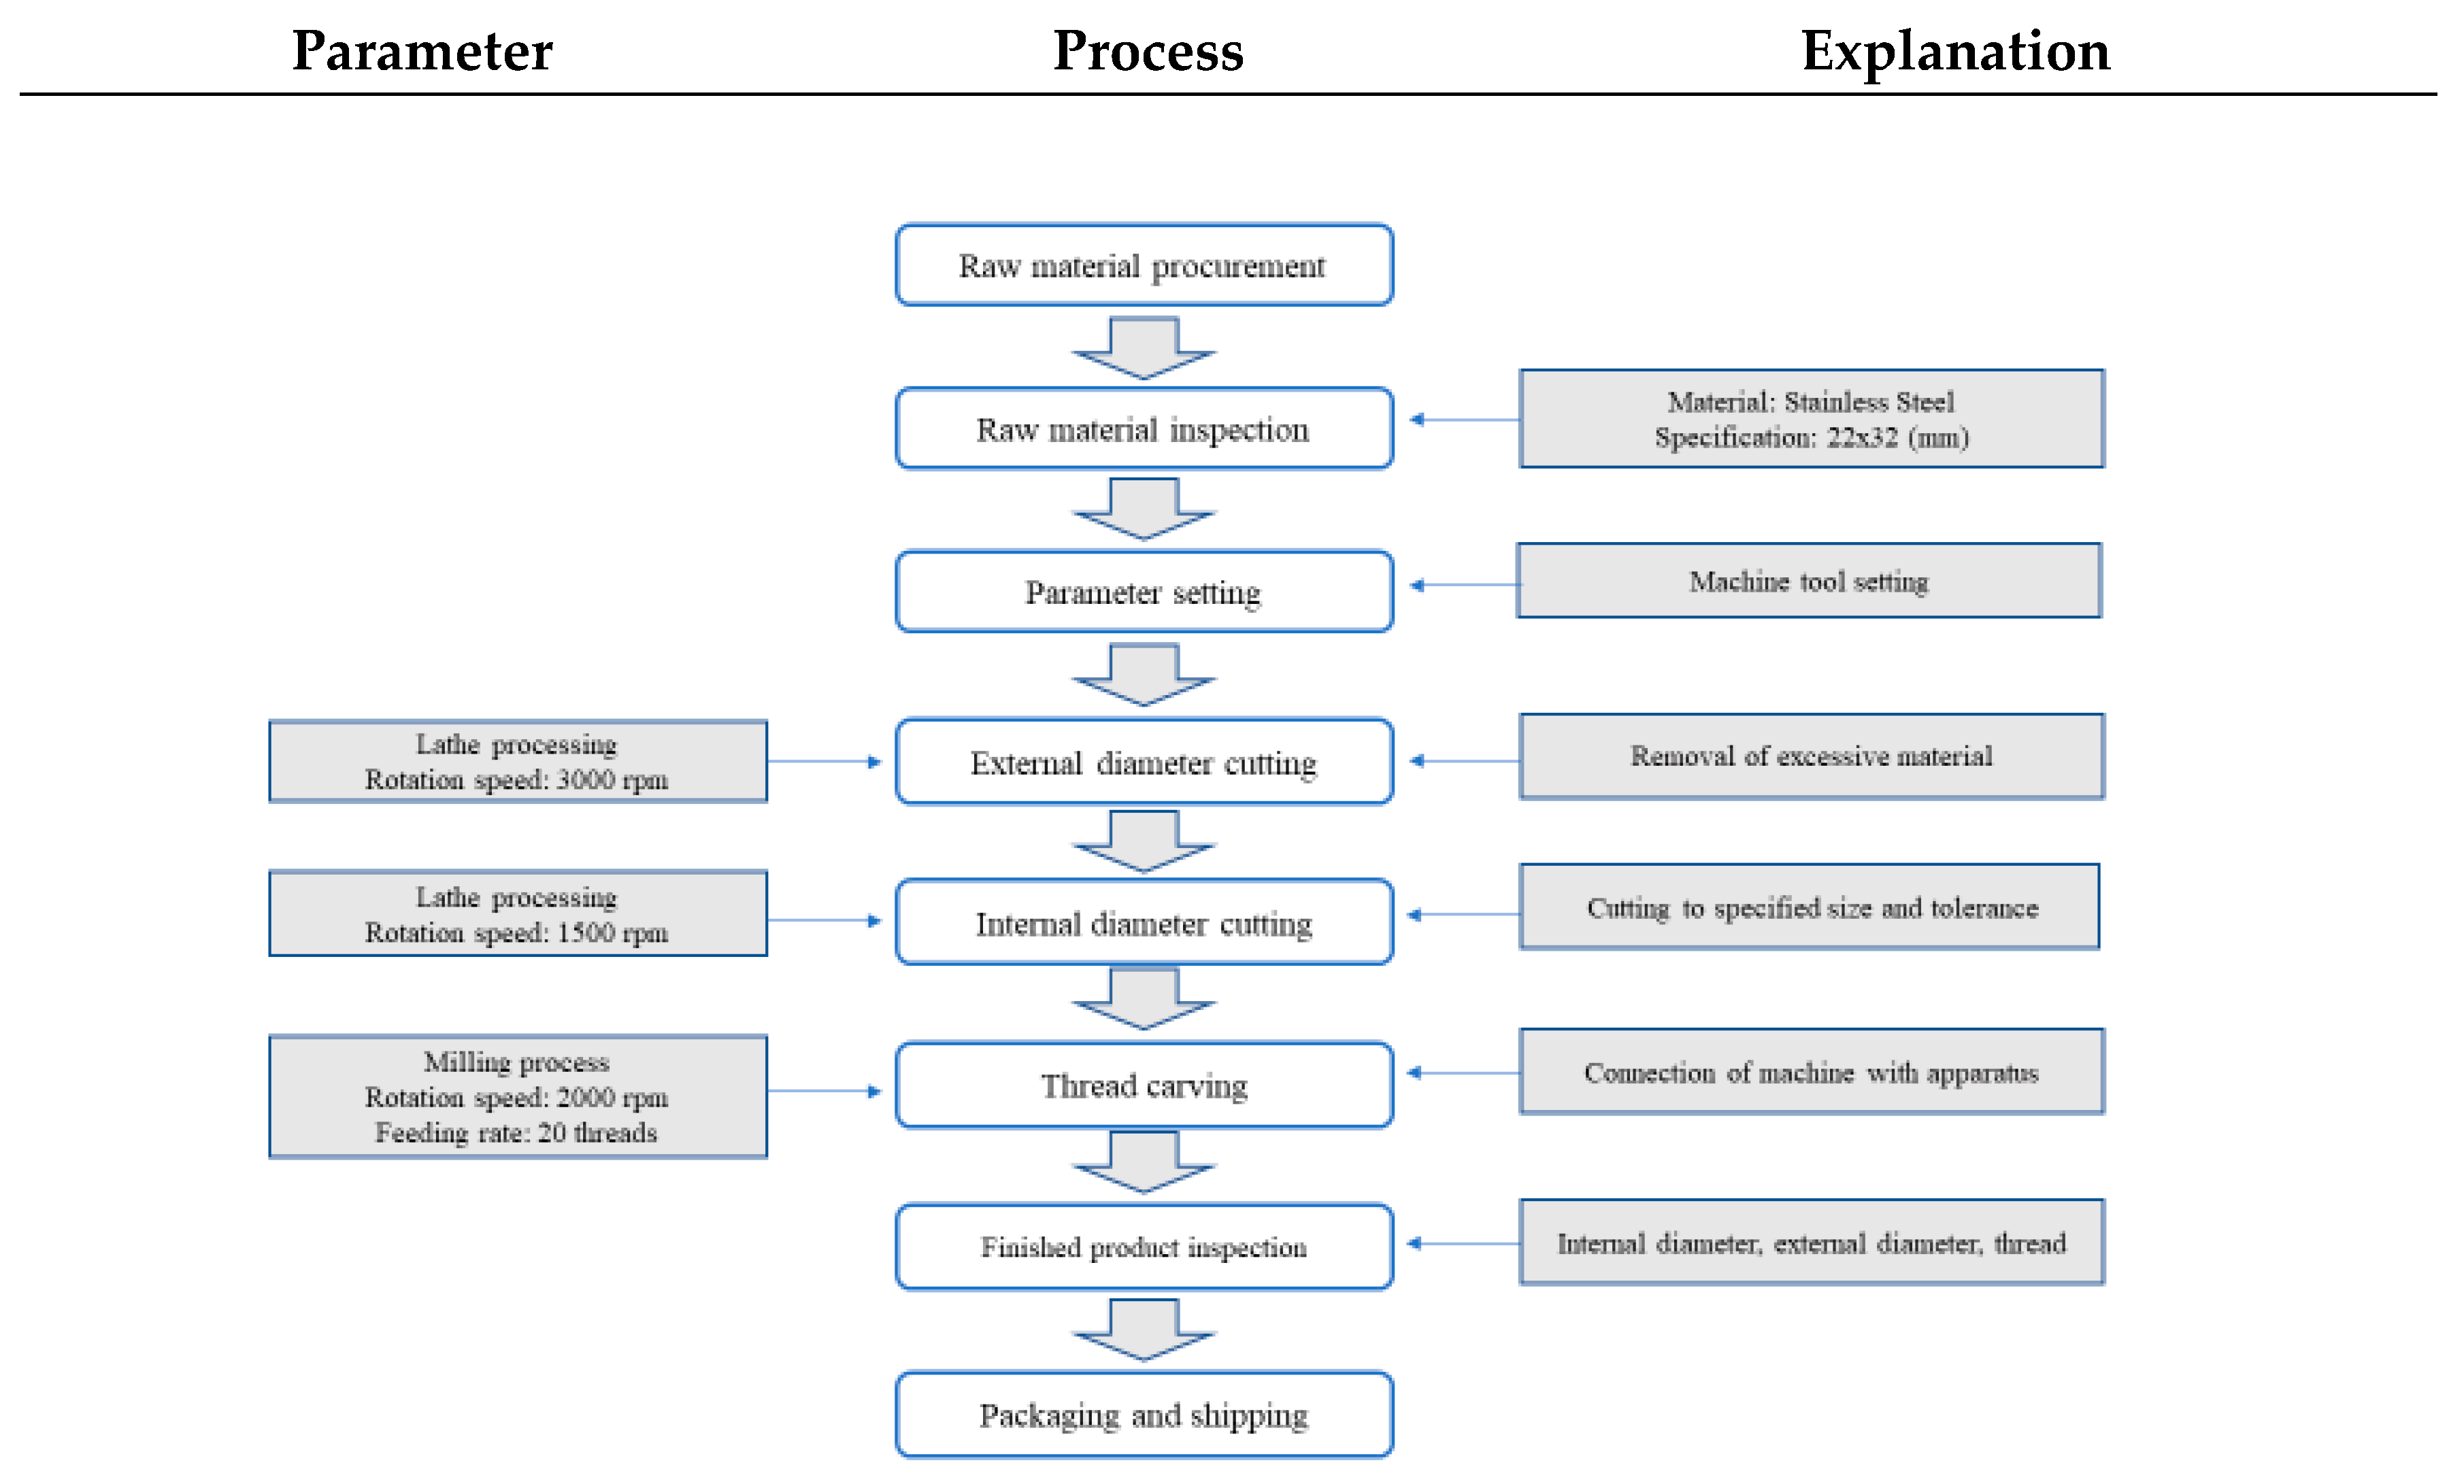
The manufacturing process of the bearing connector has been introduced in the previous section. The quality of processing affects the smooth operation of the entire bearing connector. The manufacturing process of the bearing connector includes numerous procedures, and the rotation speed and feeding rate of each procedural step affect the manufacturing time of workpieces. Therefore, this study constructed an evaluation model that considers both manufacturing process quality and manufacturing time performance. For manufacturing process quality, the Six Sigma quality indices were used, and for manufacturing time, the manufacturing time performance evaluation index was used. Section 3.1 describes the use of the Six Sigma quality indices as the measuring tool of the three key quality characteristics; additionally, the procedures for manufacturing process control and sampling inspection are explained. In Section 3.2, the performance of the manufacturing time is discussed and the approval standard of products is defined. Subsequently, an evaluation model is developed according to the two aforementioned indices and is used to judge whether the manufacturing process meets the approved standard.

3.1. Manufacturing Process Quality Evaluation Index

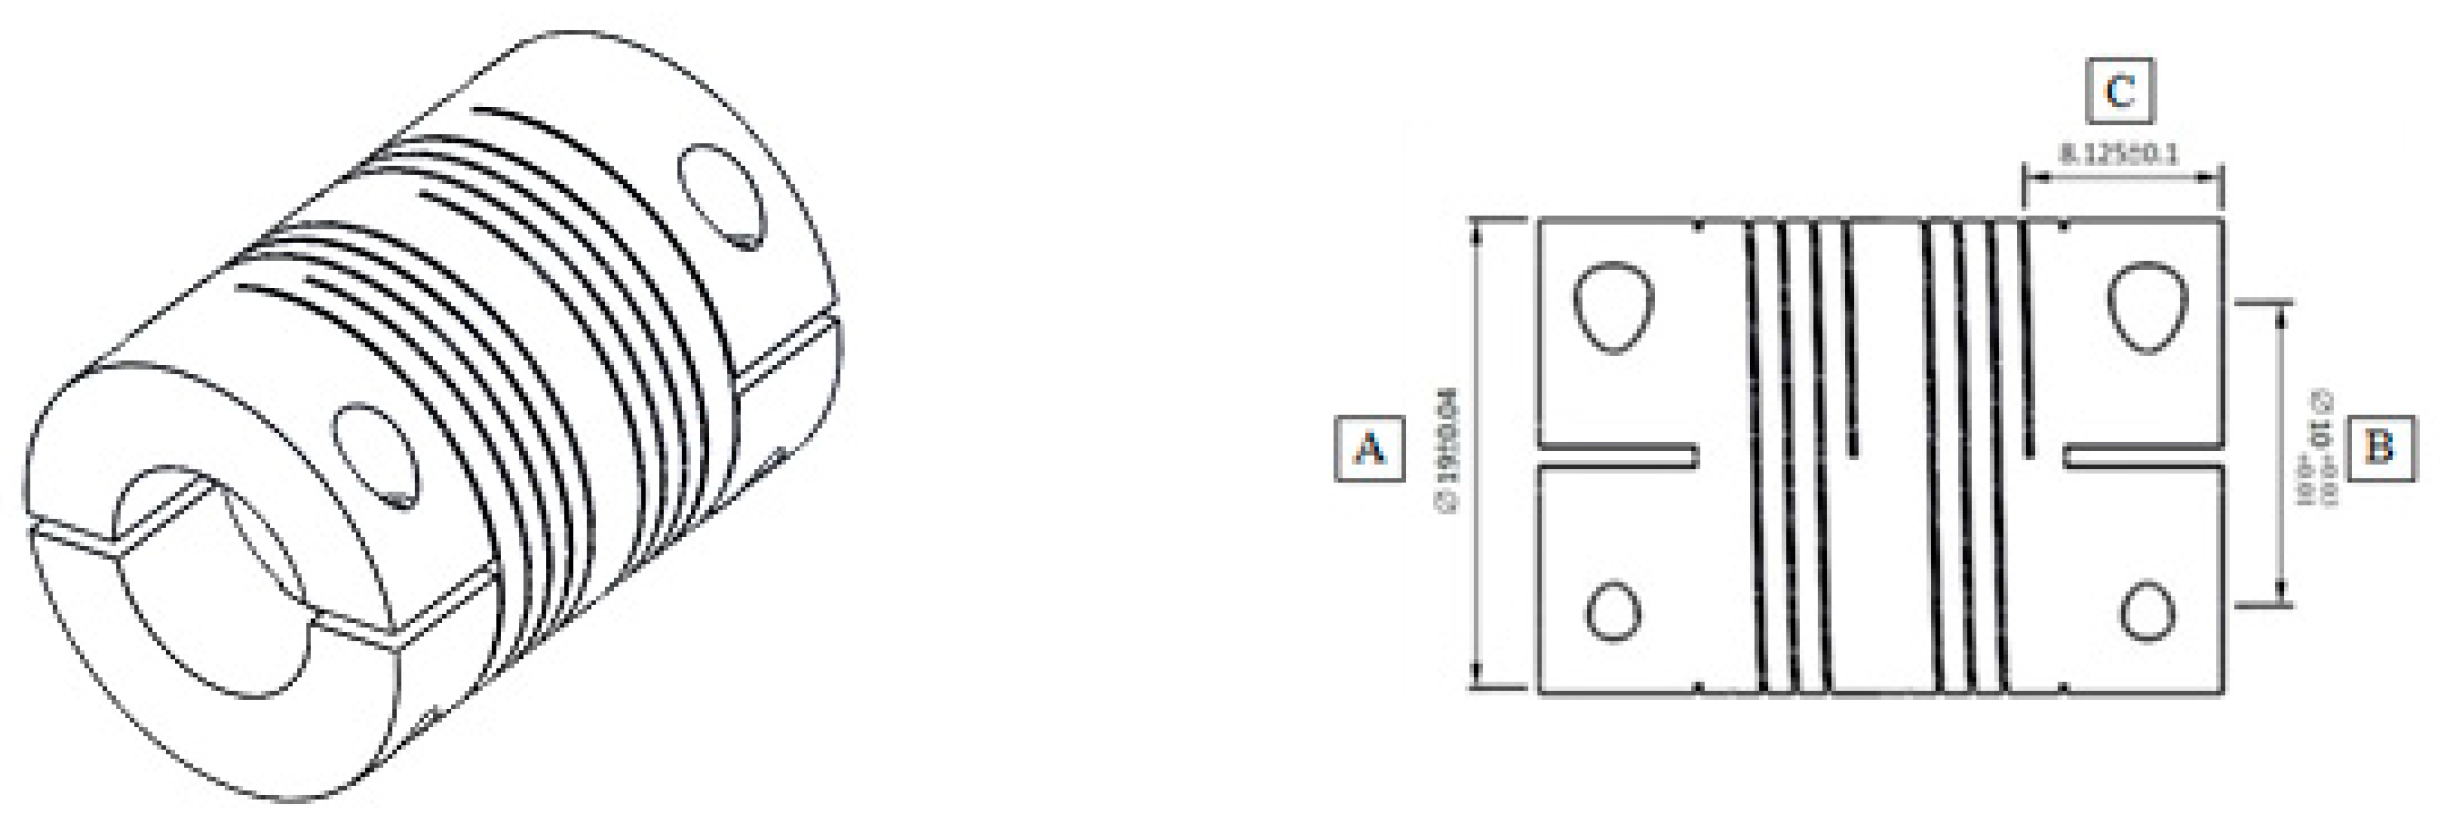
External diameter, internal diameter, and threads were used as important references. Using variables to convert important process quality characteristics, they were subsequently standardized to determine the manufacturing process quality of bearing connectors. If a random variable X h is hypothesized to indicate the distribution of the manufacturing process of external diameter ( h = 1 ), internal diameter ( h = 2 ), and threads ( h = 3 ), respectively, accuracy index δ and precision index γ are first defined as follows:
δ = μ T d   , γ = σ d
where δ is used to judge the mean deviation of the process from the target value, γ is used to determine the degree of process variation, and d represents the tolerance of process quality characteristics. When the process quality level of the product reaches k σ , δ and γ can be represented as follows:
| δ | = | μ T | d 1.5 k
γ = σ d = 1 k
Apparently, the SSQIs proposed by Chen et at. [11] can be seen as the function of accuracy index and precision index; therefore, they can adequately display the causes of poor process quality (i.e., insufficient accuracy or insufficient precision) to determine the factors of process performance. Based on this, the indices can be re-defined as the following:
Q p u h = 1 δ h γ h + 1.5
Q p l h = 1 + δ h γ h + 1.5
Q p k h = min ( Q p u h , Q p l h ) = ( 1 δ h γ h + 1.5 ,   1 + δ h γ h + 1.5 )
Many studies indicate that if a product has multiple quality characteristics, the product can satisfy customers and be viewed as a good product only when all quality characteristics of the process quality meet the required quality level [15,16,18,19,20,21,22]. According to Huang et al. [10], the required quality level of quality characteristics is k σ and the required quality level of bearing connector is k σ . That is, the quality level of the manufacturing process concerning all process quality characteristics must be increased to ensure the reliability and overall production process quality of bearing connectors. If any of a product’s process quality characteristics fail to meet the specifications, the product is regarded as defective. Under the hypothesis that the manufacturing process quality has a normal distribution, this study defined index events to explain the corresponding yield rate as the following:
E h : Event of quality characteristic h meeting the specifications: P ( E h ) p h = 2 Φ ( Q p k h 1.5 ) 1
E h c : Event of quality characteristic h not meeting the specifications: P ( E h C ) 1 P h 2 × [ 1 Φ ( Q p k h 1.5 ) ] .
The relationship between bearing connectors’ crucial quality characteristics and yield rate P T can be represented by the following:
P ( h = 1 3 E h C ) h = 1 3 P ( E h C ) 6 × [ 1 Φ ( k 1.5 ) ]
P T = P ( h = 1 3 E h ) = 1 P ( E h C ) 1 6 [ 1 Φ ( k 1.5 ) ]
If the required manufacturing quality level of bearing connectors reaches k σ , the bearing’s yield rate P T should satisfy P T Φ ( k 1.5 ) + Φ ( k + 1.5 ) 1 ; that is, p T p ( k ) . Only at this point, can the product be called a qualified product, and its quality characteristics must all be above k σ . Next, the corresponding k value when the quality level reaches k σ is determined:
Φ ( k 1.5 ) + Φ ( k + 1.5 ) 1 = 1 6 [ 1 Φ ( k 1.5 ) ]
k = Φ 1 1 1 6 { 2 [ Φ ( k 1.5 ) + Φ ( k + 1.5 ) ] } + 1.5
Montgomery [23] suggested that normal manufacturing process quality uses control charts to conduct quality control. Therefore, this study used the X ¯ S control chart to conduct the evaluation and analysis of manufacturing capacity. First, sampling was conducted on the three crucial quality characteristics of the bearing connectors. A sample size of n was collected each time, and a total of m groups of samples were collected. The collected samples were organized as shown in Table 2 and are subject to the following equations:
X ¯ h i = 1 n i = 1 n X h i ,   S h i 2 = 1 n 1 i = 1 n ( X h i X ¯ h , i ) 2 ,   N = i = 1 n m = n × m
On the basis of the sampling statistical data in Table 2, δ h and γ h were estimated according to the following:
δ ^ h = μ ^ h T ^ h d h   ,   μ ^ h = X ¯ ¯ h = 1 m i = 1 m X ¯ h , i
γ ^ h = σ ^ h d h ,    σ ^ h = S ¯ h 2 = 1 m i = 1 m S h , i 2
In this case, the Six Sigma quality index estimator can be represented as follows:
Q ^ p k h = { Q ^ p u h , Q ^ p l h }
where
Q ^ p u h = 1 δ ^ h γ ^ h + 1.5
Q ^ p l h = 1 + δ ^ h γ ^ h + 1.5
According to Boole’s inequality, the ( 1 α ) × 100 % confidence regions of δ and γ can be derived as follows:
δ : P { δ ^ h γ ^ h N t a 4 ( N 1 ) < δ < δ ^ h + γ ^ h N t a 4 ( N 1 ) }
γ : P { ( N m ) γ ^ h 2 χ a 4 ( N m ) 2 < γ < ( N m ) γ ^ h 2 χ 1 a 4 ( N m ) 2 }
The set S is defined as the joint ( 1 α ) × 100 % confidence interval of δ and γ , thus S 
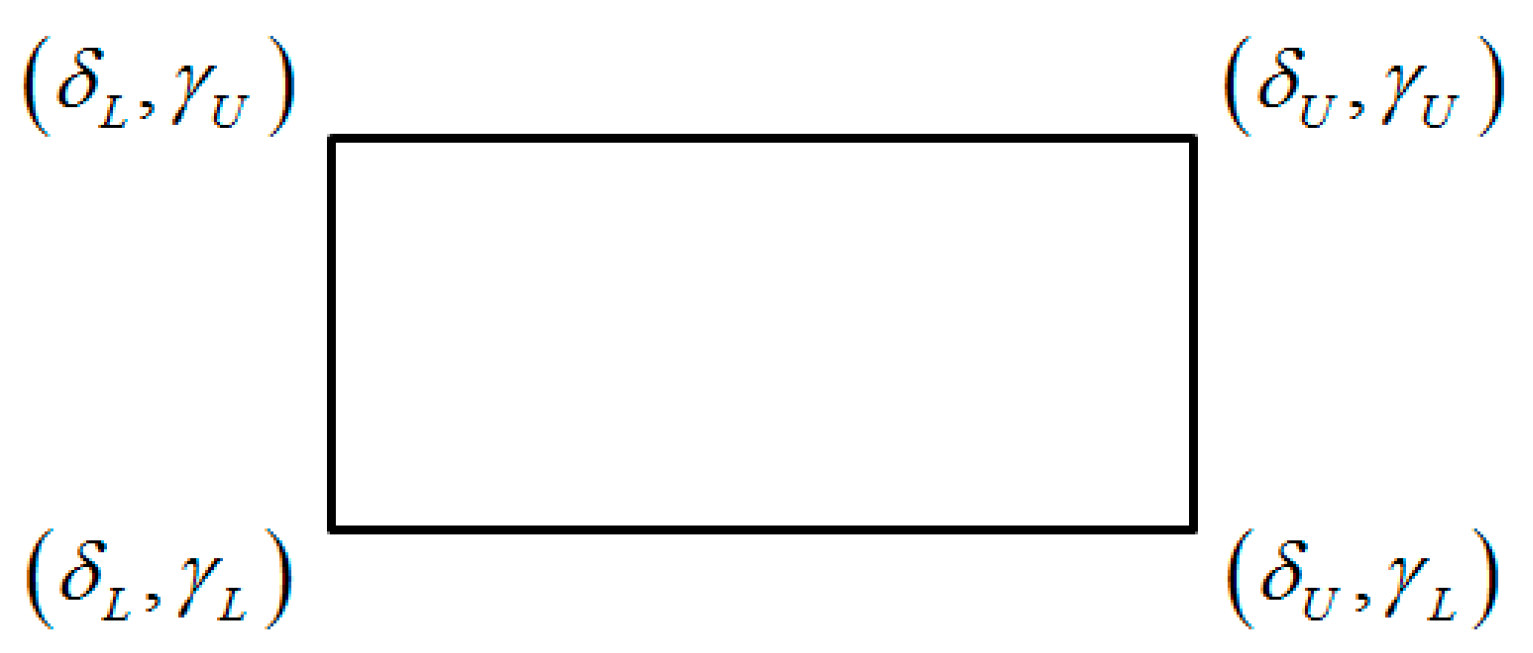
can be expressed as follows:
S = [ δ U , δ L ] × [ γ U , γ L ]
where δ L : δ ^ h γ ^ h N t a 4 ( N 1 ) , δ U : δ ^ h + γ ^ h N t a 4 ( N 1 )
γ L : ( N m ) γ ^ h 2 χ a 4 2 ( N m ) ,   γ U : ( N m ) γ ^ h 2 χ 1 a 4 2 ( N m )
Subsequently, the aforementioned δ and γ can be used to construct a square-shaped joint confidence interval, as depicted in Figure 4:

3.2. Performance Evaluation Index of Manufacturing Time Performance

According to Chen et al. [17], process quality performance and manufacturing time performance are two pivotal indices for evaluating manufacturing process quality. Therefore, we set and created a manufacturing time performance index according to the concept proposed by Chen et al. [17]. We hypothesized that manufacturing time performance is T , the conforming mean is μ T , and the variance is the normal distribution of σ T 2 ; that is, T ~ N ( μ T , σ T 2 ) . To account for both manufacturing process quality performance and manufacturing time performance, a manufacturer usually sets the upper limit of the manufacturing time performance as U T and the lower limit of the manufacturing time performance as L T . Consequently, if the chance of exceeding the upper limit of manufacturing time performance is P u and the chance of exceeding the lower limit of manufacturing time performance is P l , the disapproval rate of manufacturing time performance can be described by the following:
P u = P ( T > U T ) = P ( Z > U T μ T σ T ) = 1 Φ   ( U T μ T σ T ) = 1 Φ ( Z U )
P l = P ( T < L T ) = P ( Z > L T μ T σ T ) = 1 Φ ( μ T L T σ T ) = 1 Φ ( Z L )
Subsequently, we directly used the approval rate of manufacturing time ( I M T ) as the performance index of manufacturing time, and the equation is as follows:
I M T = Φ ( Z U ) + Φ ( Z L ) 1
Combining P u and P l , the range of the approval rate of manufacturing time performance ( I M T ) becomes 0   I MT 1 . The disapproval rate of manufacturing time performance ( J M T ) is defined as the following:
J M T = 1 I M T = P u + P l = 2 [ Φ ( Z U ) + Φ ( Z L ) ]
when I M T I 0 , J M T J 0 and J 0 = 1 I 0 .
Per the description of sampling in Section 3.2, statistical process control was conducted on manufacturing time. The statistical data of the sample J M T i were used, yielding the following:
J ¯ M T = 1 n i = 1 n J M T i ,   S J M T 2 = 1 n 1 i = 1 n ( J M T i J ¯ M T ) 2
where J ¯ M T is the sample mean, and S J M T is the sample standard deviation. Therefore, the estimator of index J M T is as follows:
J ^ M T = 2 [ Φ ( Z ^ U ) + Φ ( Z ^ L ) ]

3.3. Construction of Evaluation Model of Manufacturing Process Quality and Manufacturing Time Performance

Chen et al. [24] and Pearn et al. [25] suggested that a product usually has several quality characteristics. Only when all quality characteristics meet the required level can the product be regarded as satisfactory. The manufacturing process performance evaluation chart proposed by Chen et al. [11] can be used to simultaneously evaluate nominal-the-best, the-larger-the-better, and the-smaller-the-better quality characteristics. δ is used as the x-coordinate and γ is used as the y-coordinate to analyze whether the accuracy and precision of process quality characteristics meet the required level. Accordingly, process quality characteristics with poor performance are improved. The X -axis and Y -axis are first defined according to the following:
X   a x i s : | δ | 1.5 k
Y   a x i s : γ = 1 k
A conversion table of the manufacturing process quality index Q p k h and the k s i g m a quality level can be developed using Equation (3). For example, when the quality level of the manufacturing process reaches 3 σ , Q p k h ( 3 ) = 3.785 and the yield rate is 93.31894%. When the quality level of the manufacturing process reaches 4 σ , Q p k h ( 4 ) = 4.580 and the yield rate is 99.37903%. When the quality level of the manufacturing process reaches 5 σ , Q p k h ( 5 ) = 5.451 and the yield rate is 99.97674%, and when the quality level of the manufacturing process reaches, Q p k h ( 6 ) = 6.367 and the yield rate is 99.99966%. The results are shown in Table 3.
When the process quality level is k σ , the corresponding yield rate and k value can be found in Table 3; they can be used to draw a manufacturing process performance evaluation chart, as shown in Figure 5.
When δ and γ are close to the origin, it indicates they have higher accuracy and precision. Conversely, when δ and γ deviate from the origin, the manufacturing process has low accuracy and precision. The set S can be used to determine the upper limit and lower limit of the confidence level of the manufacturing process quality. Finally, according to the aforementioned results, accuracy is used as the X -axis and precision are used as the Y -axis to construct a manufacturing process performance evaluation chart. This diagram can be used to evaluate whether the manufacturing process quality level of each process quality characteristic meets the requirement. Concurrently, the manufacturing process quality improvement direction is provided for process quality characteristics that do not meet the requirement. The performance index of manufacturing time is subsequently used as the Z -axis. When the manufacturing time performance exceeds the model, the manufacturing time performance must be improved. This is used to evaluate whether the performance of manufacturing time meets the approval standards. The aforementioned method can be used to determine the manufacturing process capacity of each process quality characteristic, and underperforming process quality characteristics can also be identified and improved.

3.4. Explanation of Manufacturing Process Quality and Manufacturing Time Performance Evaluation Model

A comprehensive manufacturing process quality and manufacturing time performance evaluation model has been constructed in the previous section. Subsequently, in terms of quality, this study uses 5 σ as the standard. First, a few different scenarios that can occur in the process performance evaluation chart are defined. This study defines four performance regions, namely Z A , Z B , Z C , and Z D , as follows using precision ( γ ) , accuracy ( δ ) , and manufacturing time performance index J M T :
Z A = { δ ,   γ ,   J M T |   δ ( k 1.5 ) γ 1 ,   δ + ( k 1.5 ) γ 1 ,   γ 0 ,   0 J M T 1   | }
Z B = { δ ,   γ ,   J M T |   δ ( k 1.5 ) γ 1 ,   γ 0 ,   δ < 0 , 0 J M T 1   | }
Z C = { δ ,   γ ,   J M T |   δ + ( k 1.5 ) γ 1 ,   γ 0 ,   δ > 0 , 0 J M T 1   | }
Z D = { δ ,   γ ,   J M T |   δ ( k 1.5 ) γ 1 ,   δ + ( k 1.5 ) γ 1 ,   γ 0 ,   0 J M T 1   | }
As mentioned previously, precision and accuracy indices can adequately identify reasons for poor quality in the manufacturing process. When a process quality characteristic falls into region Z A , it indicates that the process quality characteristic is satisfactory and its precision and accuracy are above the required quality level. When a process quality characteristic falls into region Z B , it indicates that the process quality characteristic has insufficient accuracy and its manufacturing process is skewed to the left. When a quality characteristic falls into region Z C , it indicates that the process quality characteristic has insufficient accuracy and its manufacturing process was skewed to the right. When a process quality characteristic falls into region Z D , it indicates that the quality characteristic has insufficient precision and process variation is overly large. Subsequently, the quality region is depicted in Figure 6.
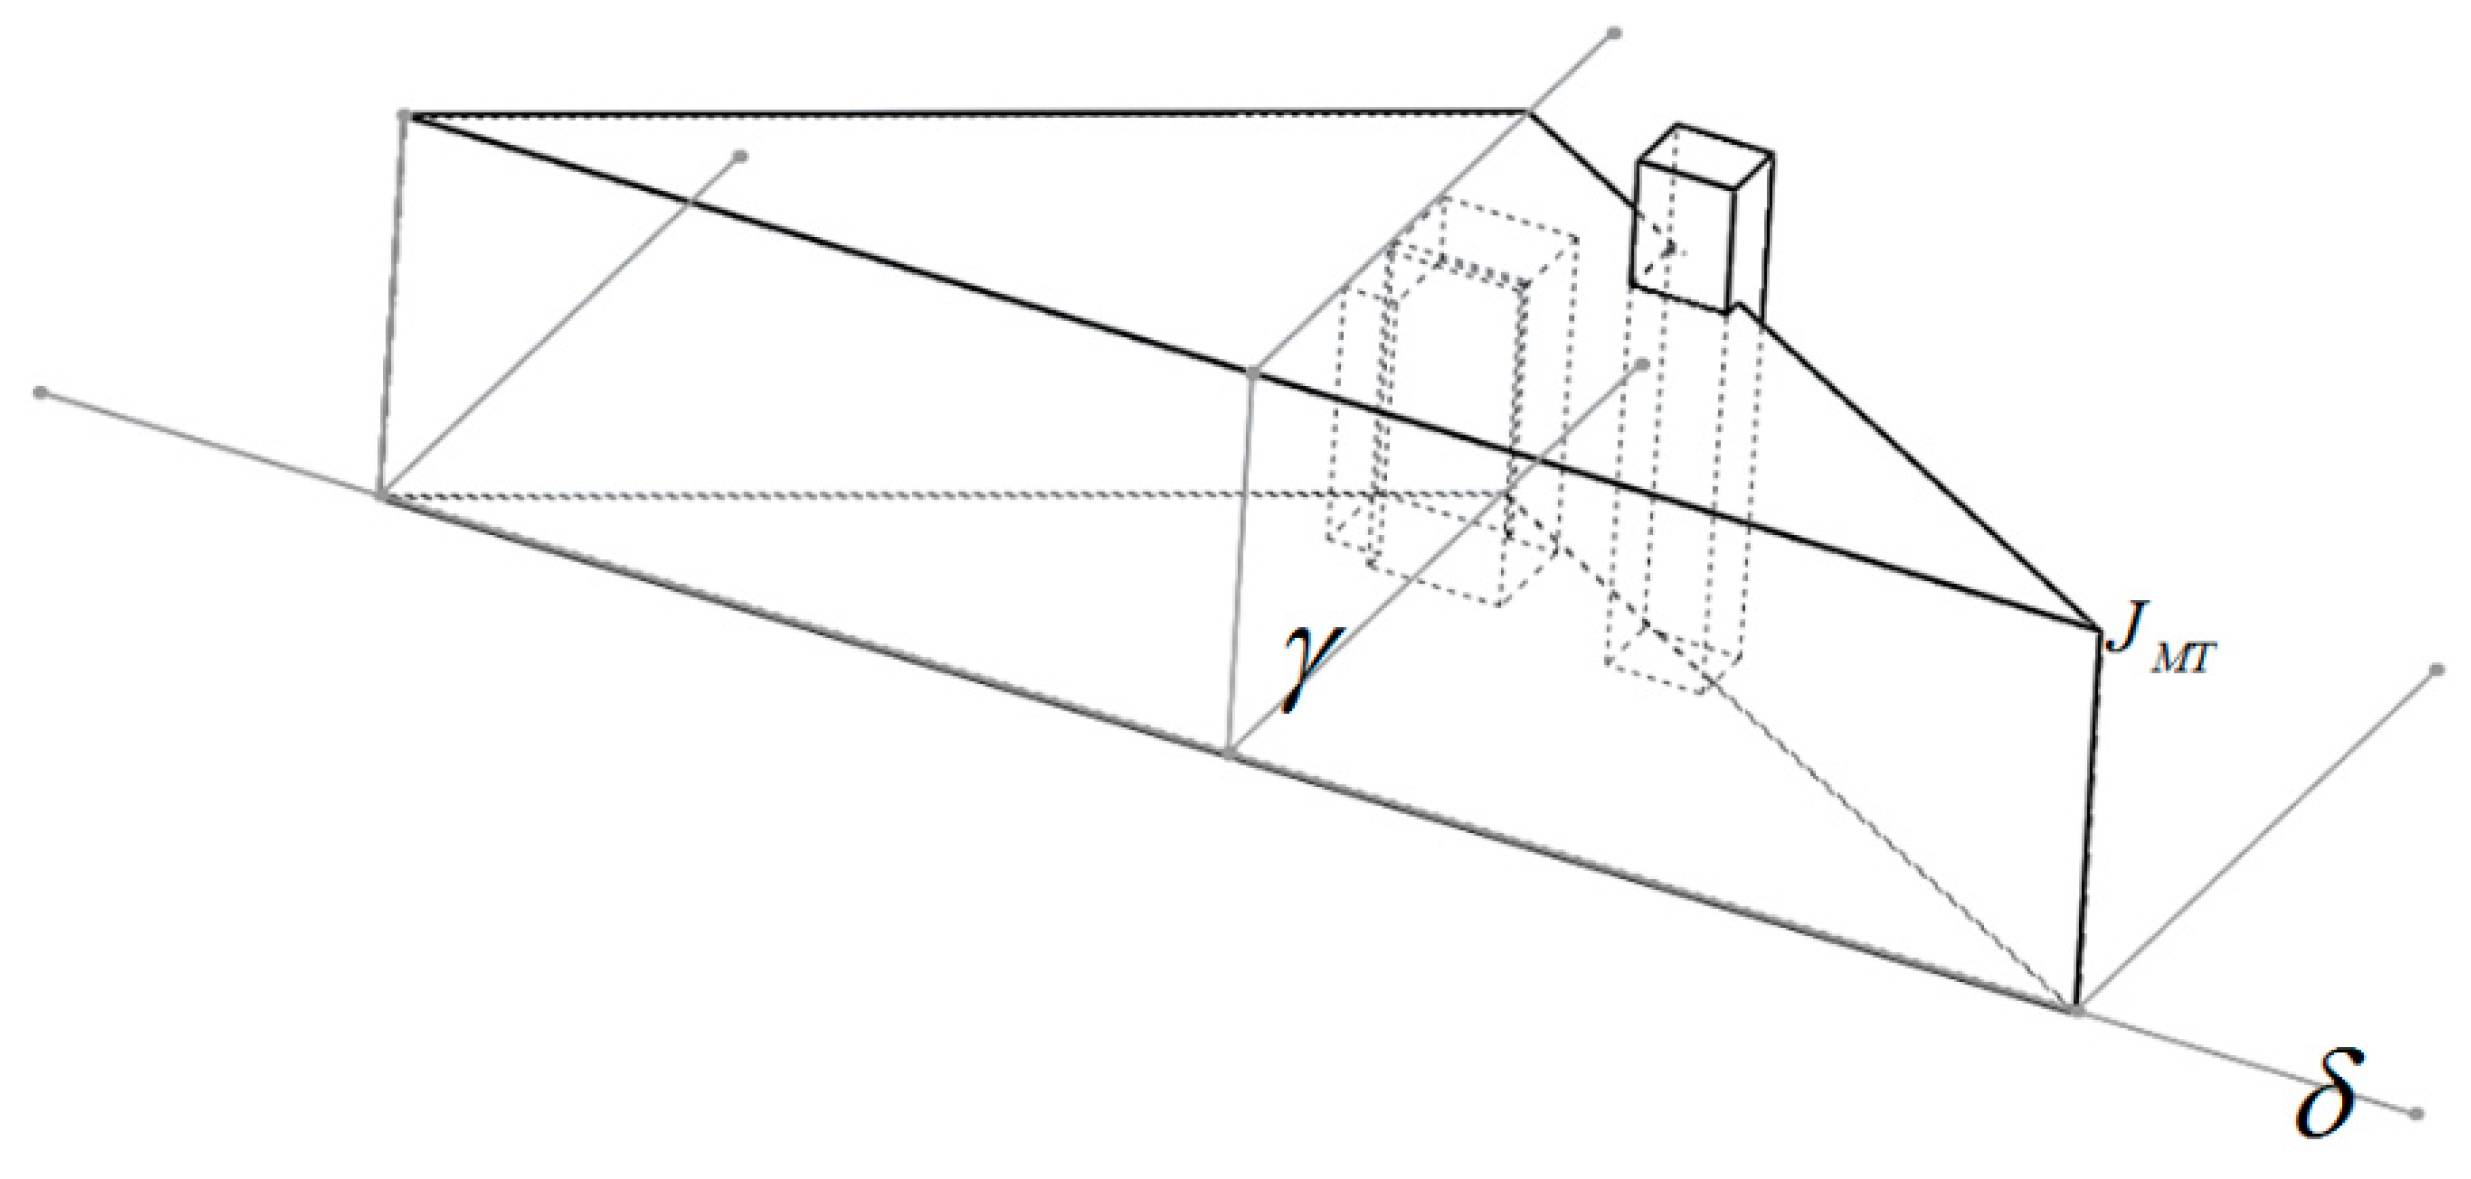
In terms of manufacturing time performance, the manufacturing time performance defect rate J M T is used as the Z -axis, as shown in Figure 7. When the height of the set S is within the model, it indicates that the manufacturing time performance has met the requirements of the company. When the height of aggregate S is outside of the model, it indicates that the manufacturing time performance has fallen short of the standard allowed by the company and improvement is needed. Through the use of the model, whether the manufacturing process of each product has met the standard can be seen clearly. Additionally, a table for the comparison of manufacturing process quality and manufacturing time performance is made for reference and is shown in Figure 3. The Table 4 allows quick identification of process quality characteristics whose manufacturing time performance has not met the standard, enabling companies to focus on the problems and improve them accordingly.

4. Practical Application

A comprehensive manufacturing process quality and manufacturing time performance evaluation model has been constructed in Section 3. Manufacturers can set a quality level according to their own capacity and the requirements of their clients. This section uses the manufacturing process of a bearing connector in our case study. The case company collected sample information through random sampling. The number of sampling groups was set to m = 20 and the sample size was set to n = 11 . Additionally, the Kolmogorov–Smirnov test was used to determine whether the samples were in the normal distribution. The results suggested that the values were all larger than 0.07 and p values were all bigger than 0.05. This indicated that the samples had a normal distribution. The data are presented in Table 5.
Three crucial nominal-the-best process quality characteristics were estimated and analyzed. Sampling was conducted separately for manufacturing process quality and manufacturing time performance, and the means and standard deviations of the sampling were found. The results of the sampling are presented in Table 6.
The variables δ and γ in Table 7 can be used to construct a joint confidence region, with coordinates that represent the maximum and minimum values of precision and accuracy, respectively. The coordinate points of the three aforementioned pivotal process quality characteristics were subsequently drawn into an evaluation diagram of pivotal process quality characteristics of the bearing connectors.
Analyzing the diagram of pivotal process quality characteristics can help determine whether a bearing connector has met the manufacturer’s requirements. Figure 8 illustrates that quality characteristic A (external diameter) was located in the satisfactory region Z A , quality characteristic B (internal diameter ) was located in the satisfactory region Z A , and quality characteristic C (threads) was located in the unsatisfactory region Z C . This indicates that the accuracy of the manufacturing process was insufficient and skewed to the right.
The manufacturing time performance defect rate index J M T was added as the Z -axis, as shown in Figure 9. If manufacturers set the manufacturing time performance defect index J M T at 0.006, Figure 9 clearly shows that process quality characteristic A (external diameter) and process quality characteristic B (internal diameter) were both within the model. This indicates that the manufacturing time performance met the standard. Process quality characteristic C (threads) protruded outside the model, indicating that the manufacturing time performance exceeded the range of approval and its mean value was overly large. The implication is that the manufacturing process quality characteristic C must be shortened for the product to be shipped on time. The manufacturing process quality performance evaluation model clearly indicates whether the manufacturing process quality and manufacturing time performance of bearing connectors have met the requirement. Process quality characteristic C (threads) performance in terms of manufacturing process quality and manufacturing time performance failed to meet the standard. An investigation revealed that bearing connectors can easily deform during the process of thread carving. Because of this problem, the manufacturer would adjust their parameter settings and improve their technical skills. This case shows that manufacturers can use the model as a reference to improve the manufacturing process. The manufacturing process quality and manufacturing time performance model facilitates the adjustment of parameter errors and the monitoring of manufacturing time performance. This, in turn, reduces the defect rate and achieves the goal of process quality control.
According to Figure 9, a combination of perspectives from real practices and theories are as follows:
  • The process quality performance of the three process quality characteristics of a bearing connector can be evaluated simultaneously to facilitate engineers to supervise process quality easily.
  • Among the three process quality characteristics, A and B have achieved process quality far better than the process quality level and C just meets the requirements. However, C must be supervised strictly from the view of sampling errors.
  • Process time performance of A and B both fulfill the required level but C fails. The engineers must further improve.

5. Conclusions

This paper uses Q p k as a tool to evaluate the manufacturing process quality because Q p k is both corresponding to process yield in terms of math and directly reflects SSQIs., the paper proposes a manufacturing time performance index, called J M T , which can reflect the manufacturing failure rate, and uses it as the evaluation tool of manufacturing time performance. Subsequent to this, a three-dimension manufacturing process performance evaluation chart is proposed in which δ is the X-axis, γ Y-axis, and J M T Z-axis. Apart from this, the statistical process control data are used to construct the joint confidence interval of δ and γ to replace the point estimate, which is used as the tool of evaluation of manufacturing process quality, and downplay the risks caused by sampling errors. On the other hand, the module proposed by this paper can present an effective evaluation of manufacturing time performance besides the examination of process quality. This paper provides a useful module to examine the manufacturing performance of bearing connectors; it can also be used for multiple evaluations of manufacturing performance in other manufacturing industries. In sum, the tree-dimension manufacturing process performance evaluation chart is featured with the following advantages:
  • Six Sigma quality indices (SSQIs) correspond to process yield, and, therefore, can directly reflect the manufacturing process quality in terms of SSQIs.
  • The tree-dimension manufacturing process performance evaluation chart can provide manufacturing engineers with a useful reference to draft strategies and improve the manufacturing process when the process performance of quality characteristics is poor.
  • The tree-dimension manufacturing process performance evaluation chart both analyzes manufacturing process quality and supervise manufacturing time performance index, offering the control staff the best timing to manufacture.
Finally, the process data used must come from a stable process, and assuming that the process data distributed as the normal distribution are the major limitations and assumption encountered in this study. According to Yang et al. [26], process measurement data are usually full of indeterminacy, so the fuzzy theory can be combined to evaluate the process performance reliably for further study in the future.

Author Contributions

The contributions of the individual author for this research: Conceptualization, K.-S.C. and C.-M.Y.; Methodology, K.-S.C.; Software, K.-C.C.; Validation, T.-H.H. and K.-C.C.; Formal Analysis, K.-S.C.; Investigation, C.-M.Y. and T.-H.H.; Resources, T.-H.H.; Data Curation, S.-R.C. and K.-C.C.; Writing—Original Draft Preparation, K.-S.C., C.-M.Y. and S.-R.C.; Writing—Review & Editing, K.-S.C., C.-M.Y. and T.-H.H.; Visualization, C.-M.Y.; Supervision, K.-S.C.; Project Administration, C.-M.Y.

Funding

This research received no external funding.

Conflicts of Interest

The authors declare no conflict of interest.

References

  1. Chen, K.S.; Huang, M.L.; Chang, P.L. Performance evaluation on manufacturing times. Int. J. Adv. Manuf. Tech. 2006, 31, 335–341. [Google Scholar] [CrossRef]
  2. Pearn, W.L.; Lin, P.C.; Chen, K.S. Estimating process capability index C′′pmk for asymmetric tolerances: Distributional properties. Metrika 2001, 54, 261–279. [Google Scholar] [CrossRef]
  3. Lin, W.T.; Chen, S.C.; Chen, K.S. Evaluation of performance in introducing CE marking on the European market to the machinery industry in Taiwan. Int. J. Qual. Reliab. Manag. 2005, 22, 503–517. [Google Scholar] [CrossRef] [Green Version]
  4. Yu, K.T.; Sheu, S.H.; Chen, K.S. The evaluation of process capability for a machining center. Int. J. Adv. Manuf. Technol. 2007, 33, 505–510. [Google Scholar] [CrossRef]
  5. Wang, C.C.; Chen, K.S.; Wang, C.H.; Chang, P.H. Application of 6-sigma design system to developing an improvement model for multi-process multi-characteristic product quality. Proc. Inst. Mech. Eng. Part B J. Eng. Manuf. 2011, 225, 1205–1216. [Google Scholar] [CrossRef]
  6. Chen, K.S.; Chen, H.T.; Wang, C.H. A study of process quality assessment for golf club-shaft in leisure sport industries. J. Test. Eval. 2012, 40, 512–519. [Google Scholar] [CrossRef]
  7. Chen, K.S.; Wang, C.H.; Chen, H.T. A MAIC approach to TFT-LCD panel quality improvement. Microeletron. Reliab. 2006, 46, 1189–1198. [Google Scholar] [CrossRef]
  8. Chen, K.S.; Yu, K.T.; Sheu, S.H. Process capability monitoring chart with an application in the silicon-filler manufacturing process. Int. J. Prod. Econ. 2006, 103, 565–571. [Google Scholar] [CrossRef]
  9. Huang, M.L.; Chen, K.S.; Hung, Y.H. Integrated process capability analysis with an application in backlight module. Microelectron. Reliab. 2002, 42, 2009–2014. [Google Scholar] [CrossRef]
  10. Huang, C.F.; Chen, K.S.; Hsu, T.S. Enhancement of axle bearing quality in sewing machines using Six Sigma. Proc. Inst. Mech. Eng. Part B J. Eng. Manuf. 2010, 224, 1581–1590. [Google Scholar] [CrossRef]
  11. Chen, K.S.; Chen, H.T.; Chang, T.C. The construction and application of Six Sigma quality indices. Int. J. Prod. Res. 2017, 55, 2365–2384. [Google Scholar] [CrossRef]
  12. Chang, T.C.; Chen, K.S. Testing process quality of wire bonding with multiple gold wires from the viewpoint of producers. Int. J. Prod. Res. 2018. [Google Scholar] [CrossRef]
  13. Chen, K.S.; Wang, C.H.; Tan, K.H. Developing a fuzzy green supplier selection model using Six Sigma quality indices. Int. J. Prod. Econ. 2019, 212, 1–7. [Google Scholar] [CrossRef]
  14. Chen, K.S.; Wang, C.H.; Tan, K.H.; Chiu, S.F. Developing one-sided specification Six-Sigma fuzzy quality index and testing model to measure the process performance of fuzzy information. Int. J. Prod. Econ. 2019, 208, 560–565. [Google Scholar] [CrossRef]
  15. Wu, M.F.; Chen, H.Y.; Chang, T.C.; Wu, C.F. Quality evaluation of internal cylindrical grinding process with multiple quality characteristics for gear products. Int. J. Prod. Res. 2019. [Google Scholar] [CrossRef]
  16. Yang, C.M.; Chen, K.S.; Hsu, C.H. Developing a multi-quality characteristic analysis model to measure the quality of quick-release bicycle hubs. J. Chin. Inst. Eng. 2019, 42, 309–318. [Google Scholar] [CrossRef]
  17. Chen, K.S.; Huang, M.L. Performance measurement for a manufacturing system based on quality, cost and time. Int. J. Prod. Res. 2006, 44, 2221–2243. [Google Scholar] [CrossRef]
  18. Lin, C.J.; Pearn, W.L.; Huang, J.Y.; Chen, Y.H. Group selection for processes with multiple quality characteristics. Commun. Stat. Theory Methods. 2018, 47, 3923–3934. [Google Scholar] [CrossRef]
  19. Dharmasena, L.S.; Zeephongsekul, P. A new process capability index for multiple quality characteristics based on principal components. Int. J. Prod. Res. 2016, 54, 4617–4633. [Google Scholar] [CrossRef]
  20. Chang, T.C.; Wang, K.J.; Chen, K.S. Sputtering process assessment of ITO film for multiple quality characteristics with one-sided and two-sided specifications. J. Test. Eval. 2014, 42, 196–203. [Google Scholar] [CrossRef]
  21. Wang, F.K. Quality evaluation of a manufactured product with multiple characteristics. Qual. Reliab. Eng. Int. 2006, 22, 225–236. [Google Scholar] [CrossRef]
  22. Pearn, W.L.; Wang, F.K.; Yen, C.H. Measuring production yield for processes with multiple quality characteristics. Int. J. Prod. Res. 2006, 44, 4649–4661. [Google Scholar] [CrossRef]
  23. Montgomery, D.C. Introduction to Statistical Quality Control, 4th ed.; Wiley: New York, NY, USA, 2001. [Google Scholar]
  24. Chen, K.S.; Huang, M.L.; Li, R.K. Process capability analysis for an entire product. Int. J. Prod. Res. 2001, 39, 4077–4087. [Google Scholar] [CrossRef]
  25. Pearn, W.L.; Cheng, Y.C. Measuring production yield for processes with multiple characteristics. Int. J. Prod. Res. 2010, 48, 4519–4536. [Google Scholar] [CrossRef]
  26. Yang, C.M.; Lin, K.P.; Chen, K.S. Confidence interval based fuzzy evaluation model for an integrated-circuit packaging molding process. Appl. Sci. 2019, 9, 2623. [Google Scholar] [CrossRef]
Figure 1. Rigid coupling.
Applsci 09 03105 g001
Figure 2. Manufacturing process of the bearing connector.
Applsci 09 03105 g002
Figure 3. Product diagram.
Applsci 09 03105 g003
Figure 4. The set S.
Applsci 09 03105 g004
Figure 5. Manufacturing process performance evaluation chart.
Applsci 09 03105 g005
Figure 6. Quality region of manufacturing process performance evaluation chart.
Applsci 09 03105 g006
Figure 7. Manufacturing process performance evaluation chart with 5-sigma.
Applsci 09 03105 g007
Figure 8. Evaluation of major process quality characteristics.
Applsci 09 03105 g008
Figure 9. Evaluation model of crucial manufacturing process quality and manufacturing time performance.
Applsci 09 03105 g009
Table 1. Process quality characteristic specifications.
Quality CharacteristicToleranceManufacturing Time
External diameter19 ± 0.04300 ± 40/s
Internal diameter 10 + 0.01 + 0.03 300 ± 40/s
Threads8.125 ± 0.1600 ± 40/s
Table 2. Sampling statistics of crucial quality characteristics.
Sample X h , i , 1 X h , i , 2 X h , i , n X ¯ h , i S h , i
1 X h , 1 , 1 X h , 1 , 2 X h , 1 , n X ¯ h , 1 S h , 1
2 X h , 2 , 1 X h , 2 , 2 X h , 2 , n X ¯ h , 2 S h , 2
m X h , m , 1 X h , m , 2 X h , m , n X ¯ h , m S h , m
Table 3. Manufacturing process Q p k h and k s i g m a quality indices.
Quality Characteristics k | δ | γ p T
6-sigma6.3670.23560.15710.9999966
5-sigma5.4510.27510.18340.9997674
4-sigma4.5800.32750.21830.9937903
3-sigma3.7850.39620.26410.9331894
Table 4. Comparison of manufacturing process quality and manufacturing time performance.
RegionManufacturing Process QualitySituation
Z A SatisfactoryBoth accuracy and precision have met the standard
Z B UnsatisfactoryInsufficient accuracy and manufacturing process is skewed to the left
Z C UnsatisfactoryInsufficient accuracy and manufacturing process is skewed to the right
Z D UnsatisfactoryInsufficient precision with excessive process variation
J M T OuterSatisfactoryManufacturing time performance has met the standard
J M T InnerUnsatisfactoryFailure to meet the standard and requires improvement
Table 5. Kolmogorov–Smirnov test.
CharacteristicExternal Diameter (A)Internal Diameter (B)Threads (C)
Indicator
Manufacturing process quality indexKs = 0.084Ks = 0.084Ks = 0.093
p > 0.05p > 0.05p > 0.05
Manufacturing time performance indexKs = 0.073Ks = 0.091Ks = 0.097
p > 0.05p > 0.05p > 0.05
Table 6. Sampling of manufacturing process quality and manufacturing time of the bearing connectors.
a1 External diameter (A) 19 ± 0.04 mma2 External diameter manufacturing time (A) 300 ± 40 s
Sample X 1 X 2 X 11 X ¯ Sample X 1 X 2 X 11 X ¯
119.00519.0119.00419.0011311293312298.1
218.99418.99519.00718.9982288286295297.3
2018.99119.02119.00619.00220287304309299.5
b1 Internal diameter (B) 10 + 0.01 + 0.03 mmb2 Internal diameter manufacturing time (B) 300 ± 40 s
Sample X 1 X 2 X 11 X ¯ Sample X 1 X 2 X 11 X ¯
110.02010.01910.01910.0201315284304296.7
210.02310.02210.02210.0202291291300295.2
2010.02010.01810.01910.01920294316305295.2
c1 Threads (C) 8.125 ± 0.1 mmc2 Threads manufacturing time (C) 600 ± 40 s
Sample X 1 X 2 X 11 X ¯ Sample X 1 X 2 X 11 X ¯
18.1238.1378.0988.1221589607606600.3
28.1188.1058.1358.1192619584603598.8
208.1068.1278.1418.12020581616614600.2
Table 7. Process quality characteristics δ , γ , and I M T .
δ γ δ L δ U γ L γ U Q p k J M T
External diameter−0.0110.173−0.0370.0150.1490.1865.6960.004
Internal diameter0.0080.171−0.0170.0340.1480.1835.7970.005
Threads0.0830.1370.1040.1200.1240.1535.4830.008

