1. Introduction
The energy performance of buildings in Sweden needs to be improved in order to reduce energy use and greenhouse gas emissions. The EU has set targets to reduce greenhouse gas emissions by 40% and improve energy efficiency by 27% compared to 1990 levels by the year 2030 [
1]. The European Energy Performance of Buildings Directive (EPBD) is an EU legislative instrument promoting the improvement of the energy efficiency of buildings [
2]. The EU directives are incorporated by member states into national legislation. Sweden’s Nearly Zero-Energy Buildings (NZEB) national plan promotes the improvement of energy efficiency in existing buildings to using nearly zero energy [
3]. For historic buildings in particular, this is quite a challenge to accomplish.
With an increased focus on reducing the energy use of the existing building stock, it has become clear that historic buildings need special attention and adapted renovation measures [
4,
5,
6,
7]. The European Standard on Conservation of Cultural Heritage (SS-EN 16883:2017) provides guidelines for improving the energy performance of historic buildings [
8]. This standard highlights the challenge of reducing the greenhouse gas emissions of such buildings, while at the same time preserving their heritage values. The standard requires that the character-defining elements of historic buildings should be preserved. The Swedish Planning and Building Act (PBL) stipulates that
all changes to
all buildings should be performed cautiously and with regard to the character of the building, while maintaining its technical, historical, environmental and artistic values [
9]. Most historic single-family houses in Sweden have been constructed in either timber or brick. Renovation of these buildings often uses modern, vapor-tight insulation materials such as mineral wool and expanded polystyrene (EPS) for external wall insulation. This gives improved energy efficiency, but also leads to changes in the building physics of the outer walls, such as changes in temperature and moisture flows. This can ultimately cause damage to the walls.
There is a need to improve the energy performance of historic buildings in Sweden with building materials compatible with both building framework and render, while preserving their character-defining elements.
1.1. Historic Timber Buildings in Visby, Sweden
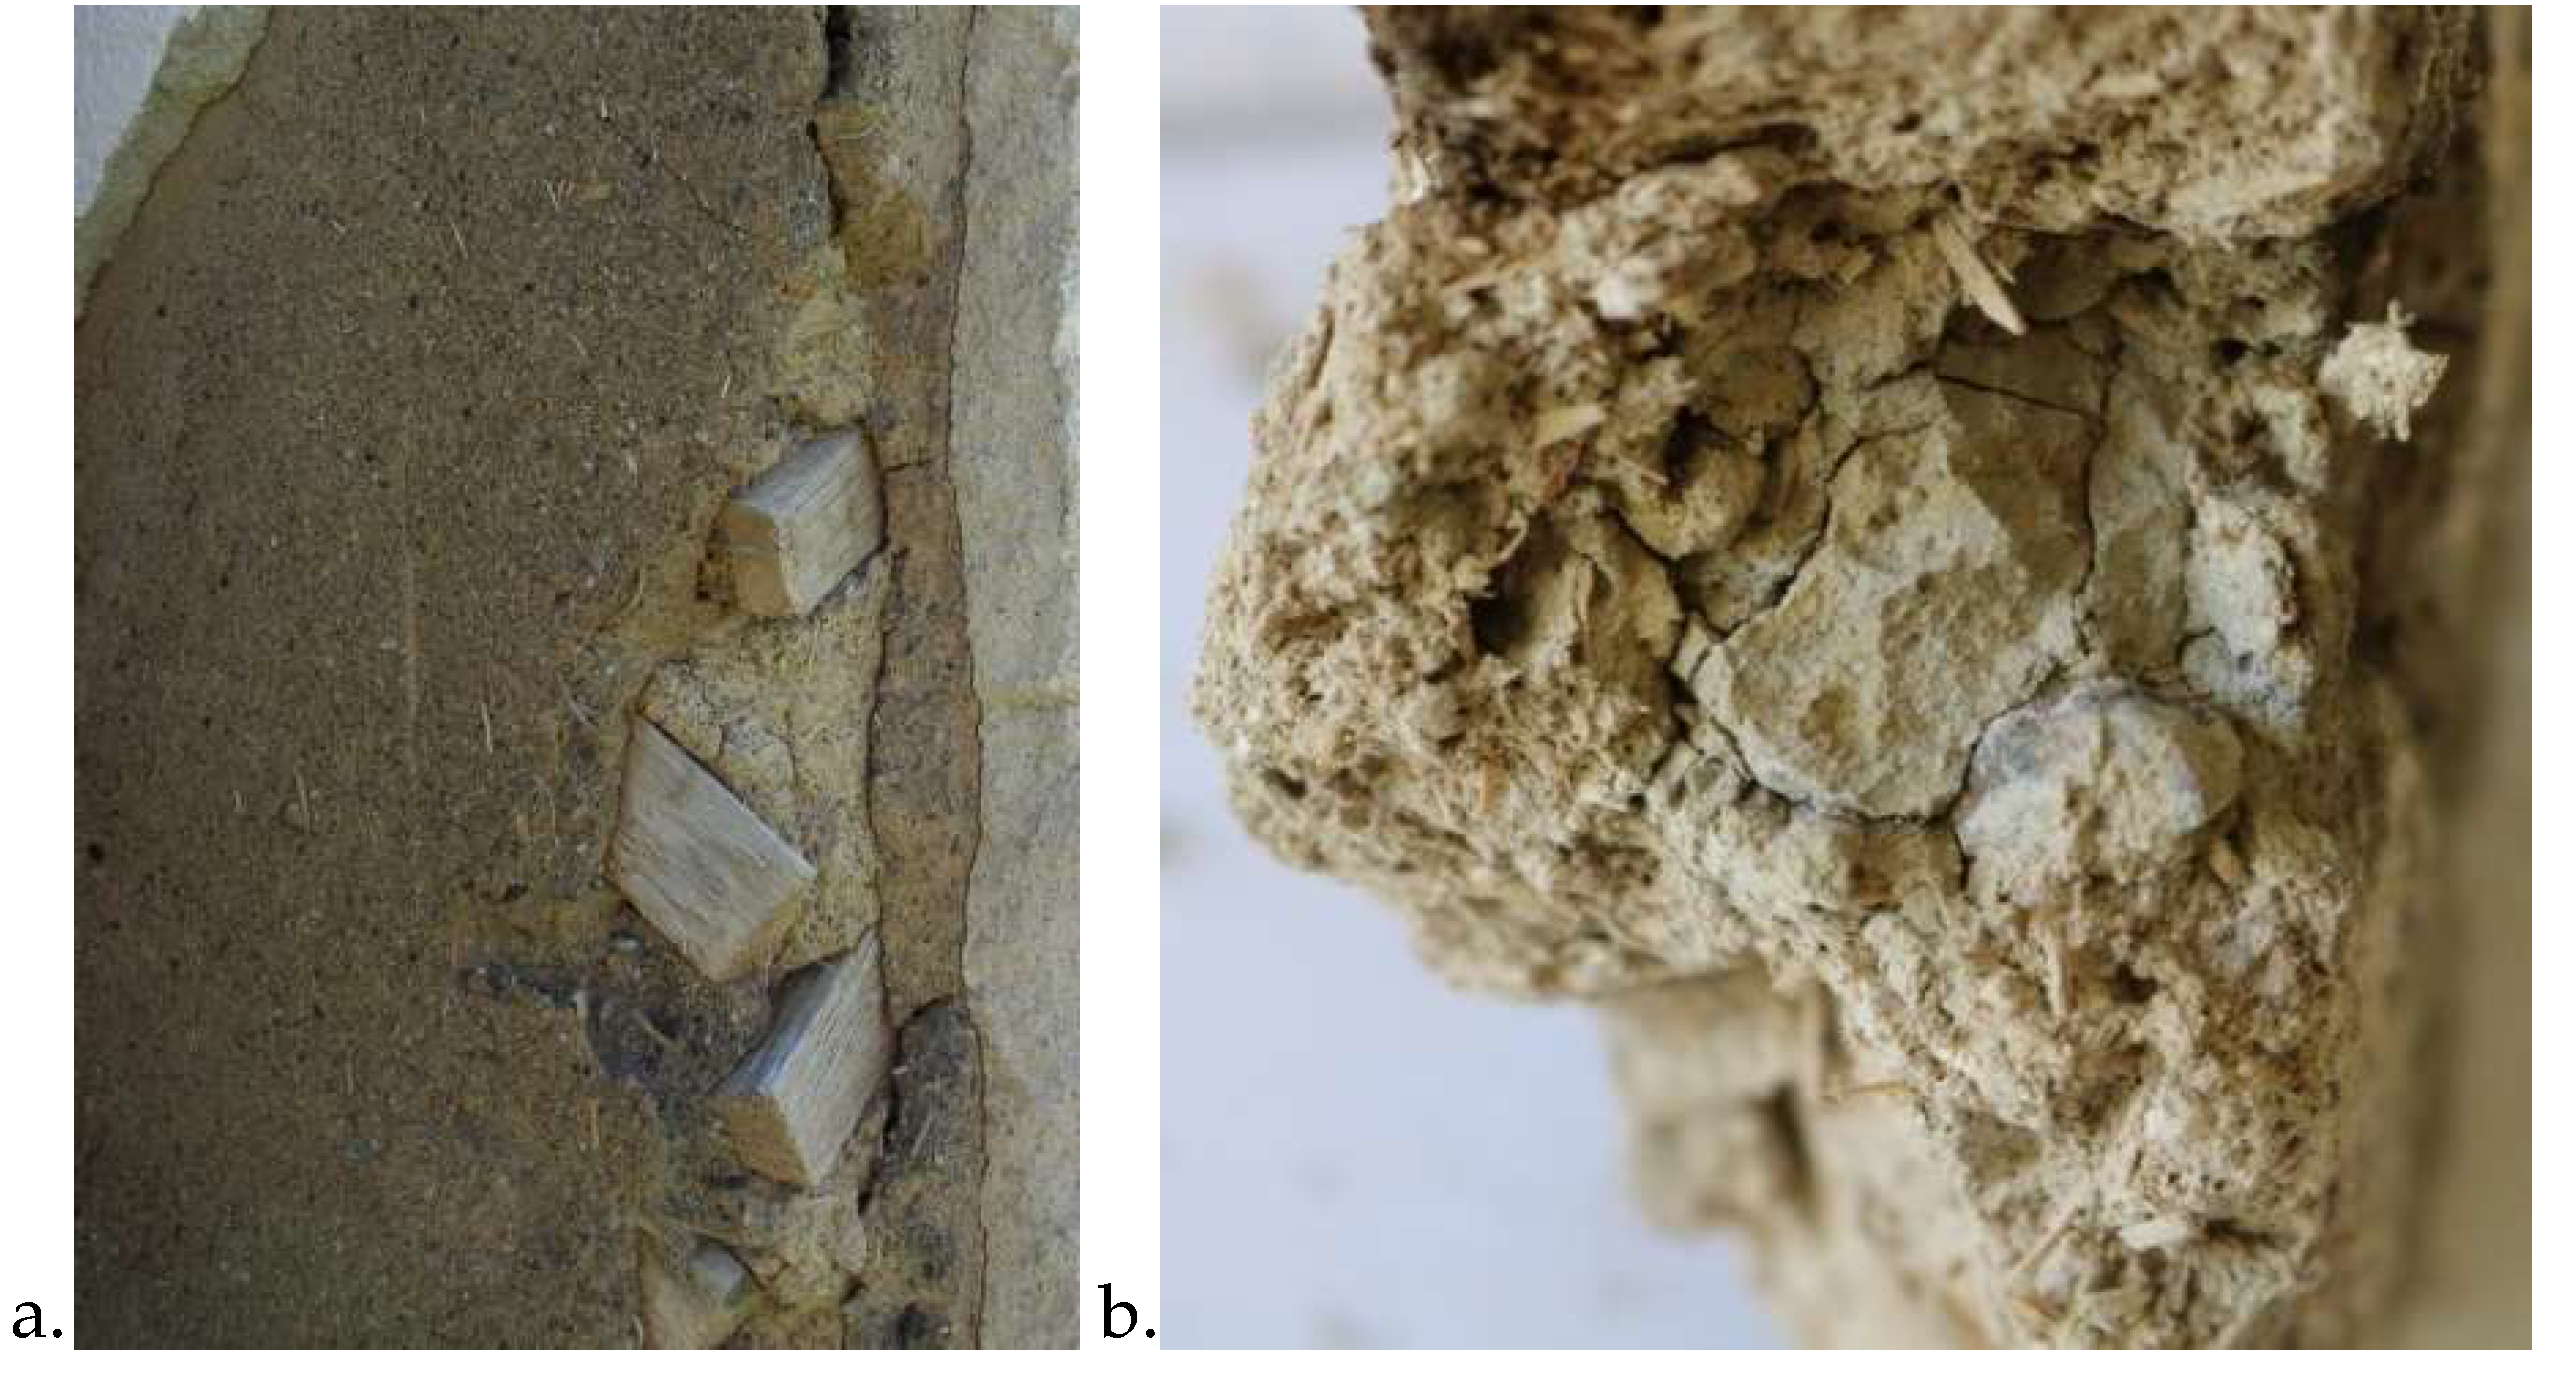
Visby is the capital of the Swedish island of Gotland in the Baltic Sea. The historic city center is characterized by its medieval layout and well-preserved city wall. Visby has been on the UNESCO list of World Heritage Sites since 1995. Most historic buildings in the city center are built with timber or limestone blocks. The most common historic timber technique here is post-and-plank construction (bole houses) (see
Figure 1), characterized by timber wall posts with planks placed horizontally between them, one on top of the other. Until the 19th century, post-and-plank houses were the most common building type in rural Southern Sweden [
10]. Compared to log construction, which is historically common in most parts of Sweden, the post-and-plank technique requires less timber and is therefore common in areas with fewer and shorter trees, like the island of Gotland. Almost 50% of all buildings in Visby city center (more than 500) are built using this construction technique, and the majority of them have rendered façades [
11]. These houses were constructed between 1500 and 1900, and most of them between 1720 and 1830 [
12]. They all are part of the UNESCO World Heritage site and considered irreplaceable. Rendering the façades became common from the mid-1800s. A thick layer of approximately 100 mm lime render would be applied to the timber walls, with diagonally placed wooden slats for additional support and fixation. An external render was applied for both aesthetic and functional reasons: The lime provided an additional insulation layer, created an additional barrier against wind-driven rain, gave better fire protection properties, and was associated with a higher social status.
According to the Visby Building Regulations [
12], traditional constructions should be preserved as far as possible. The regulation states that lime renders should first of all be mended and repaired where possible. If the lime render is severely damaged or is damaging the underlying structure, it is allowed to be removed before renovation. This regulation also states which materials to use when renovating and maintaining traditional constructions. Local air lime and traditional lime wash should be used when renovating the historic façades of Visby, as preserving the local lime tradition is essential for preserving the cultural heritage of the city [
13].
Over the last decades, rendered post-and-plank buildings in Visby have been renovated to a great extent. Many of the original air lime renders have been removed and replaced by modern, hydraulic lime or lime-cement renders, and even organic renders on EPS [
11]. In the inventory made within this project, only just 8% of the inspected houses in the city center of Visby still had parts of their original lime render remaining. It has also become common to add thermal insulation when carrying out a façade renovation of historic buildings. Usually, the external lime render and wooden slats are removed and instead mineral wool or EPS insulation is installed directly onto the timber structure. As an external surface finish, a render of 10–15 mm is used to cover the insulation sheets. Many of these re-rendered houses are in need of re-renovation due to inappropriate building technique and choice of materials.
Today, a façade renovation using only lime render in the traditional way is not considered rational or economically feasible, since it requires more time and provides inferior insulating properties compared to modern insulating materials such as mineral wool and EPS. Applying a new lime render would require applying several layers of lime render, one at a time. This makes for a time-consuming building process with high costs for labor and scaffolding. Since building with air lime is weather dependent, this leaves only a short “building season” during the summer (May–September) in Visby.
1.2. Hemp-Lime
Hemp-lime is a relatively new building material that resembles historic building materials such as timber, lime, and infill of half-timbered houses. It has been used in France since the 1990s. Hemp shiv (the woody core part of the hemp stem) was initially used to make concrete mixes lighter. However, it turned out that hemp shiv worked very well in combination with building limes [
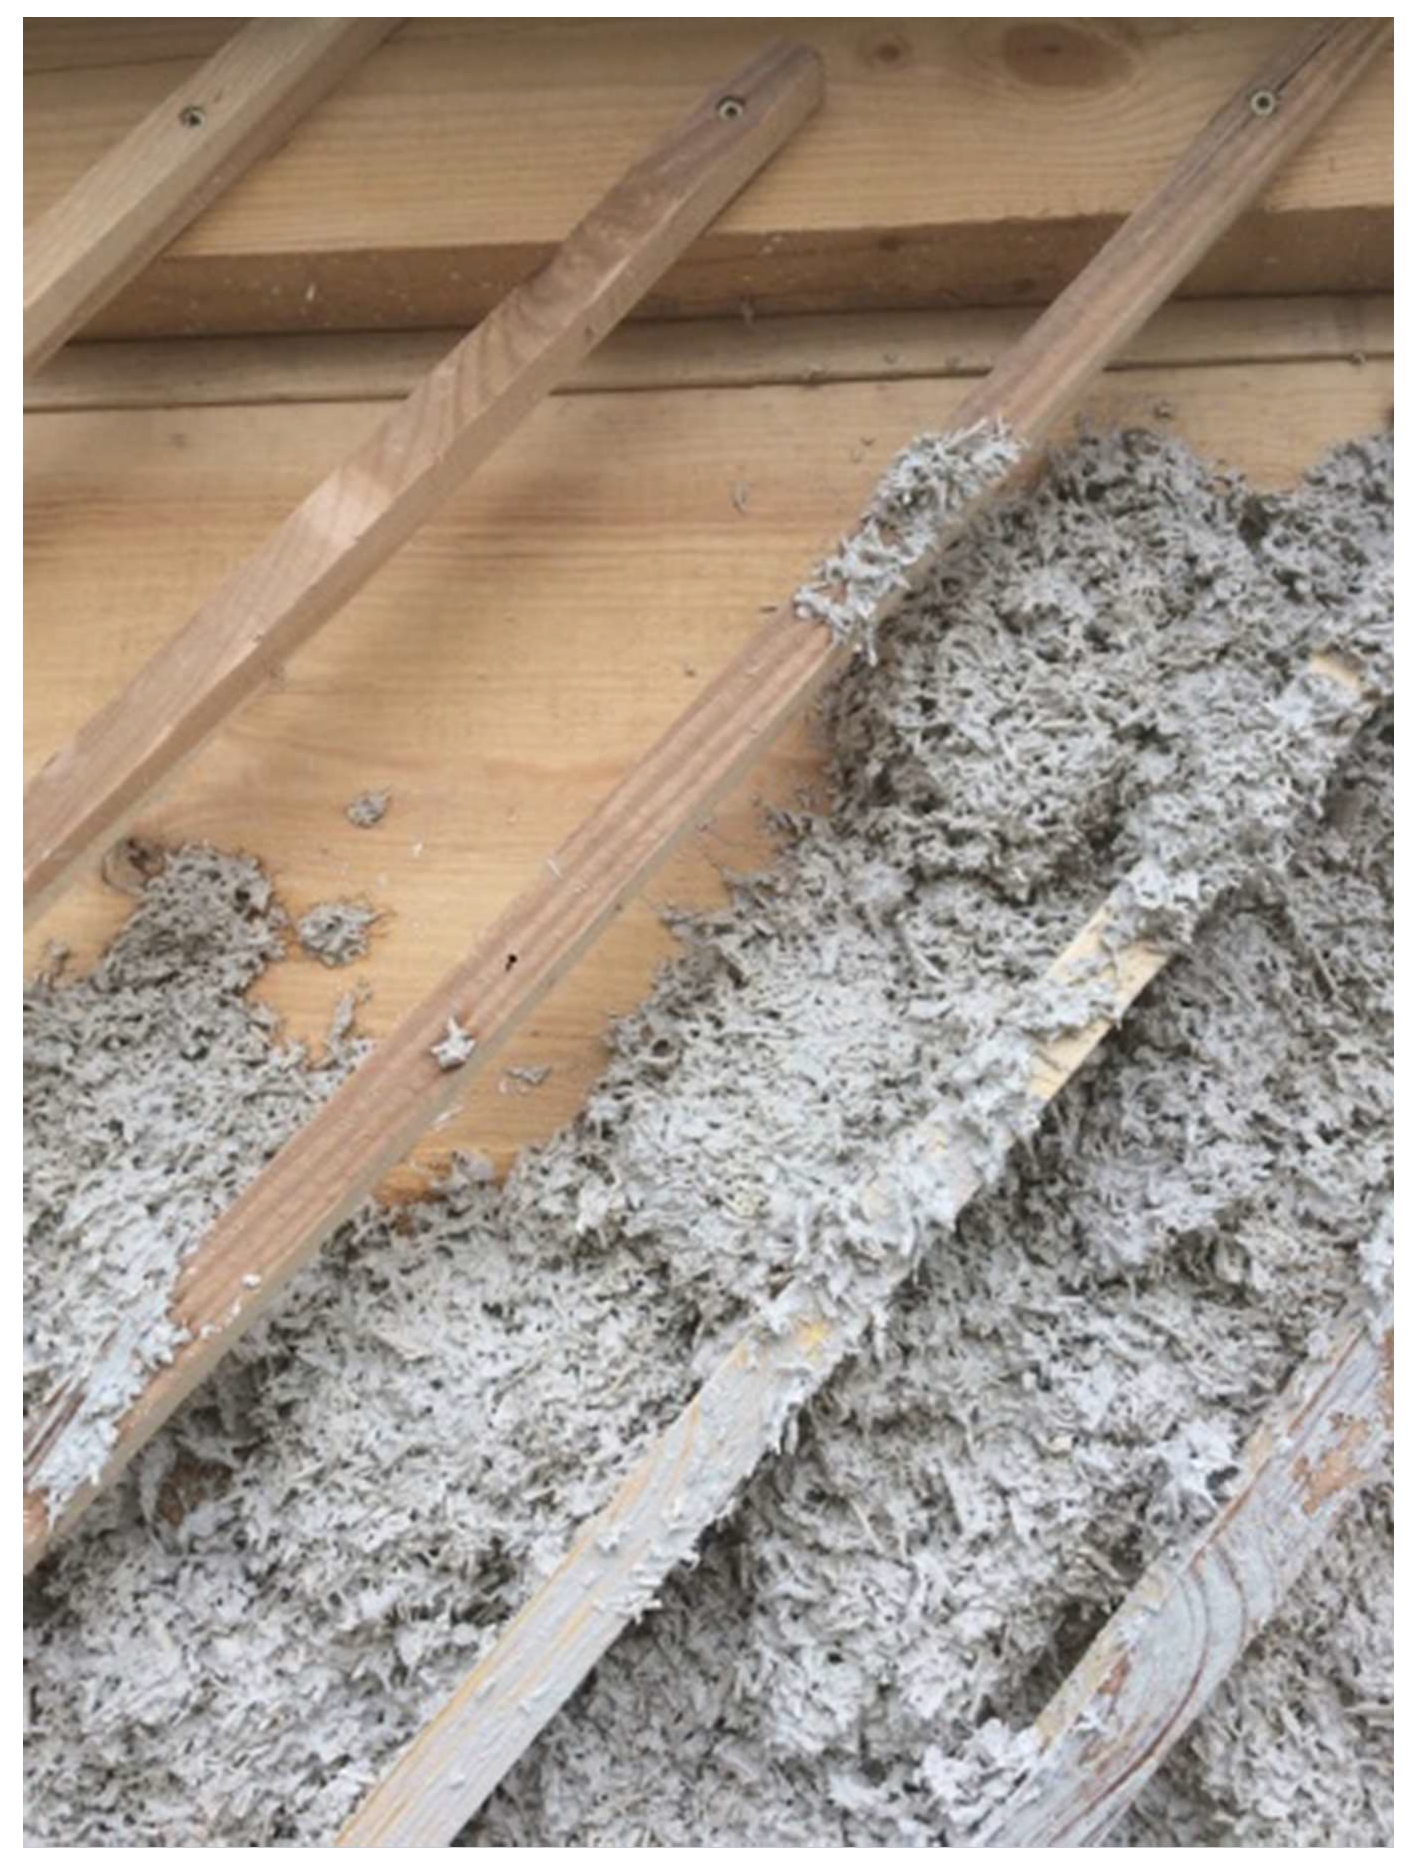
14]. Hemp-lime has since been used in combination with a load-bearing timber structure, in new buildings as well as in renovation projects. The use of bio-based fibers in clay-lime mortars builds on an old tradition when rendering wooden houses in Sweden [
15,
16,
17] (see
Figure 2), and hemp-lime can be considered as a development of a traditional building material.
The moisture buffer value of hemp-lime is high compared to many other building materials. Collet and Pretot [
18] found that sprayed hemp-lime has a moisture buffer value (MBV) of 2.15 g/(m
2 %RH), twice as high as the value that they found for cellular concrete. This means that hemp-lime can regulate moisture well. Building materials with high moisture-buffering capacity can provide a comfortable hygrothermal climate as well as a reduction of energy needs for space heating [
19].
The thermal properties of hemp-lime are sufficient for it to be used as a thermal insulation material. In previous research, thermal conductivity values measured for hemp-lime varied between 0.06 and 0.19 W/mK [
20,
21,
22,
23].
The thermal insulating properties of hemp-lime vary with the mixing ratio of the material and the application technique [
22]. Adding more hemp shiv to the mix gives a lower thermal conductivity, while adding more lime and creating a denser material gives a higher thermal conductivity.
The thermal conductivity of a building material and its thickness and airtightness are often only taken into account when performing energy use calculations. However, Walker and Pavia [
24] found that in-situ measurements of thermal transmittance (U-values) are also important, as there can be a discrepancy between calculated U-values and those measured in-situ.
1.3. Research Aim and Objective
The aim of this paper was to investigate whether hemp-lime could be used to improve the energy performance of historic timber buildings in Sweden. The objective was to determine the actual energy savings for space heating when using hemp-lime for renovating historic buildings. An additional objective was to determine the actual thermal transmittance and to study thermal buffering through in-situ measurements in a full-scale wall renovated with hemp-lime.
2. Materials and Methods
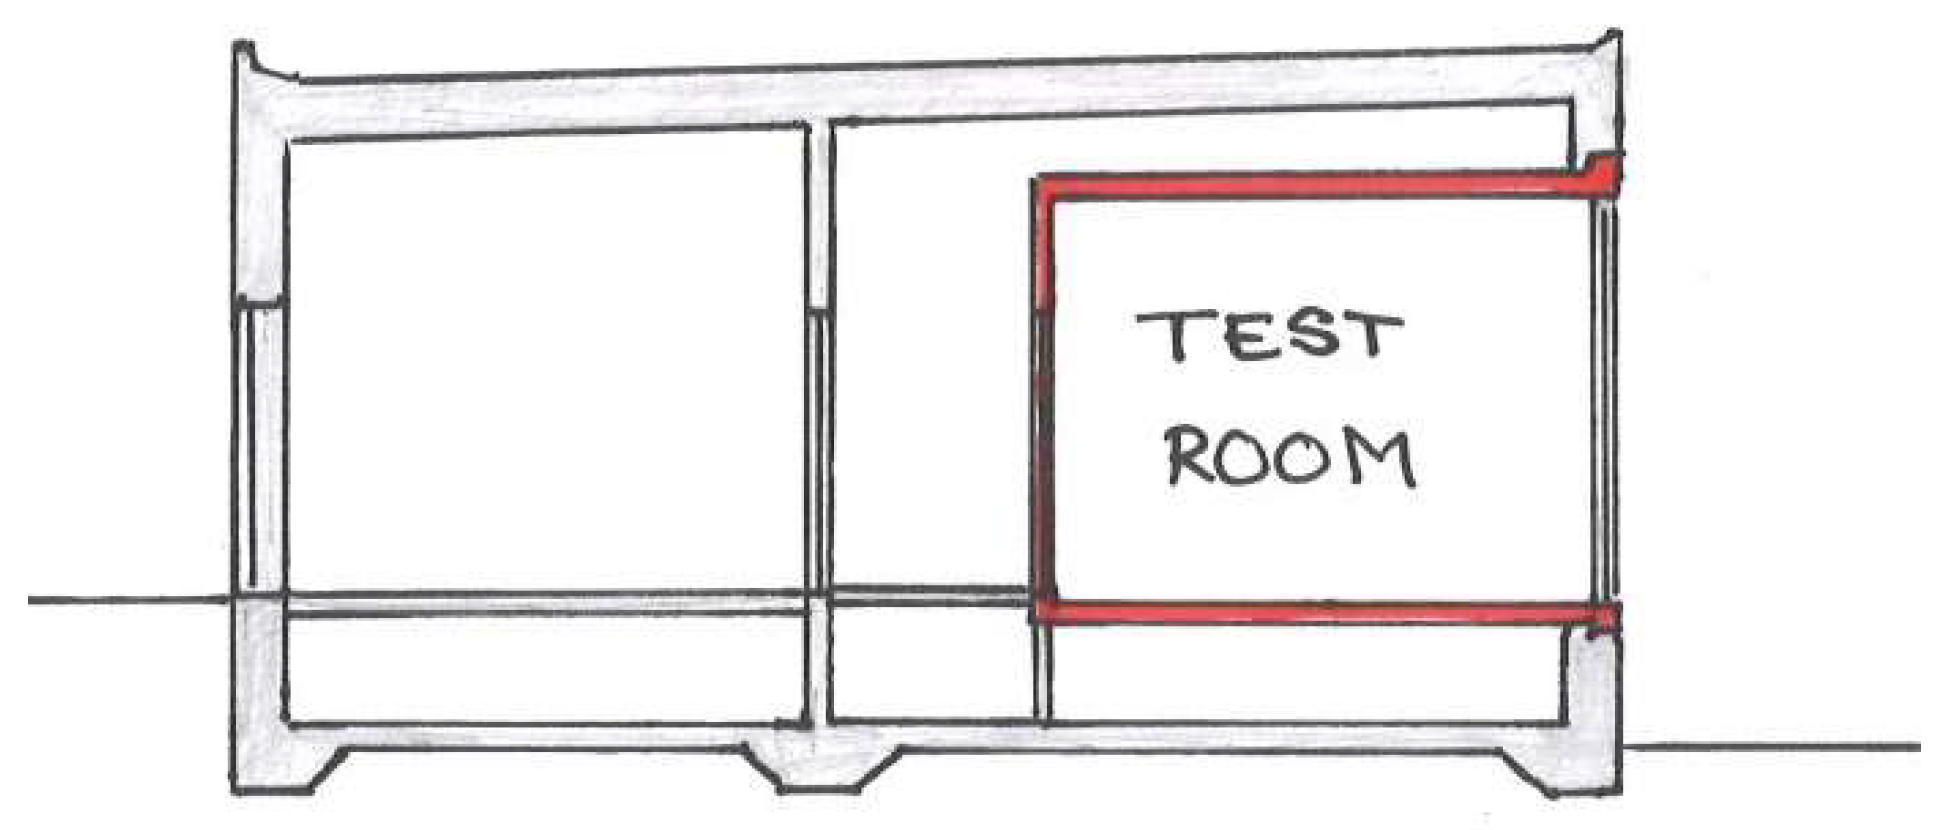
Two full-scale wall sections were constructed at the Energy and Building Design laboratory (EBD-lab) at Lund University (see
Figure 3). This is a facility where the energy performance of entire wall sections can be tested. There are two individual test rooms with fully insulated internal walls, floors and ceilings. The façade sections for these rooms can be lifted out and new façades put in. The test façades were south-facing. As there was only one external wall per test room, there was only one wall through which there was energy loss towards the outdoor climate. Energy use for heating the test rooms was monitored over a one-year period. Energy loss through the internal walls, floor, and roof was kept to a minimum by keeping the indoor temperature in the surrounding lab at ambient temperature.
The indoor temperature inside the two test rooms was kept within the interval 19.0–22.0 °C. At low outdoor temperatures, as soon as the temperature dropped to 19 °C, the heating system would start. The room was heated by means of the ventilation system. When heating started, the ventilation system started, distributing warm air from the ventilation system evenly throughout the whole room.
As soon as the indoor temperature reached 22 °C, the heating system would stop. When outdoor temperatures were lower than 19 °C, the temperature inside the room would drop, until it went below 19 °C, and then heating would start again. Hence, the temperature inside the rooms during the heating season was within the interval 19–22 °C. There was no active cooling, so in the summer, the indoor temperature would exceed 22 °C without any active cooling measures.
The temperature inside the test rooms was measured every six minutes. Energy use for space heating was monitored continuously, with one measurement point every six minutes.
Relative humidity in the rooms was measured using TESTO devices. Two devices were installed in each room—one mounted directly on the internal surface of the outer wall, the other near the entrance door. The TESTO devices measured relative humidity and temperature continuously, with one measurement per hour.
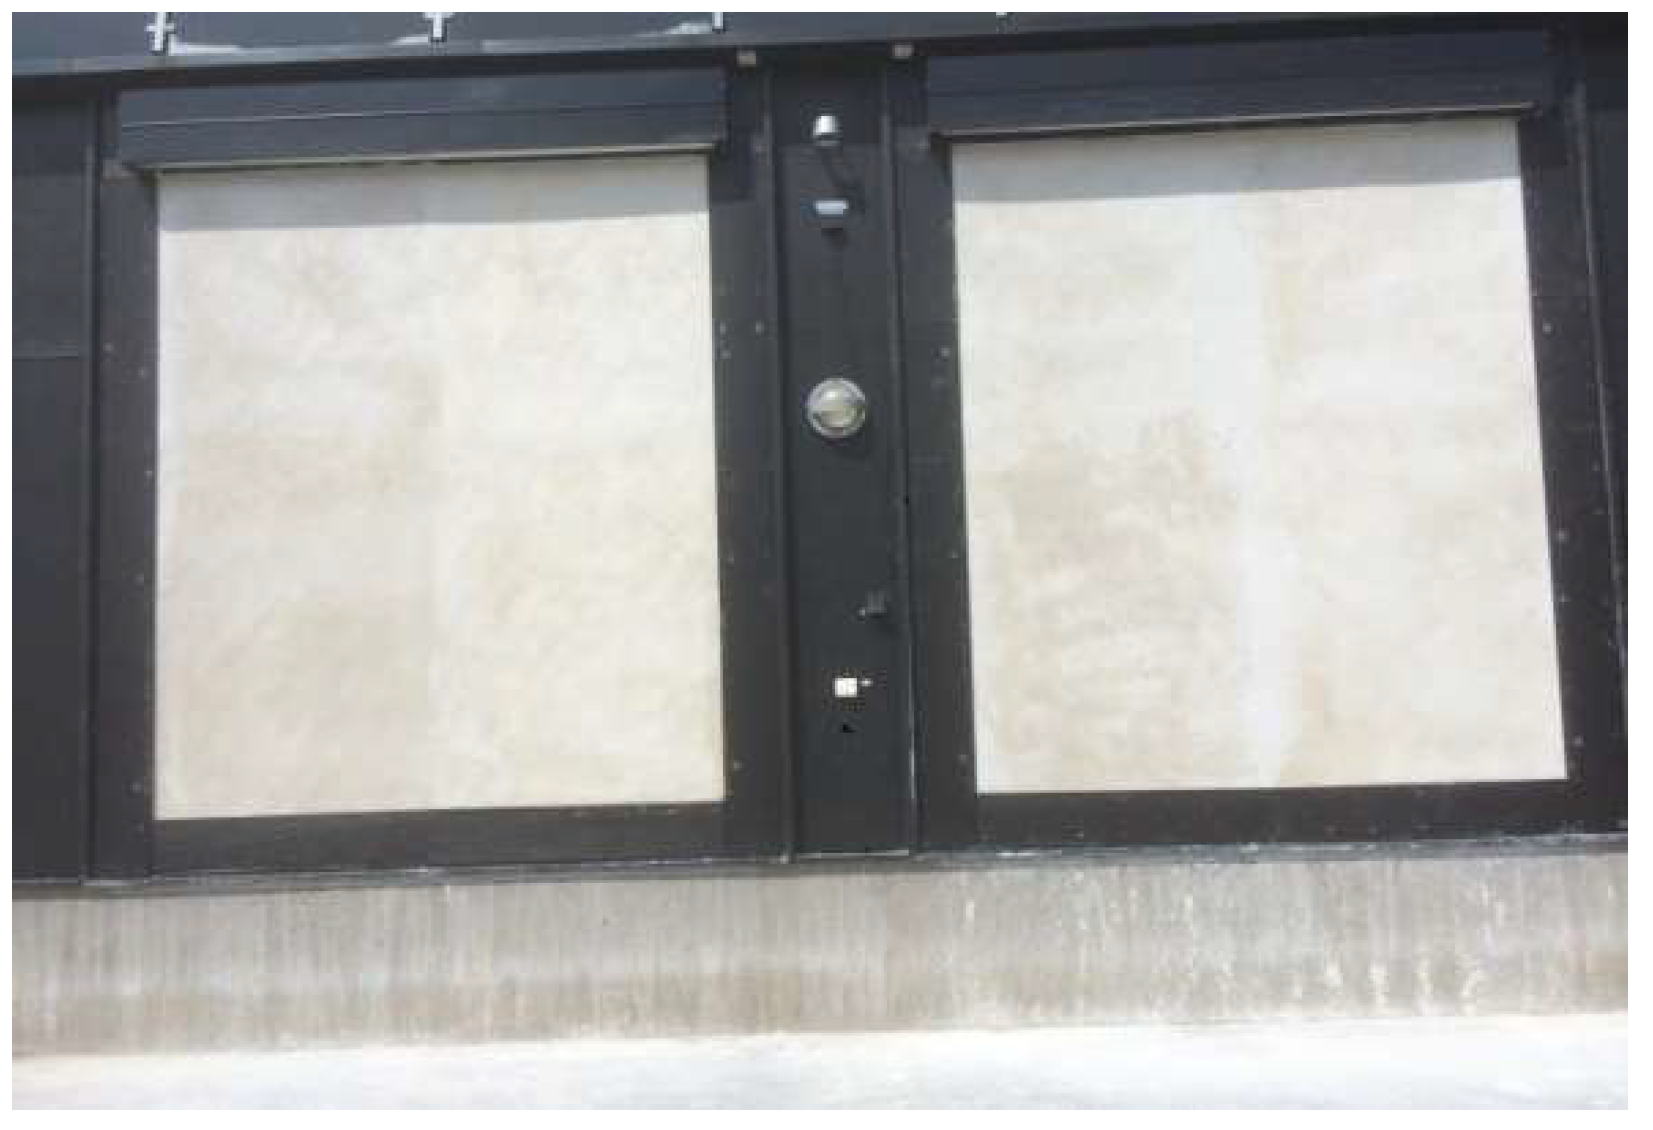
The wall sections measured 2.7 × 3.1 m (width × height). Traditional post-and-plank walls were built in each external wall section (see
Figure 4,
Figure 5,
Figure 6,
Figure 7,
Figure 8 and
Figure 9). One wall section (A) was built as a traditional post-and-plank wall with a lime render while the other wall section (B) was a post-and-plank wall with a hemp-lime render. These walls resembled a historic post-and-plank wall
before renovation and a historic post-and-plank wall
after renovation with hemp-lime. Both of the walls had a lime render as an external wall finish.
The external walls were built up as follows, as seen from the inside:
- A.
Lime-façade (“before renovation”):
Traditional paper covering
Post-and-plank structure with 2” planks (50 mm)
Lime render (80 mm) with diagonal wooden slats (30 × 36 mm), approx. c.o.c. 200 mm
Lime render (20 mm)
- B.
Hemp-lime-façade (“after renovation”):
Traditional paper covering
Post-and-plank structure with 2” planks (50 mm)
Hemp-lime render (90 mm) with diagonal wooden slats (30 × 36 mm), approx. c.o.c. 200 mm
Lime render (20 mm)
Two different lime renders were applied to the walls. Each wall was divided in two equal sections, approximately 1.3 m wide. On one section, an air lime (Nordkalk SL) 1:1.5 was applied, and on the other a natural hydraulic lime (St. Astier NHL 3,5) 1:1.5.
Hemp shiv were supplied by BAFA Neu GmbH in Germany. The hemp-lime render was mixed in a horizontal cement mixer on site. The parts by volume of the hemp-lime mix were 7 hemp to 4 lime to 4¼ water. These proportions were chosen in close dialogue with the mason. Part of the project was to let the masons who now work with traditional lime mortar implement the use of hemp-lime on historic buildings, without having to make any concessions or large adjustments to their working method. In other words, the hemp-lime would be applied in the same manner as when working with regular traditional lime mortar.
3. Results and Discussion
Monitoring and measuring the energy use for heating the rooms started on 15 September 2017 and continued for one year.
The first day that room A (lime façade) required heating was 17 September 2017. The average outdoor temperature that day was 11.6 °C. The first day that room B (hemp-lime façade) required heating was 4 October 2017, almost two weeks later. The average outdoor temperature on that day was 10.3 °C. Even though room A required more heating than room B, the average room temperature during the first month of monitoring was somewhat lower in room A, 20.1 °C, compared to 20.5 °C in room B.
The last day that the rooms needed energy for heating was 9 May 2018. The average temperature that day was 17.8 °C. Both rooms required some energy for space heating that day: room A used 0.013 kWh while room B used 0.009 kWh.
The period for analysing space heating of the rooms was set to 15 September - 15 May during which heating was required. This was a total of eight months (243 days). No active cooling system was available, and therefore active cooling could not be monitored and analysed.
During the above-mentioned heating period (15 September–15 May), the average outside temperature (Toutside) was 5.8 °C. As the heating system kept the temperature in the interval 19–22 °C, the average room temperature ( that the heating system was trying to accomplish was therefore 20.5 °C.
3.1. Comparison of Measured Indoor Temperatures
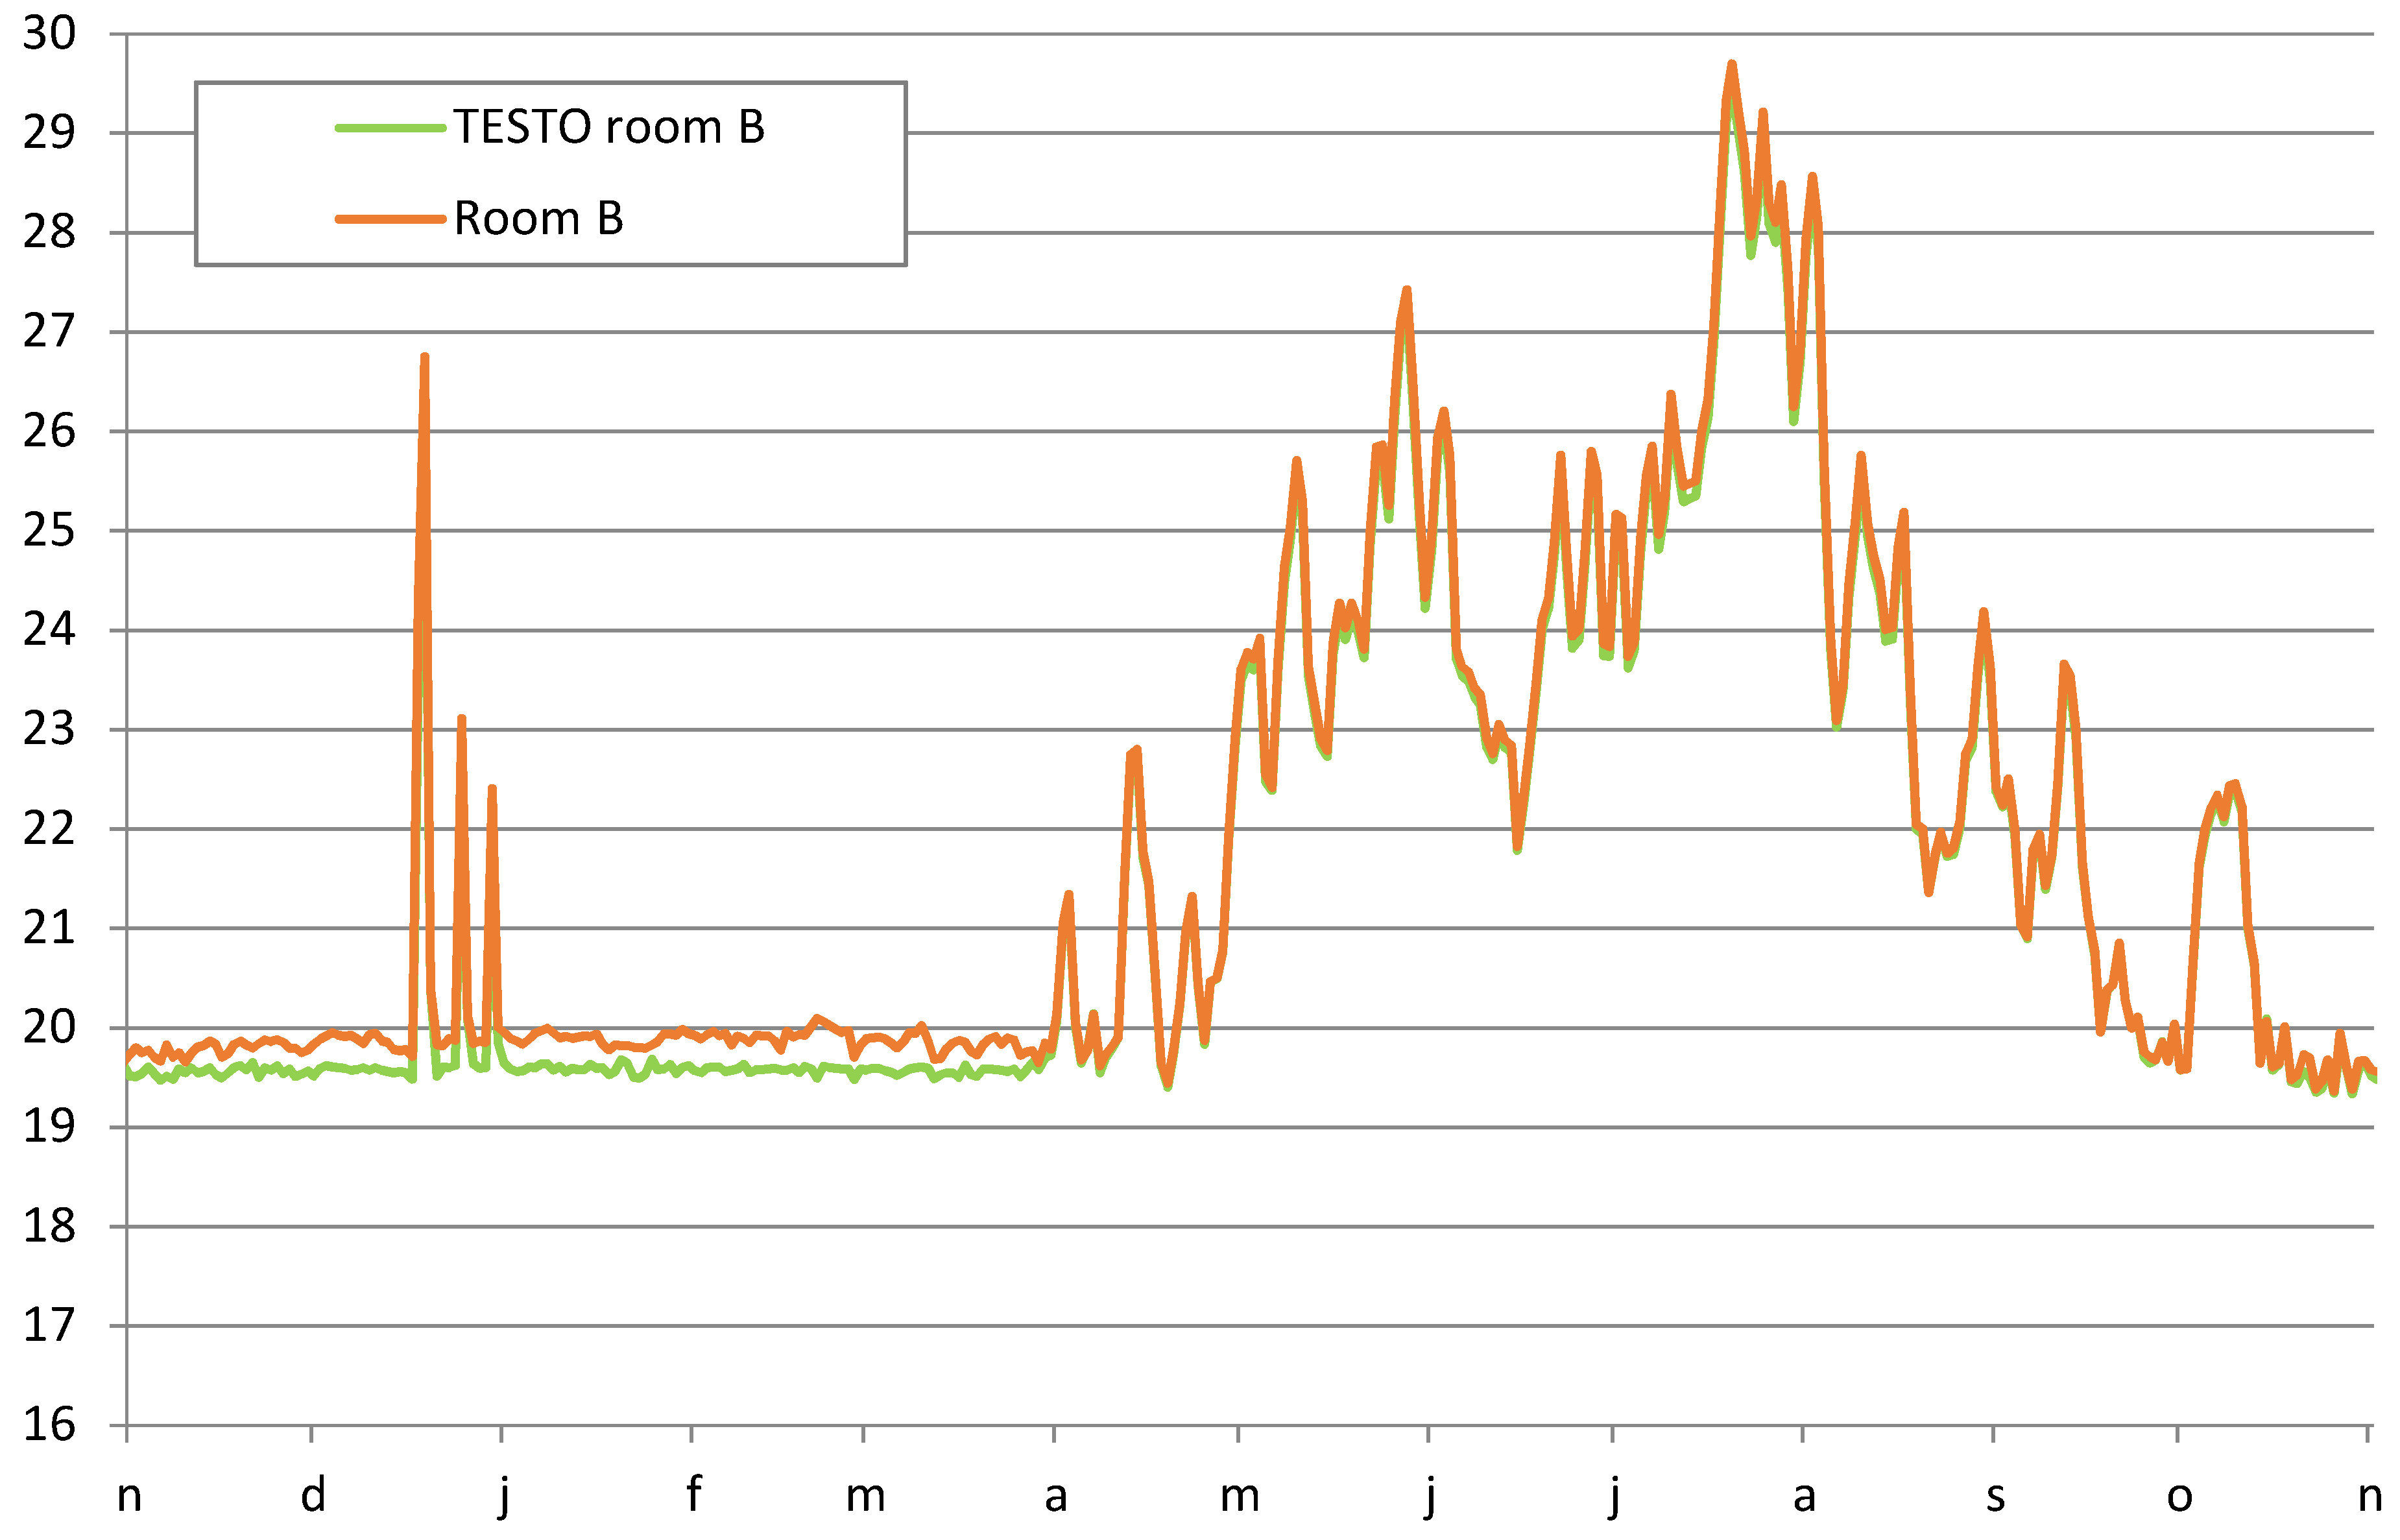
The room temperature measured by the ventilation system was compared to the room temperatures measured by a TESTO device in each room during one year; from 7 November 2017 to 12 November 2018 (see
Figure 10 and
Figure 11).
In general, the room temperatures measured by the ventilation system were somewhat higher than the temperatures measured by the TESTO devices. This was particularly the case during the heating season. When comparing the average temperatures measured over the heating season (7 November–15 May), the difference between the average temperature measured by the ventilation system and that by the TESTO devices was 0.27 °C in room A and 0.24 °C in room B. This is only a small difference, and could be explained by the measurements having been made in two different places in the rooms.
3.2. Energy Use for Space Heating
The average indoor temperatures were 20.0 °C in room A and 20.1 °C in room B during the heating period. Thus, although room A used more energy for space heating, the average indoor temperature was somewhat lower in that room than in room B. However, this difference was very small—only 0.1 °C.
The temperature in the space surrounding the test rooms (room C) was most of the time a little bit warmer than inside the test rooms (see
Figure 12). This difference accounted for a total of 6589.7 degree hours for room A and 6418.5 degree hours for room B (see
Table 1). This difference was only accounted for on days when the average outdoor temperature was <19.0 °C, and ignored for days when the average outdoor temperature (
was ≥19.0 °C.
The temperature in the building surrounding the two test rooms was not always exactly the same as inside the test rooms. Therefore, there was a heat flow through the internal walls, floors, and roofs of the test rooms. Overall, the temperature in the surrounding building was somewhat higher than inside the test rooms, leading to an energy gain from the surrounding building into the test rooms:
The thermal transmittance (U) through the walls equalled
thus the heat flow (Φ) through the walls equalled
and total energy gain (dQ) was calculated as
This gave an energy gain from the surrounding building into the test rooms (see
Table 1).
Room A used 563.0 kWh for space heating while room B used 350.9 kWh. However, a correction had to be made for room B because of flaws in the heating system during the holidays. The three spikes in temperature in room B (see
Figure 12) were caused by a failure in the control schedule: Unfortunately, there was an alternative schedule in the system that started during the holidays which caused the system to heat room B continuously for the entire day during Christmas (25 and 26 December), New Year’s Day (1 January), and Epiphany (6 January). To correct this, an analysis was made of the data for these holidays: T
A and T
C. Then days with (almost) the same values for T
A and T
C were found. The values for T
B for these similar days were used instead for the above-mentioned holidays.
The correction value for room B was 24.25 kWh for space heating. In other words, room B used 24.25 kWh too much for space heating. This was space heating that was not necessary; the temperature in room B was over 27 °C at Christmas, which is much higher than what was needed. Additionally, the degree hours were affected by the flaws in the heating system. Due to the high temperatures around Christmas, the difference in degree hours between room B and the surrounding building was too low. Therefore, the values for degree hours were compensated in the same manner as for the space heating data. This produced a correction of 437.3 degree hours (6418.5 = 5981.2 + 437.3) for the holiday period.
This resulted in a total energy use per room for the heating season of 15 September–15 May as follows:
Energy use per day for the rooms as well as average outdoor temperature is shown in
Figure 13.
If the façade of room B had instead been insulated with 100 mm EPS or mineral wool insulation, the energy use would undoubtedly have further improved, with better energy efficiency than the solution with hemp-lime. However, this would have also resulted in a façade with changed hygrothermal properties. Unlike hemp-lime, modern materials such as EPS and mineral wool are not diffusion-open, and therefore do not allow moisture flows through the wall. In time, this could have led to moisture damage to a wall renovated with these materials.
The differences in energy use between rooms A and B seem to be greater at higher temperatures (see
Table 2). In the table, the outdoor temperatures were chosen at approximately 5 ºC intervals, starting at a daily mean temperature of approximately 15 °C on 26 September 2017. On this day, neither of the rooms required energy for heating. However, with a daily mean temperature of 9.7 °C on 5 October 2017, room B (0.7 kWh/day) only required 49% of the energy use for heating required by room A (1.4 kWh/day). At lower temperatures, the difference between the solutions is not as pronounced. On the 28 February 2018 with a daily mean temperature of −9.1 °C, room B (4.1 kWh/day) required 75% of the energy use for heating required by room A (5.5 kWh/day).
3.3. Thermal Transmittance of the Test Façades
It is now possible to determine the thermal transmittance (U-value) of the test façades in two different ways:
Using the material properties: thermal conductivity of the materials [W/mK] and thickness of the materials [m],
Using the energy use data [kWh/m2] for the rooms behind the façades, combined with the degree hours [ΔKh].
Both methods were used, and a comparison could be made.
(i) U-value based on material properties
At the time of the construction of the façades, a total of 10 specimens per material (lime render, hemp-lime render) were also produced. These specimens were cast in molds 100 × 100 × 100 mm by the same mason and in the same way as he had applied these materials to the walls. Also, some of the timber was saved when constructing the walls. This timber measured approximately 27 × 49 mm and was cut into specimens that were on average 86 mm long.
These materials were used to determine thermal conductivity. Material specimens were stored in a climate chamber at 20.4 ± 0.2 °C and 60.7 ± 1.1%RH prior to measuring their thermal conductivity. The specimens were stored in the climate chamber for more than a year. The thermal conductivity of the building materials was determined using a Thermal Constants Analyser (TPS1500, Hot Disk
®). Power and measurement time were adjusted to the material (see
Table 3).
For each material, a minimum of three measurements were made. For the timber, the measurements were made in the same direction as the timber was situated in the wall, which was perpendicular to the fiber direction. The measured values for thermal conductivity are shown in
Table 4.
The U-value of both façades could then be calculated, using the thickness of the materials (d) and their thermal conductivity (λ).
It was assumed that the indoor surface thermal resistance (Rin) was 0.13 m2K/W and the outdoor surface thermal resistance (Rout) was 0.04 m2K/W.
Both façades had wooden slats embedded in the (hemp-) lime render (see
Figure 6 and
Figure 7). The slats comprised approximately 12% of the rendered material. This means that 88% consisted of lime render (room A) and hemp-lime render (room B), respectively.
Thermal transmittance (U) for the façade was then determined as follows:
The thermal resistance for the lime façade could then be calculated as follows:
Additionally, the U-value of the lime façade was determined as:
The thermal transmittance for the hemp-lime façade was determined as follows;
Additionally, the U-value for the hemp-lime façade was determined as:
(ii) U-value based on energy use data
As well as determining the U-value of the façades based on their material data, it was also possible to determine the U-values based on the energy performance of the rooms, façade area, and the difference in degree hours over the façades:
Total energy loss (dQ) through the façade was
and thus
Both the energy through the façade (dQ) and the degree hours (dt) were measured values from the lab.
The thermal transmittance (U) through the walls equalled
and thus thermal transmittance could be calculated
The degree days (D) were calculated as
Thermal transmittance was calculated for the above-mentioned heating period 15 September 2017–15 May 2018. During this period, there were 3576 degree days, which equal 85,827 degree hours.
Both façades had a surface area (A) of 8.4 m2.
Room A used 653.8 kWh for space heating during the heating period and room B used 439.3 kWh.
Thermal transmittance could then be calculated as follows:
A comparison of the two methods
Comparing the thermal transmittance of the two façades before and after renovation, there is a clear difference in both cases (see
Figure 14). Looking at the calculated U-values based on material properties, there is a reduction of 43%. The U-values based on energy use data were lower in both cases than the calculated U-values. The reduction in U-values between façades A and B based on energy use data was 33% (see
Table 5).
The U-values based on actual energy use data during the heating period were lower than what was expected from their material properties.
This was a result from the first heating season (the first winter). There was still some excess moisture in the walls from the building process. The second heating season might have given a better thermal performance for both façades as they were allowed to dry further during the summer, most likely leading to better insulating properties.
3.4. Delays in Temperature Changes
Apart from their energy performance, other differences were observed between the two façades. When the outdoor temperature changed, the indoor temperatures changed as well, but not immediately. There was a thermal buffering effect that could be observed for both façades. This was most clear in late summer/early autumn, when there were relatively large diurnal differences in temperature, but no heating was required yet, or only sporadic heating took place. In September, the temperature differences between day and night were quite pronounced, but hardly any heating was required yet (see
Figure 15).
When the outdoor temperature changed, it took a while for the indoor temperature to change as well. For example, on 21 September at 01:50 am, the outdoor temperature was at its lowest at 7.6 °C. This could be observed in room A approximately 10 hours later, when the indoor temperature was at its lowest at 19.7 °C. In room B, there was a delay in temperature change compared to room A: the indoor temperature was at its lowest 11.5 hours after the outdoor temperature reached its lowest point. The lowest temperature in room B was then 20.5 °C, before it went up again. In short, the difference in delay was 1.5 hours, and the difference in indoor temperature was 0.8 °C, with room B being the warmer room.
One day later, on 22 September, the outdoor temperature was at its lowest at 7.1 °C at 07:14 in the morning. The effect of this low outdoor temperature was observed in room A only 4.5 hours later when the indoor temperature was as low as 19.0 °C, and heating was required. In room B, the temperature went down to 19.9 °C, which was at 14:20 am, approximately seven hours after the lowest outdoor temperature had occurred. In addition, in room B, no heating was required. In short, the difference in delay was 2.5 hours, and the difference in indoor temperature was 0.9 °C, with room B being the warmer room. In addition, no heating was required in room B, whereas heating started in room A when temperatures reached 19.0 °C.
In both rooms, TESTO devices (measuring temperature and relative humidity) were installed on the wall surface.
Figure 16 shows the indoor temperatures in both rooms as well as the outdoor temperature from 15 to 26 September 2017. During this period, room B did not require any energy for space heating, while room A used 1.1 kWh. Each time there was a low outdoor temperature, the temperature in room A decreased sooner than in room B. During this 11 day period, room B had a slightly higher indoor temperature than room A: 20.3 °C compared to 20.0 °C, even though room A required some energy for space heating.
During the summer months, no energy use was required for space heating. At higher outdoor temperatures, the indoor temperature in room A was consistently a little bit higher than in room B (see
Figure 17). Also, at lower outdoor temperatures the temperature in room A was a little bit lower than in room B. In other words, the diurnal temperature variation had a larger impact on room A. This same phenomenon could be observed at even higher temperatures, when outdoor temperatures reached over 30 °C (see
Figure 18).
Analyzing the peak-to-peak amplitudes during these two time periods, there is a difference between the two rooms of 0.8 °C in May and 0.7 °C in August (see
Table 6). This indicates that the indoor temperature in room B is more stable, with smaller temperature fluctuations, than in room A.
4. Conclusions
The aim of this paper was to investigate whether hemp-lime could be used to improve the energy efficiency of historic timber buildings in Sweden. The results showed that a 33% reduction in energy use could be achieved in an in-situ situation. This was accomplished without changing the framework, appearance, or material of the render and without drastically changing the hygric properties of the façade. The thickness of the wall was altered within reasonable limits: 10 mm was added to the wall thickness. Ultimately, the only alteration made was changing the lime render to a hemp-lime render.
Not only did the renovation lead to a reduction in energy demands for space heating, it also created a more stable indoor climate, with smaller fluctuations in indoor temperature.
Furthermore, a discrepancy was found between the calculated U-value based on material properties and the U-value based on energy use data. This indicates that when performing energy use calculations, more factors than thermal conductivity and thickness of the material need to be taken into account.
From a heritage values point of view, the use of hemp-lime allowed for the preservation of the underlying timber structure. Even the wooden slats were able to be preserved. Usually, these wooden slats are removed during renovation projects using insulation materials such as EPS or mineral wool, as they get in the way when applying insulation sheets. However, when using hemp-lime, it was found to be advantageous to keep the historical wooden slats on which the previous render had been applied. The application technique by which the render consisting of hemp shiv, lime, and water is cast onto the timber structure allows for the mason to decide the thickness, roughness and shape of the surface, which means the character of the historical façade can be maintained. A renovation can be accomplished without damaging the timber structure or wooden slats, and it can be done using local traditional materials and building methods with no difference in appearance to a traditional lime render. This helps preserve heritage values and adapts the structure to newer requirements with both increased comfort and less energy use.


