Transmit signals that pass through the additive white Gaussian noise (AWGN) channels go through a demodulation process. Moreover, an amount of FTN interference is removed through the BCJR equalizer. After de-interleaving, reordered signals arranged by the UEP algorithm are inputted into the LDPC decoder. The iterative turbo equalizer consists of inner codes and outer codes, and we the BCJR is employed as an outer code and the LDPC code as an inner code. At the receiver side, powerful turbo equalization algorithms that iteratively exchange probabilistic information between the inner decoder and outer decoder are used, thereby reducing the error rates significantly. The inner coded bits are then subtracted from the input and interleaved. The interleaved output is canceled a posteriori from the proceeding received signal. Thus, the algorithm enhances the performance, while maintaining or improving the transmission efficiency of the existing FTN transmission method.
3.1. UEP Setting Algorithm for the HSS-Based LDPC Decoding Method
For the UEP-based FTN signals to be generated, it is necessary to divide encoded bits using the priority algorithm and to allot different FTN interference ratios accordingly. In this process, the priority algorithm determines the importance of each bit. In this section, we explain the HSS-based LDPC decoding algorithm briefly and how to apply it to the UEP setting algorithm. The
LDPC code is defined based on a sparse parity-check matrix,
, where
bit nodes and
check nodes are connected by edges. In the
matrix, the bit nodes/check nodes are mapped to the columns/rows, where one element in a row is connected to another in a column by an edge. Bit nodes consist of information and parity bit nodes, while information bit nodes are connected by edges with check nodes by features of the matrix,
. The LDPC codes are shown in the small example (6, 3), shown in
Figure 4.
Figure 4b is a Tanner graph, which can be deduced from the parity-check matrix of
Figure 4a. In
Figure 4b, each bit is represented by a bit node (shown as a circle), and each check is represented by a check node (shown as a square). An edge exists between the bit node,
, and the check node,
, and only if
. The LDPC decoder performs an iterative exchange between the bit nodes and the check nodes, until the maximum number of iterations has been reached. The decoding algorithm produces the probabilities of each bit being “0” or “1” for every iteration. These probabilities are used in the log likelihood ratio (LLR) and are computed in the following way:
The Tanner graph of the (6, 3) LDPC code, as shown in
Figure 5, is an example to explain the HSS decoding process.
Each bit node updates all edges of
, which are linked from the
check node to the
bit node,
. The final decision on a bit is taken at the end of the decoding process by computing the sign of the local a posteriori log density ratio:
where
means the number of edges linked to the
bit node. In Equation (8), as shown in
Figure 5a, if
is 1,
is equal to 1 and 3. Depending on whether
is positive or negative, the bit,
, is considered as a “0” or “1”. As shown in
Figure 5, the process of updating a check node and bit node is defined from Step 1 to Step 3. Computing the probability of edge,
, which is linked from the
check node to the
bit node for a degree,
, is as follows Equation (9):
where
denotes the number of edges linked to the check node.
is the probability of the edge, which is linked from the
bit node to the
check node, and
is the index of the bit node group, which is linked to the check node,
. The
operator is defined as follows:
The edge,
, is updated for a degree,
, which can be expressed as follows (Equation (12)):
where
denotes the number of edges linked to the
bit node.
is the index of the check node group, which is linked to the bit node,
.
In the conventional LDPC decoding process, the
coming out of the check node is updated using Equations (9)–(11). Then, all
messages coming out of the bit nodes linked to this check node are updated with Equation (12). In the
iteration, the update of the bit node is based only on messages updated in the
iteration. However, in the HSS-based LDPC decoding process, the already updated bit node and check node in the
iteration move to a different bit and check node. As an example, in
Figure 5,
was already updated two times, before being processed by the third check node. This higher update frequency per iteration allows the decoder to converge faster, because there are fewer iterations.
The HSS-based LDPC decoding algorithm, proposed in [
15,
16], is used to accelerate the LDPC decoding speed, because it needs fewer iterations to maintain the same performance. However, in this study, it was used to configure the priority algorithm. In deciding which group has the higher priority, the HSS-based LDPC decoding algorithm, which is explained above, was applied. Unlike conventional LDPC decoding processing, which calculates bit nodes’ and check nodes’ updating sequentially based only on messages updated in the previous iteration, in the HSS-based LDPC decoding process, the already updated bit node and check node in the same iteration move to a different bit and check node. Therefore, the bit node groups linked to the check nodes, which are arranged on the left, are assigned a higher priority. For example, as shown in
Figure 5, the bit node group, which is linked to the first check node in Step 1, is the most important bit group. By classifying the group depending on the importance of the encoded bits, based on the decoding process, the UEP algorithm applies different FTN interference ratios according to the importance of the encoded bits, and improves the performance in the same overall interference to a higher degree than the conventional FTN method.
Figure 6 shows the arrangement of the bit node and check node groups for the priority algorithm of the UEP setup.
and
mean the number of check node groups and bit node groups, respectively.
In the half rate LDPC codes in the Digital Video Broadcasting-Satellite-Second Generation (DVB-S2) standard with N = 64,800, the number of check nodes is 32,400 and one check node group has 360 data, therefore,
= 90. Additionally, the number of bit nodes is 64,800 and one bit node group has 360 data, therefore,
= 180. In
Figure 6, the left part shows the sequence of bit nodes, transmitted in the conventional way. For instance, without the UEP setting, signals are transmitted in the order from the 1st bit node group to the 180th bit node group (see the left part of
Figure 6). However, we rearranged the bit node group linked to the check node group, which was calculated in advance (see the right part of
Figure 6). For example, the 26, 27, 30, 36, 74, 90, and 179th bit node groups, linked to the first check node group, should have a high priority. The priority algorithm set the priority of the bit node group, linked with the 1st to 90th check node group. Hence, as shown in the right part of
Figure 6, it is necessary to rearrange the bit nodes to be transmitted firstly according to the HSS-based LDPC decoding process of the priority algorithm.
For instance, with no UEP setting, signals are transmitted in the order from the 1st bit node group to the 180th bit node group. If the priority algorithm configures and sends the UEP setting, the 26th bit node group, connected to the 1st check node group, is transmitted instead of the 1st bit node group, as shown in the right part of
Figure 6. Thus, the priority algorithm for the UEP setting determines the priority of groups and arranges them according to the positions of the bit node groups connected to the check node groups in the H matrix of the code rates to be transmitted.
3.2. Reordering According to Priority Settings
Figure 7 shows the composition of the encoded bits, according to their priority. As explained in
Section 3.1, we reordered the LDPC-coded bits, from high priority to low priority, from the right part of
Figure 6 to the left part. For example, the 26th bit node group of the 360 coded bits were firstly rearranged in the form of
Figure 7.
is the number of different FTN interference rates, used to perform the UEP setups by applying a priority algorithm for the groups. For example, N = 64,800 LDPC coded bits, supposing , and each group, , has 16,200 coded data.
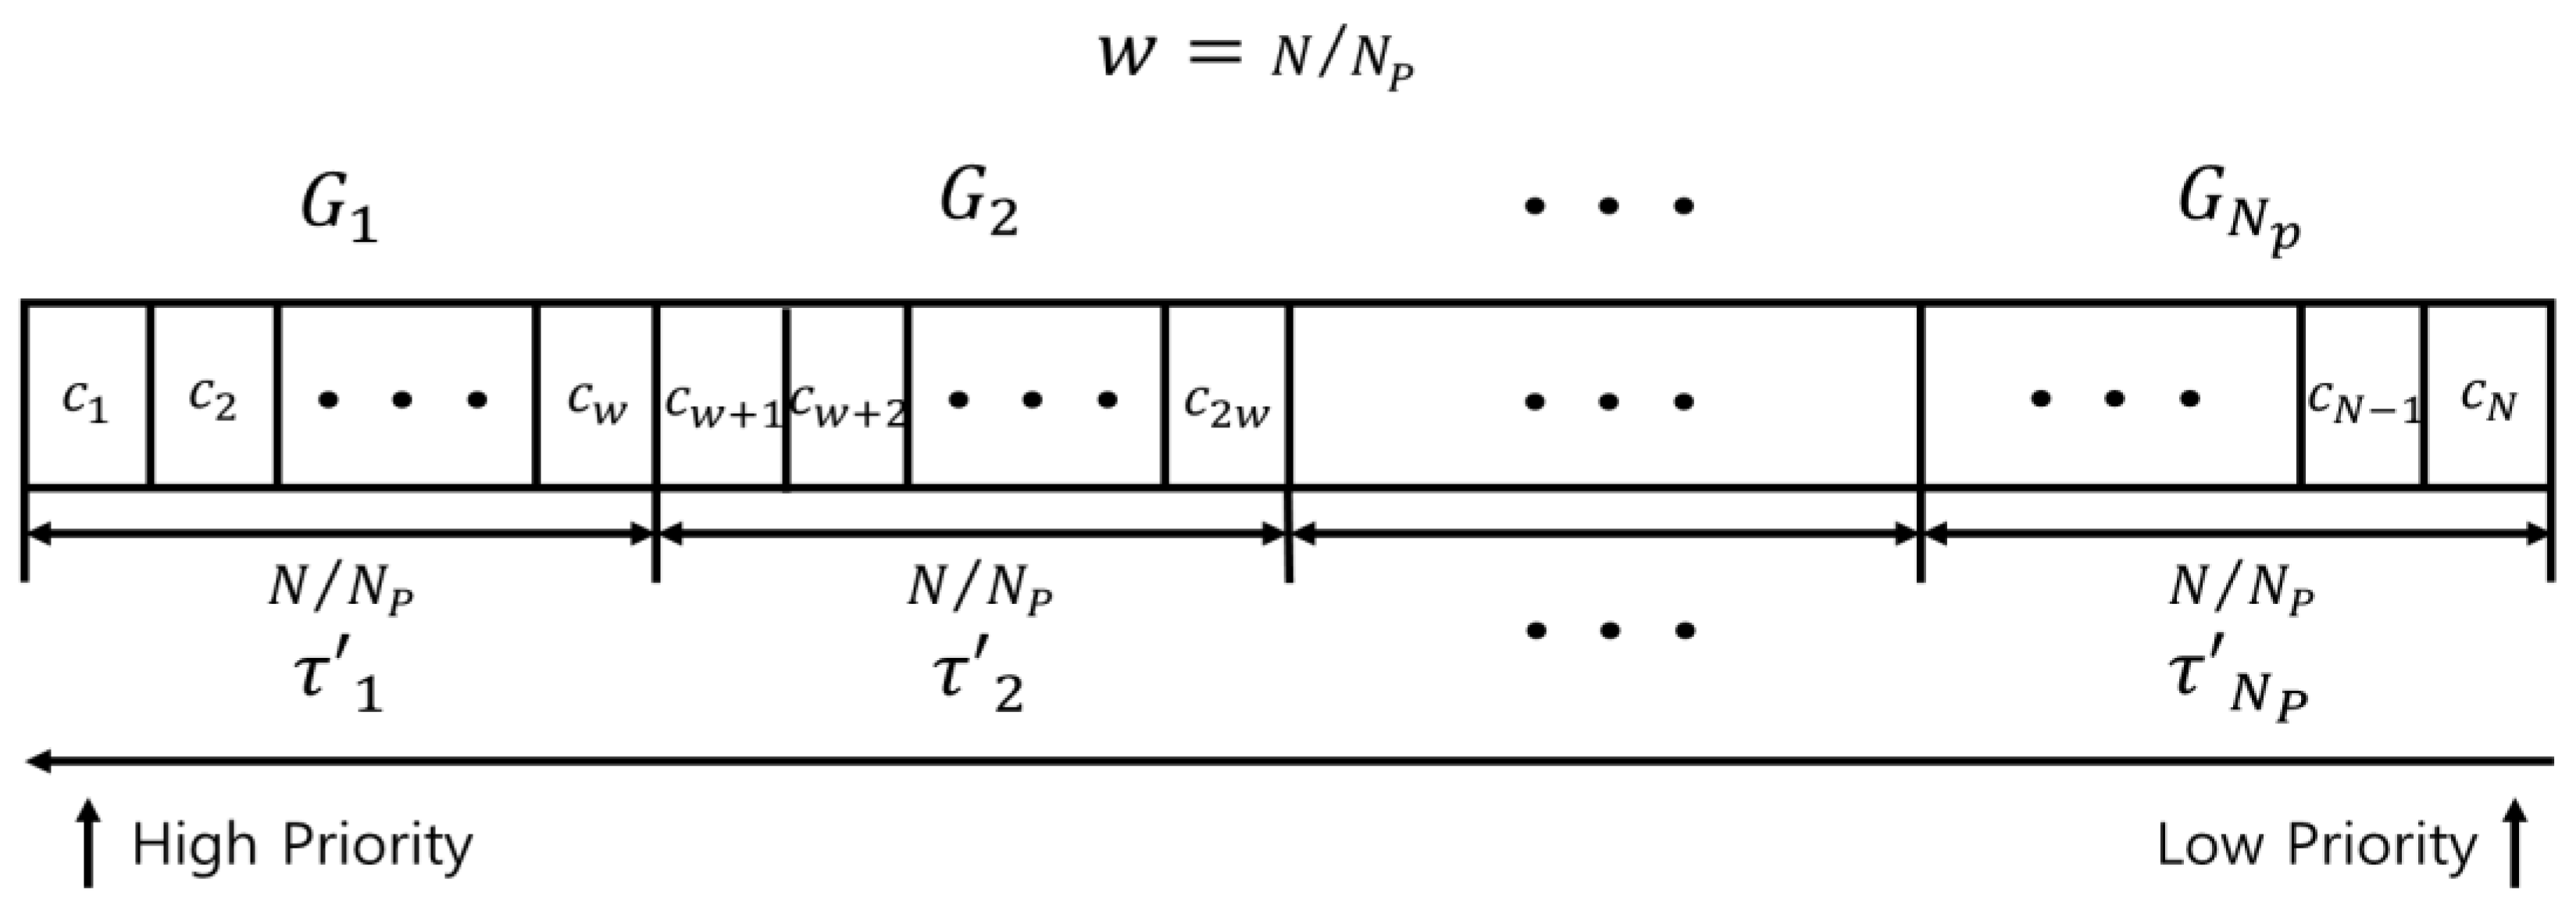
For high-priority bit groups, the FTN interference ratio needs to be set to low, as this can enhance the performance, because the number of repetitions between the bit node and check node updating processes is high during decoding. For low-priority bit groups, the FTN interference ratio needs to be set to high, because the number of bit node and check node updating repetitions is relatively small. High and low priorities indicate the level of importance of the transmitted signals, and each group of transmitted signals have different FTN interference ratios, based on the priority. A transmitting signal is generated by setting the FTN interference rate in each group differently. The average of for different interference ratios is set to be the same as that in the conventional FTN transmission methods. Thus, the algorithm enhances the performance, while maintaining or improving the transmission efficiency of the conventional FTN transmission method.
3.3. Simulation Results
The performance of the proposed FTN-based UEP method and that of the conventional FTN method were compared through simulation. The simulation was performed using the Visual C++ language on a PC. The LDPC encoder employed K = 32,400 as the size of the source bit, N = 64,800 as the size of coded bits, and R = 1/2 as the rate of encoding. The square root raised cosine (SRRC) filter, with a roll-off factor of 0.35 as defined by the DVB-S2 standard, was used. The performance was compared by setting the FTN interference rate to 20%, 30%, and 40.0%.
The UEP setting was configured based on the number of interference ratios,
. Fixed on the LDPC coding parameters, shown in
Table 1, in order to achieve the performance improvement effect of the UEP algorithm, the different interference ratios for the UEP setting were configured, and the average interference ratios were set to 20%, 30%, or 40%. The UEP-based FTN transmission method was applied. To compare the conventional FTN algorithm, with the same interference ratio applied to all groups, we performed a BER performance analysis according to the different interference ratios allotted for the priority group, as shown in
Table 2.
To investigate which cases are more efficient for the UEP-FTN algorithm, various cases were compared in a simulation: Large interference ratio differences were assigned between groups, and groups were assigned either high or low interference ratios.
The average of the interference ratio is set to 20% in
Table 2. Type 1 and type 2 are the cases in which the difference in the interference ratio between each group was set to low. Type 3 and type 4 are the cases in which the difference in the interference ratio between each group was set to high. In addition, type 1 and type 3 are cases in which the high interference ratios were set in the high-priority group. Type 2 and type 4 are cases in which the high interference ratios were set in the low-priority group. The BER performance of the four types is shown in
Figure 8.
The simulation result shows that the performance was improved in type 4 and type 2, where the range of the interference ratio was set to high, and a low interference ratio was applied to the high-priority group. Type 4 has the best performance compared to the other types. Furthermore, when a high interference ratio was applied to the high-priority group, as in type 1 and type 3, the performance was the same as that of the conventional FTN. Thus, we confirmed that the low interference ratio should be applied to the high-priority group, as in type 4, and the difference in the interference ratios between groups needs to be large.
Based on type 2 and type 4, a simulation was conducted, with the interference of the FTN transmission method set to 30% and 40%. The interference ratio of each priority group was set, as in
Table 3 and
Table 4.
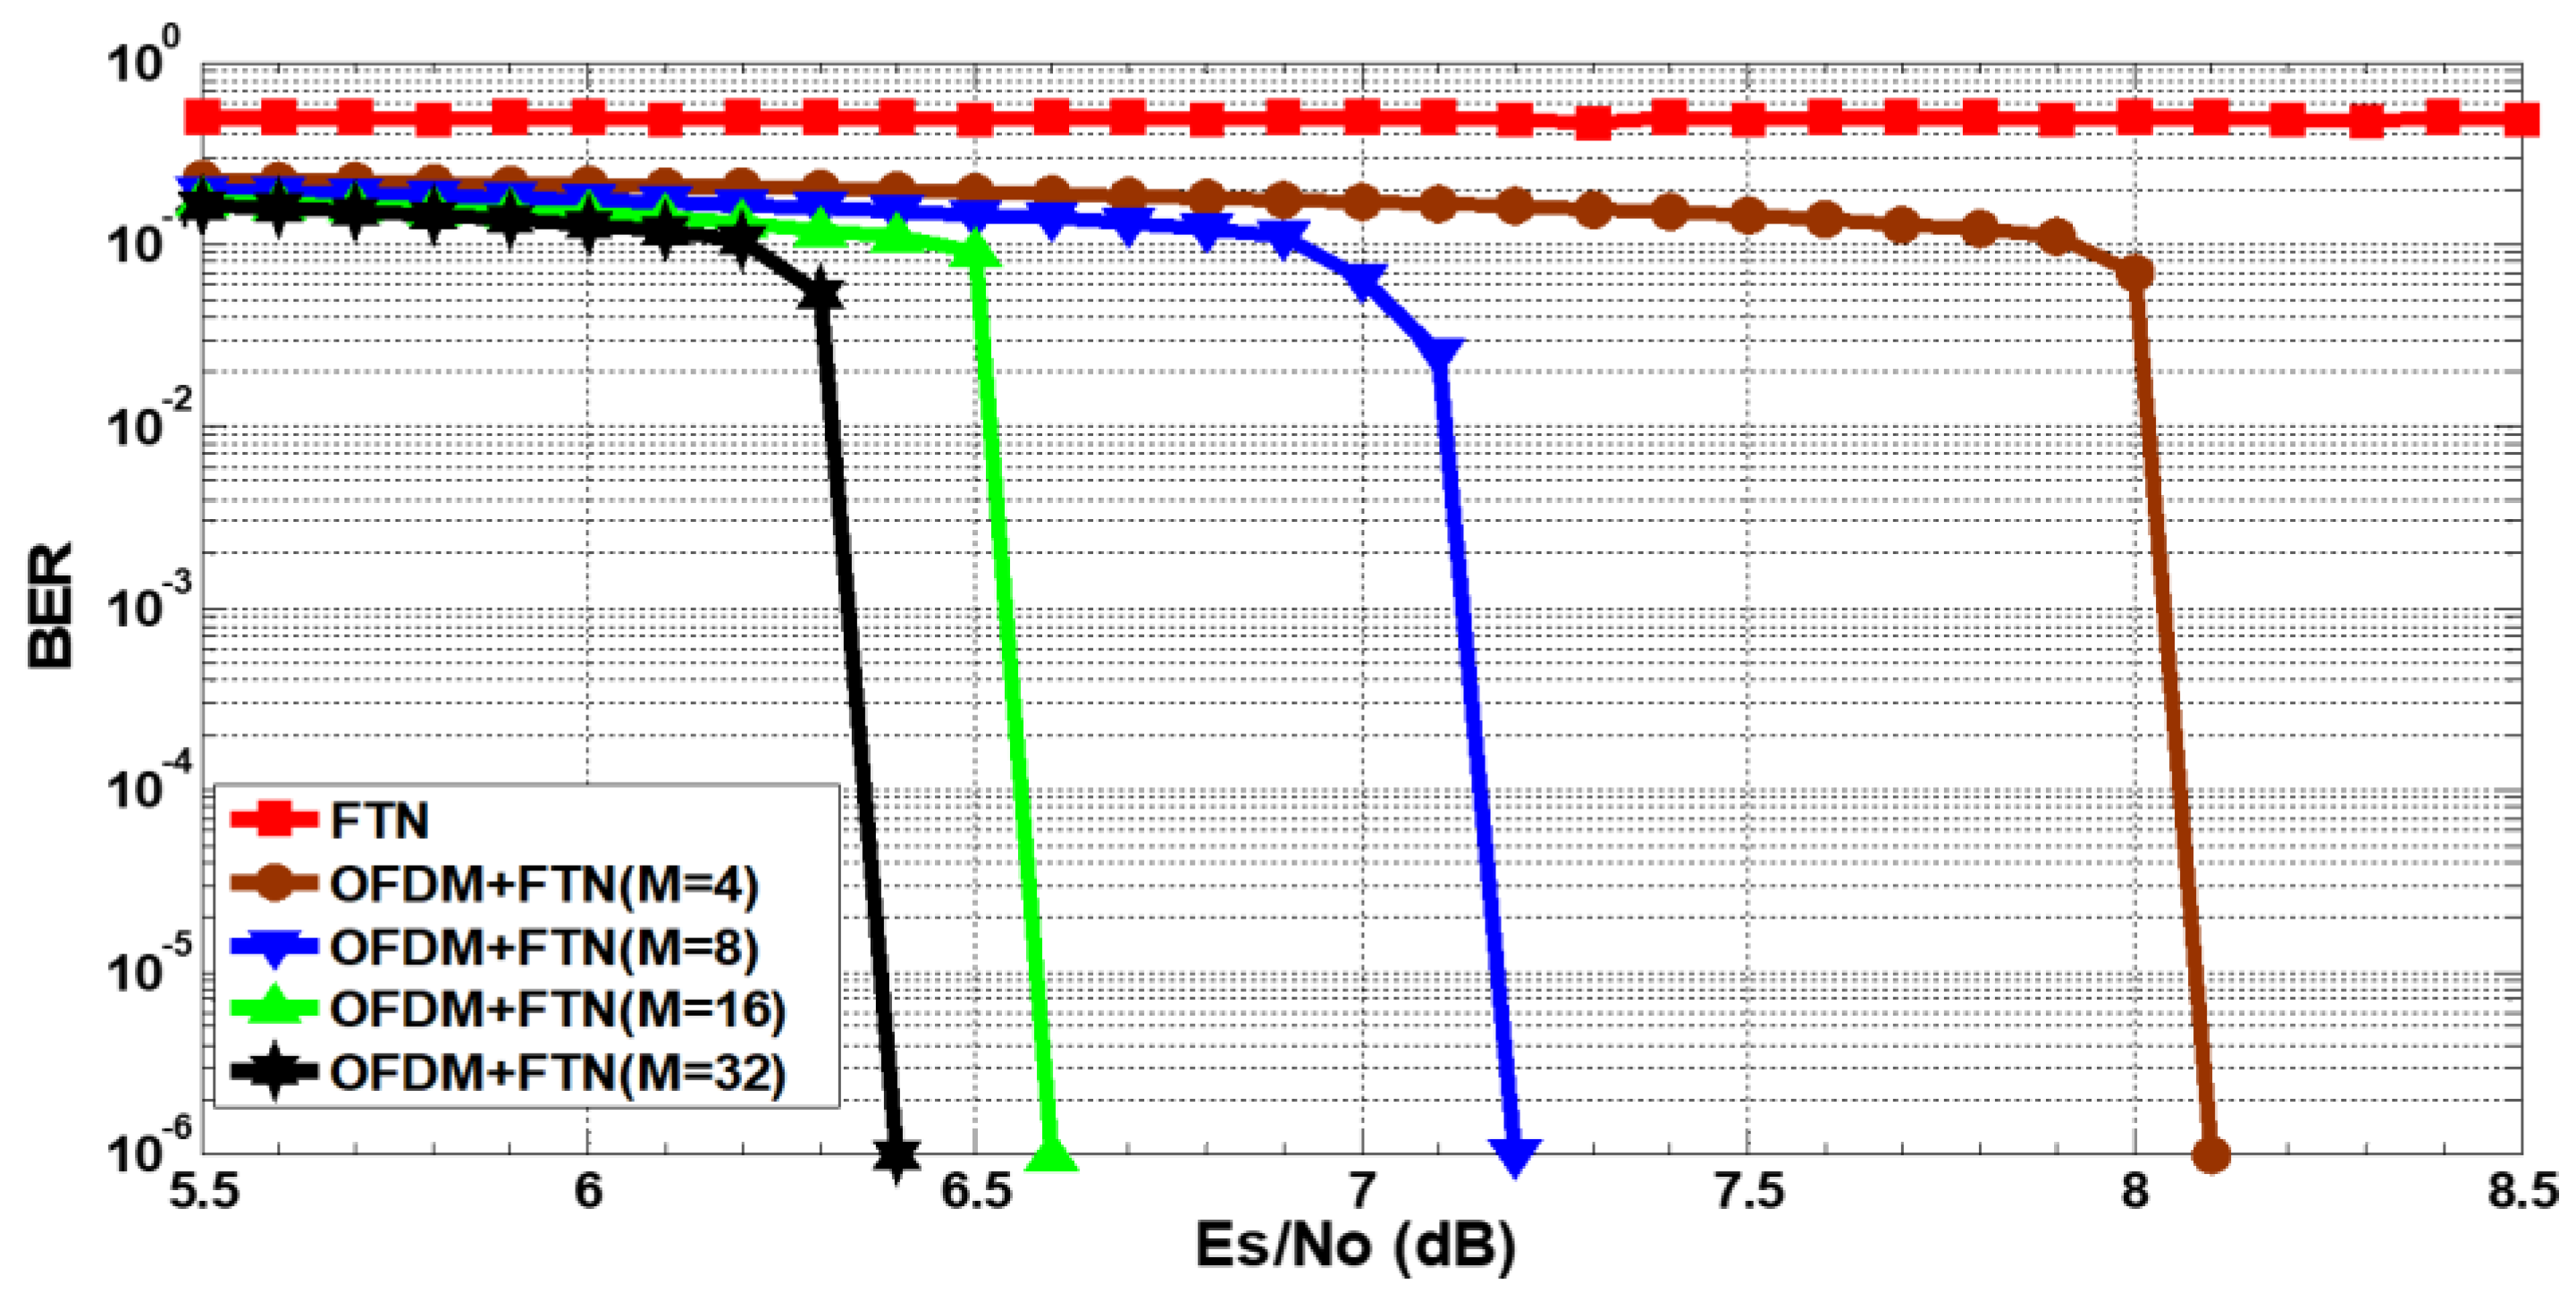
In
Figure 9 and
Figure 10, the red BER curves represent the performance, with the interference ratio set at 30% and 40% in the FTN, without UEP. Compared to FTN without UEP at the BER of
, it was demonstrated, in the simulation, that the performance improved by 0.1 dB at BER =
in type 2, where the range of the FTN interference ratio between groups was set to low in the UEP-FTN algorithm. In addition, it was shown that the performance improved by 0.2 dB and 0.3 dB in the case of an average interference ratio of 30% and 40%, respectively, in type 4, where the range of the FTN interference ratios between groups was set to high. The simulation demonstrated that the most excellent performance was obtained in type 4, where the range of the interference ratios for each group was set to high through each priority algorithm, and the low interference ratio was applied to the high-priority group.
These results can be interpreted as follows. First, the reason why the range of the interference ratios was set to high was because the difference in the branch metric allocated to each trellis became larger, allowing the BCJR decoder to operate efficiently. Second, applying the low interference ratios was applied to the high-priority signal in order to enhance the reliability of the transmitted signal, the LDPC decoder can update the highly reliable data by the calculation of the bit node and check node updating. Through this process, the performance can eventually be improved.
The simulation result shows that the UEP-based FTN transmission method, with the applied priority algorithm, demonstrated a better performance than the conventional FTN transmission method.


